- Headlines
- Chart of the Day
- United States
- Europe
- Asia-Pacific
- Emerging Markets ex China
- Equities
- Fixed Income
- FX
Headlines
- President Trump signaled a significantly tougher stance on international trade by announcing that new trade offers will be sent to multiple countries with strict "take it or leave it" terms, limiting negotiation flexibility and raising the risk of renewed trade tensions.
- Middle East geopolitical risk escalated after confirmation that U.S. Embassy personnel in Baghdad have been authorized to leave and reports emerged that Israel is considering military action against Iran with U.S. logistical support, heightening uncertainty for global markets.
Chart of the Day
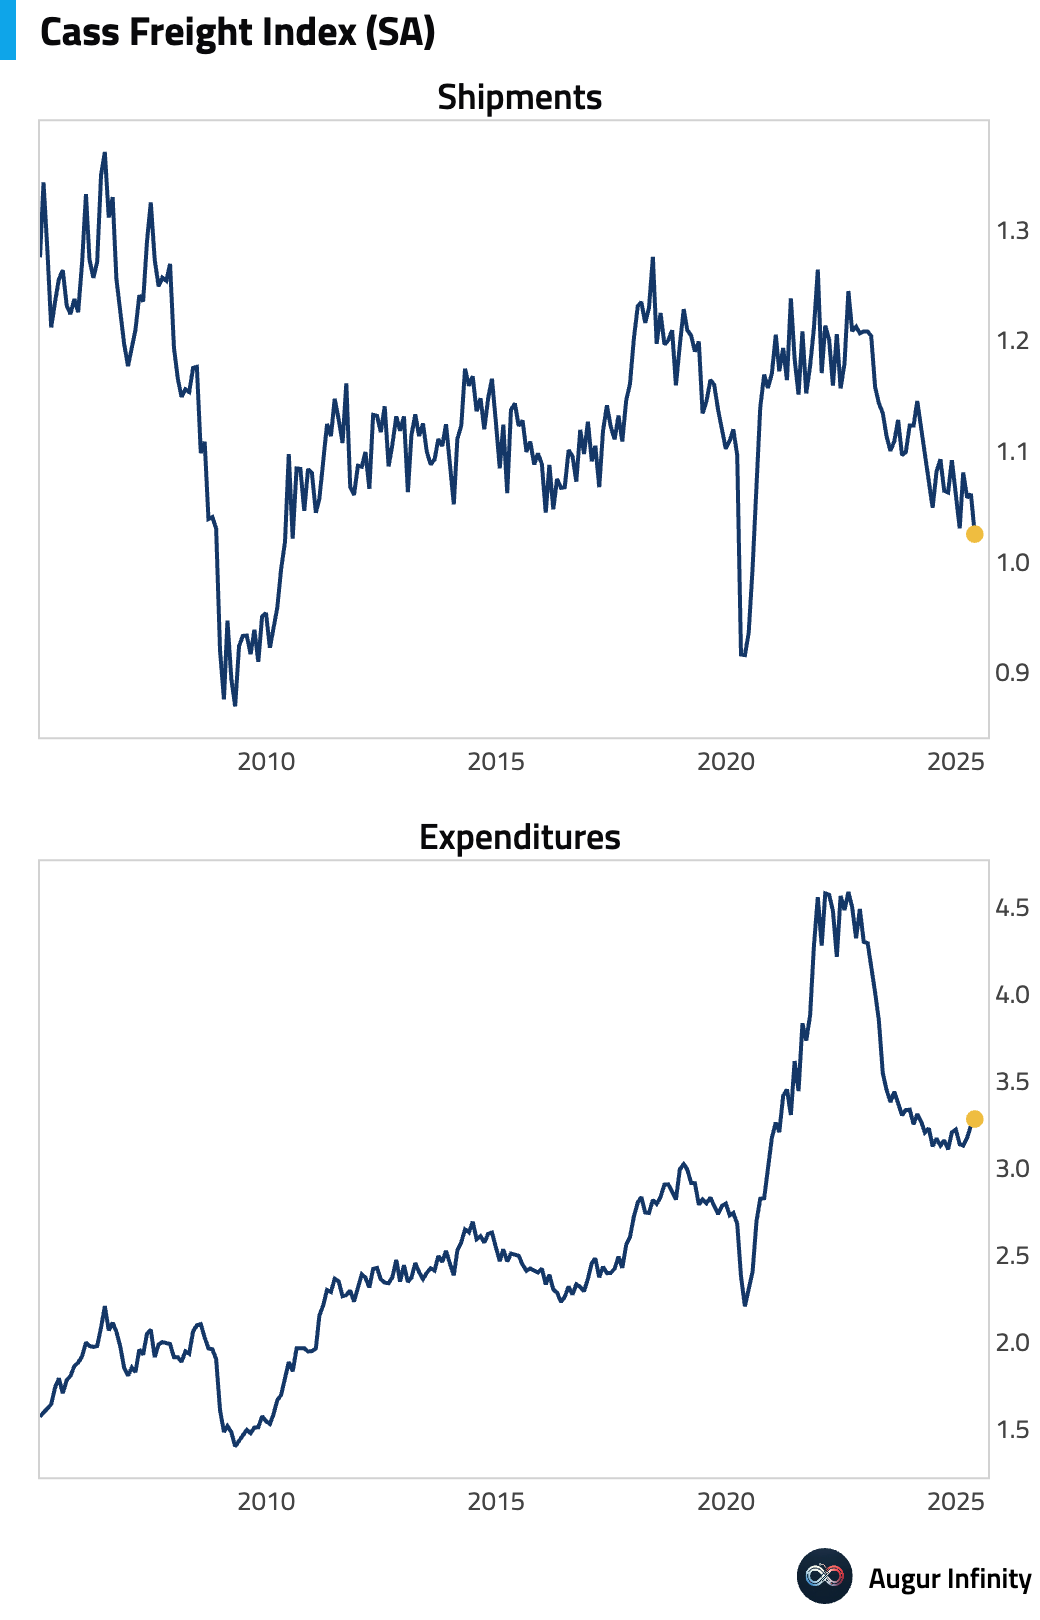
- According to Cass Freight Indices, Shipment declined 3.4% M/M in May (seasonally-adjusted), while Expenditure rose by 1.4% M/M due to rising freight cost.
United States
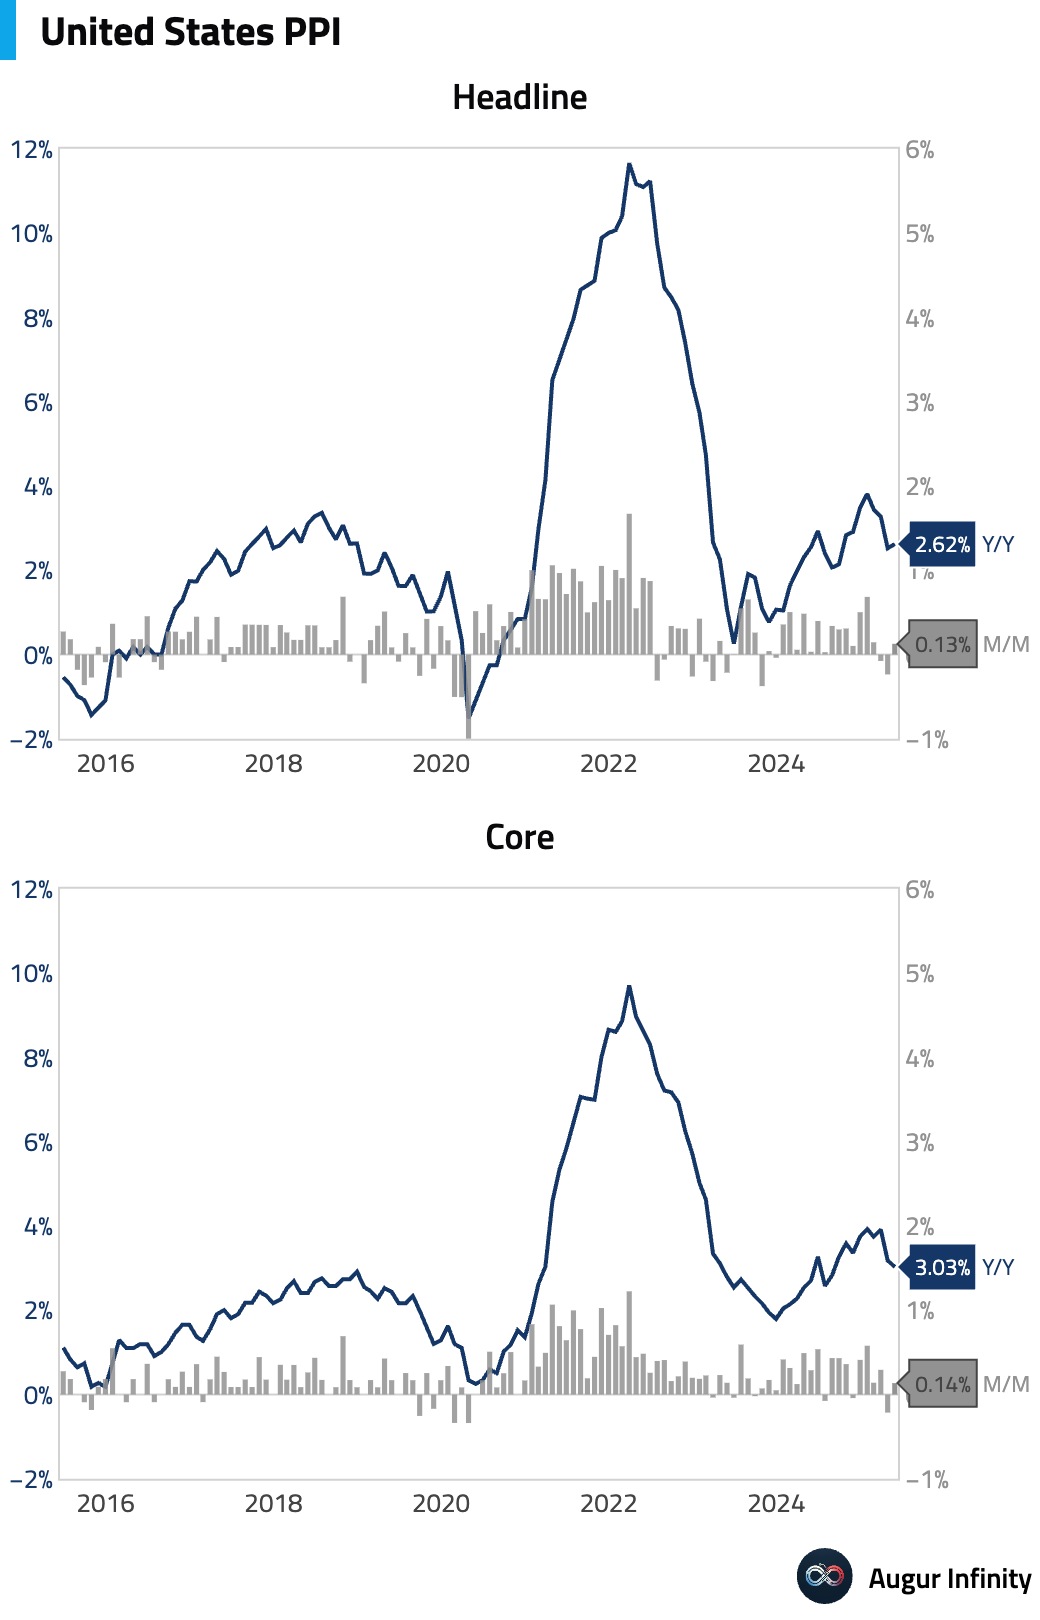
- The Producer Price Index (PPI) for May showed moderating inflation, rising 0.1% M/M, below the 0.2% consensus. Core PPI also rose 0.1% M/M, less than the expected 0.3% increase. On a year-over-year basis, headline PPI was 2.6%, in line with estimates, while core PPI slowed to 3.0% Y/Y from 3.2%, cooler than expectations of 3.1%. The disinflationary signal was broad-based, with energy prices flat and food prices up just 0.1%. Downward pressure came from a 1.0% drop in the portfolio management component. Based on the PPI and CPI reports, the core PCE price index is now estimated to have risen just 0.14% in May, which would lower the annual rate to approximately 2.58%.
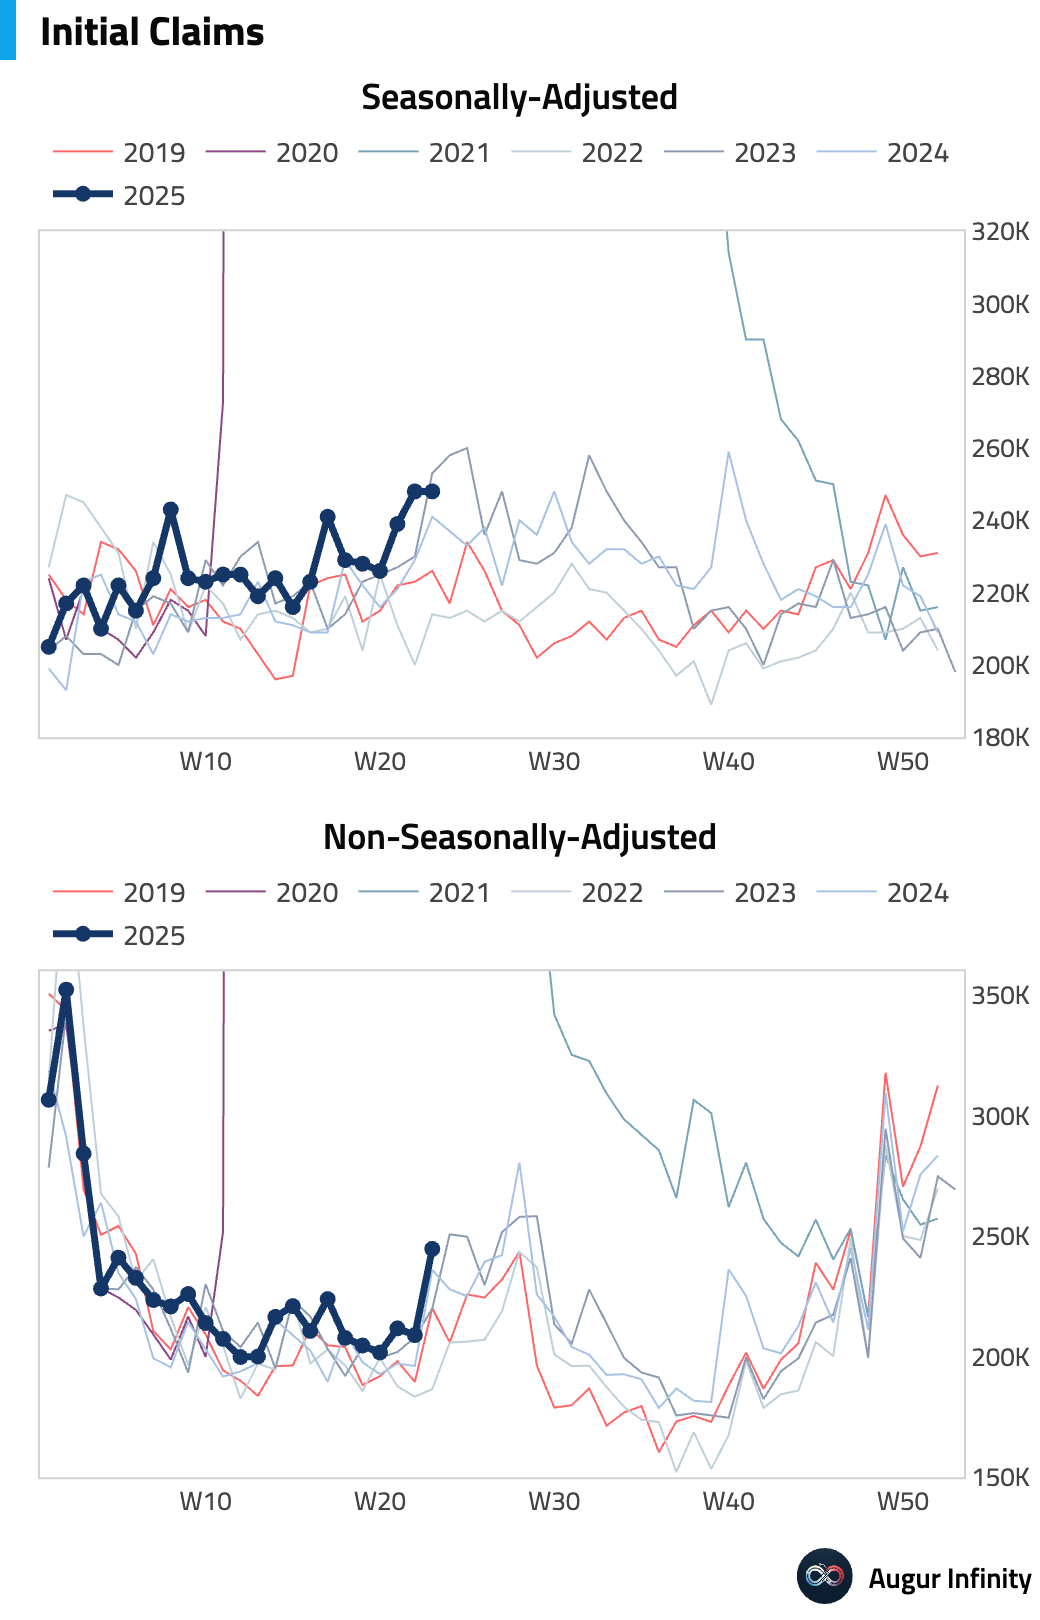
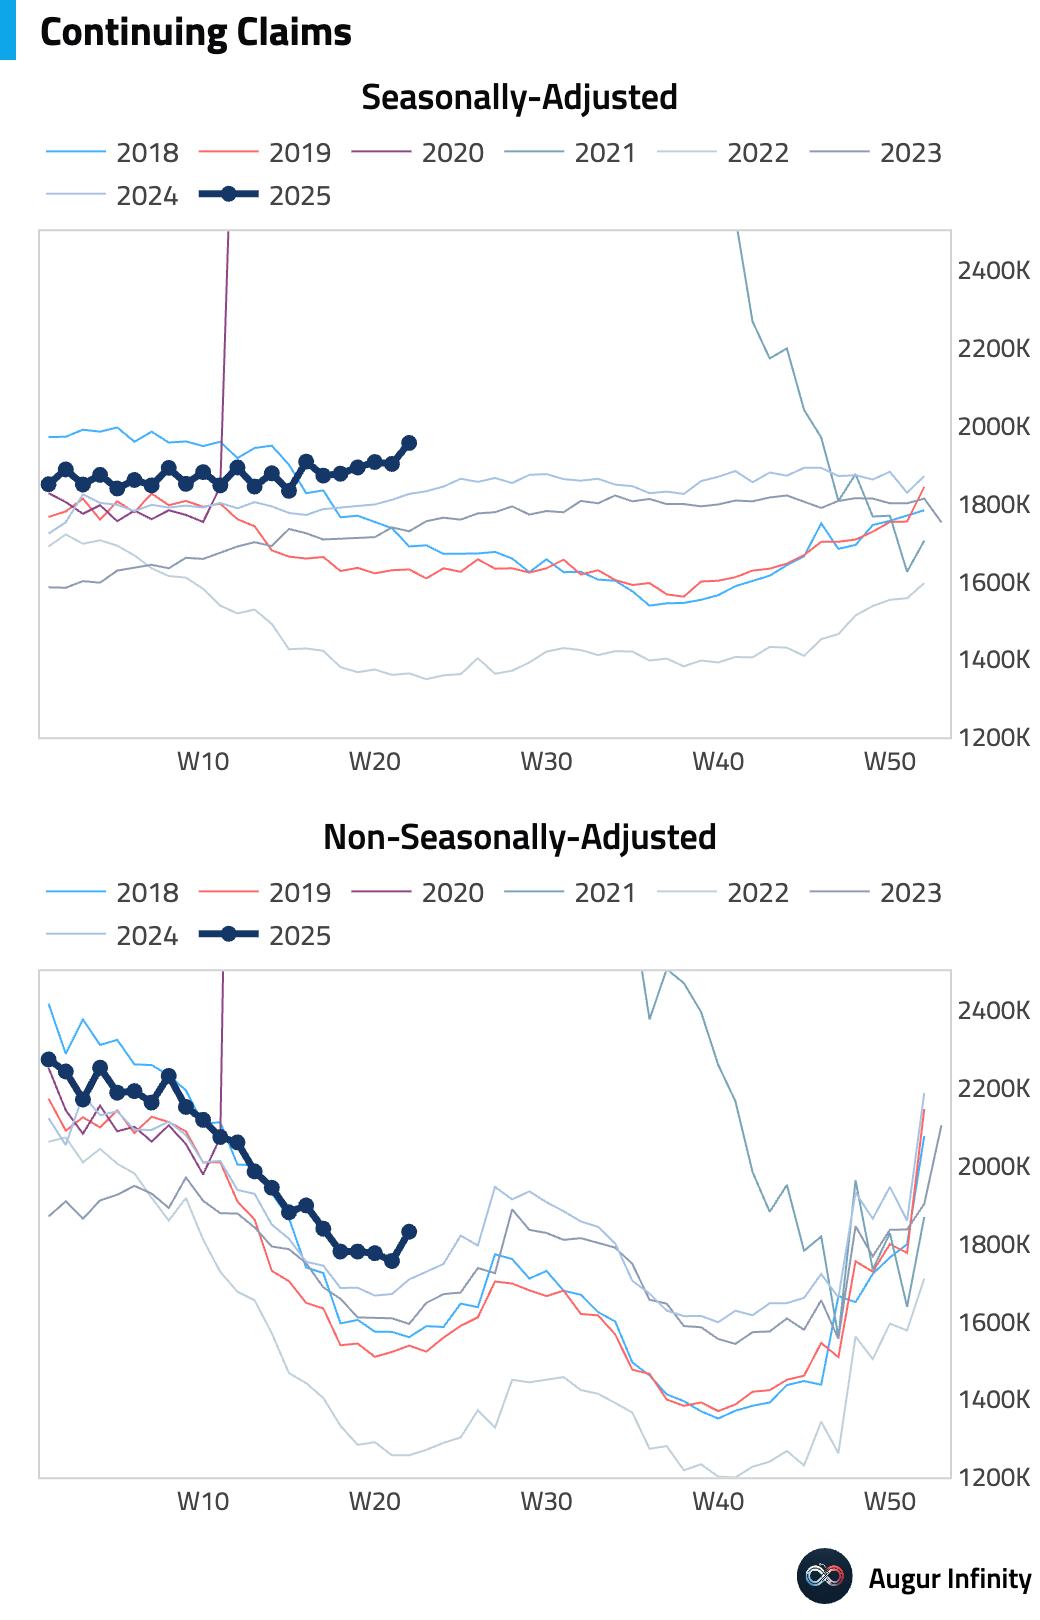
- Jobless claims data indicated some softening in the labor market. Initial jobless claims were unchanged at 248,000 for the week ended June 7, slightly above consensus. More significantly, continuing claims for the week ended May 31 rose by 54,000 to 1,956,000, surpassing forecasts and reaching their highest level since November 2021. The four-week moving average of initial claims also ticked up to its highest point since August 2023. While data can be volatile around the Memorial Day holiday, the trend suggests some easing in labor market tightness.
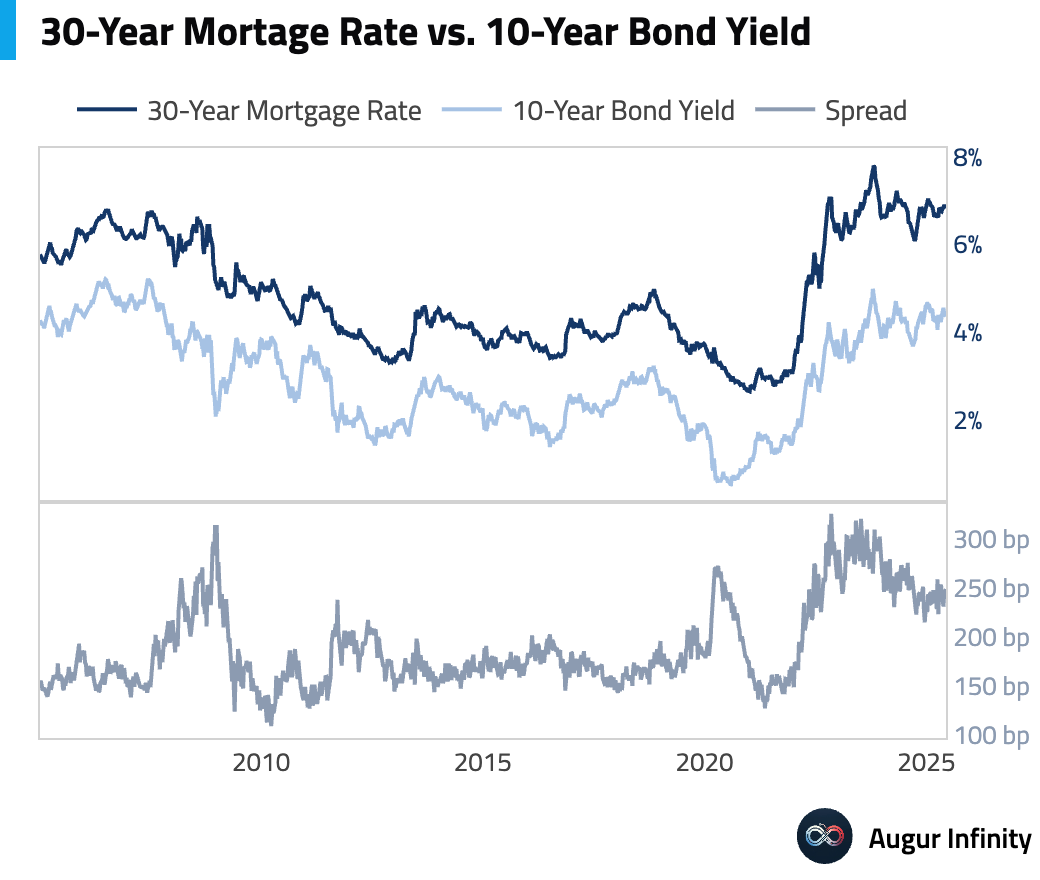
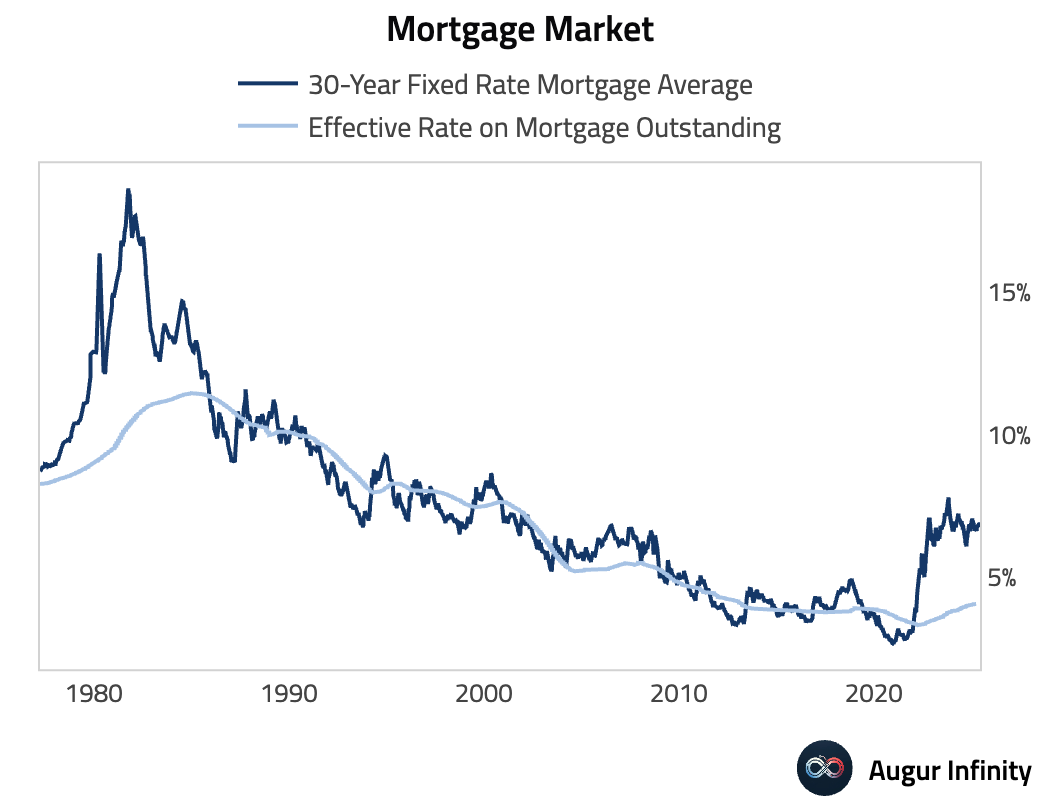
- Mortgage rates declined for the week ending June 12. The average 30-year fixed-rate mortgage fell to 6.84% from 6.85%, and the 15-year rate decreased to 5.97% from 5.99%, providing minor relief for the housing market.
Europe
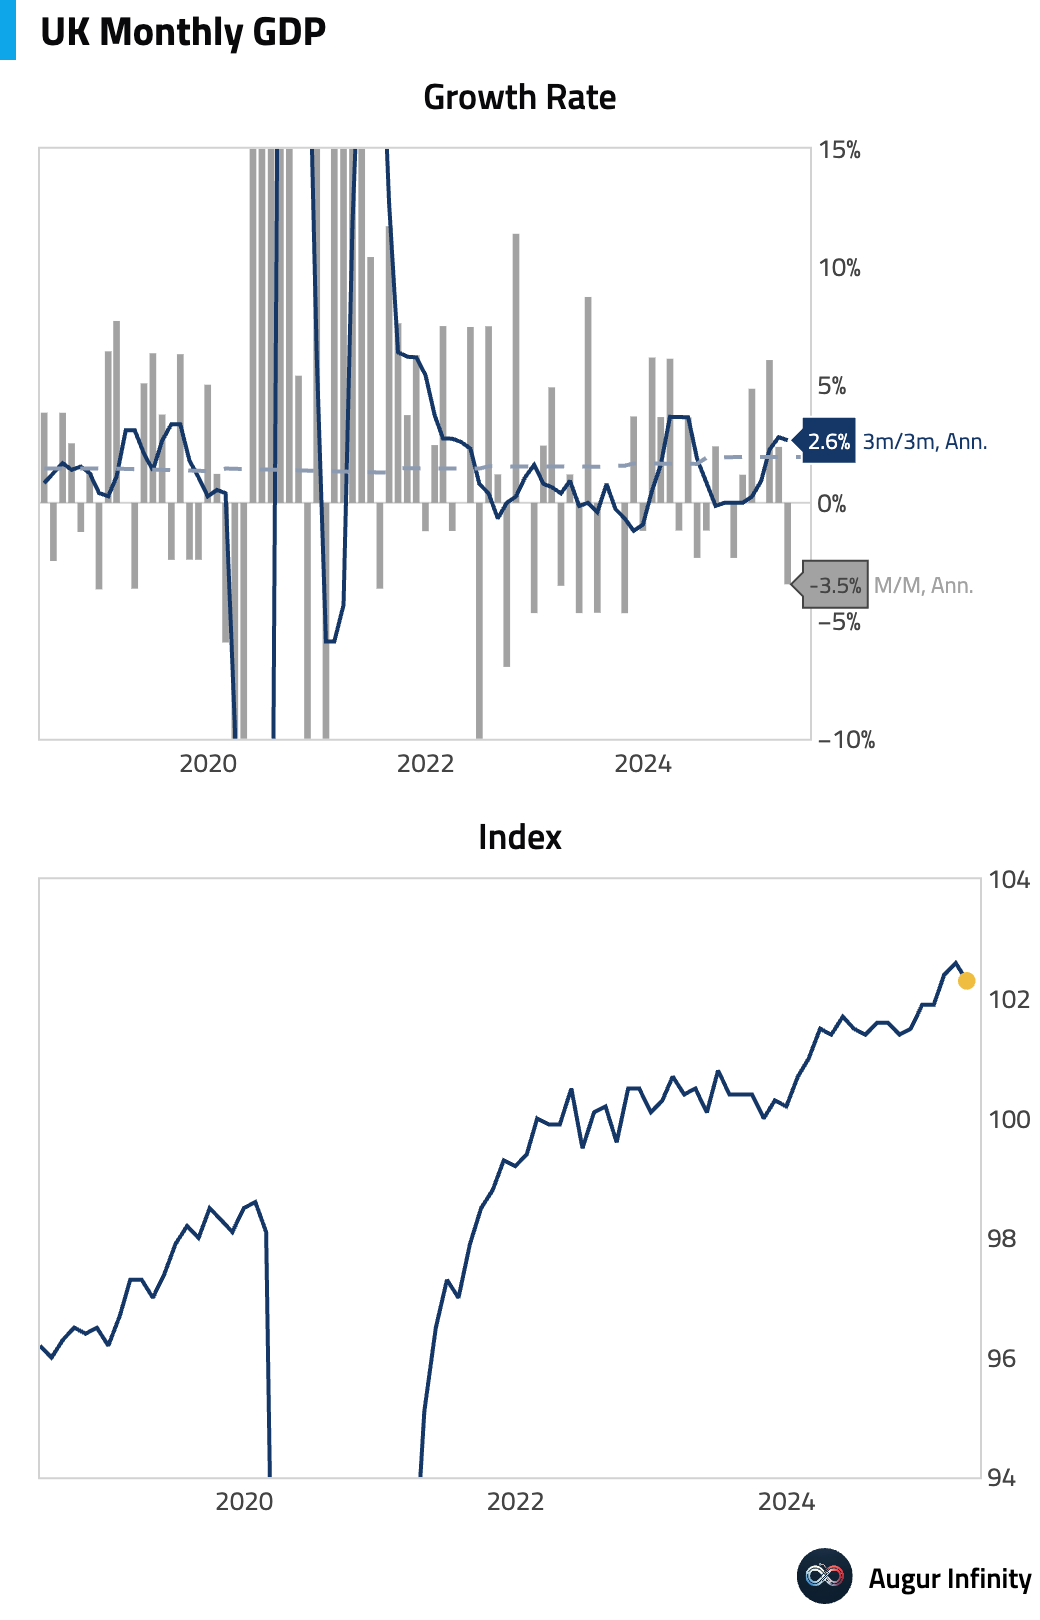
- The UK economy contracted by 0.3% M/M in April, a significant miss against the consensus forecast of a 0.1% decline and a reversal from the 0.2% growth in March. This marks the weakest monthly GDP reading since October 2023. On a year-over-year basis, GDP growth slowed to 0.9% from 1.1%.
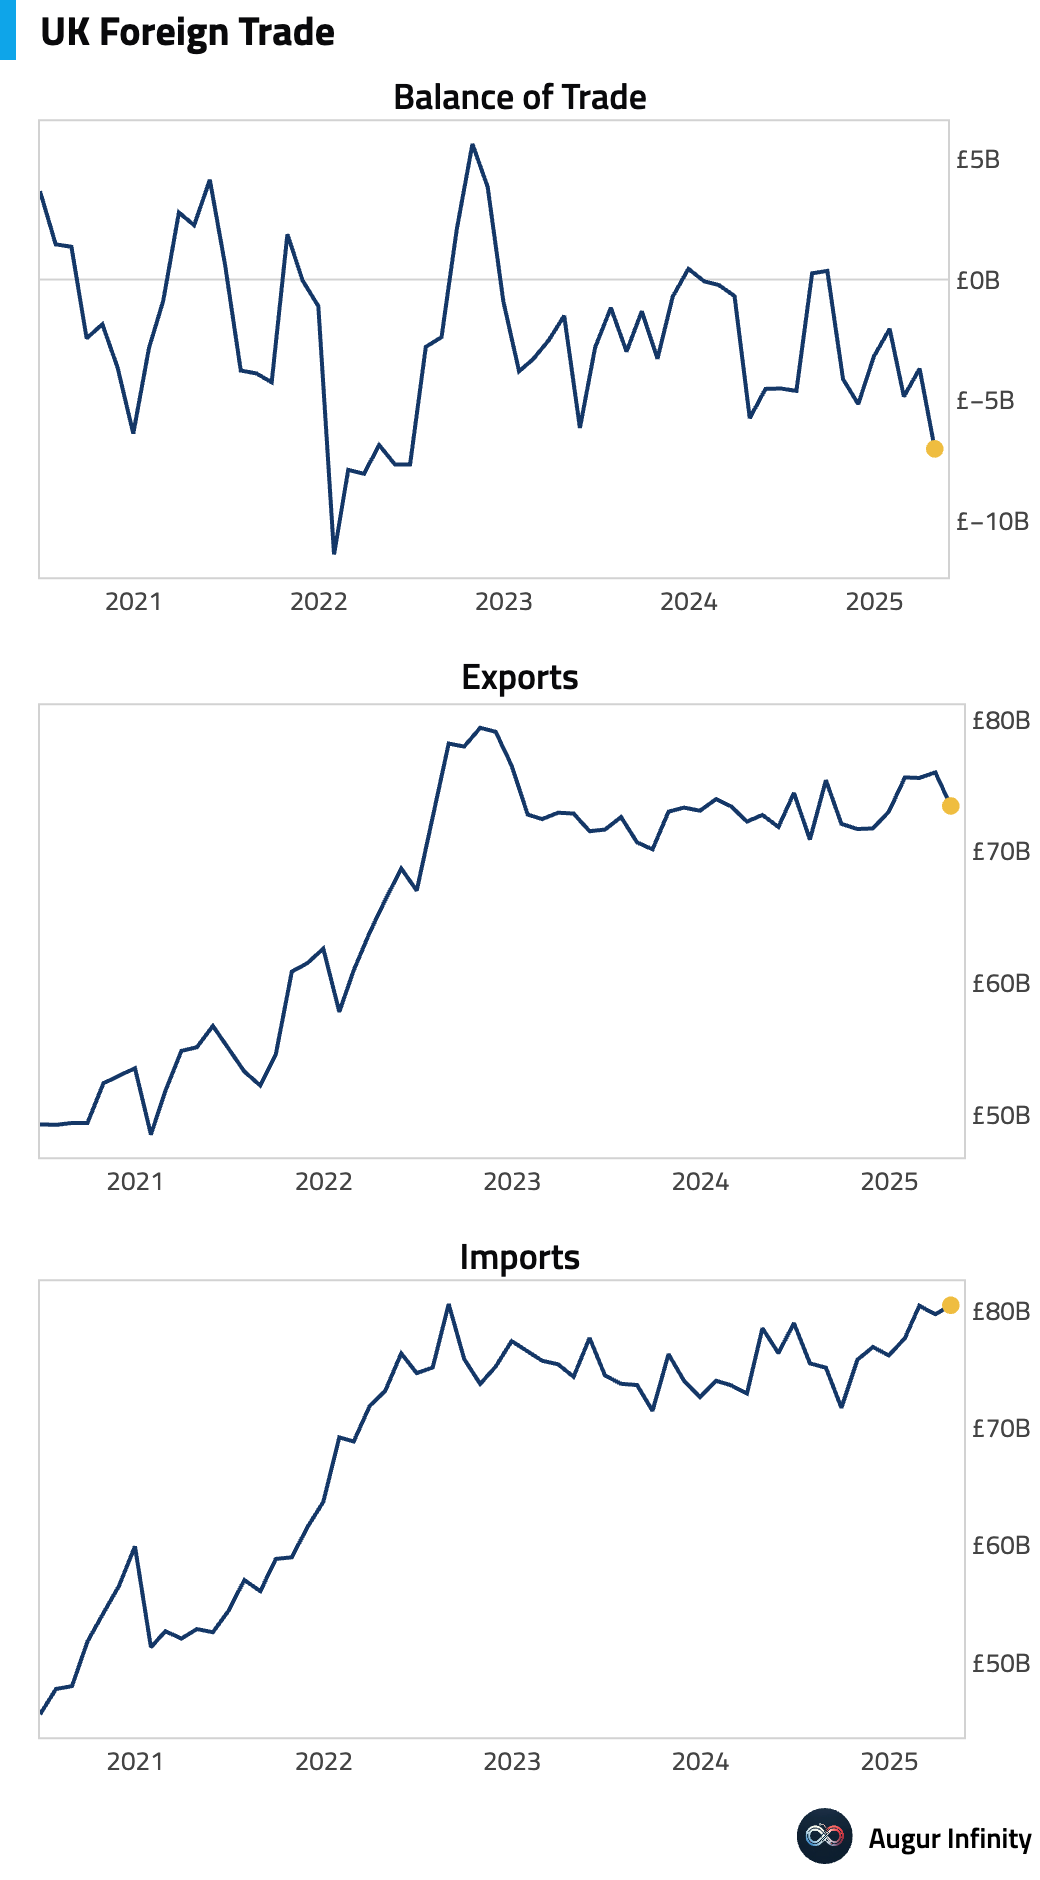
- The UK's goods trade deficit widened to £23.21 billion in April, larger than the £20.5 billion consensus and up from £19.87 billion previously. This is the widest goods deficit recorded since January 2022. The total trade balance deficit also expanded to £7.03 billion, its largest since June 2022.
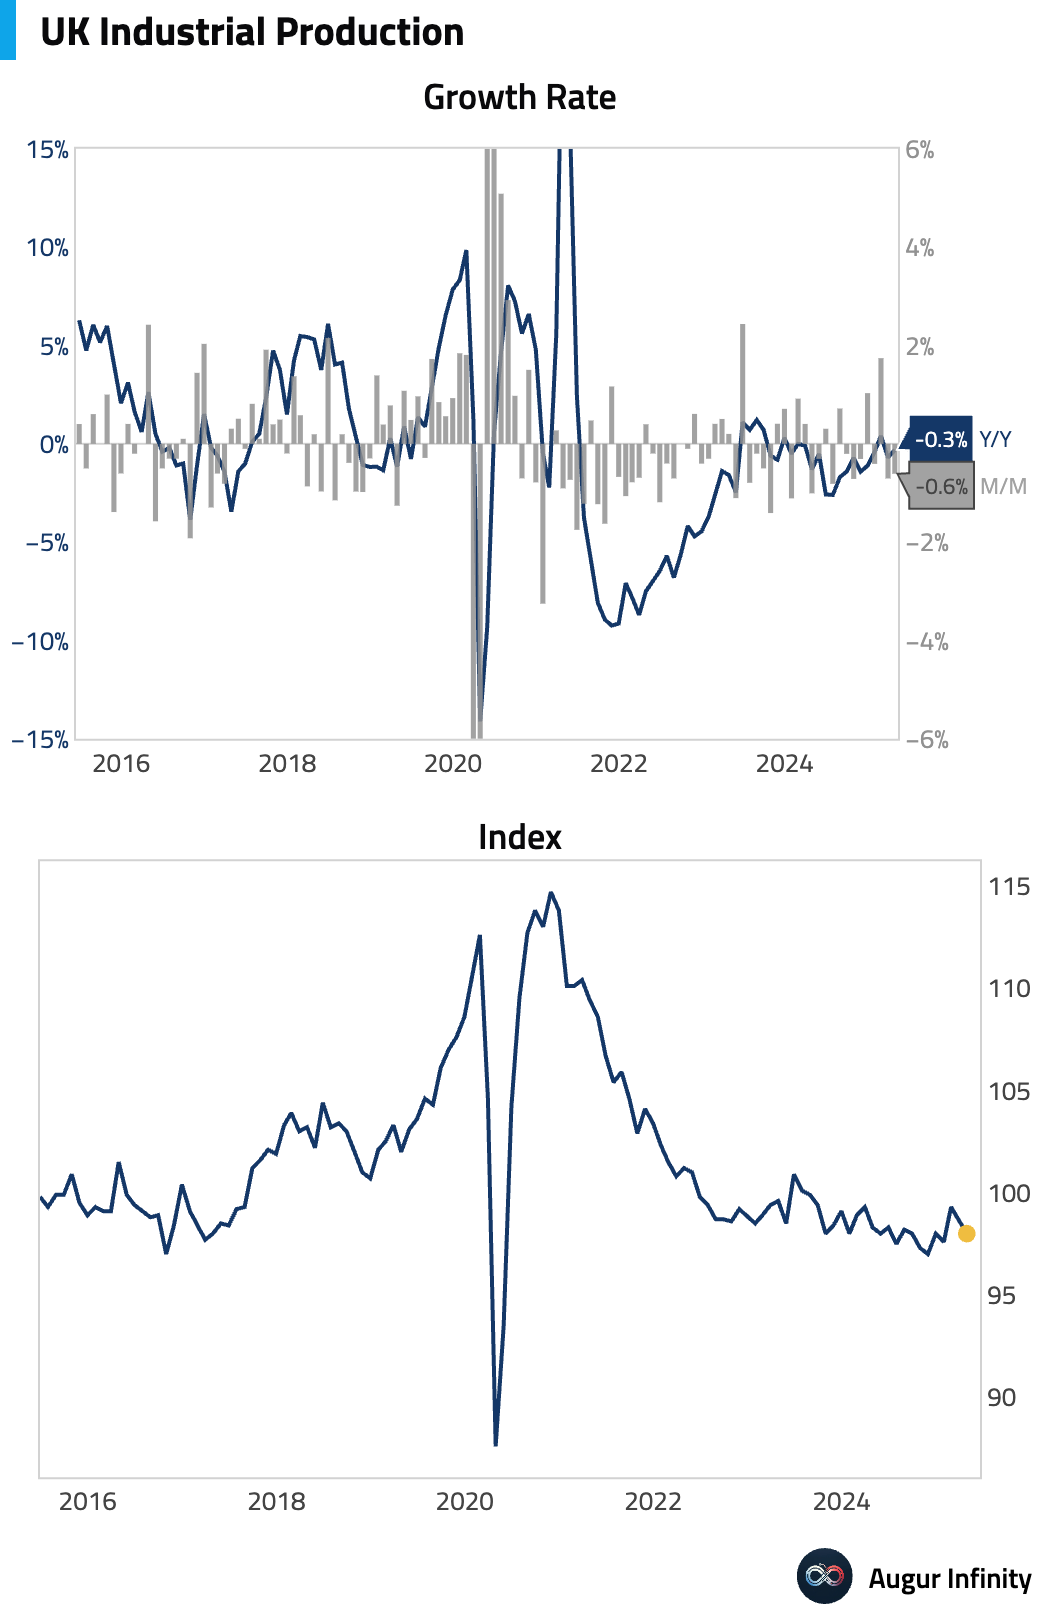
- UK industrial and manufacturing output weakened in April. Industrial production fell 0.6% M/M, worse than the -0.5% forecast, while manufacturing production dropped 0.9% M/M, also missing estimates. Year-over-year, industrial output was down 0.3%, weaker than the -0.2% consensus.
- The RICS House Price Balance in the United Kingdom fell to -8.0 in May from -3.0, missing the consensus of -3.0 and indicating a further deterioration in housing market sentiment.
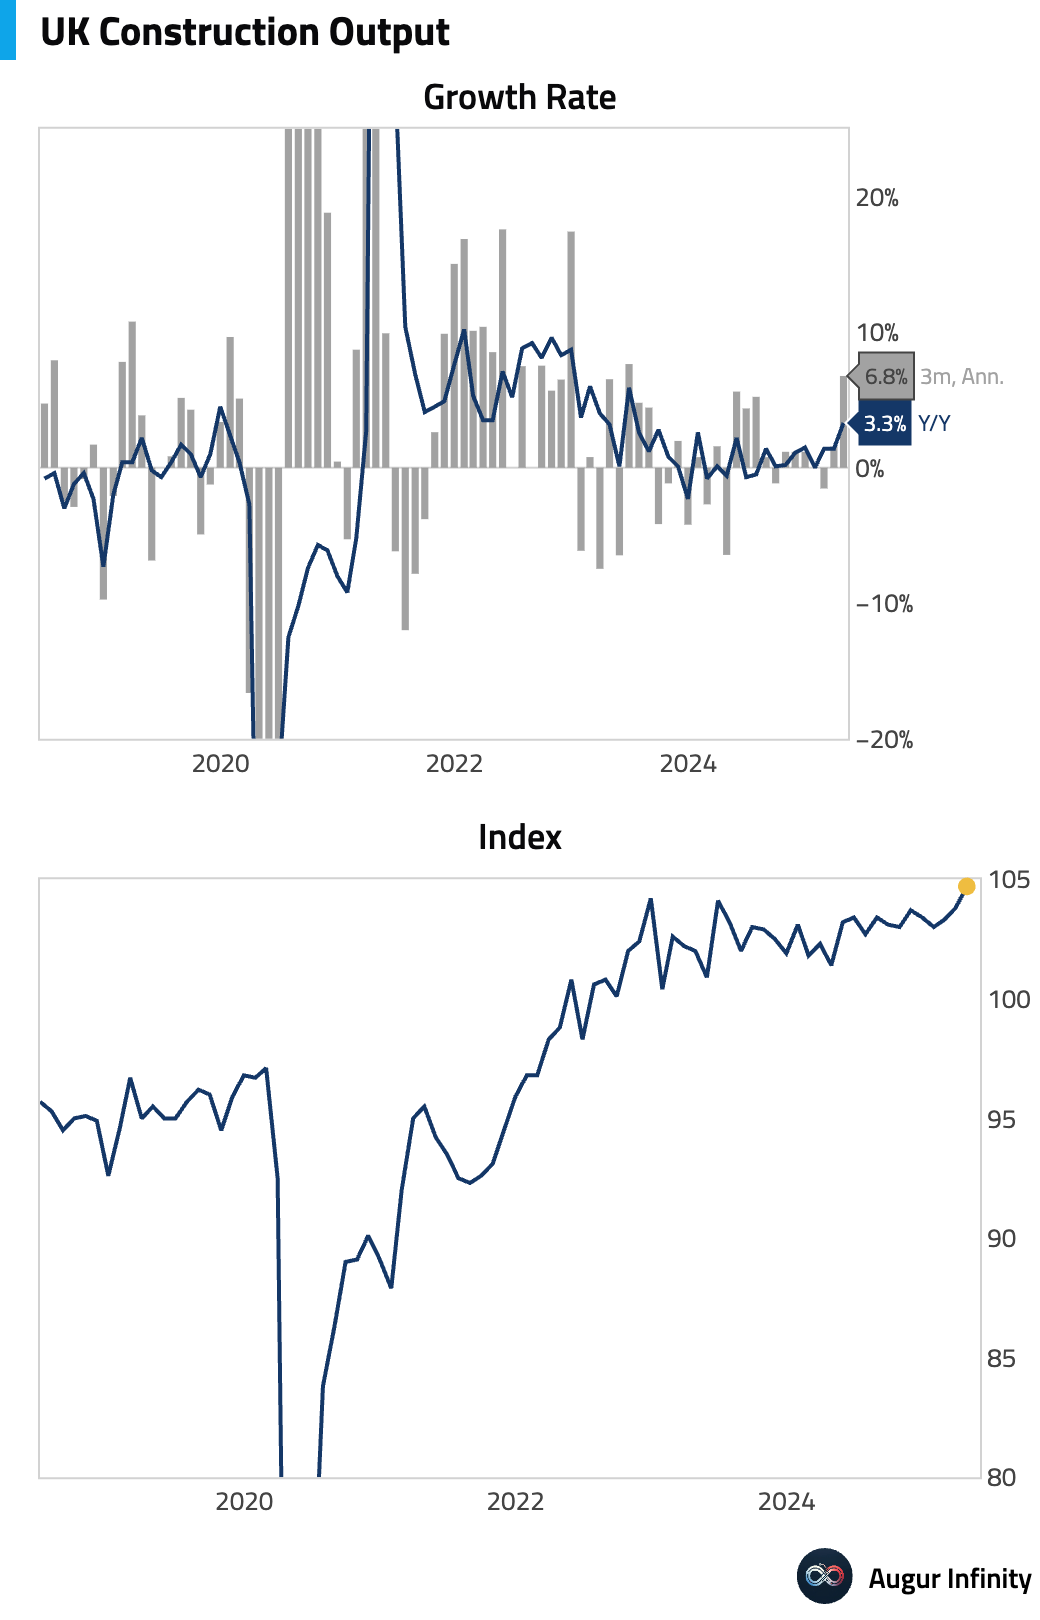
- UK construction output grew 3.3% Y/Y in April, a deceleration from the 1.4% revised growth in the prior period.
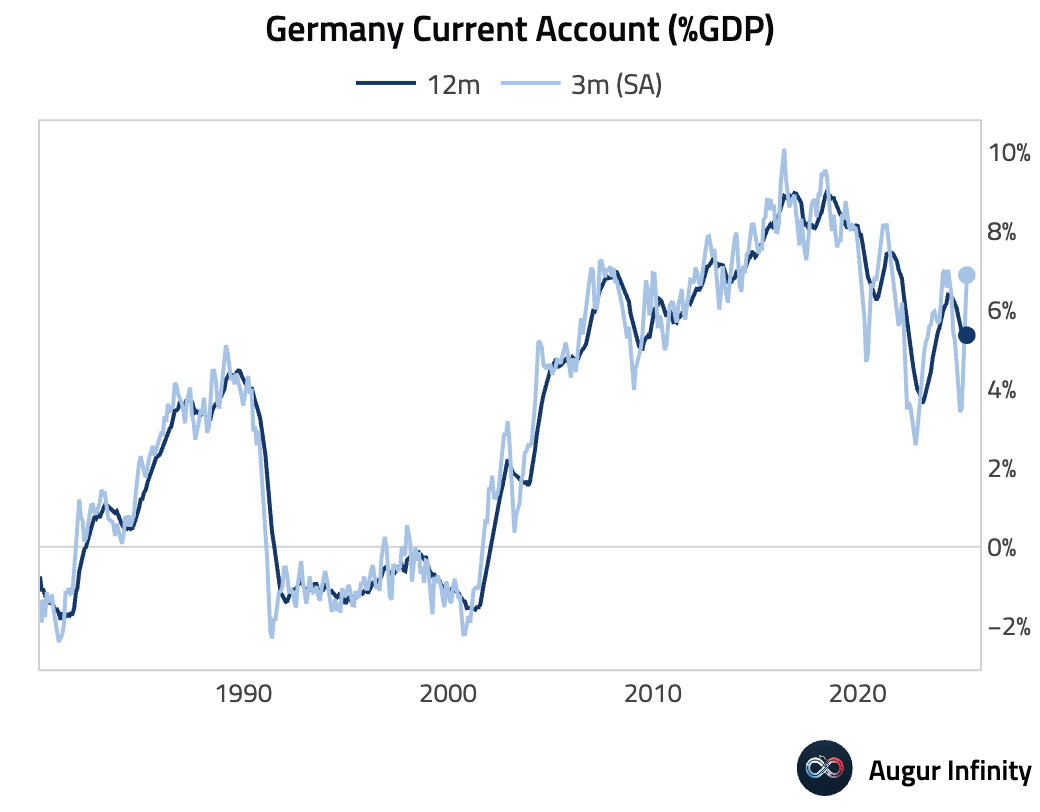
- Germany's current account surplus narrowed to €23.5 billion in April from €32.9 billion in March.
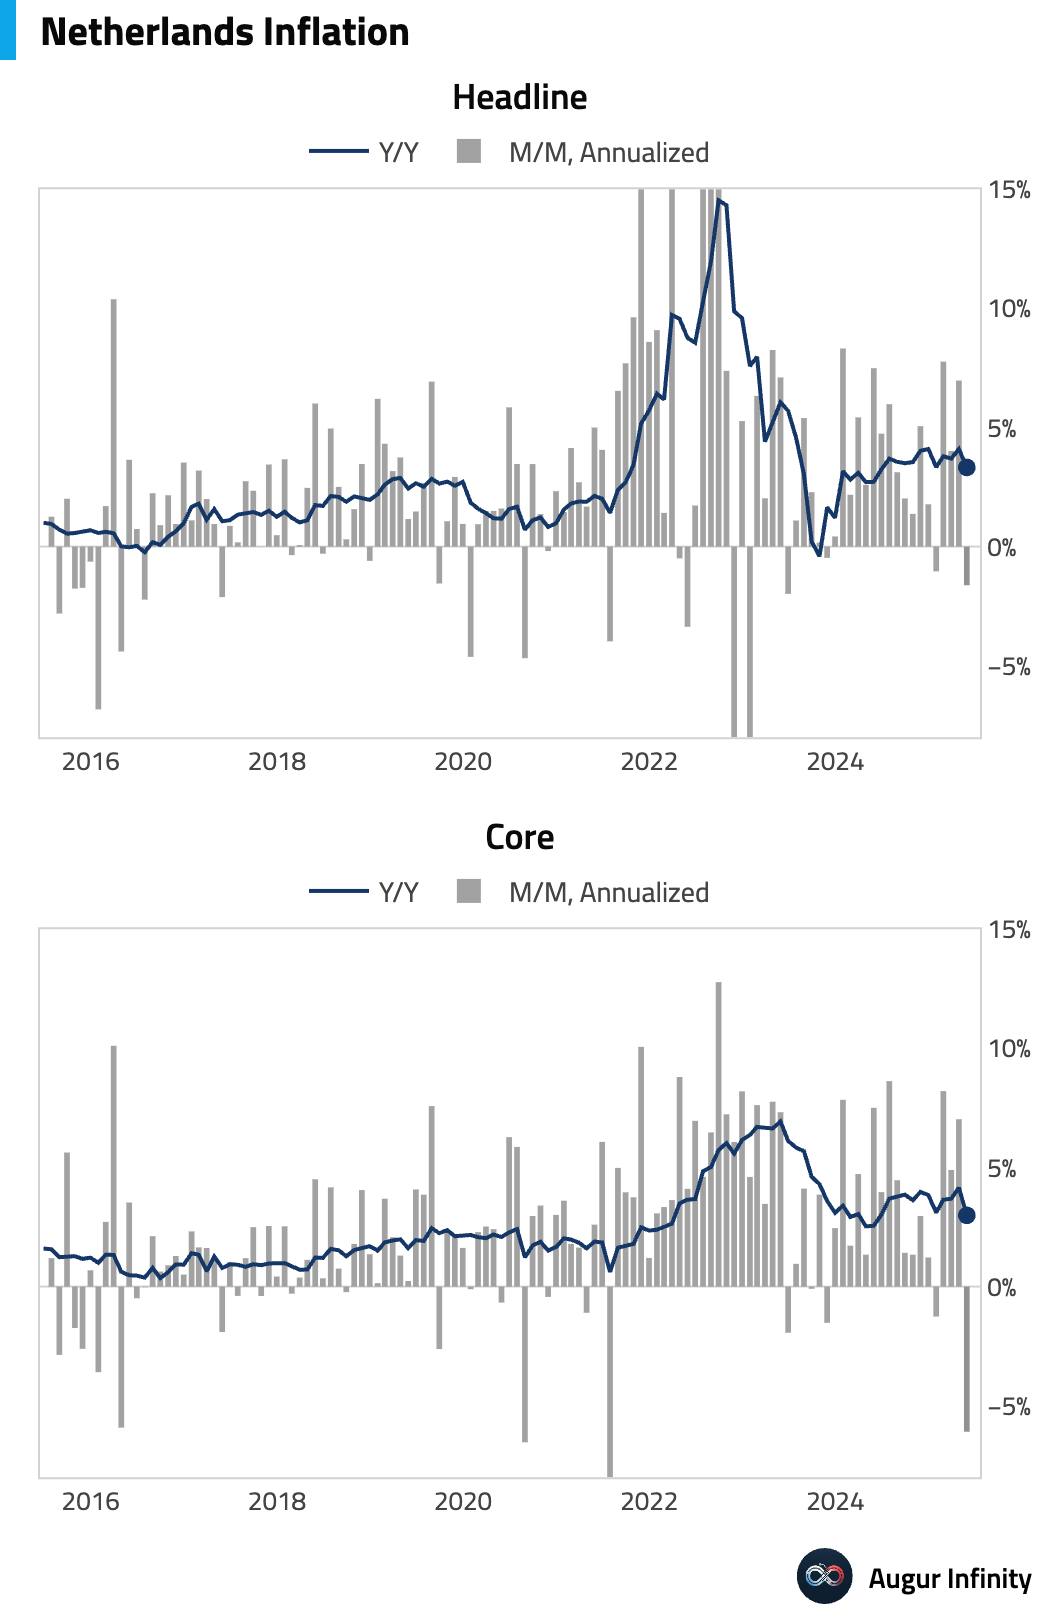
- Final inflation data from the Netherlands confirmed a cooling trend in May. The headline rate fell 0.5% M/M, while the annual inflation rate eased to 3.3% from 4.1%, the lowest reading since June 2024.
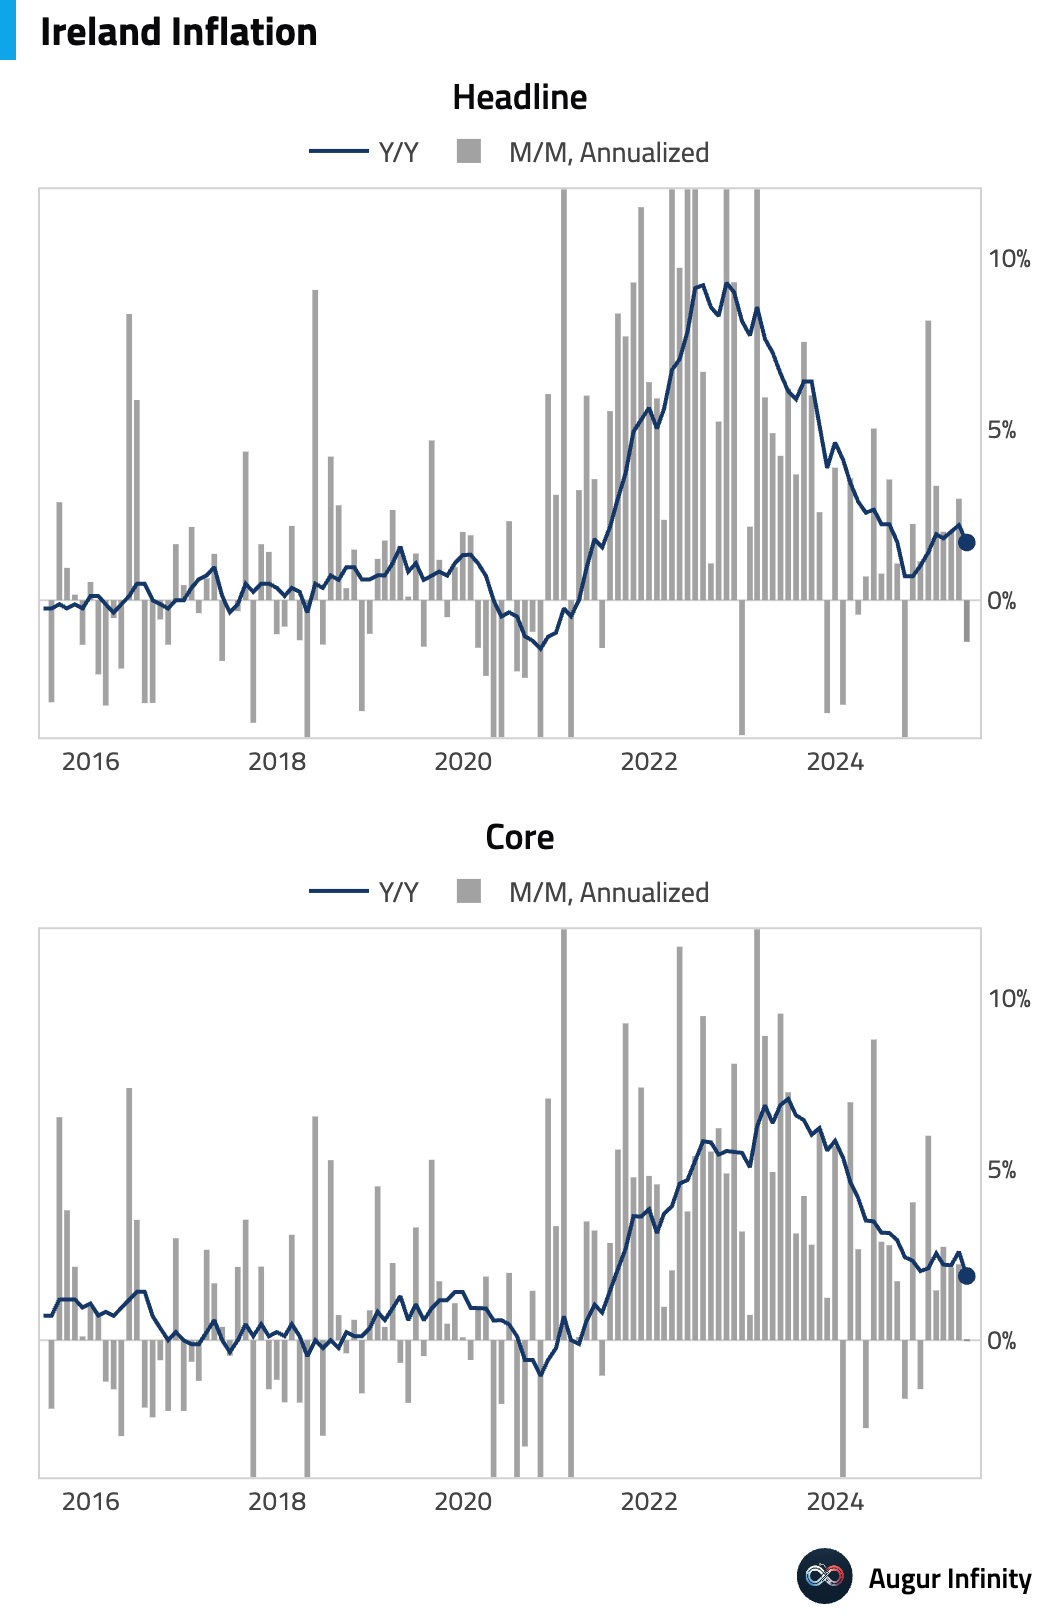
- Ireland's inflation rate for May was 1.7% Y/Y, down from 2.2% in April. The M/M rate was flat at 0.0%.
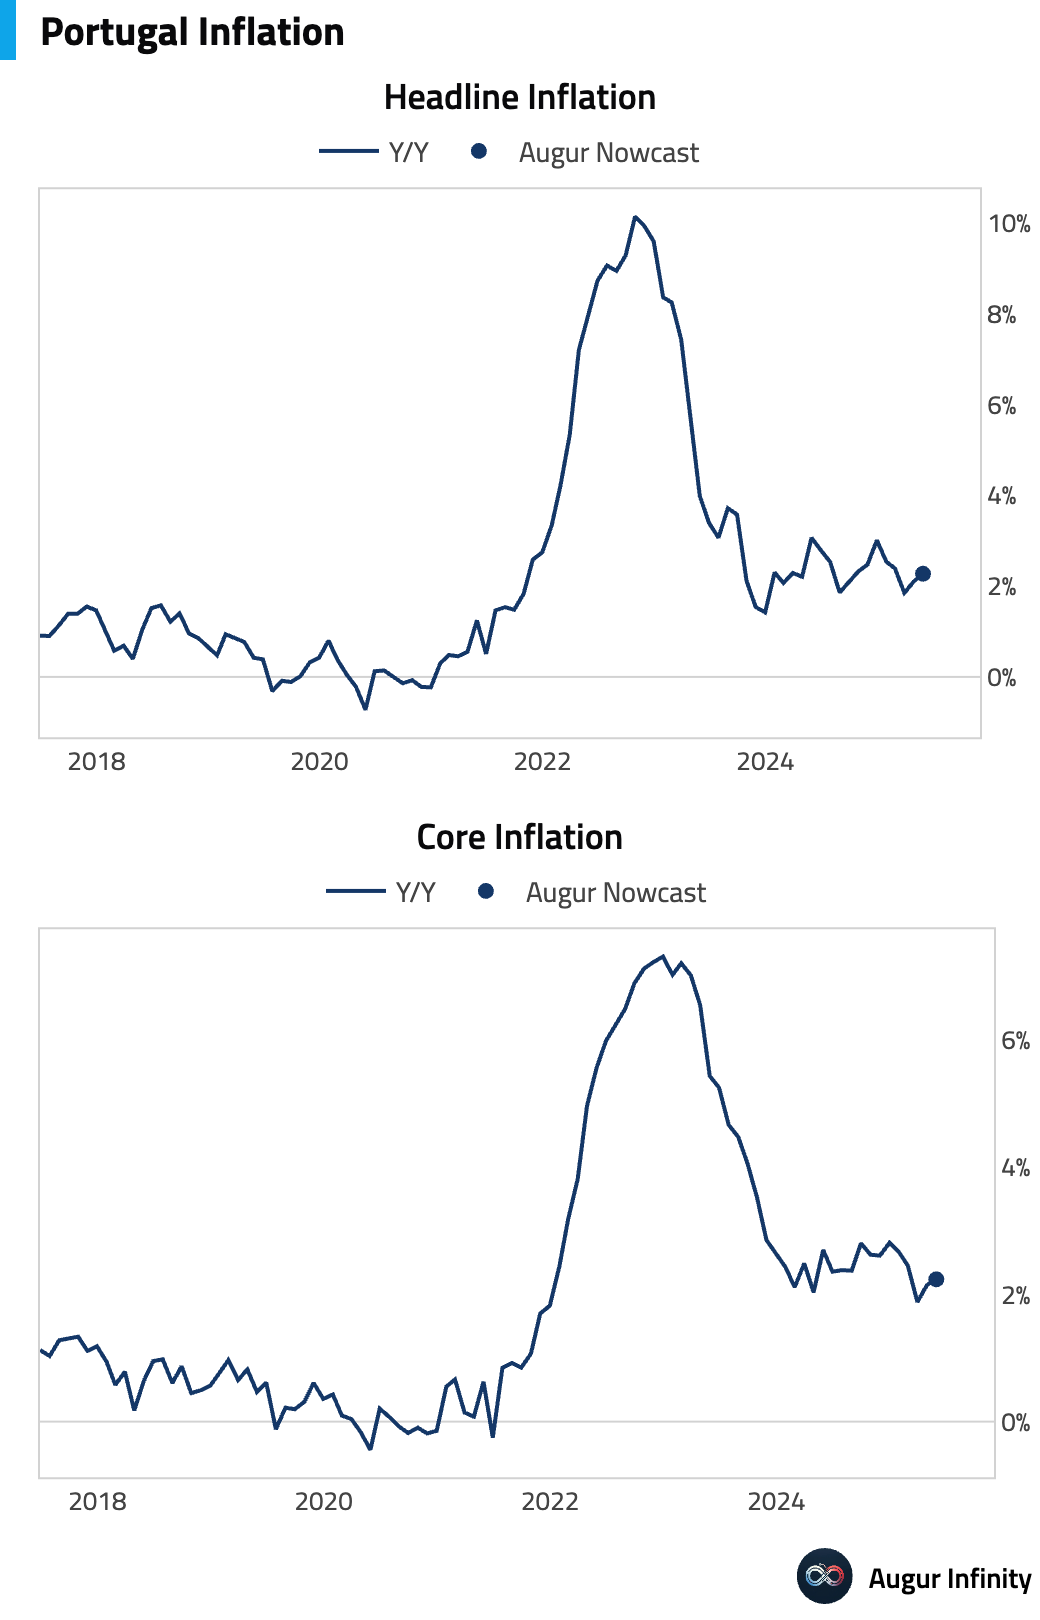
- Portugal's final May inflation figures showed the annual rate at 2.3%, in line with the preliminary estimate and up from 2.1% in April. The M/M rate was 0.3%.
Asia-Pacific
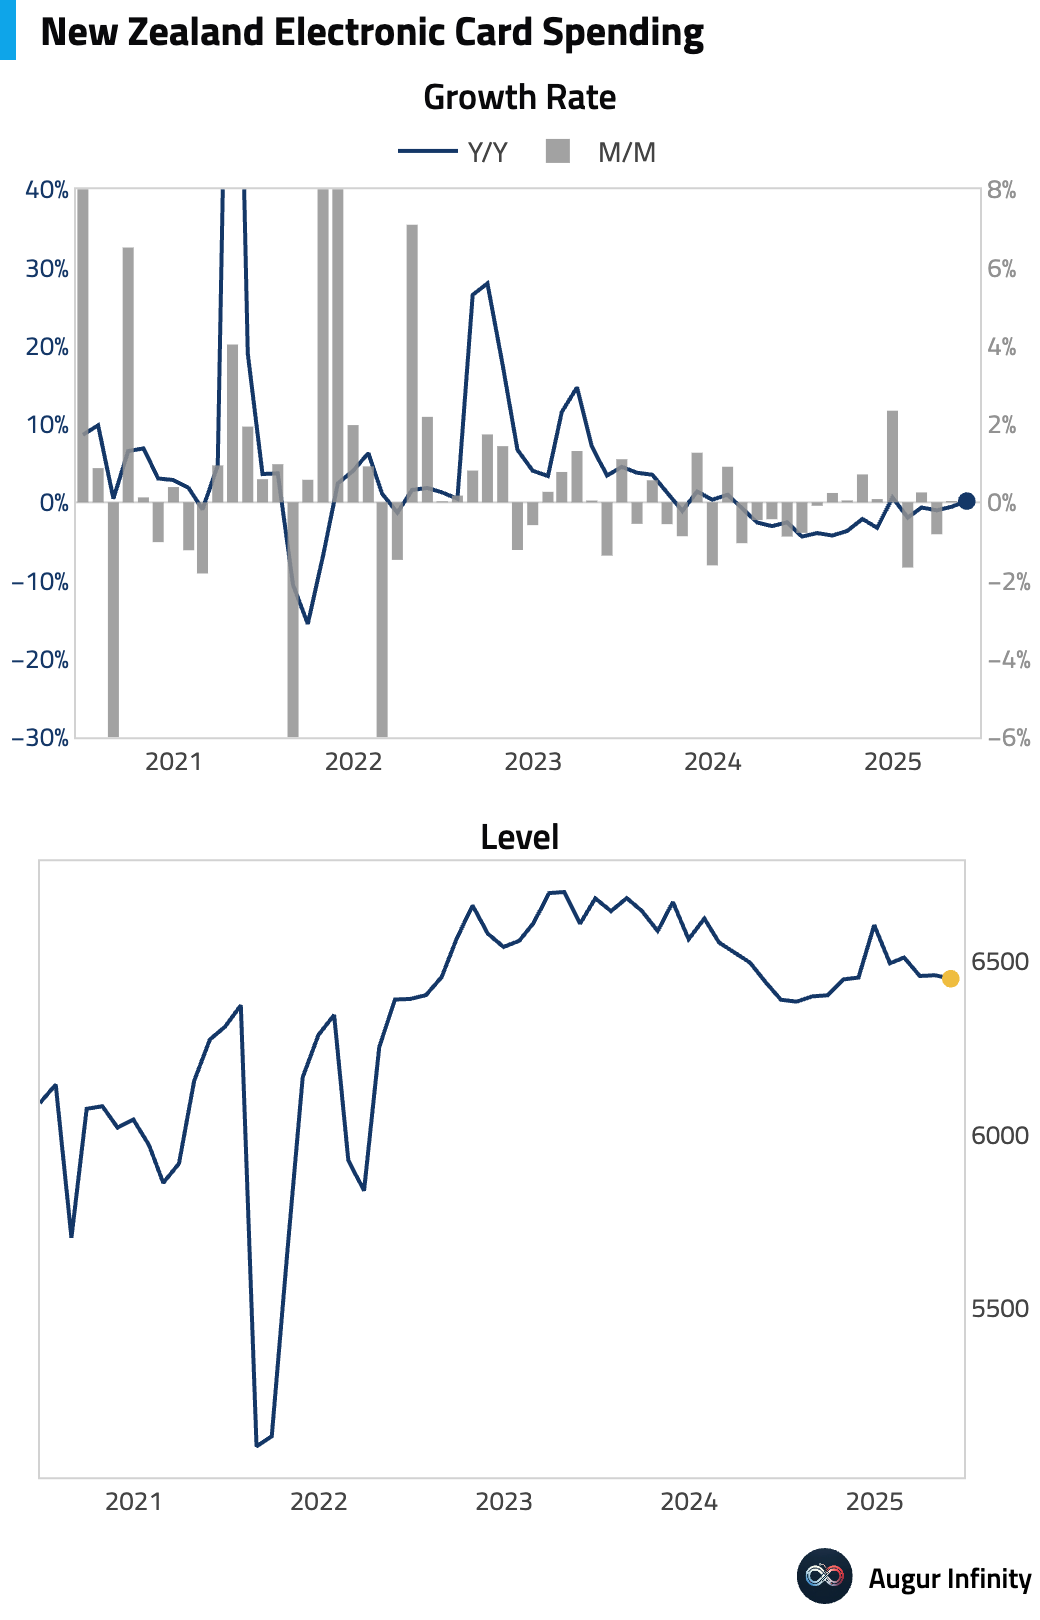
- New Zealand's electronic retail card spending fell 0.2% M/M in May. However, the year-over-year figure showed a surprising rebound, rising 0.9% and sharply beating the consensus forecast for a 0.3% decline. The positive annual growth suggests some resilience in consumer demand.
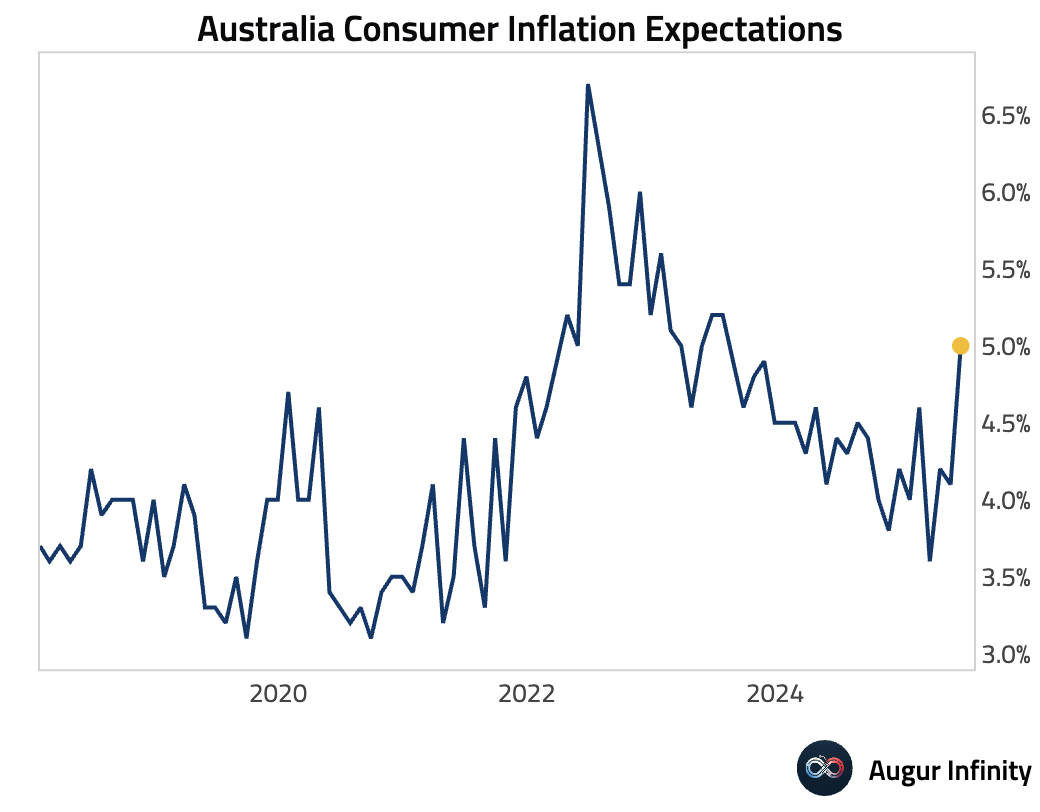
- Australian consumer inflation expectations for June jumped to 5.0% from 4.1% in May. This marks the highest reading since July 2023 and signals continued price pressure concerns.
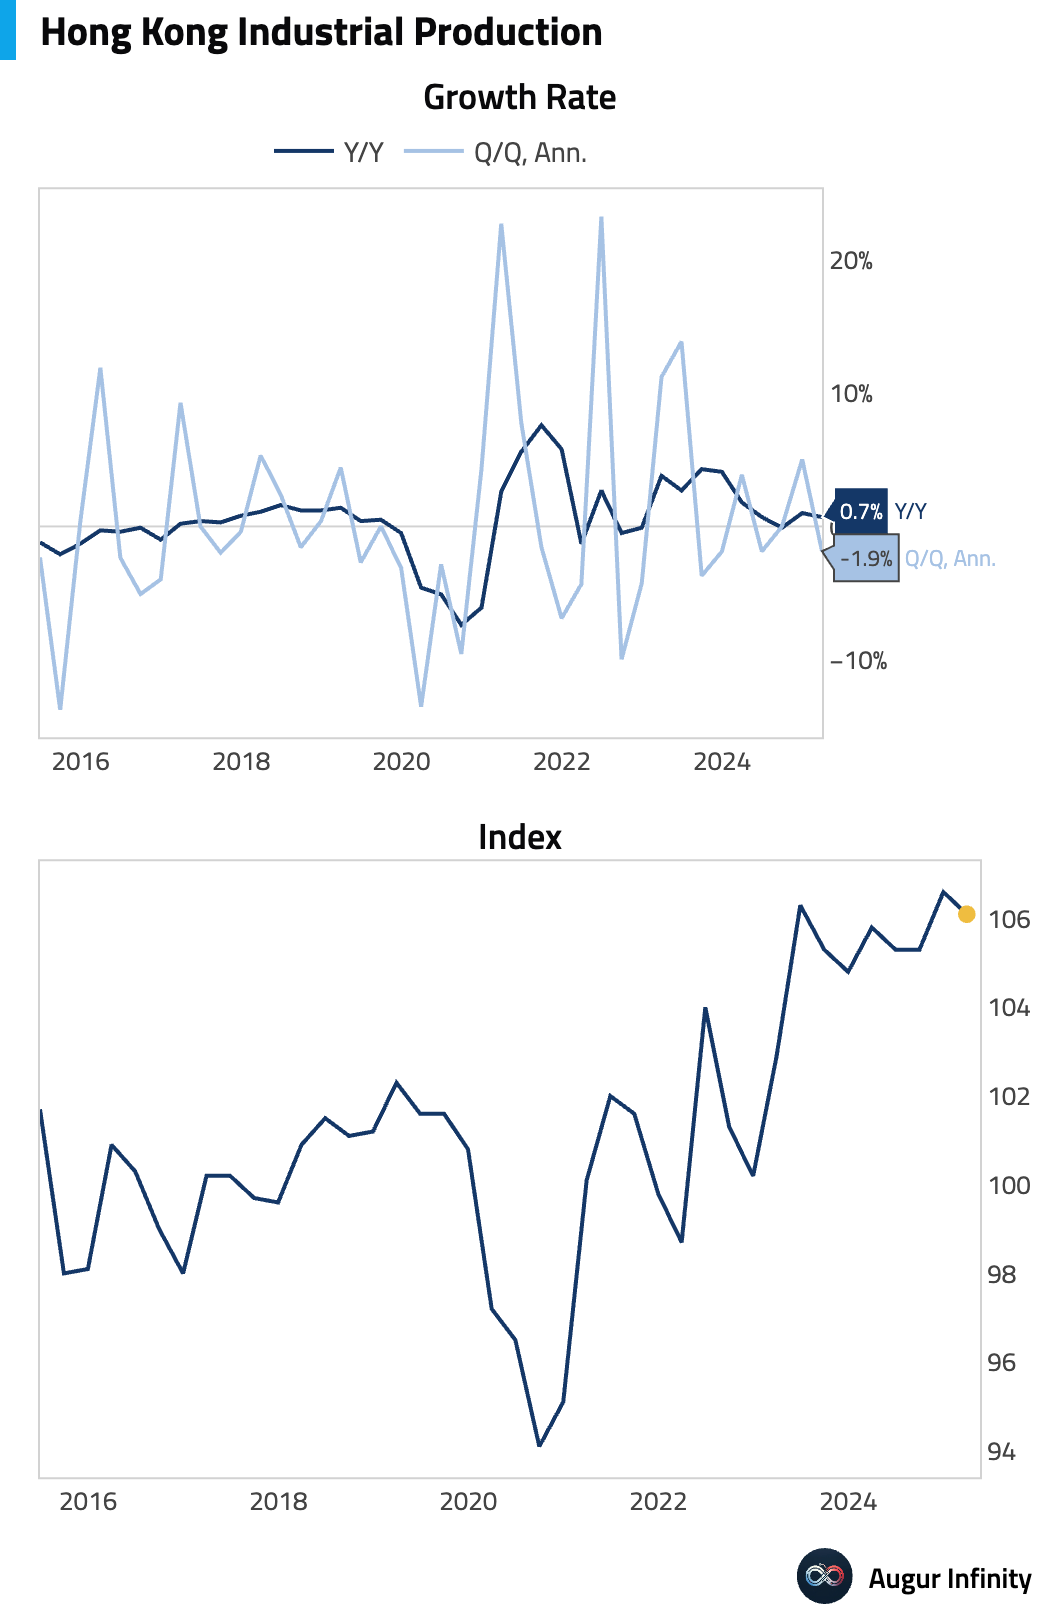
- Hong Kong's industrial production growth slowed to 0.7% Y/Y in the first quarter of 2025, down from 1.0% in the prior quarter.
Emerging Markets ex China
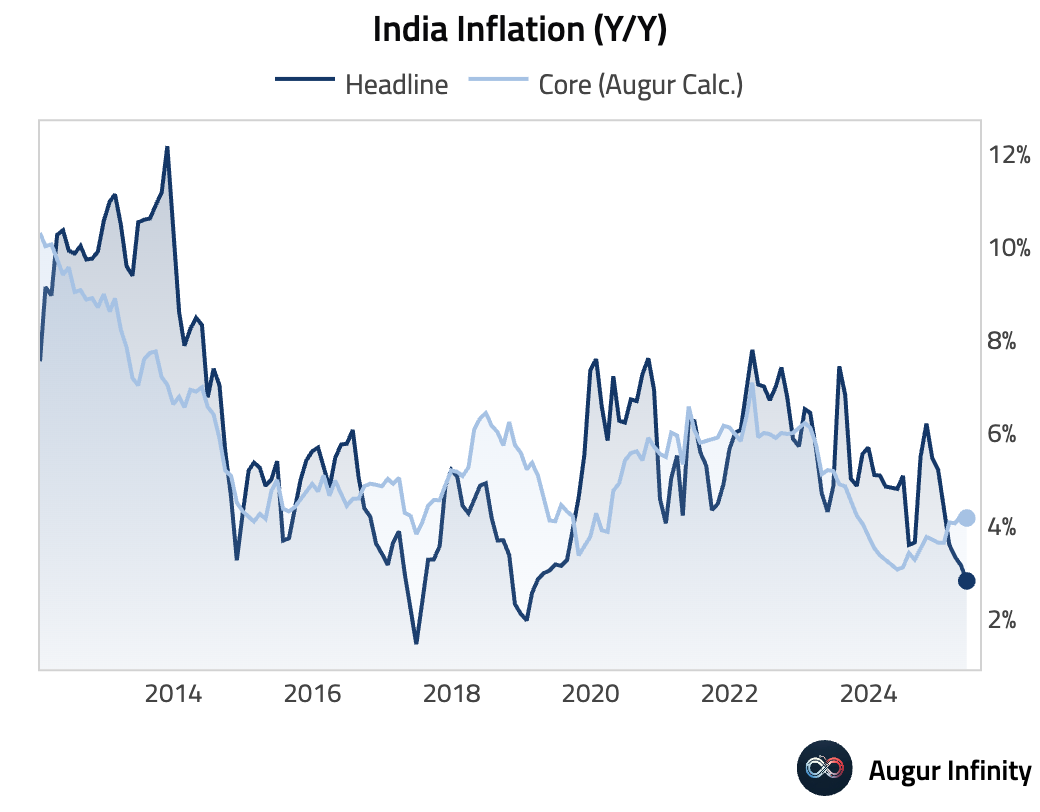
- India's annual inflation rate cooled to 2.82% in May, below the 3.0% consensus and down from 3.16% in April. This is the lowest inflation rate recorded since February 2019.
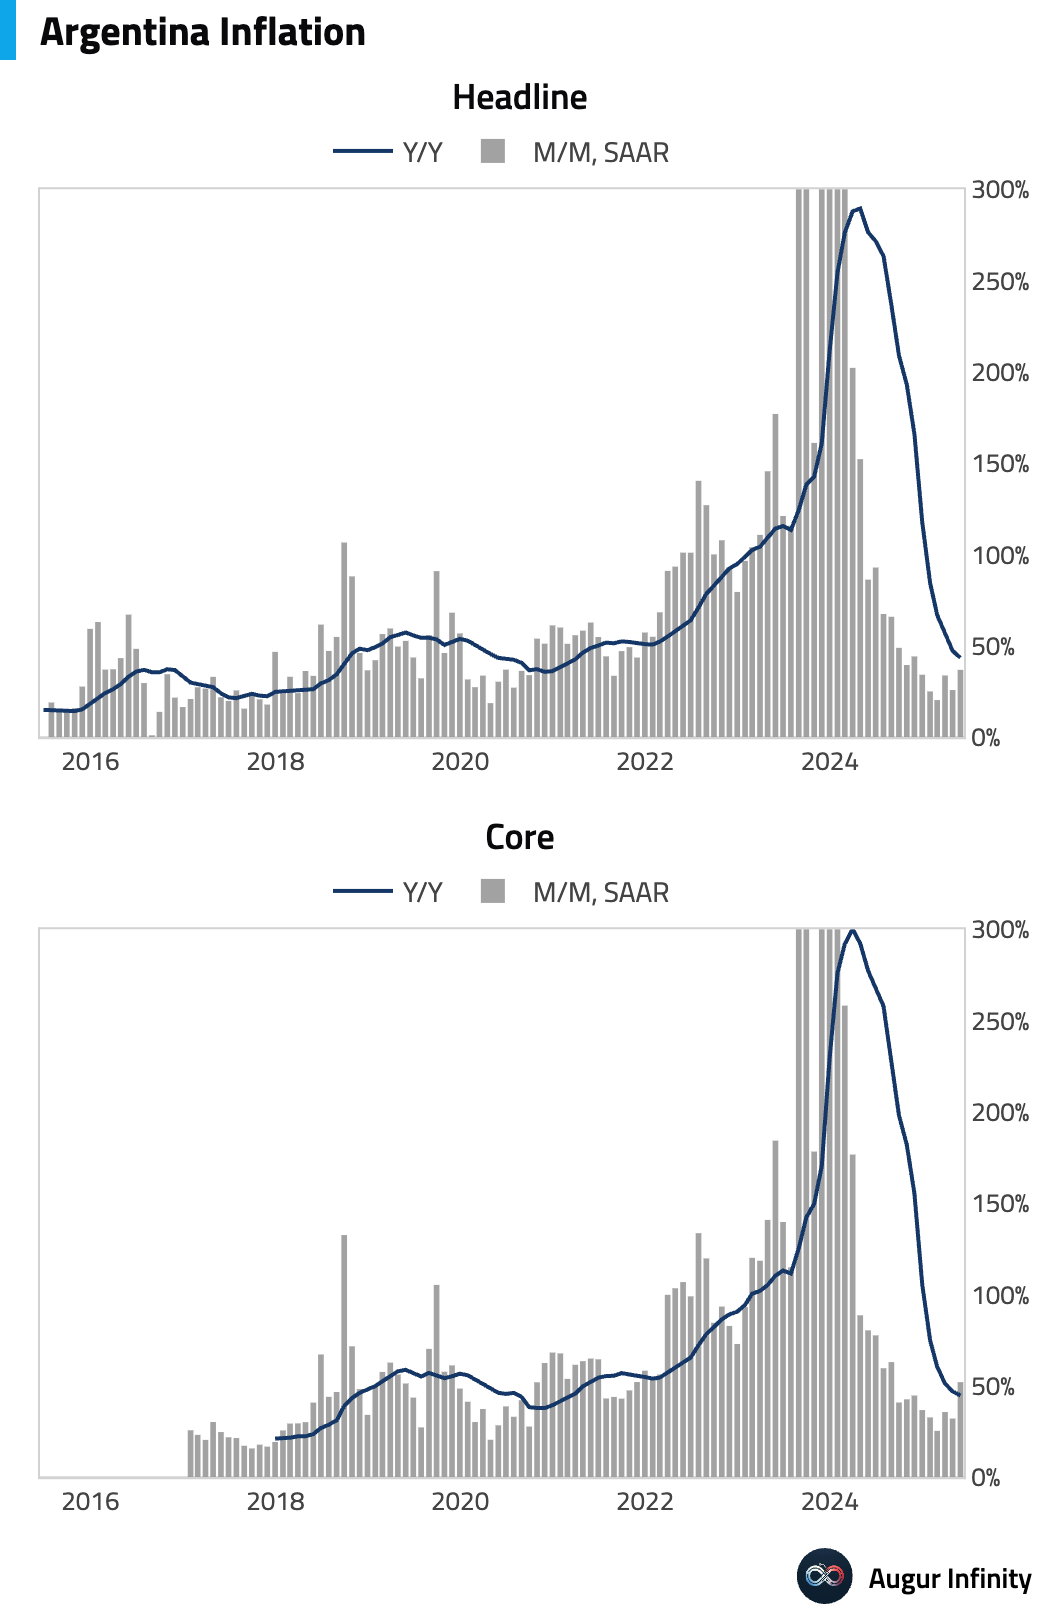
- Argentine inflation continued its rapid descent in May, with the M/M rate slowing to 1.5% from 2.8% in April. This was below the 2.0% consensus and marked the lowest monthly increase since April 2020. The annual rate fell to 43.5% from 47.3%.
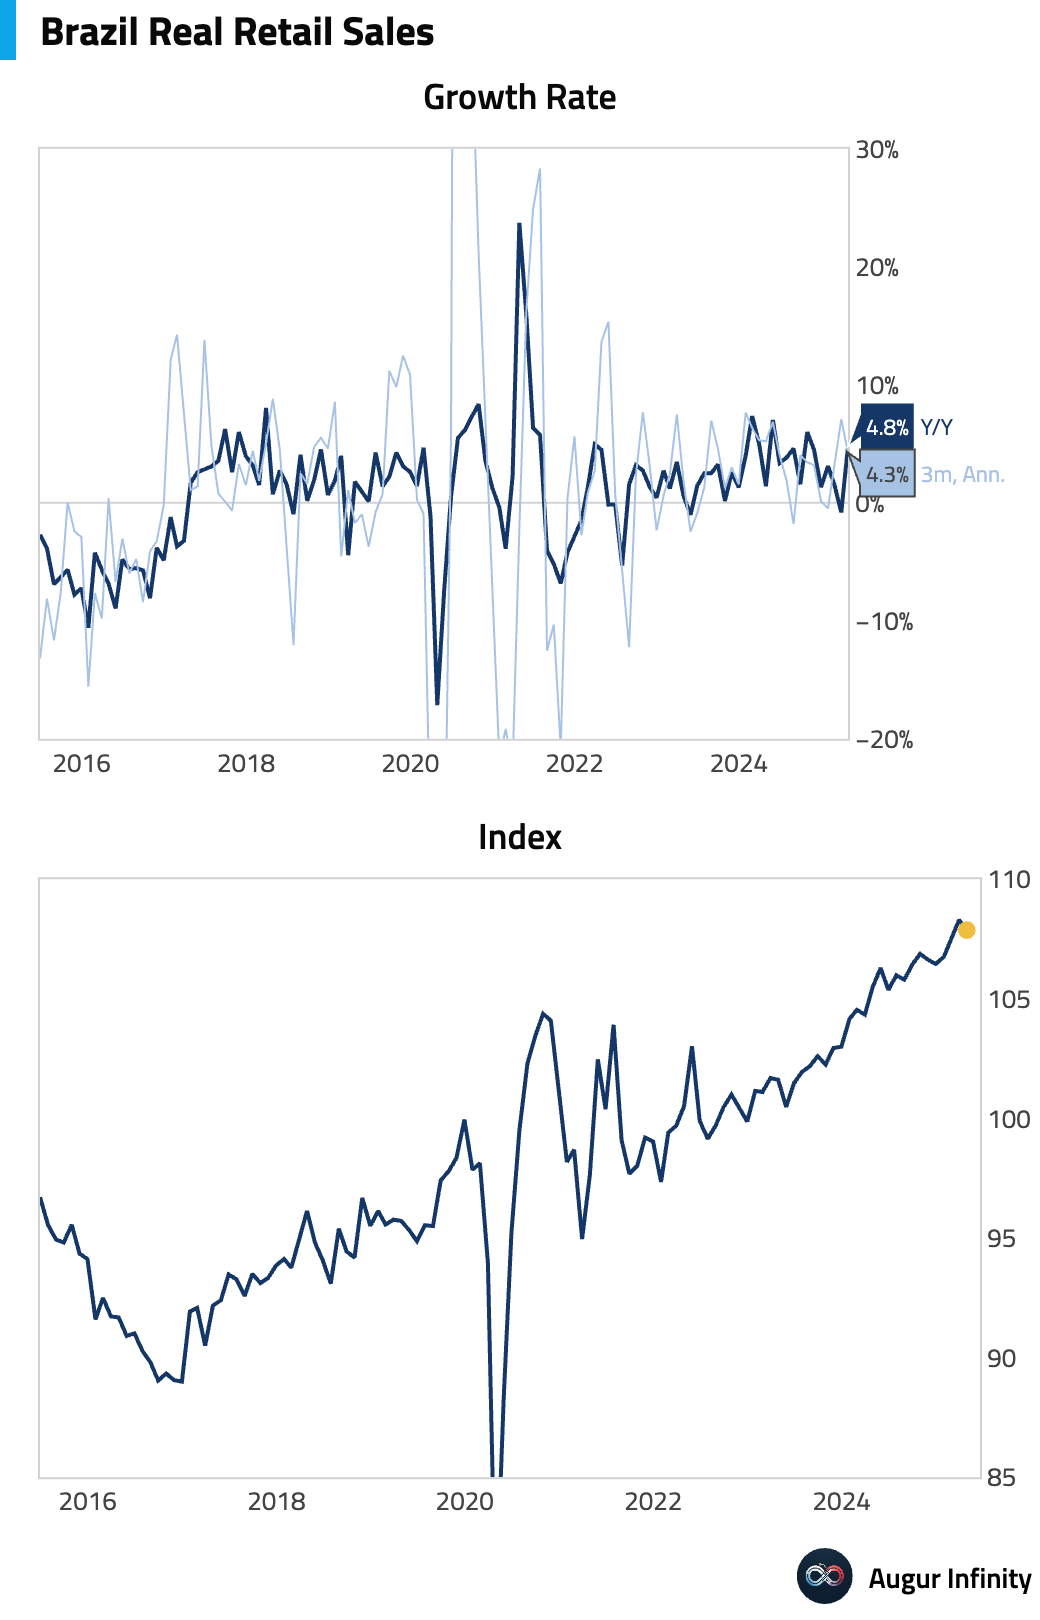
- Brazilian retail sales for April beat expectations, declining 0.4% M/M against a forecast of -0.8%. The year-over-year figure was strong, rising 4.8% versus a 3.4% consensus.
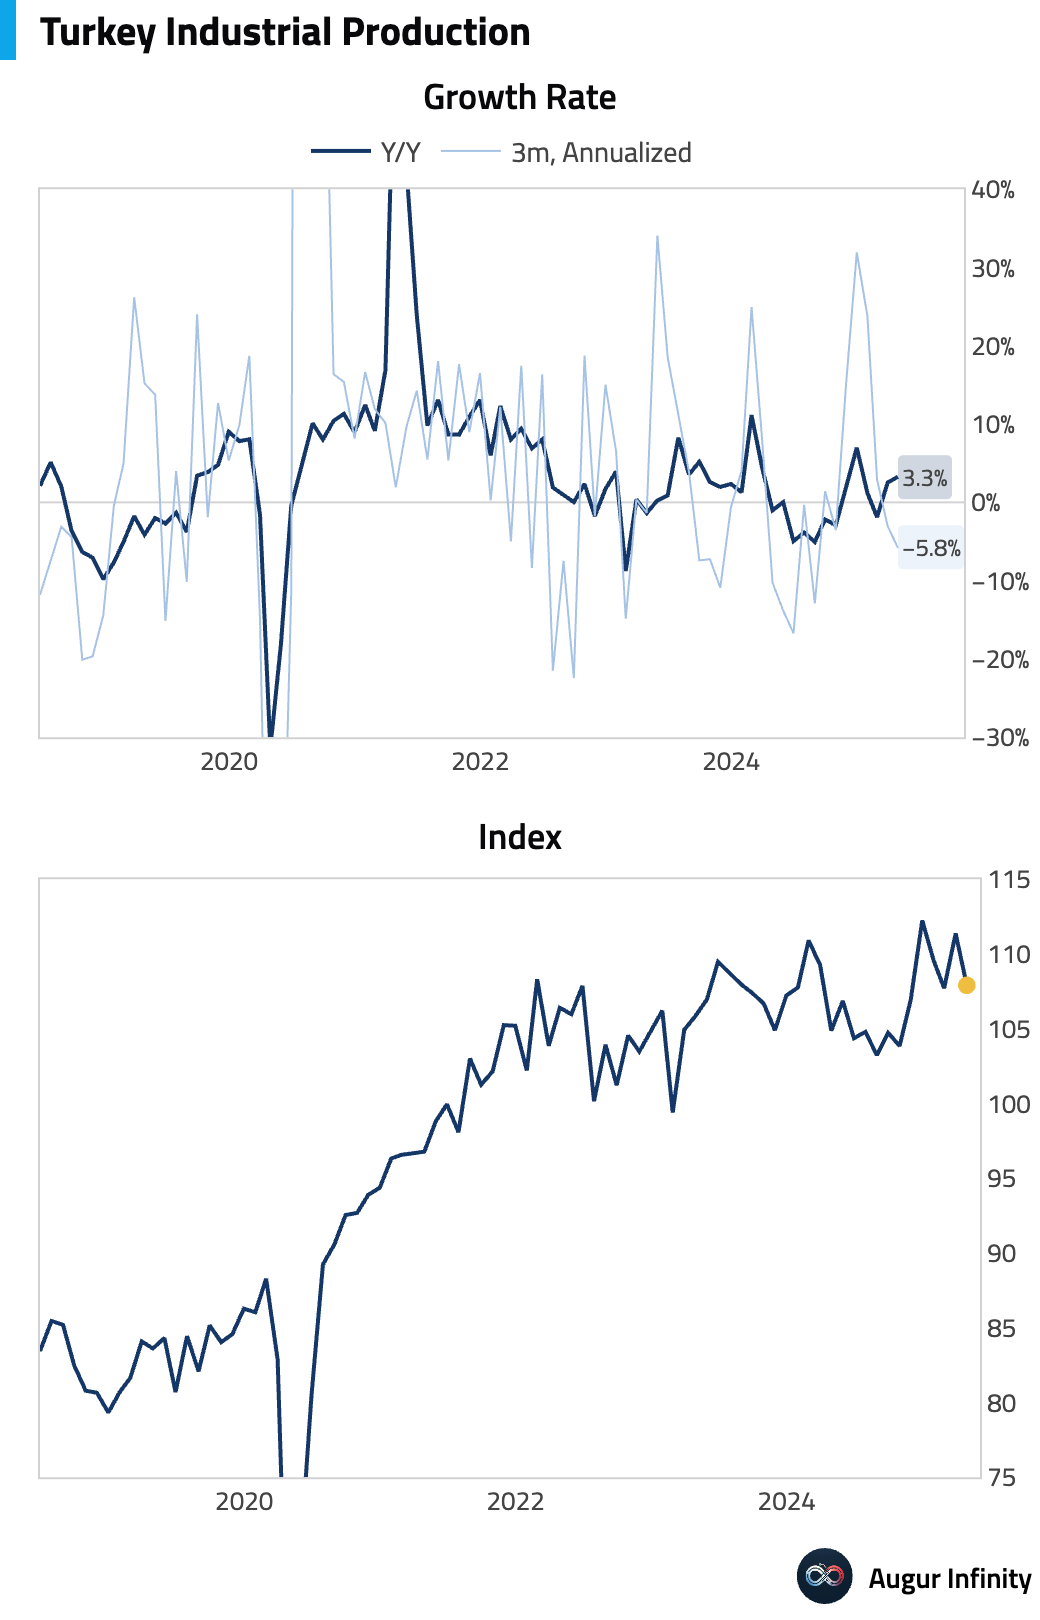
- Turkey's industrial production rose 3.3% Y/Y in April, accelerating from 2.5% growth in March and marking the strongest annual pace since December 2024. However, on a monthly basis, output contracted 3.1%, the sharpest fall since April 2024.
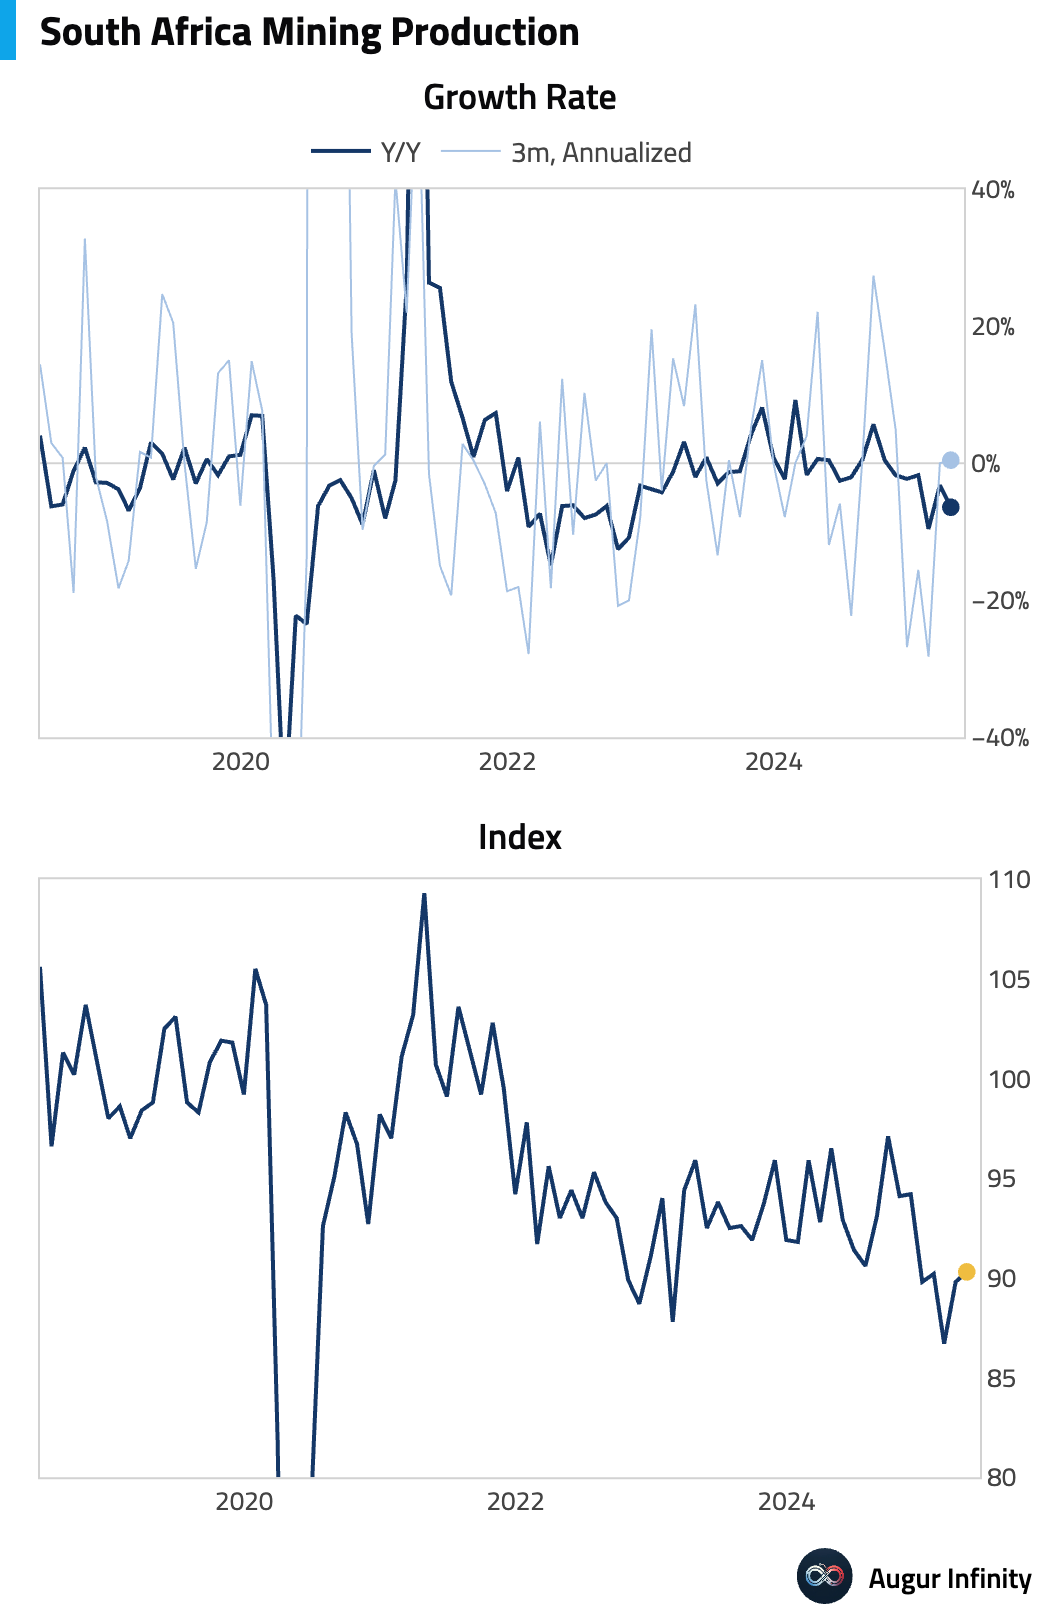
- South Africa's mining production fell sharply by 7.7% Y/Y in April, a much deeper contraction than the -4.3% consensus. Month-over-month, production rose 0.6%.
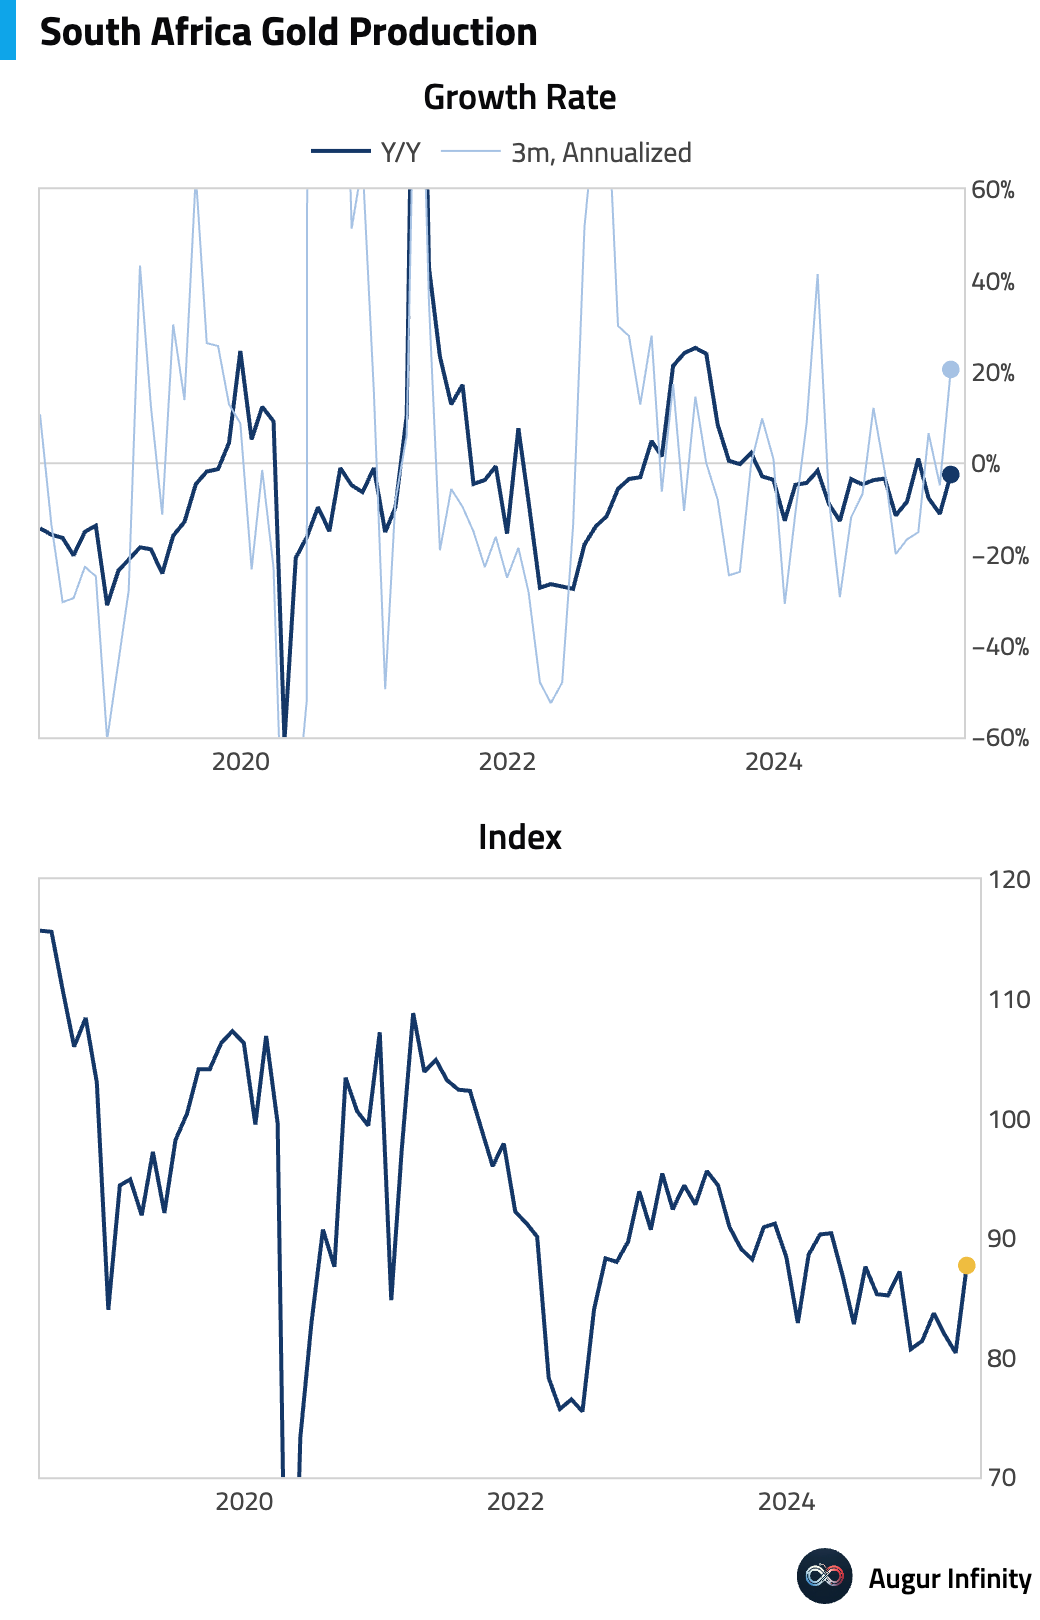
- South Africa's gold production contracted by 2.5% Y/Y in April, an improvement from the 11.1% decline in March.
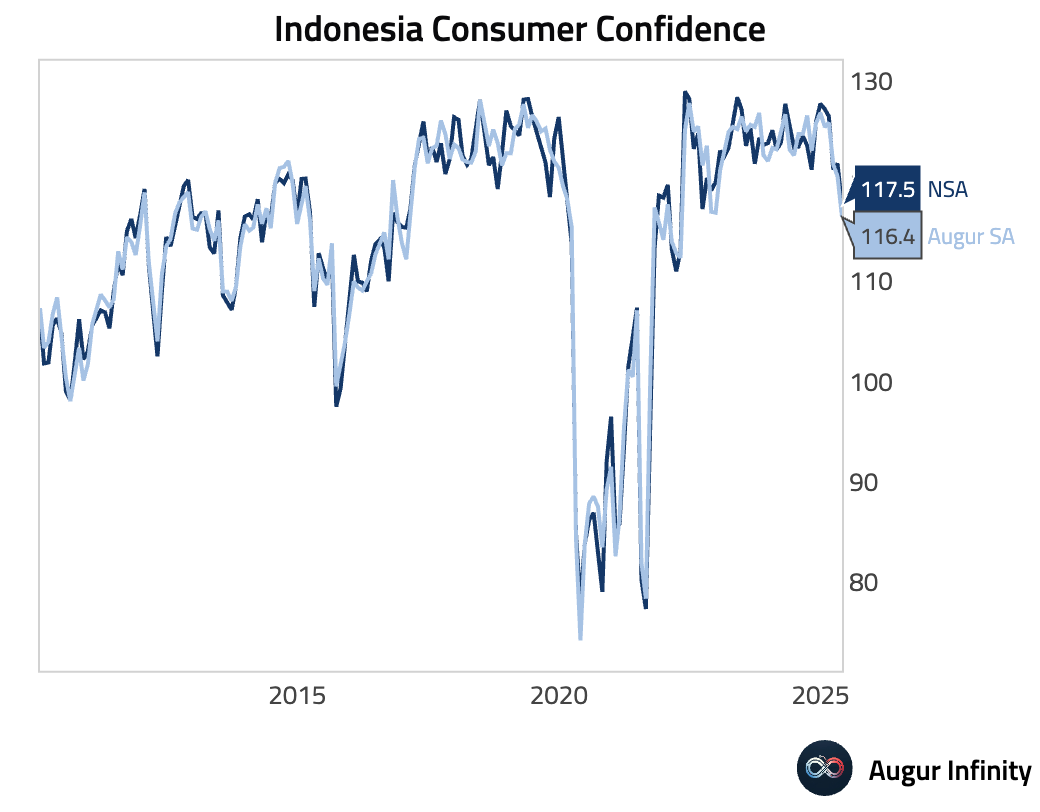
- Consumer confidence declined in both Indonesia and Thailand in the latest readings. Indonesian consumer confidence fell to 117.5 in May, while Thailand's index dropped to 54.2.
- India's M3 money supply grew 9.5% Y/Y in the latest period, unchanged from the previous reading.
- Brazilian business confidence edged lower to 48.6 in June from 48.9 in May, indicating slightly more pessimistic business sentiment.
Equities
- Global equity markets were broadly higher, supported by softer U.S. inflation data. In the U.S., major indices like the S&P 500 and Nasdaq posted modest gains of 0.4% and 0.2%, respectively. Noteworthy international performers included South Korea, which rallied 1.1%, and France, also up 1.1%. Canadian equities rose for a third consecutive session, gaining 0.8%.
Fixed Income
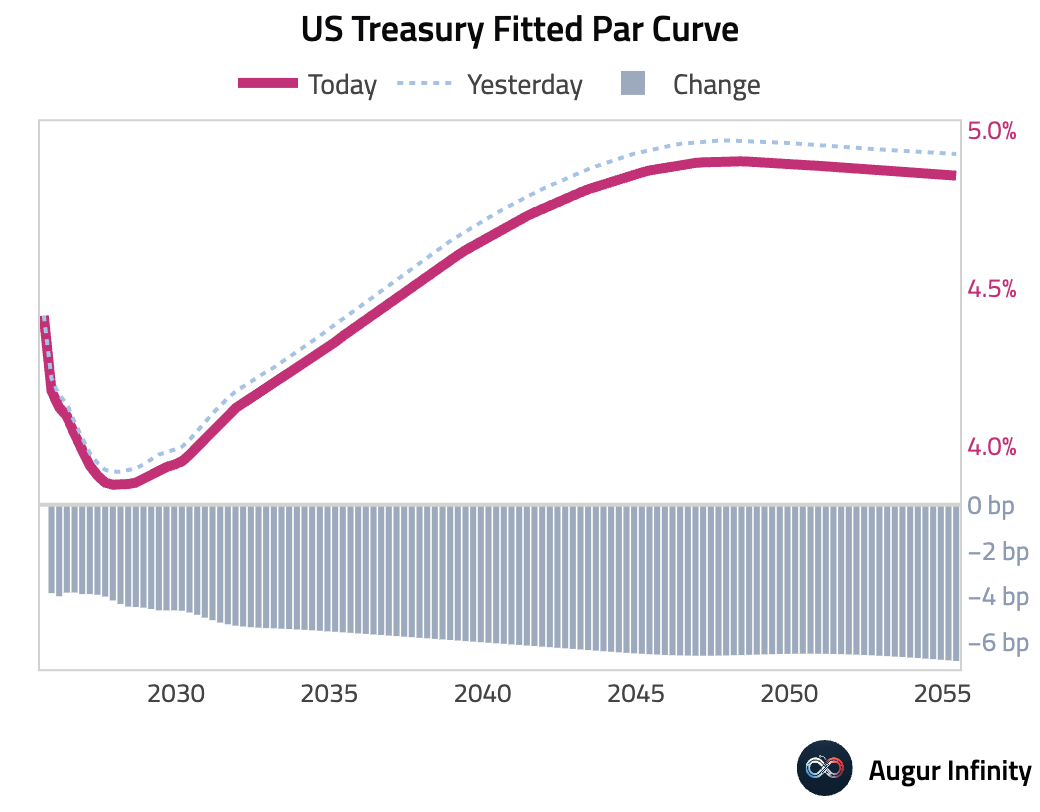
- U.S. Treasury yields fell across the curve following the weaker-than-expected PPI report, which reinforced expectations for Fed policy easing. The 10-year Treasury yield dropped 5.8 bps, while the 30-year yield fell 7.1 bps. Yields on the 5-year, 10-year, and 30-year Treasurys have now declined for four consecutive days.
FX
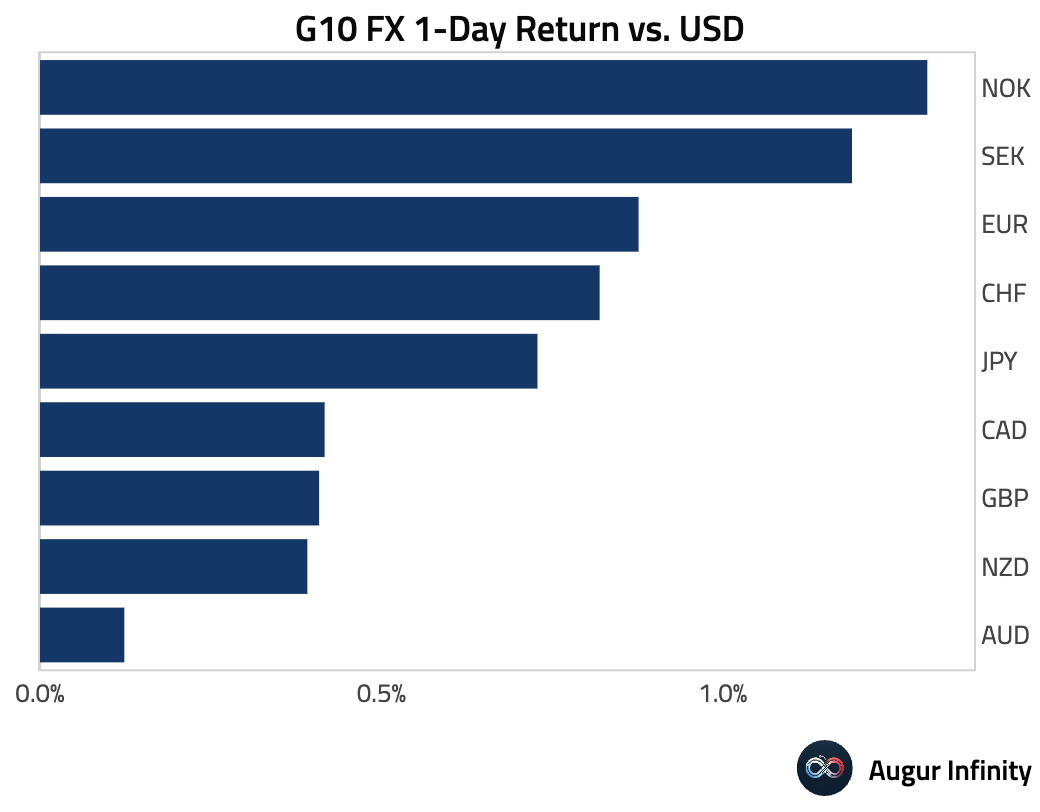
- The U.S. dollar weakened against all G10 peers as falling Treasury yields reduced its attractiveness. The Euro gained 0.9% and the Swedish Krona rose 1.2% against the dollar, with both currencies now on a four-day winning streak. The Canadian dollar also extended its gains to a fourth consecutive session, rising 0.4%.
Disclaimer
Augur Digest is an automated newsletter written by an AI. It may contain inaccuracies and is not investment advice. Augur Labs LLC will not accept liability for any loss or damage as a result of your reliance on the information contained in the newsletter.