- United States
- Canada
- The Eurozone
- Europe
- Japan
- Asia-Pacific
- China
- Emerging Markets
- Equities
- Rates
- Energy
- Commodities
- Global Developments
- Cryptocurrency
United States
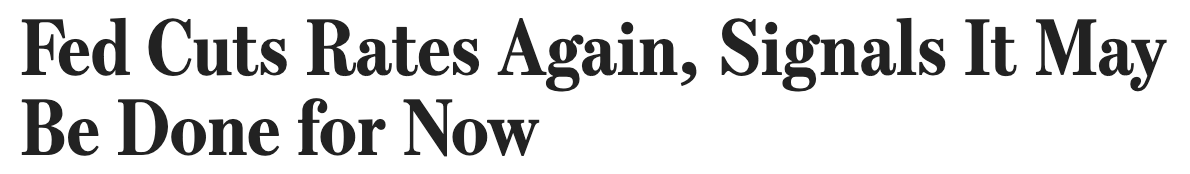
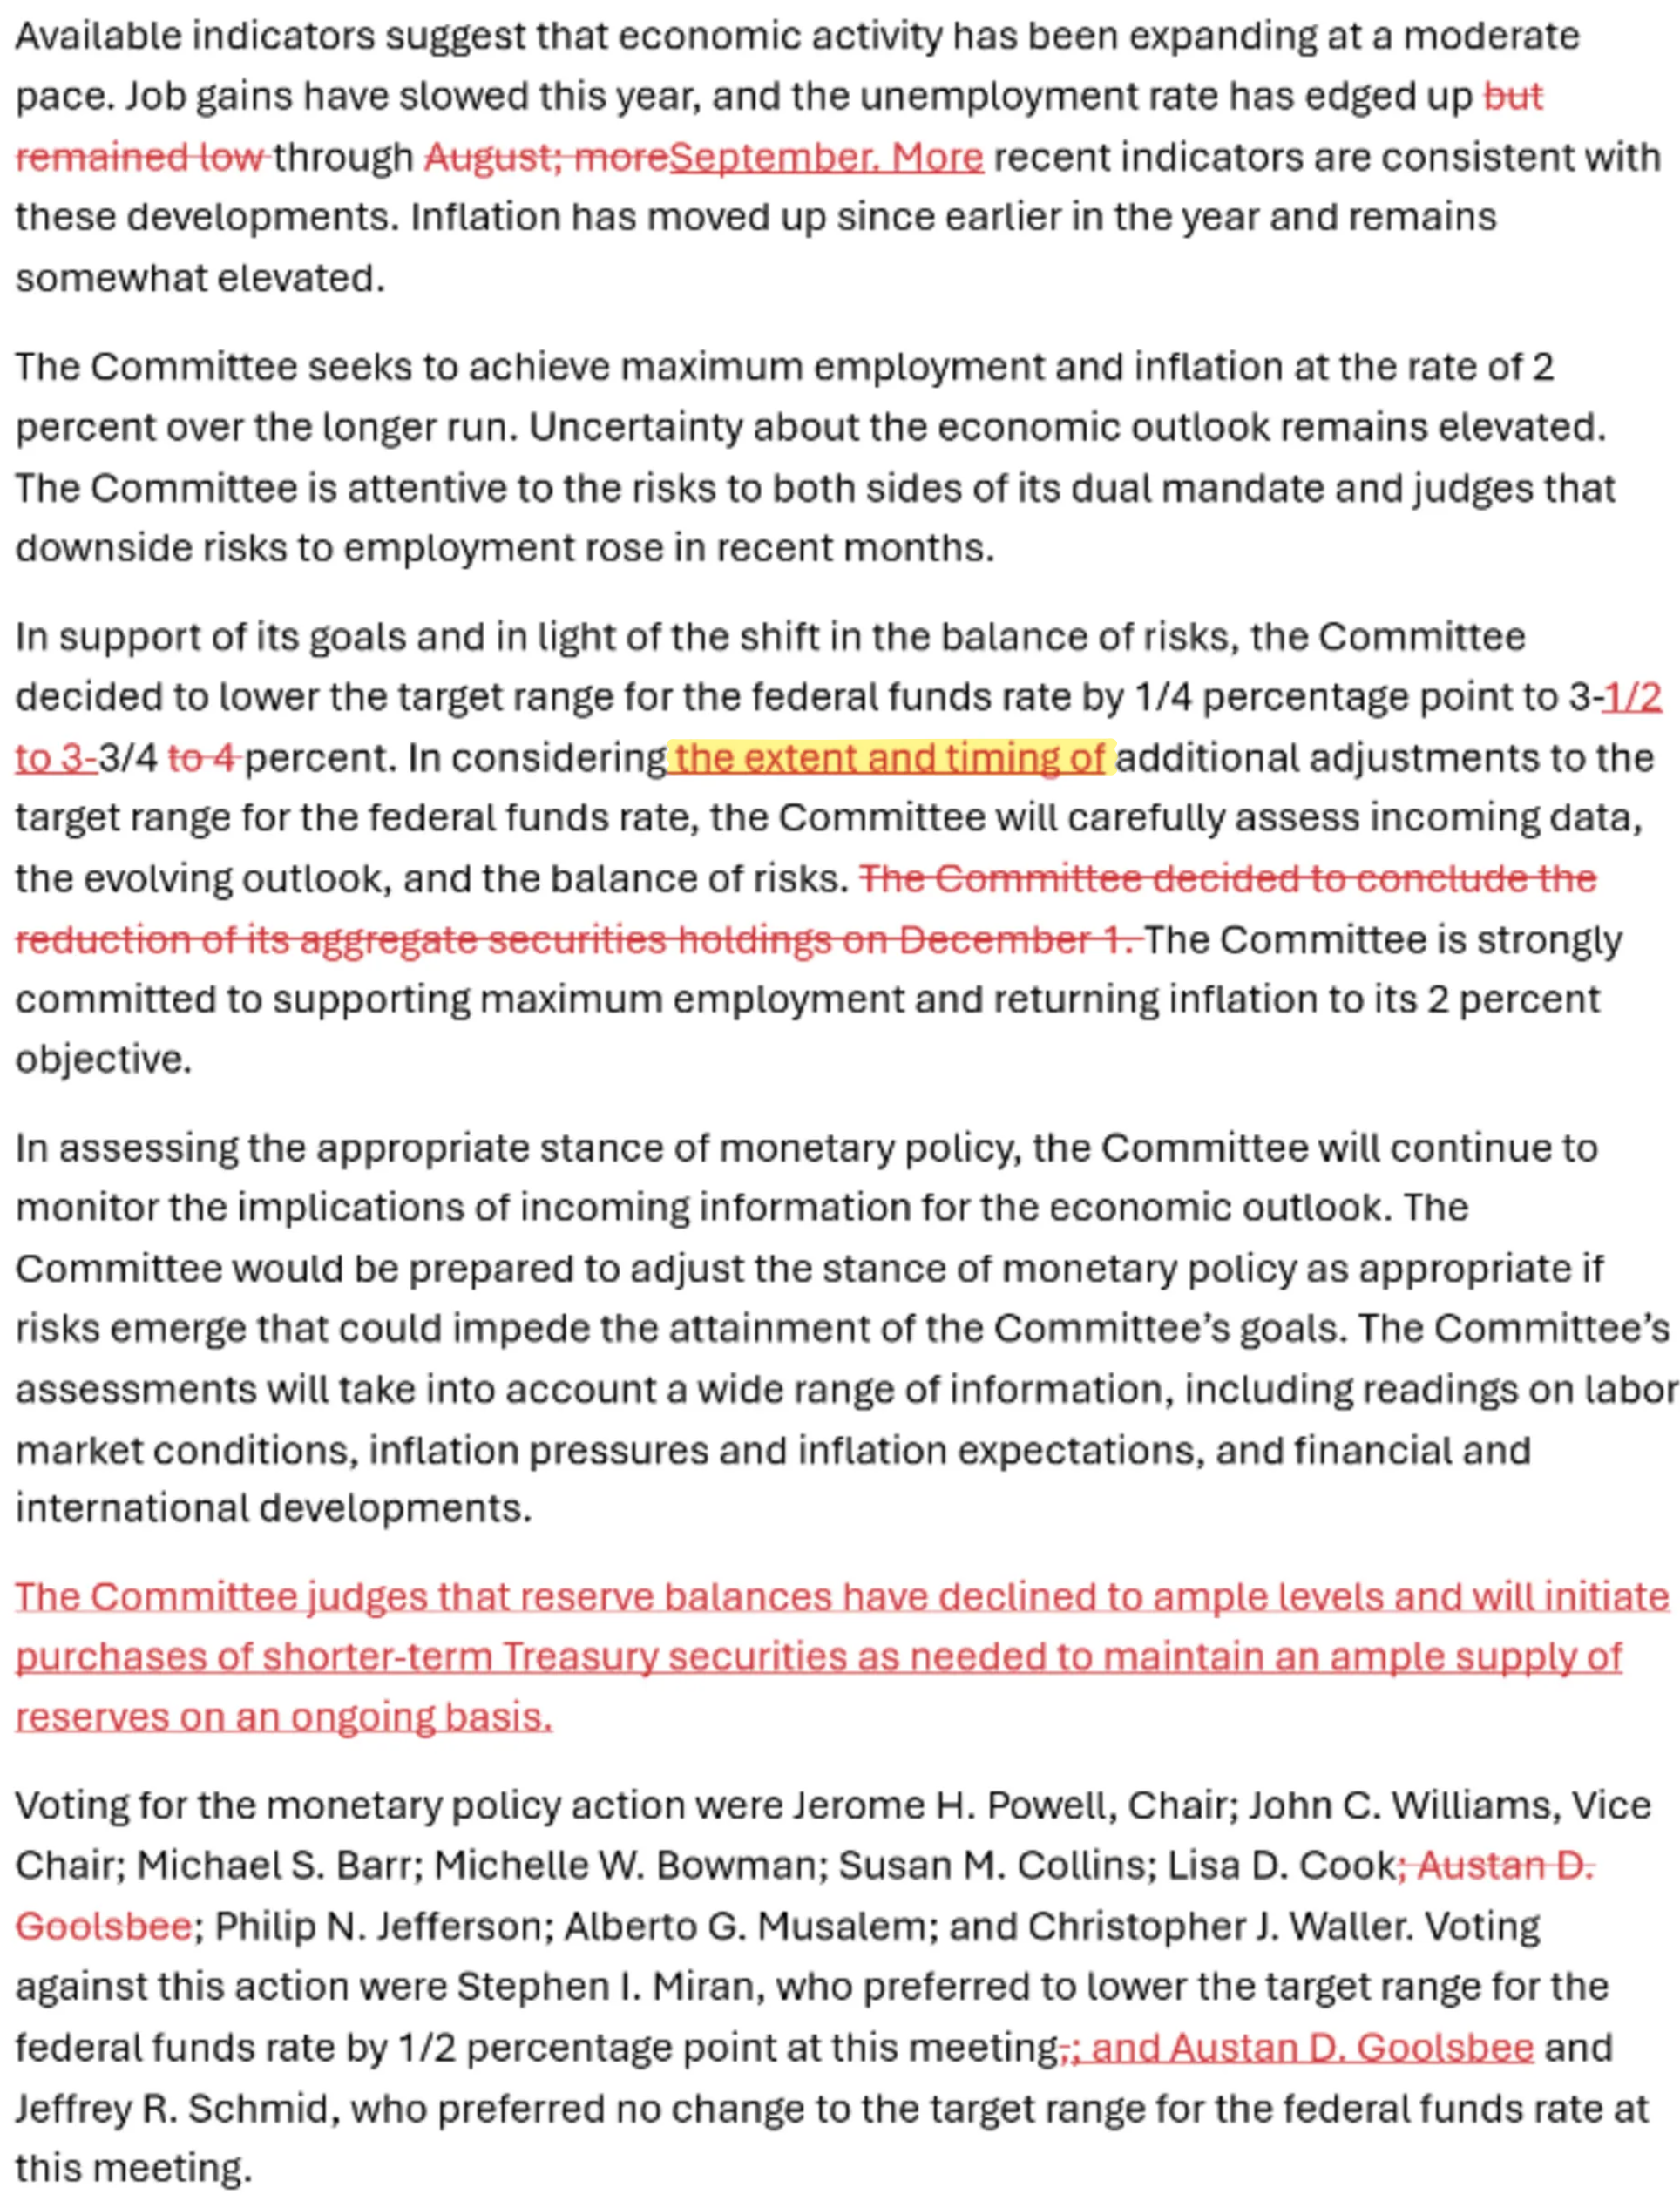
- The FOMC delivered a third consecutive rate cut, lowering the range for Fed funds target to 3.5%–3.75%, in line with consensus.
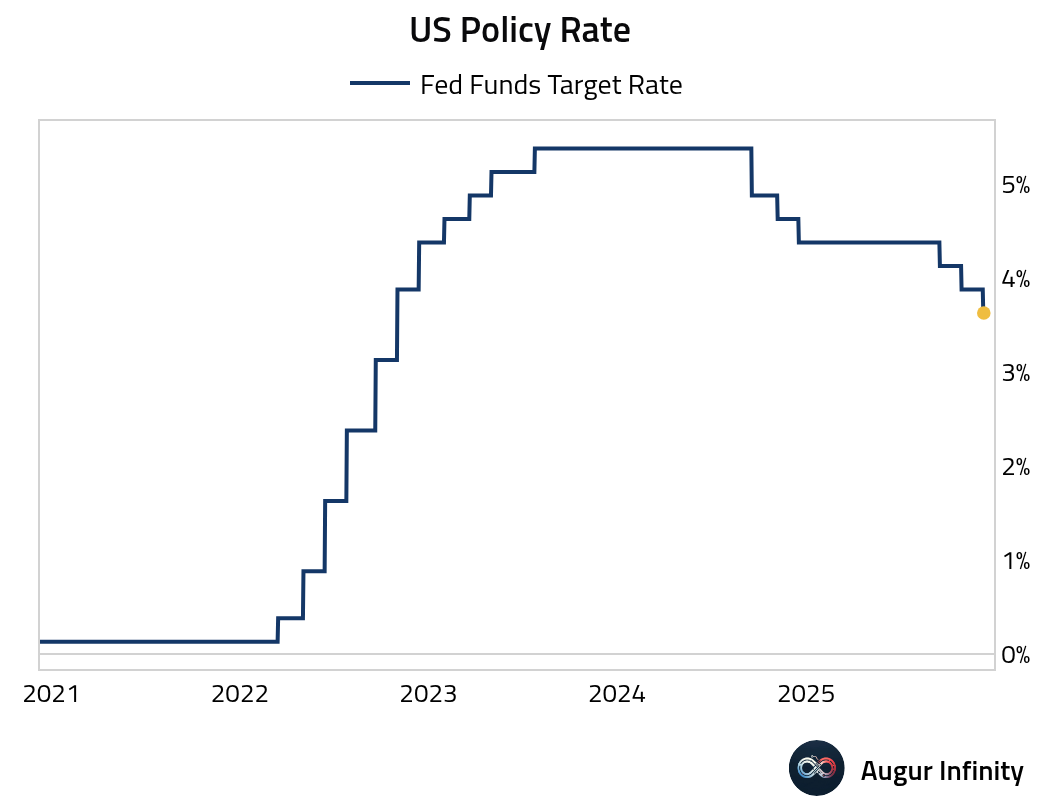
Source: @WSJ
In addition, the Fed will begin buying $40 billion in Treasury bills per month starting on December 12 to rebuild bank reserves. Officials emphasized the purchases are strictly for reserve management and do not signal a return to quantitative easing, with the pace expected to ease after April.
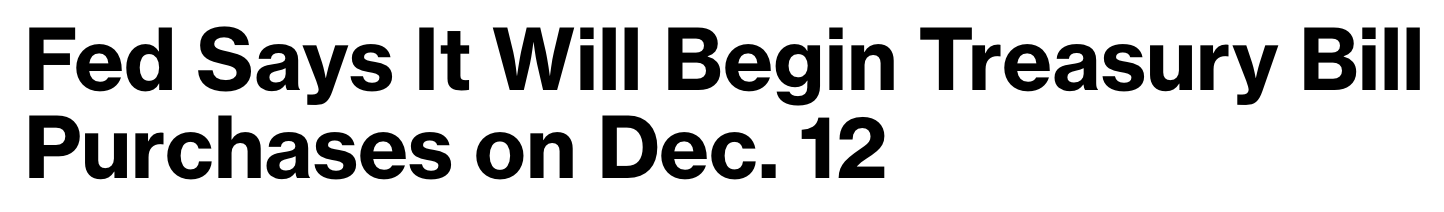
Source: @economics
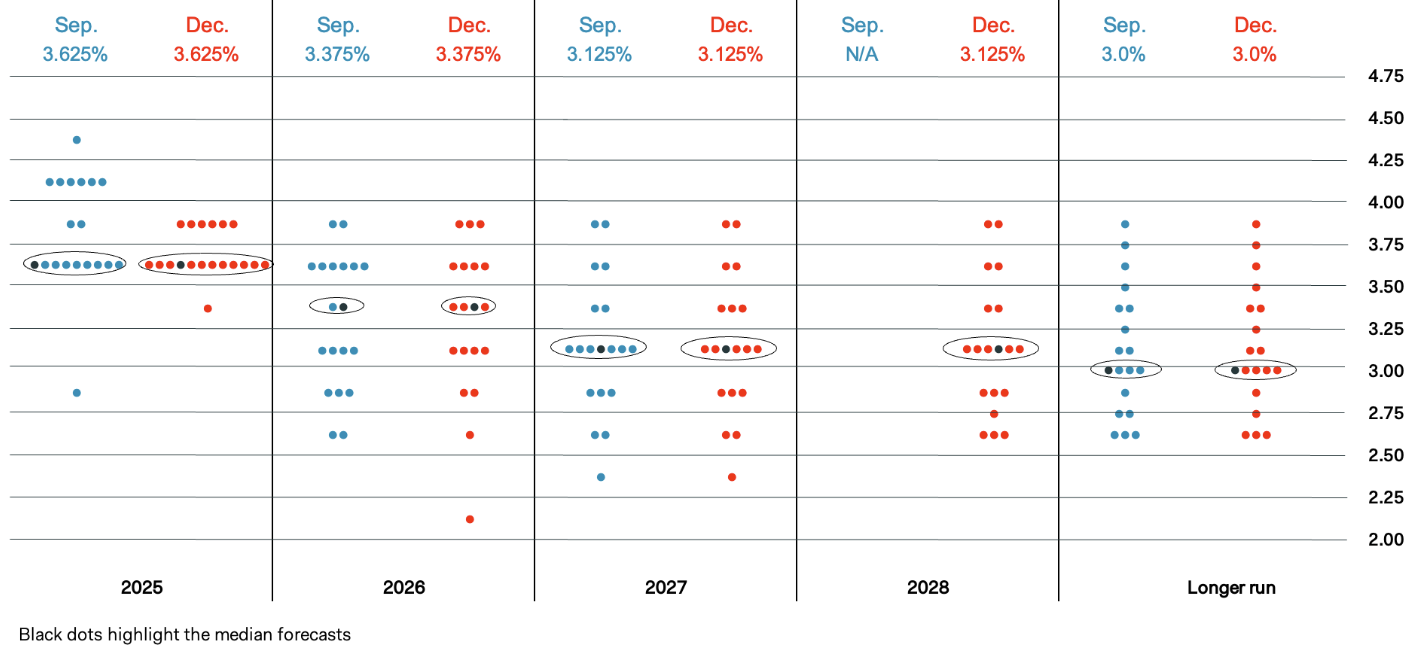
There were three dissents at the meeting: two Fed presidents (Austan Goolsbee and Jeff Schmid) preferred to keep rates unchanged, while Govenor Steephen Miran dissented in favor of a 50 bps cut. This brings the total dissents this year to nine, the highest since 2013. Further, six participants indicated via their "dots" that they would have preferred unchanged policy rate at this meeting.
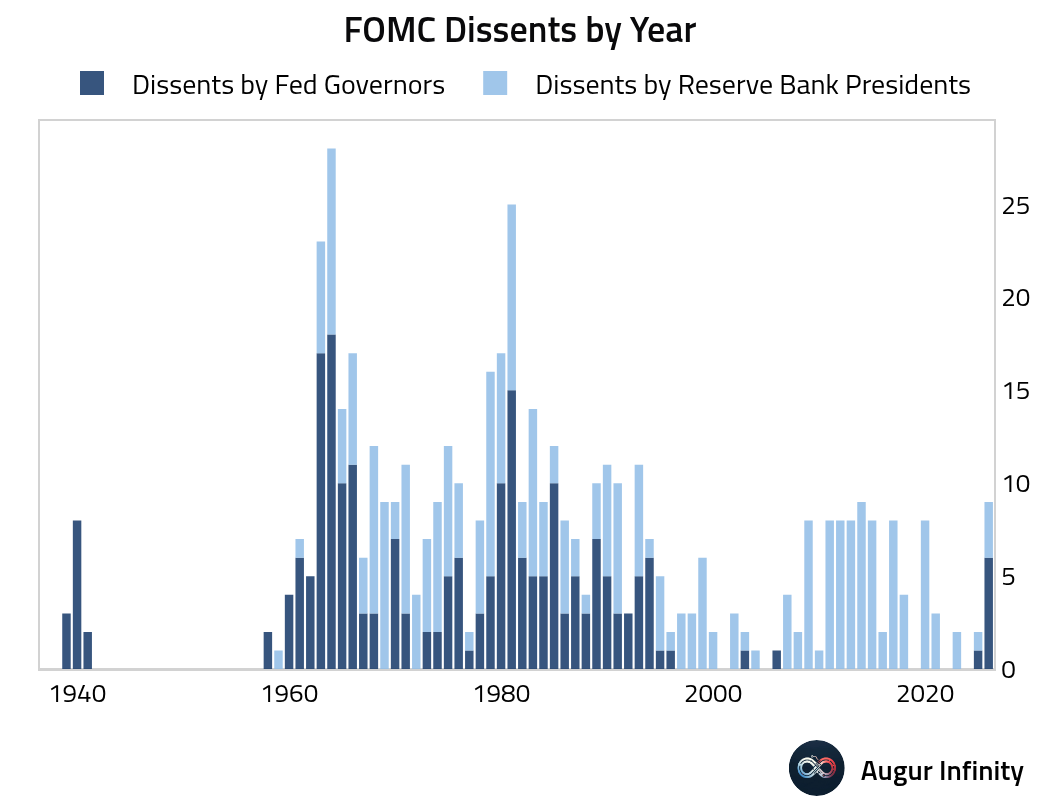
Source: Pantheon Macroeconomics
The only material change in the FOMC statement was the insertion of “extent and timing,” the language used a year ago, when the easing cycle was paused for nine months.
Source: CNBC
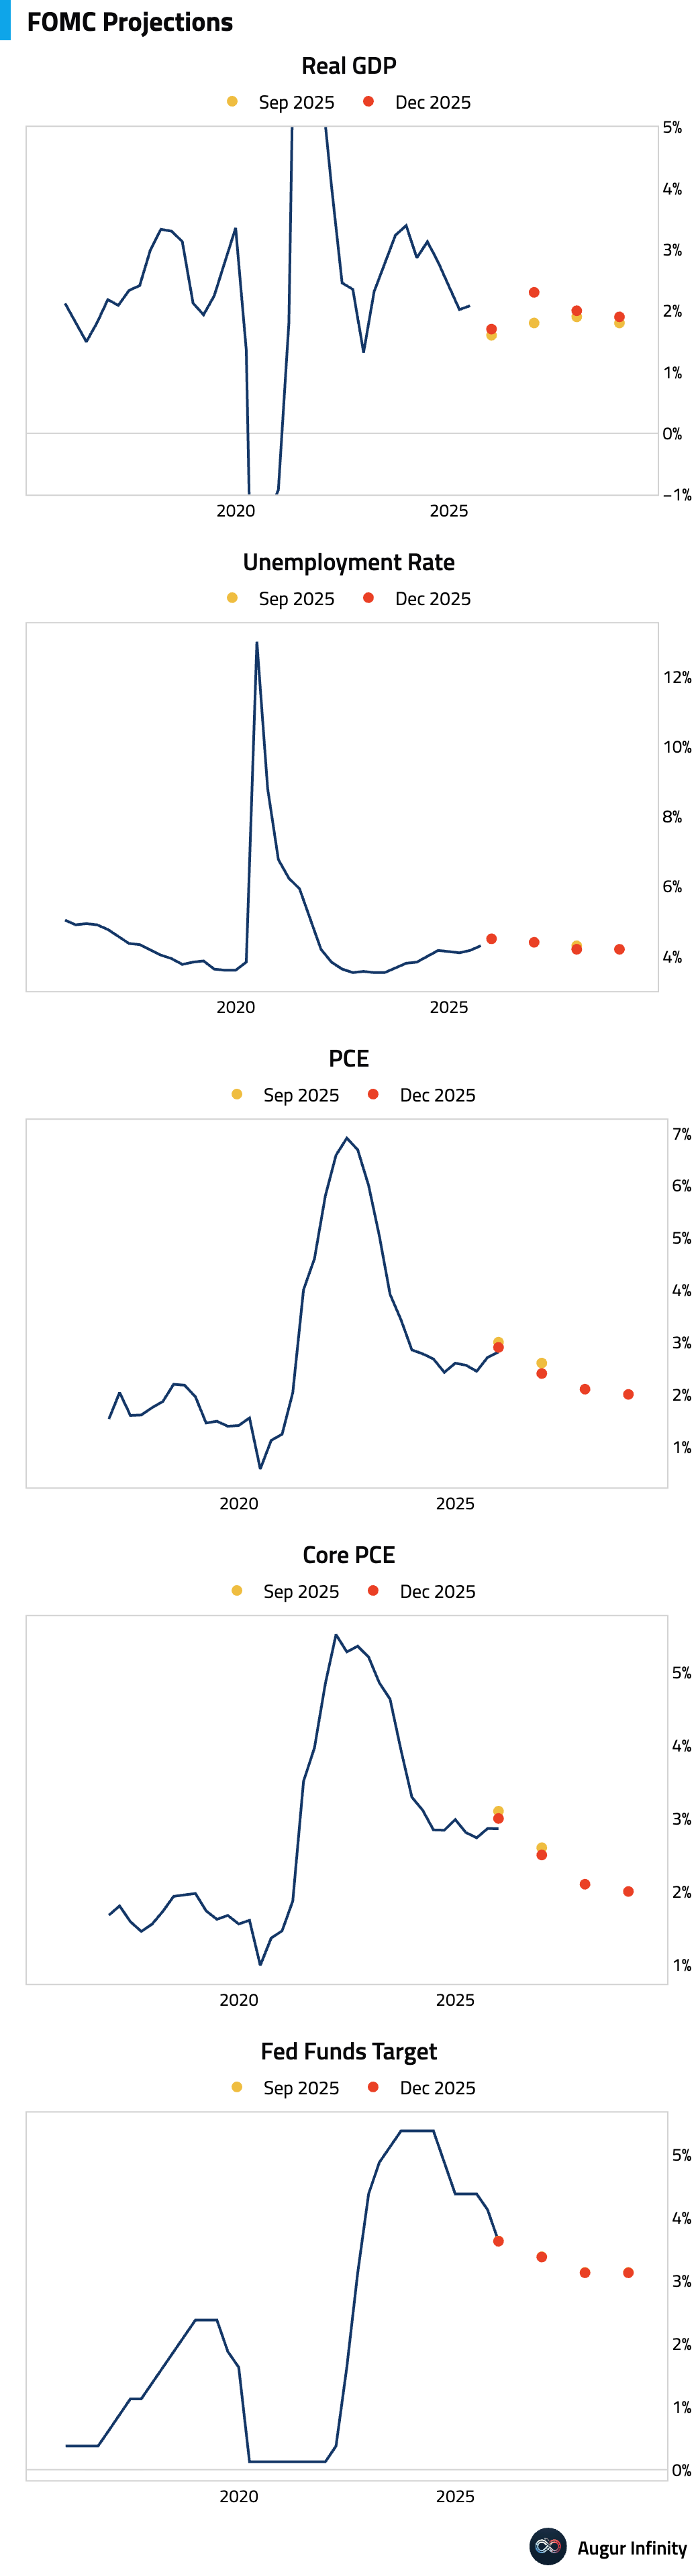
The Summary of Economic Projections points to improved growth prospects, slightly lower inflation, while the median rate path was unchanged, with one rate cut penciled in for 2026.
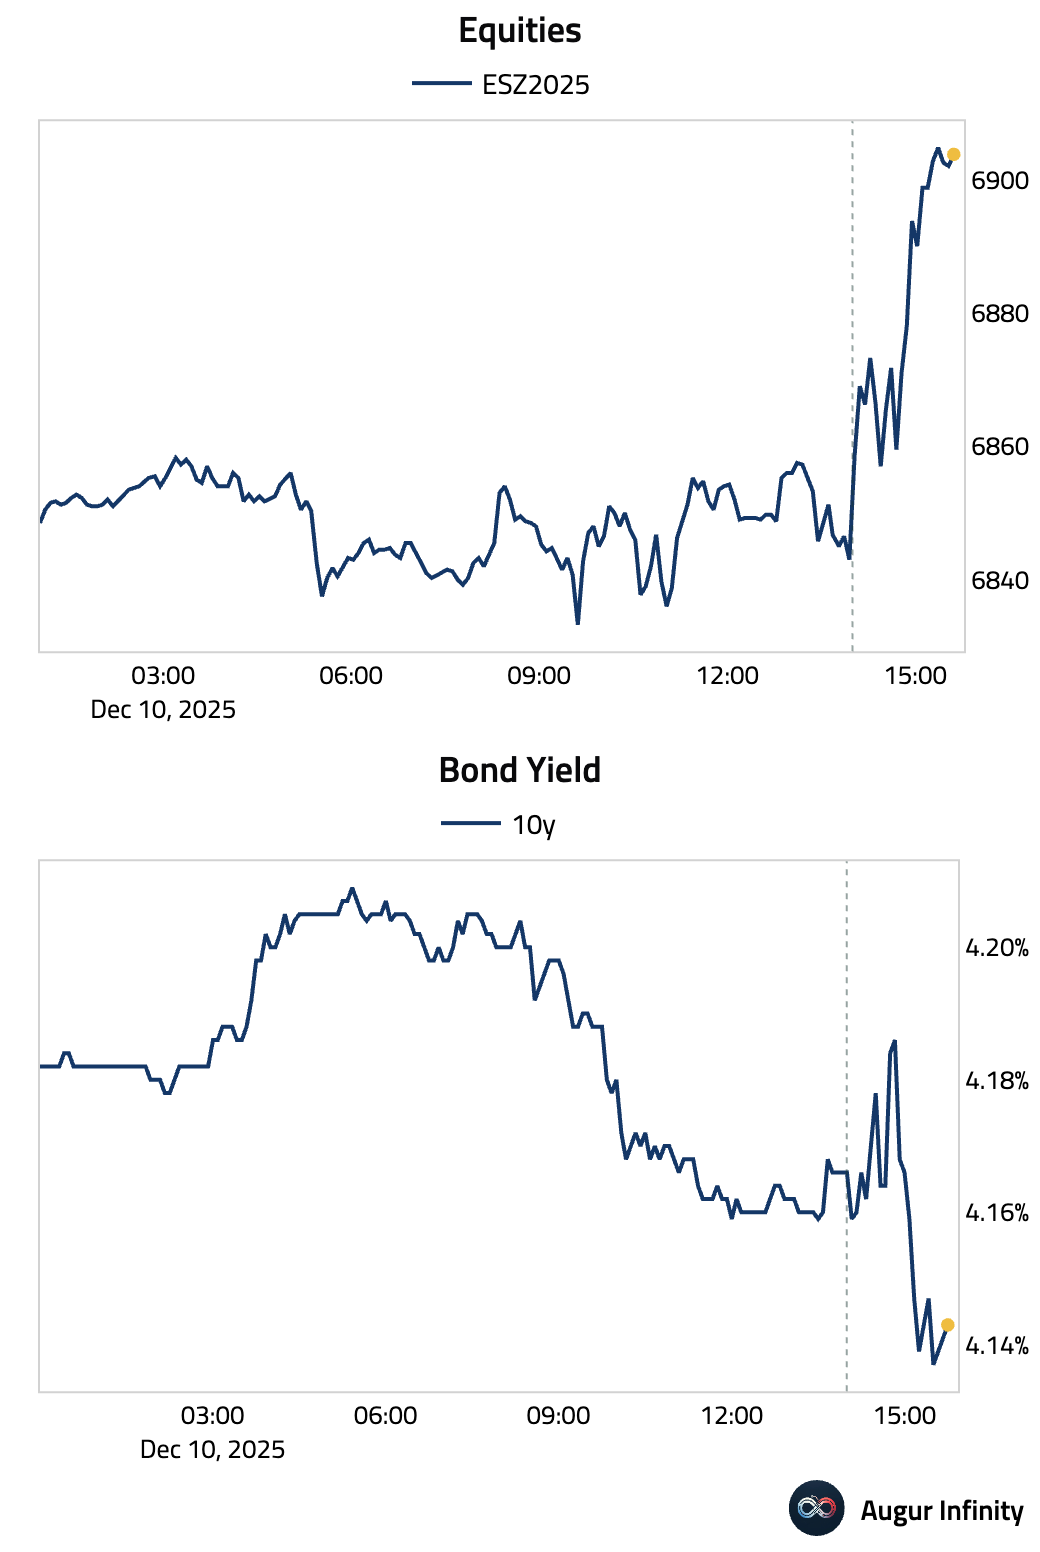
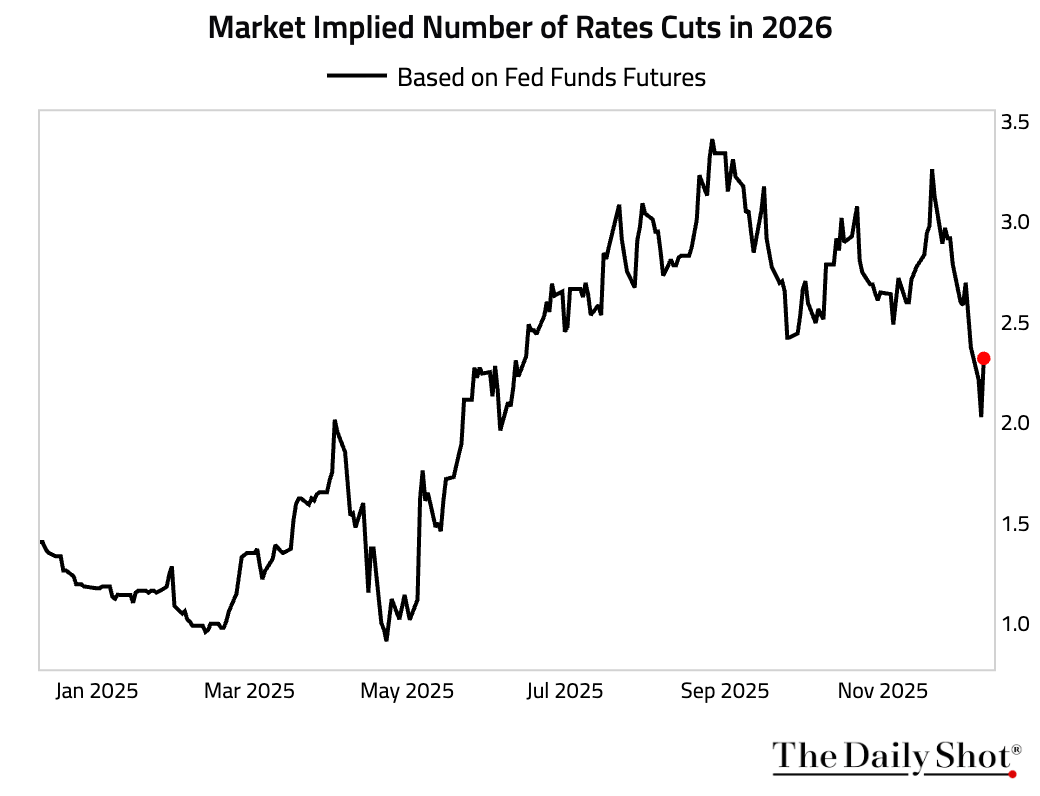
Equity markets rallied while bond yields declined.
The market's implied number of rate cut for 2026 increased.
- The Employment Cost Index decelerated, with notable weakness in professional services and leisure offsetting strength in the trade and construction sectors.
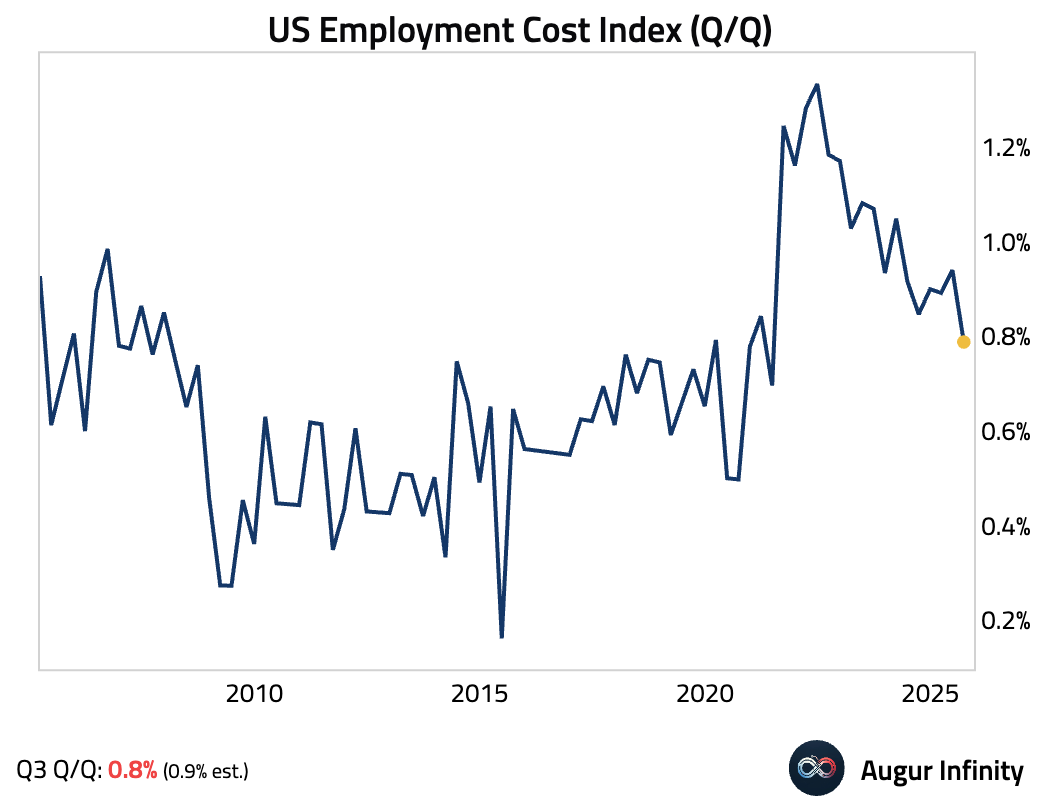
Leading indicators such as NFIB survey and quits rate point to a further deceleration ahead (2 charts).
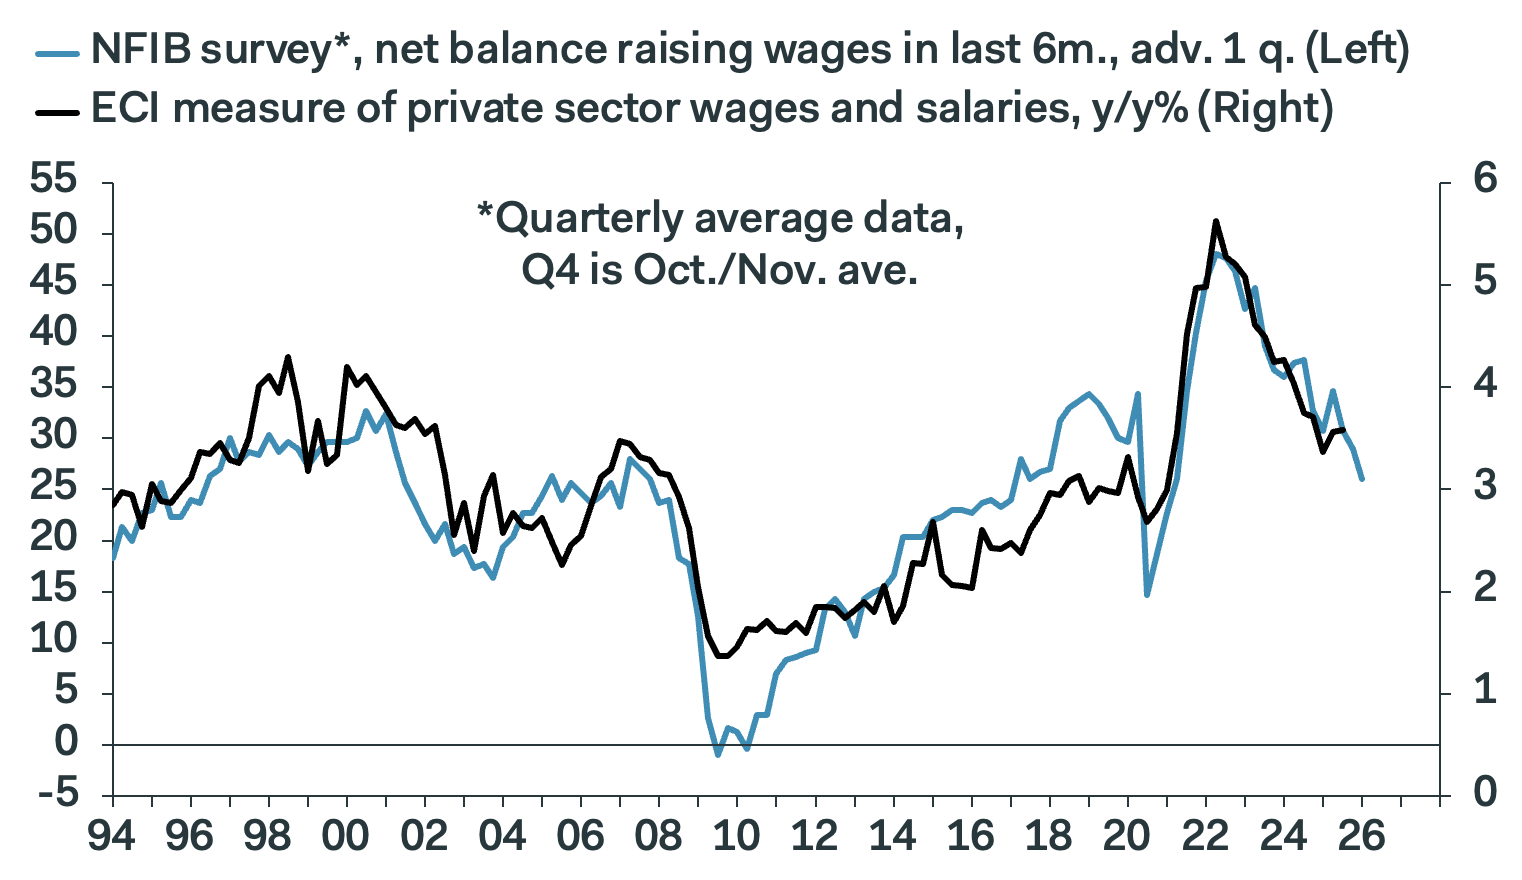
Source: Pantheon Macroeconomics
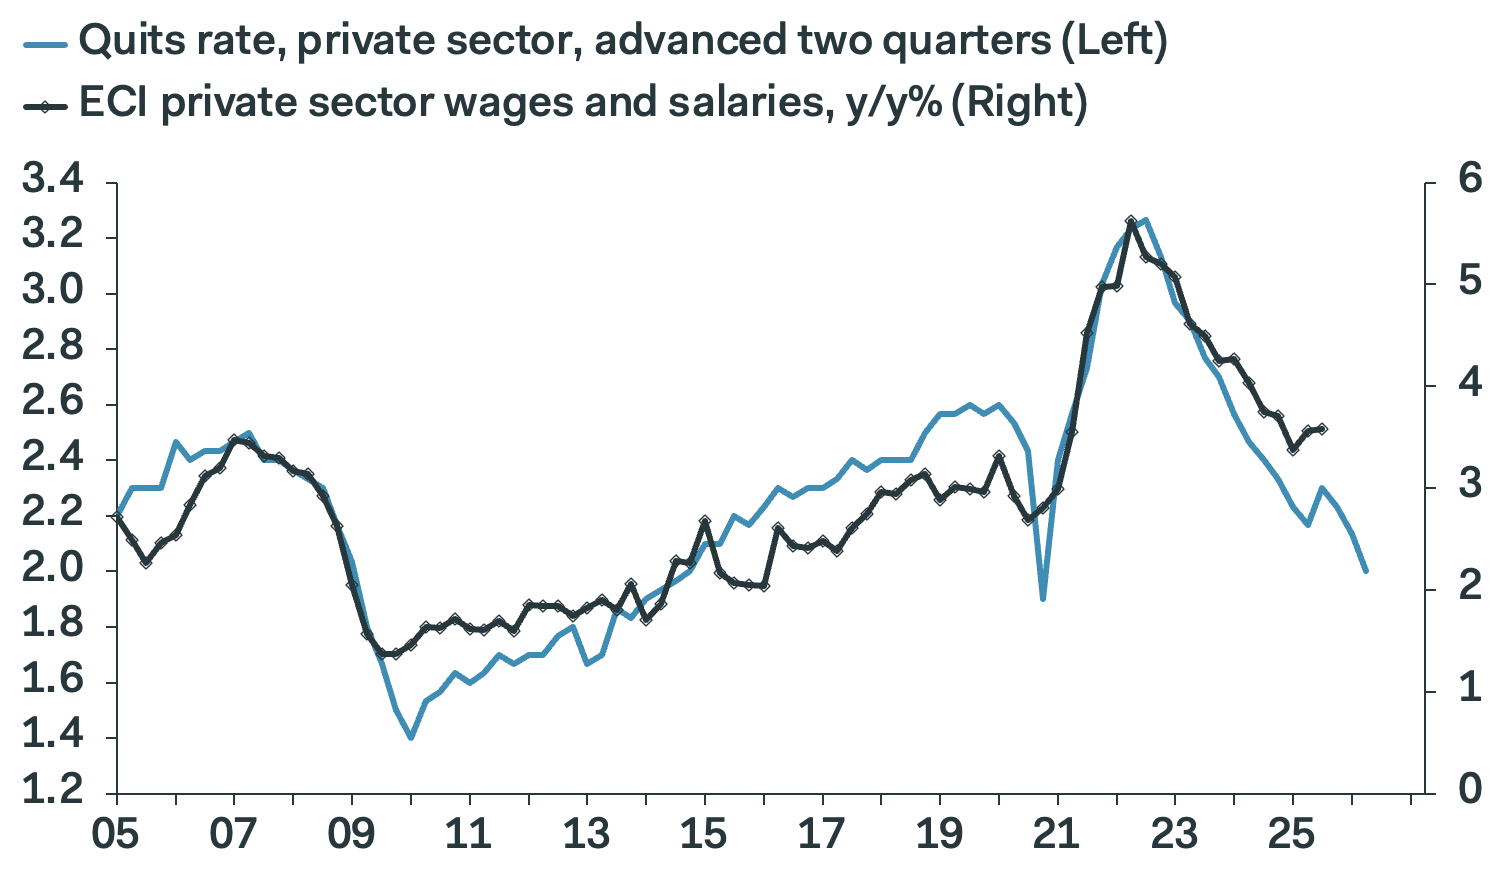
Source: Pantheon Macroeconomics
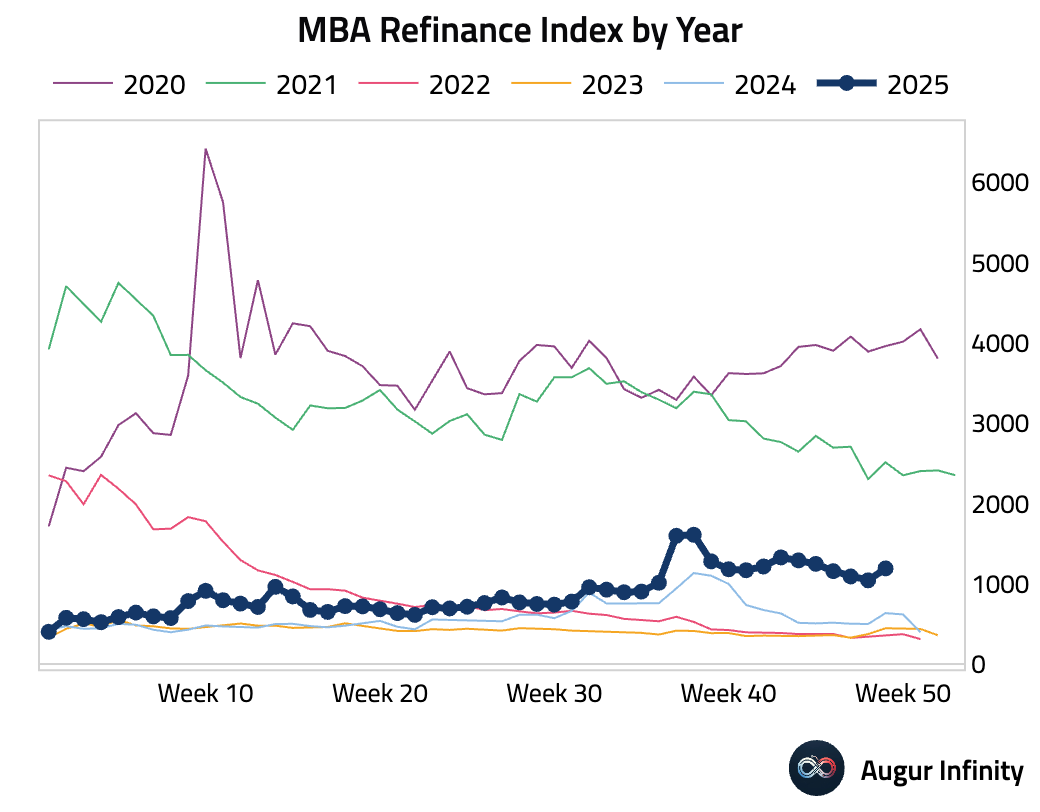
- Mortgage applications fell as the 30-year fixed mortgage rate ticked up.
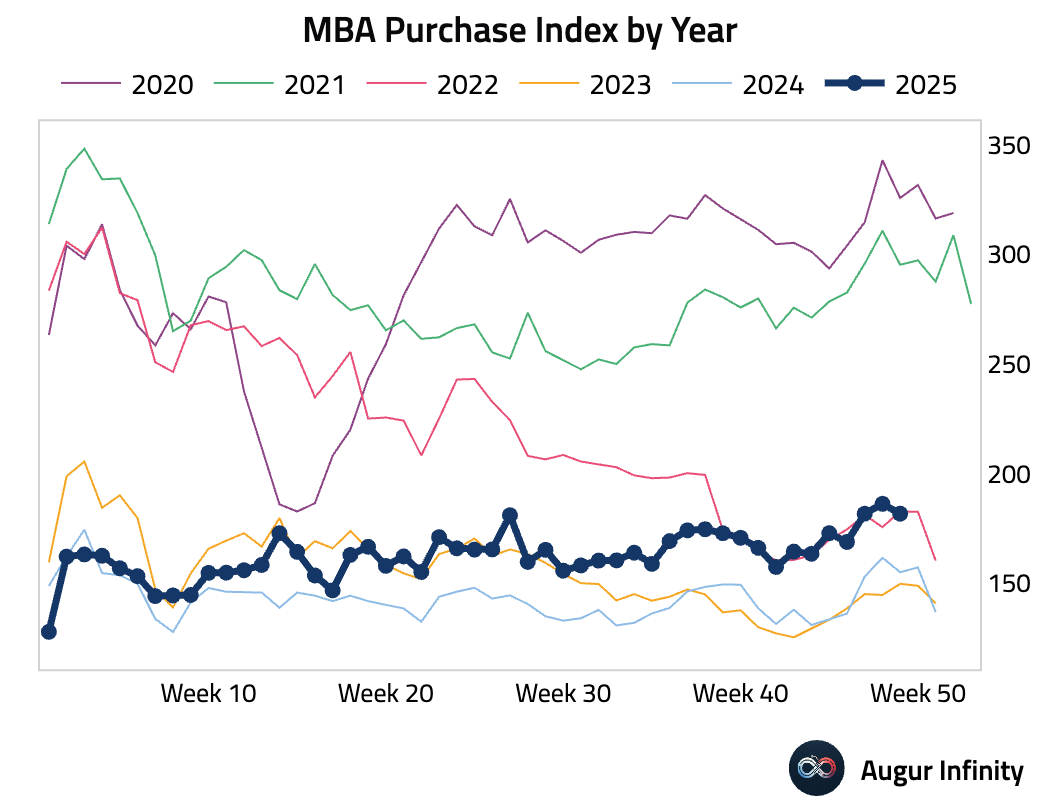
Refinancing activity improved.
- Bank of America card data show household spending growth slowed to 1.3% Y/Y in November from 2.4% in October, with seasonally adjusted spending flat after five consecutive monthly gains. This signals a moderation in consumer momentum heading into year-end.
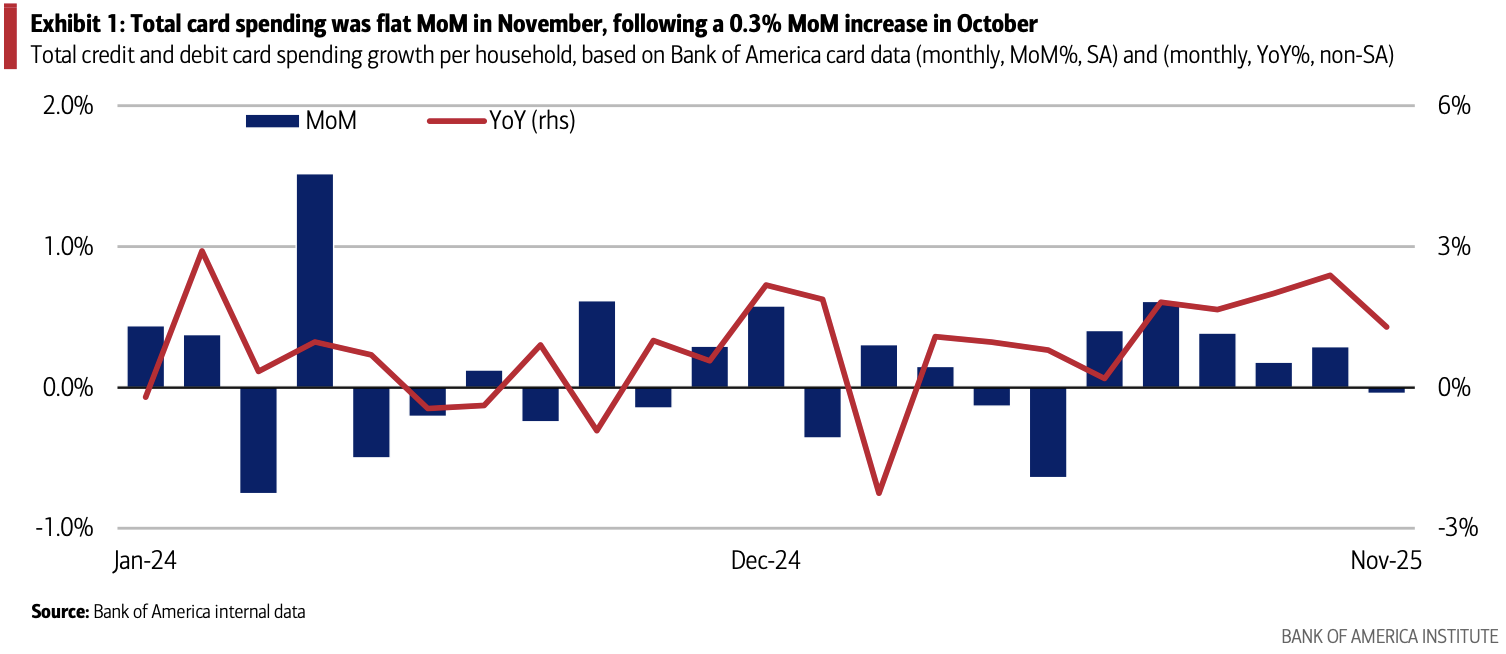
Source: Bank of America Institute
Spending trends remain K-shaped, with lower-income households posting the weakest spending growth, while spending growth for higher-income households remained solid.
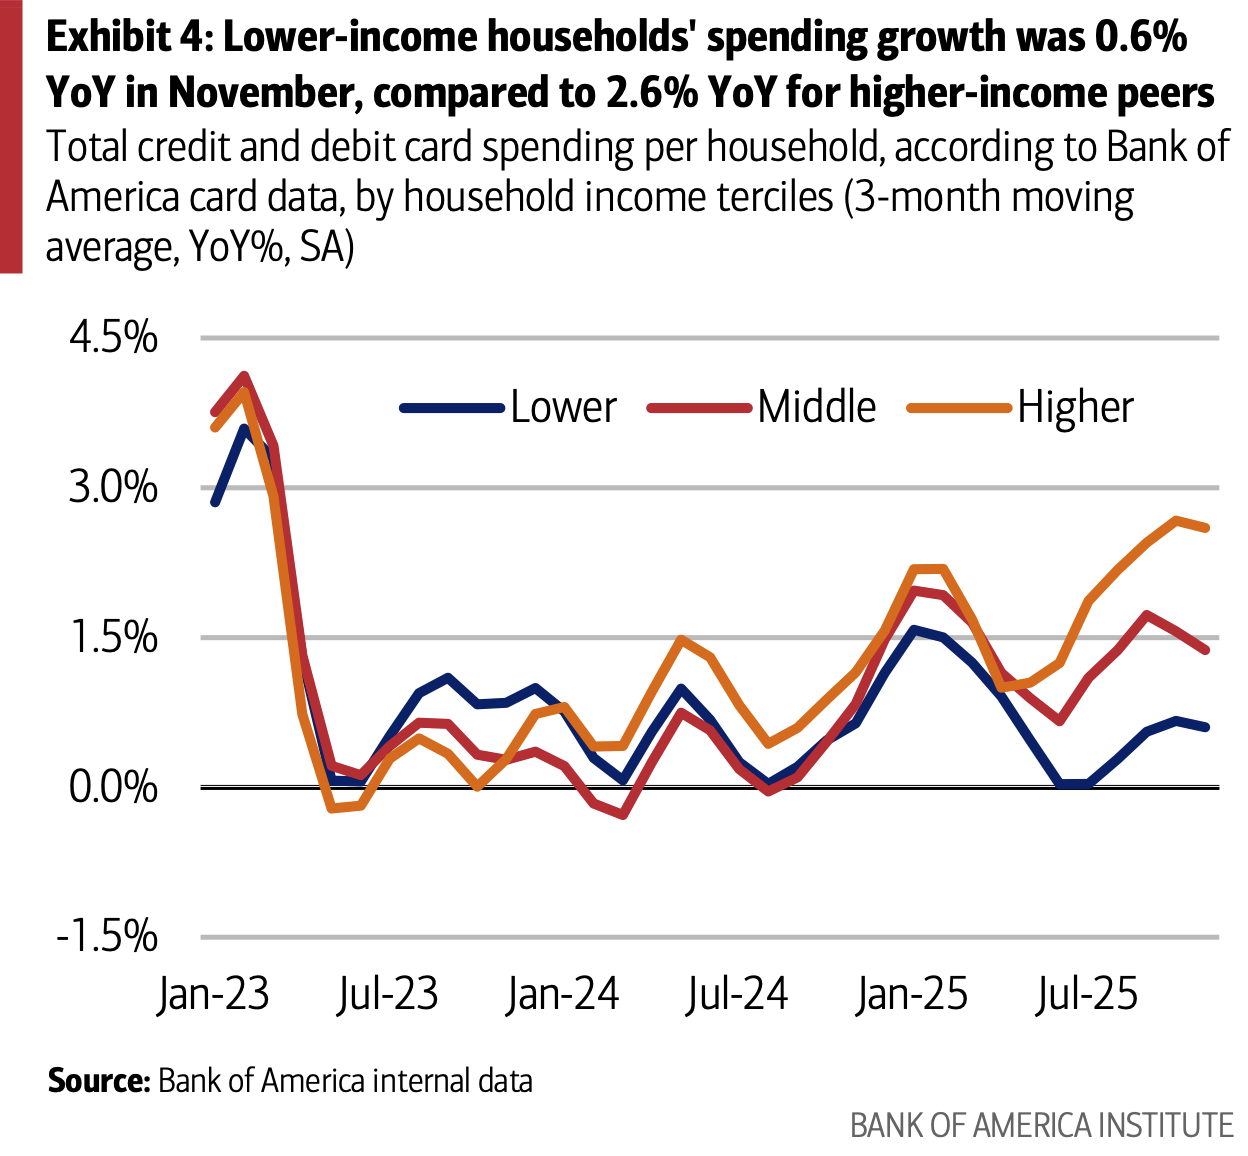
Source: Bank of America Institute
Canada
- The Bank of Canada left its policy rate unchanged at 2.25%, citing a resilient economy despite U.S. tariffs and recent trade volatility.
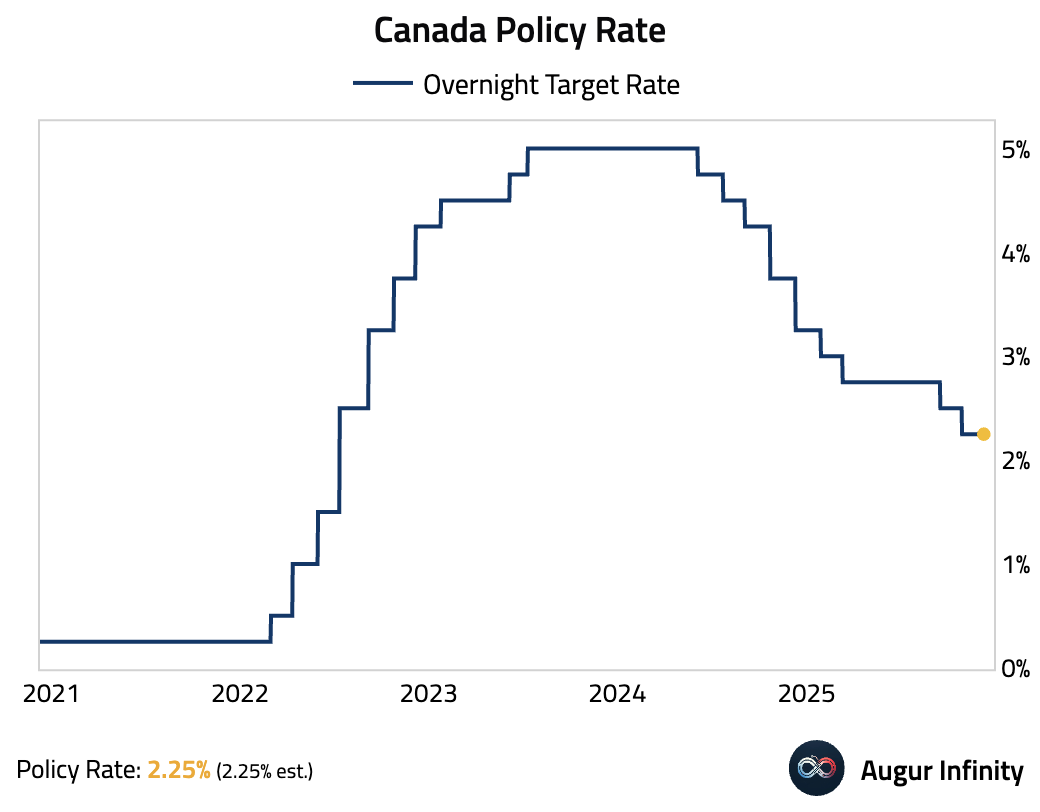

Source: Reuters
The Eurozone
- ECBspeak hawk-dove tracker has been edging hawkish for some months, and is at its most hawkish level since February 2024.
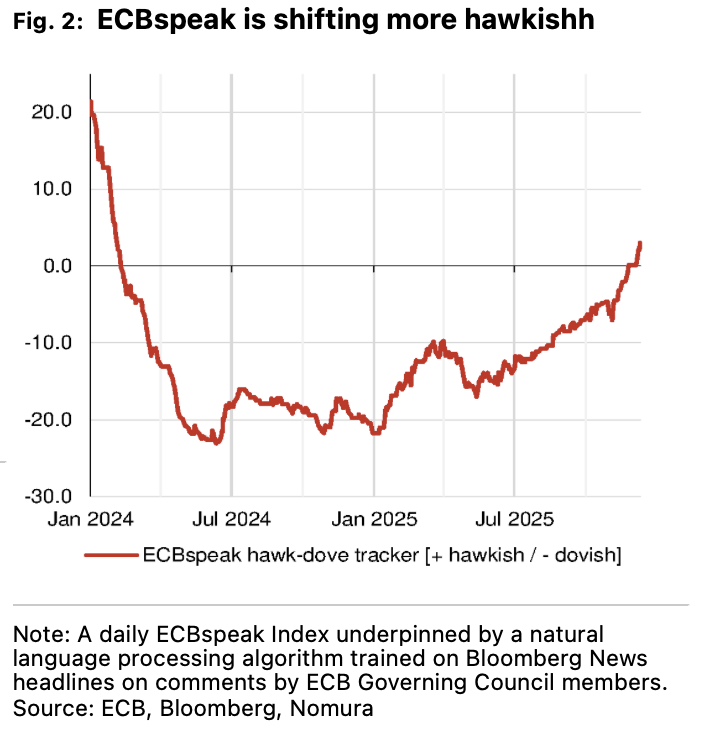
Source: Nomura Securities
- Early Q4 data suggests upside to Germany’s economy.
The October goods trade data suggest that net trade in goods will boost GDP this quarter.

Source: Pantheon Macroeconomics
Pantheon Macroeconomics’ nowcast model suggests an increase in GDP in Q4 after stagnation in Q3.
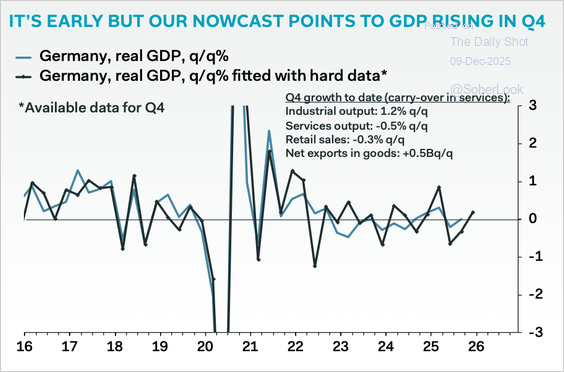
Source: Pantheon Macroeconomics
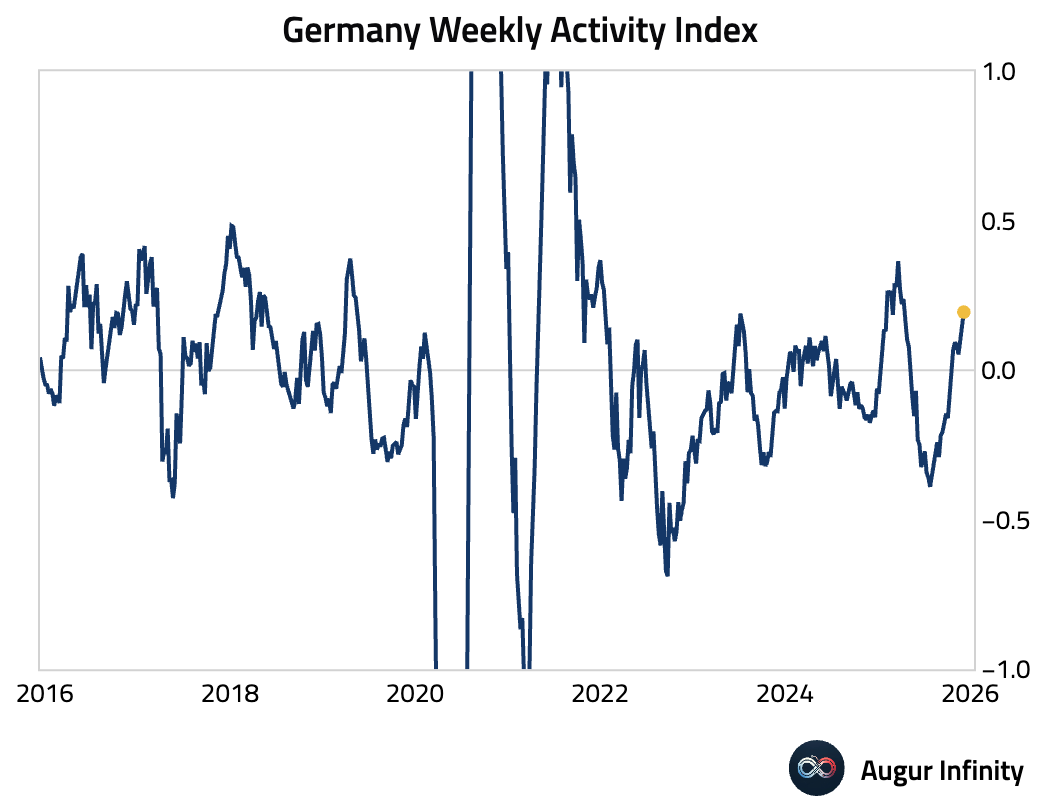
The Weekly Activity Index has been positive for eight straight weeks.
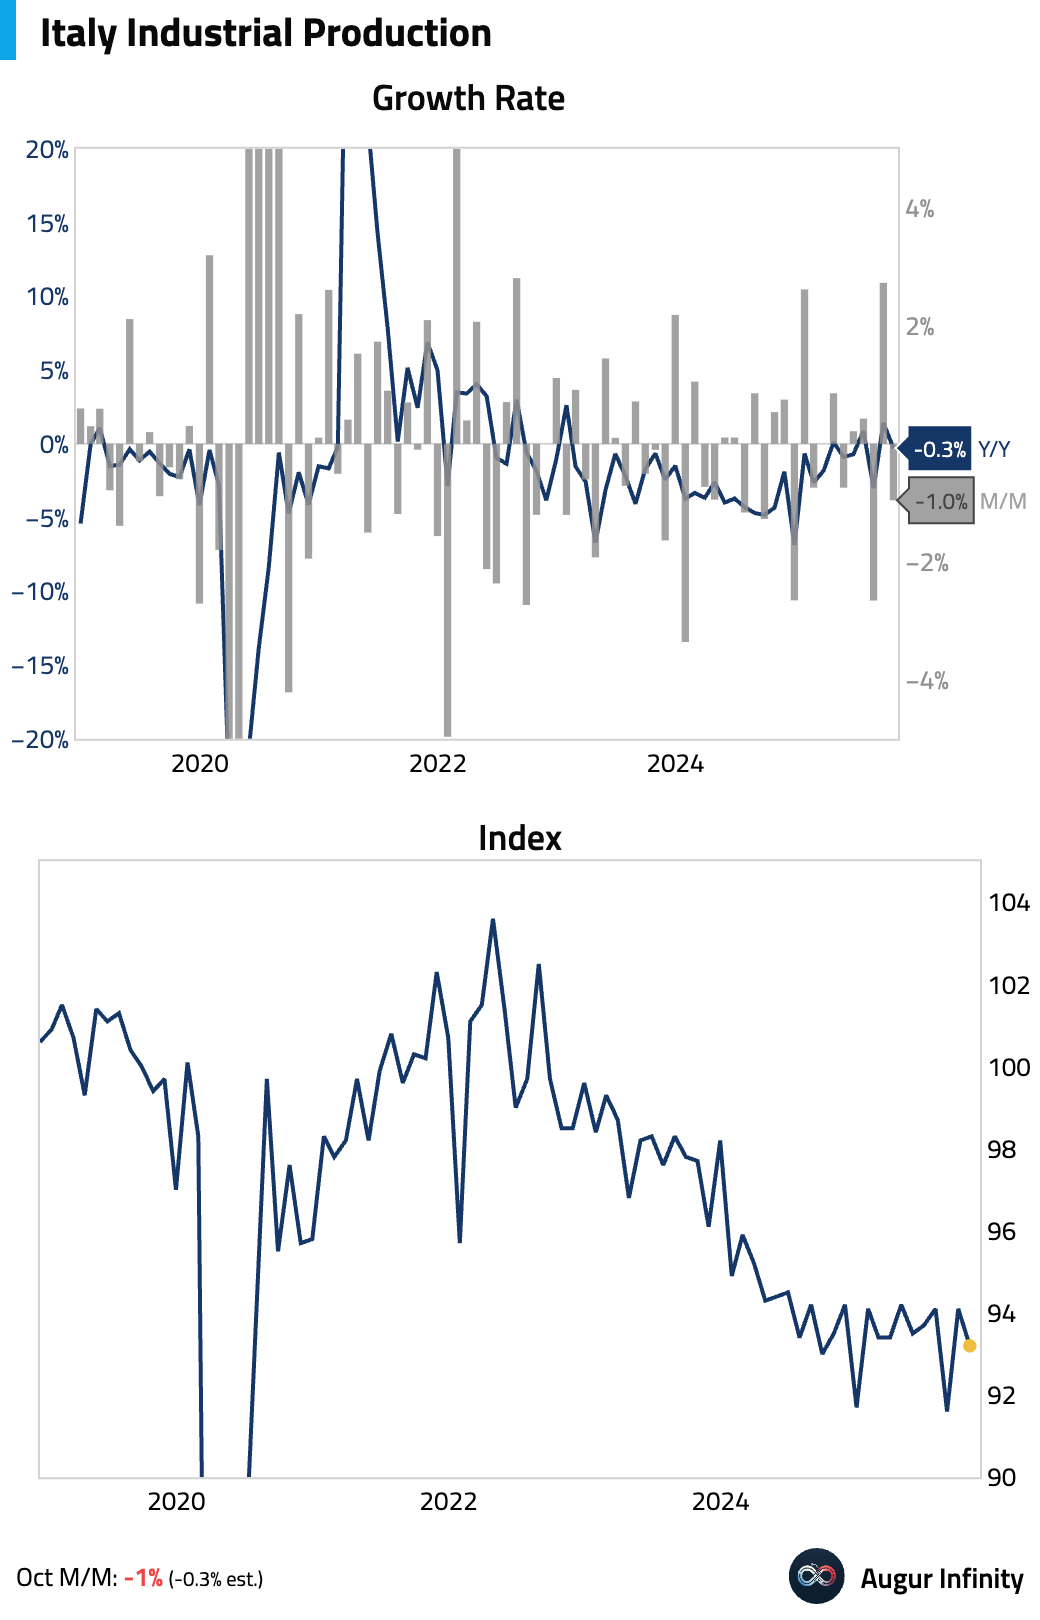
- Italian industrial production unexpectedly contracted in October, driven by broad-based weakness across consumer goods, intermediate goods, and capital goods.
Europe
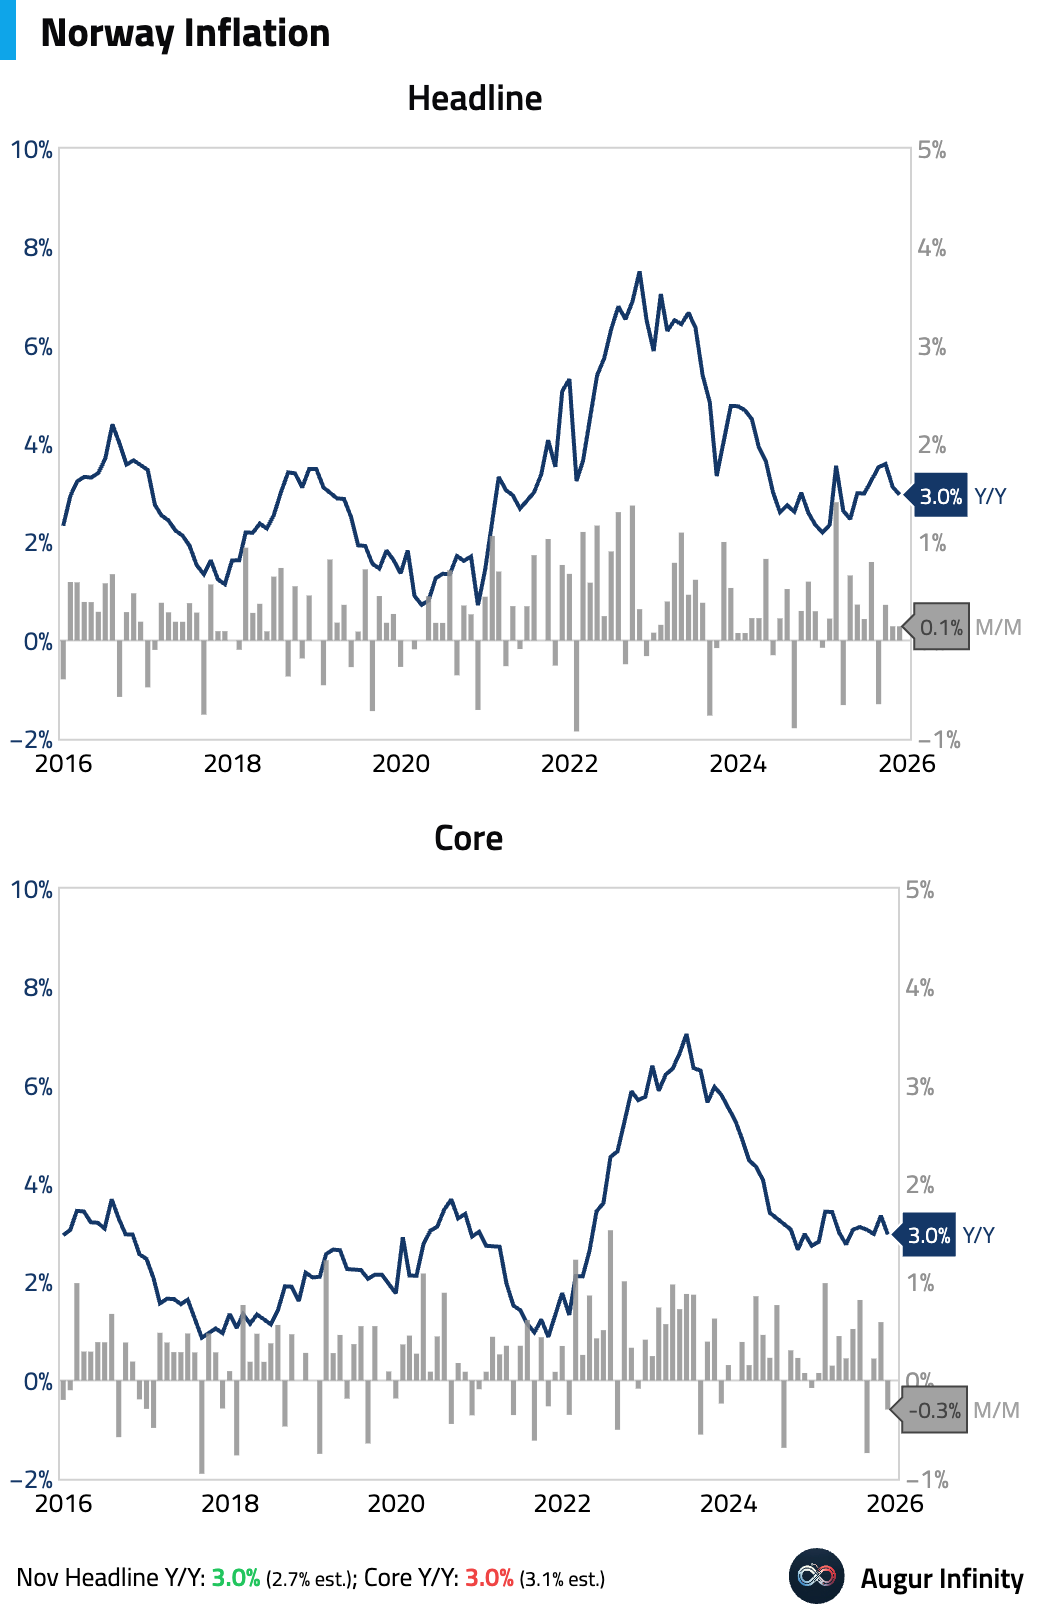
- Inflation in Norway moderated. Headline inflation came in hotter than expected, but core inflation was lower than the consensus forecast.
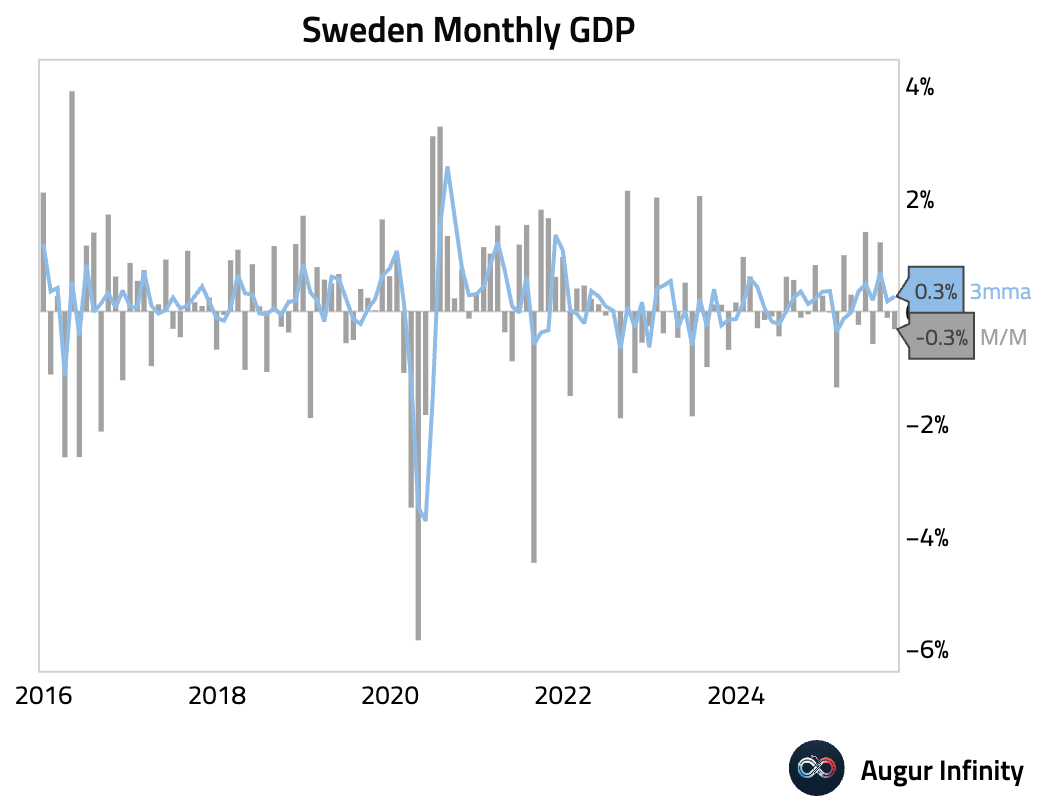
- Sweden’s economy contracted for a second consecutive month, with monthly GDP falling by 0.3%.
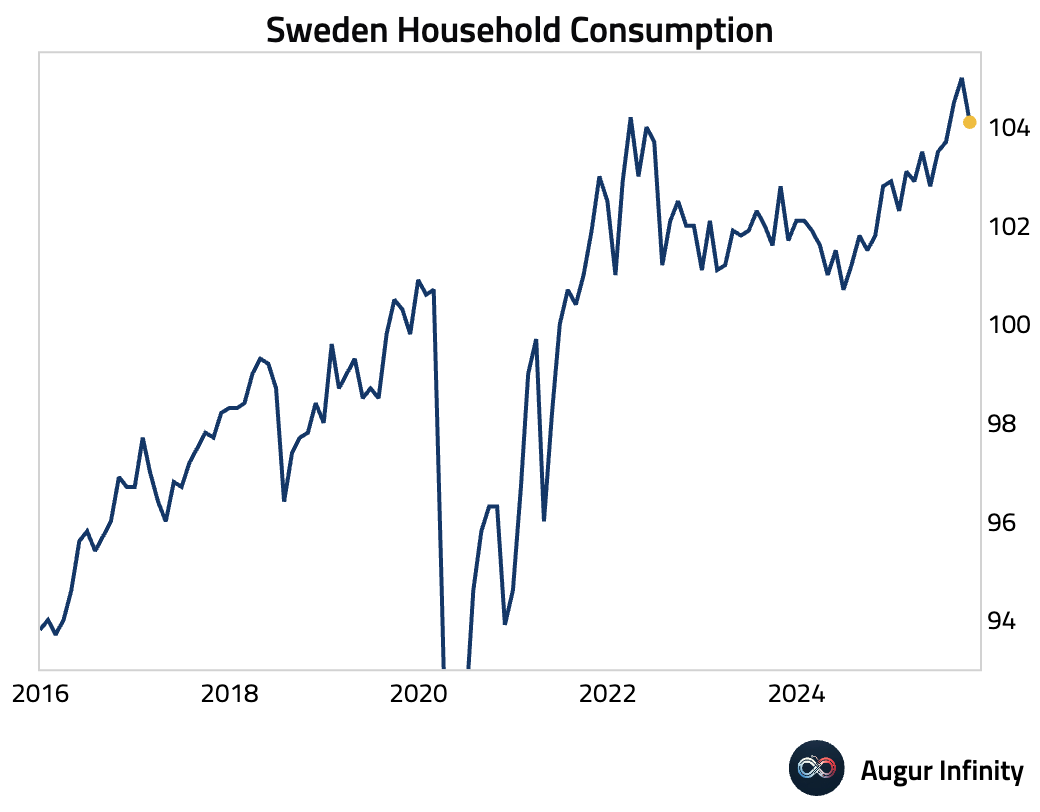
Household consumption weakened.
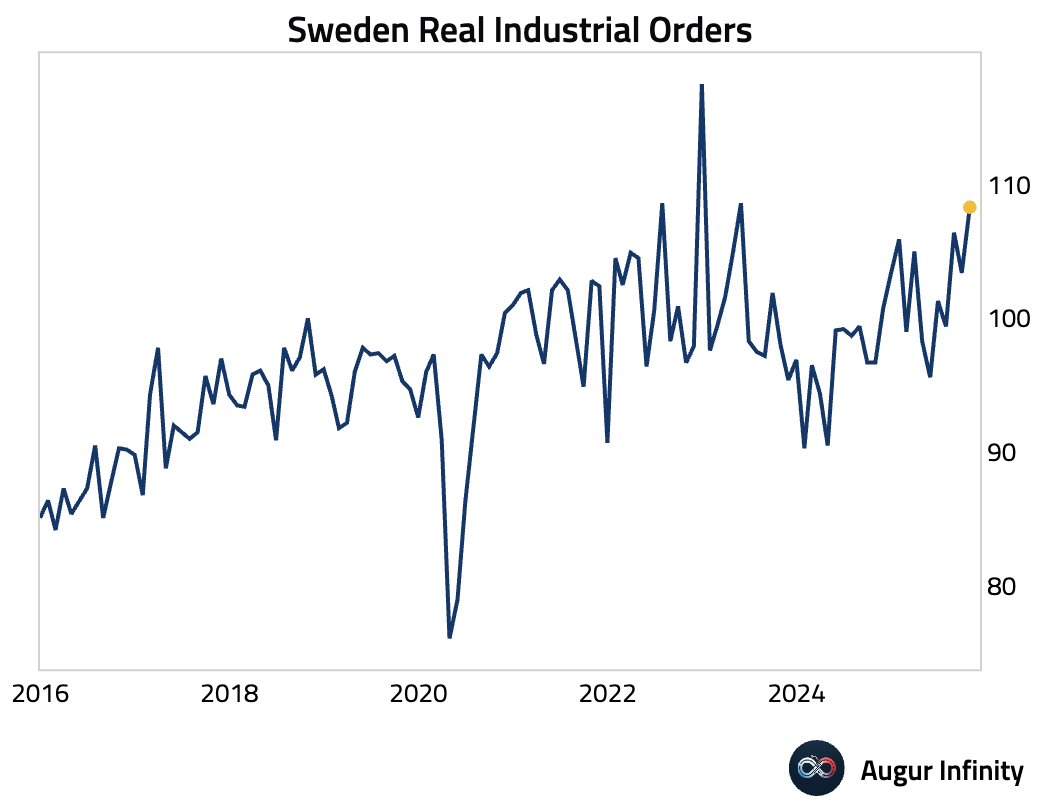
Industrial production fell sharply, …
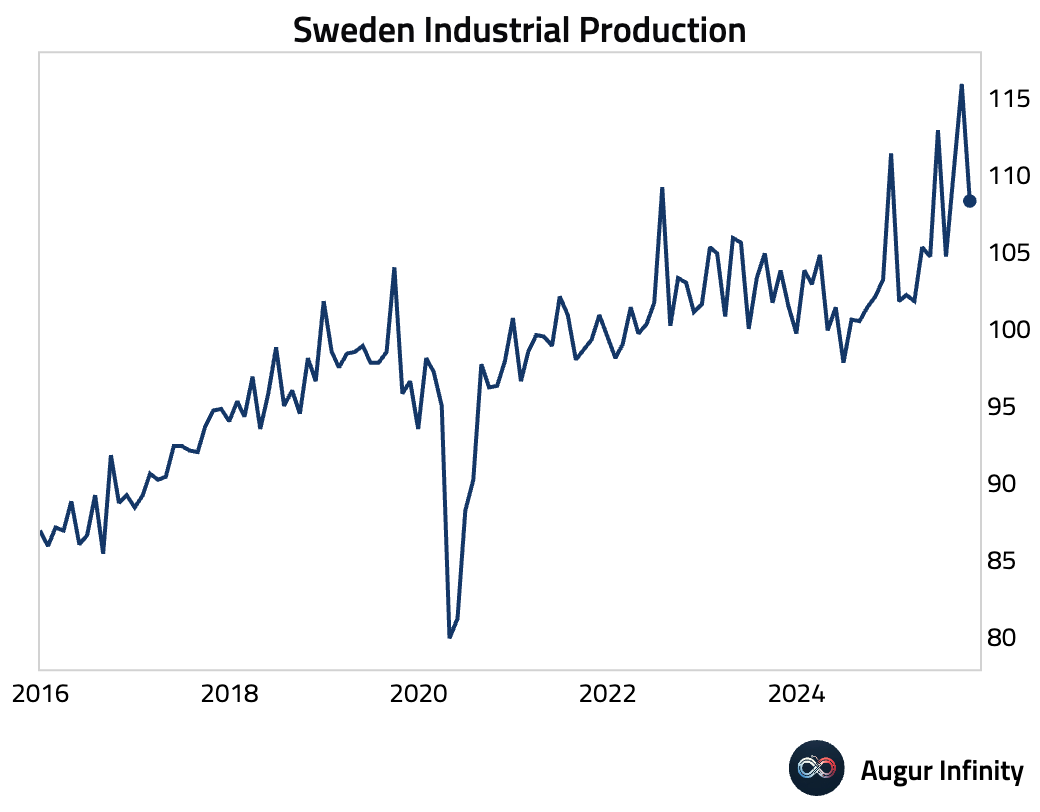
… but new industrial orders accelerated sharply.
Japan
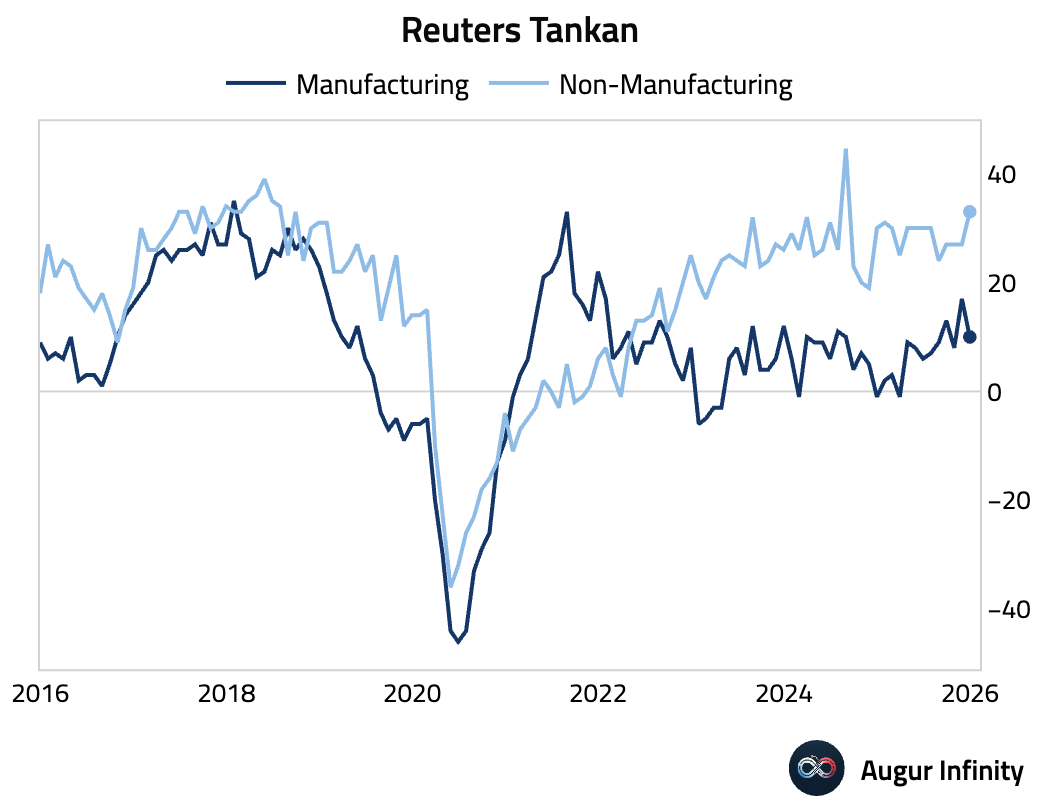
- The Reuters Tankan index for Japanese manufacturers fell, led by steel and food producers, who cited rising raw material costs driven by the weak yen. In contrast, the non-manufacturers’ index climbed to its highest since September 2018, buoyed by strength in real estate and information services.
- Producer prices rose 0.3% M/M and held steady at 2.7% Y/Y, matching expectations. The monthly increase was broad-based and led by utilities and metals.
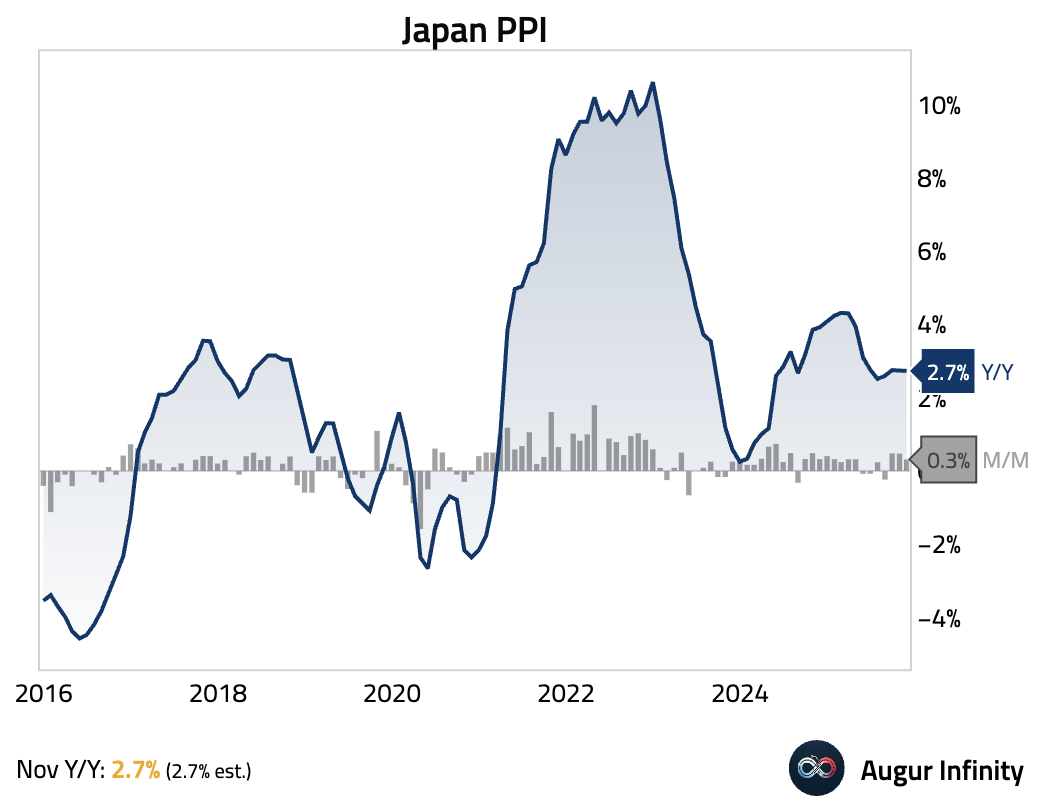
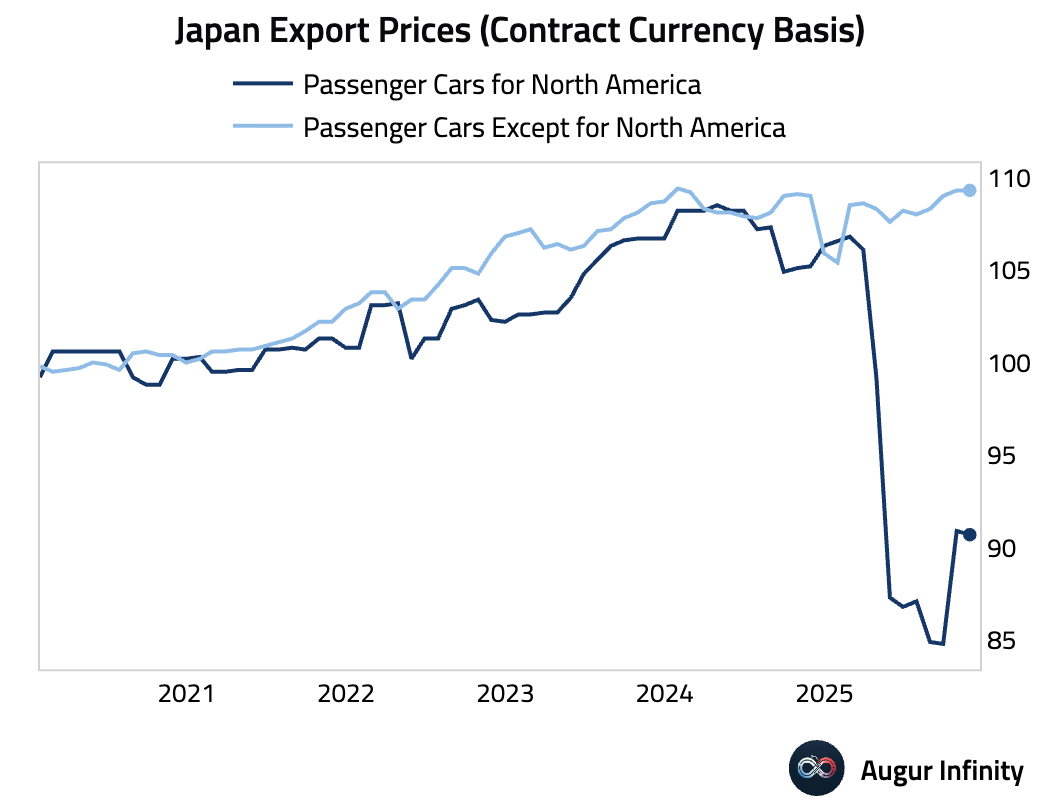
Export prices for passenger cars shipped to North America were mostly flat in November, following a +7.1% M/M rise in October, suggesting the adjustment of export prices due to the tariff reduction may have already run its course.
Asia-Pacific
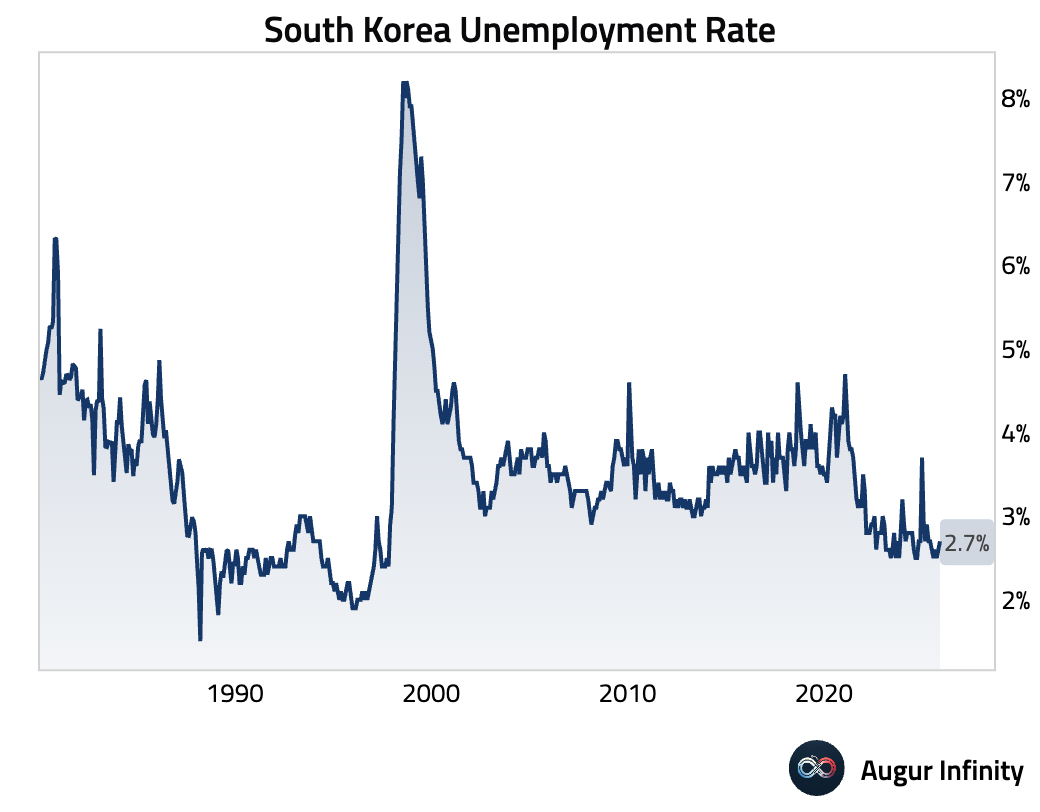
- South Korea’s unemployment rate ticked up, …
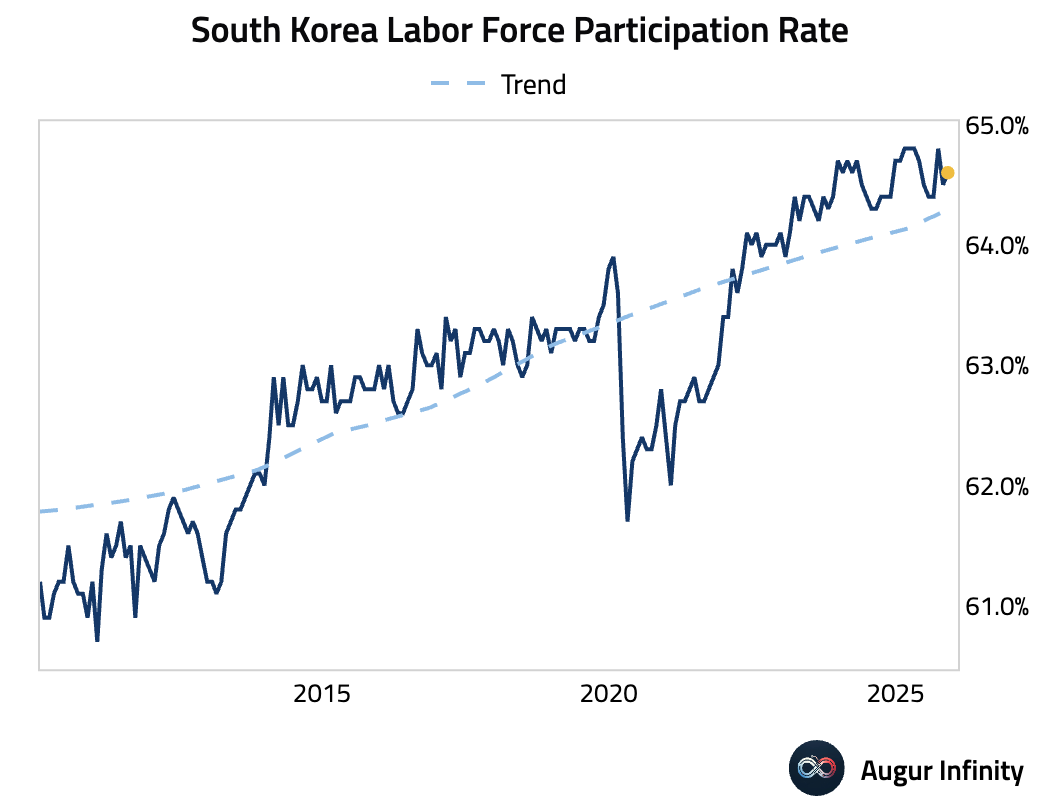
… though the labor force participation rate increased.
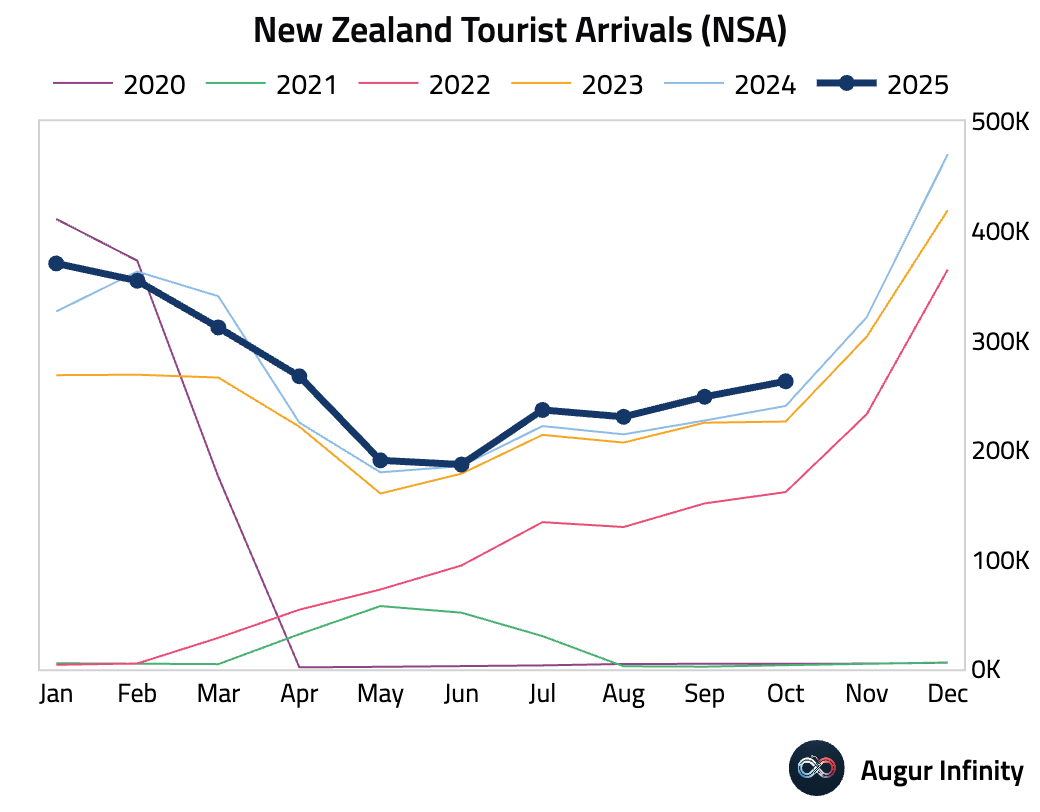
- New Zealand’s visitor arrivals continued to outpace last year’s level.
- Oxford Economics sees “marginal” room for additional rate cuts in Asia, with weaker monetary transmission restraining the impact of easing.

Source: Oxford Economics
China
- China’s headline inflation jumped to 0.7% Y/Y in November from 0.2% in October, meeting consensus estimates. Core inflation was unchanged at 1.2%.
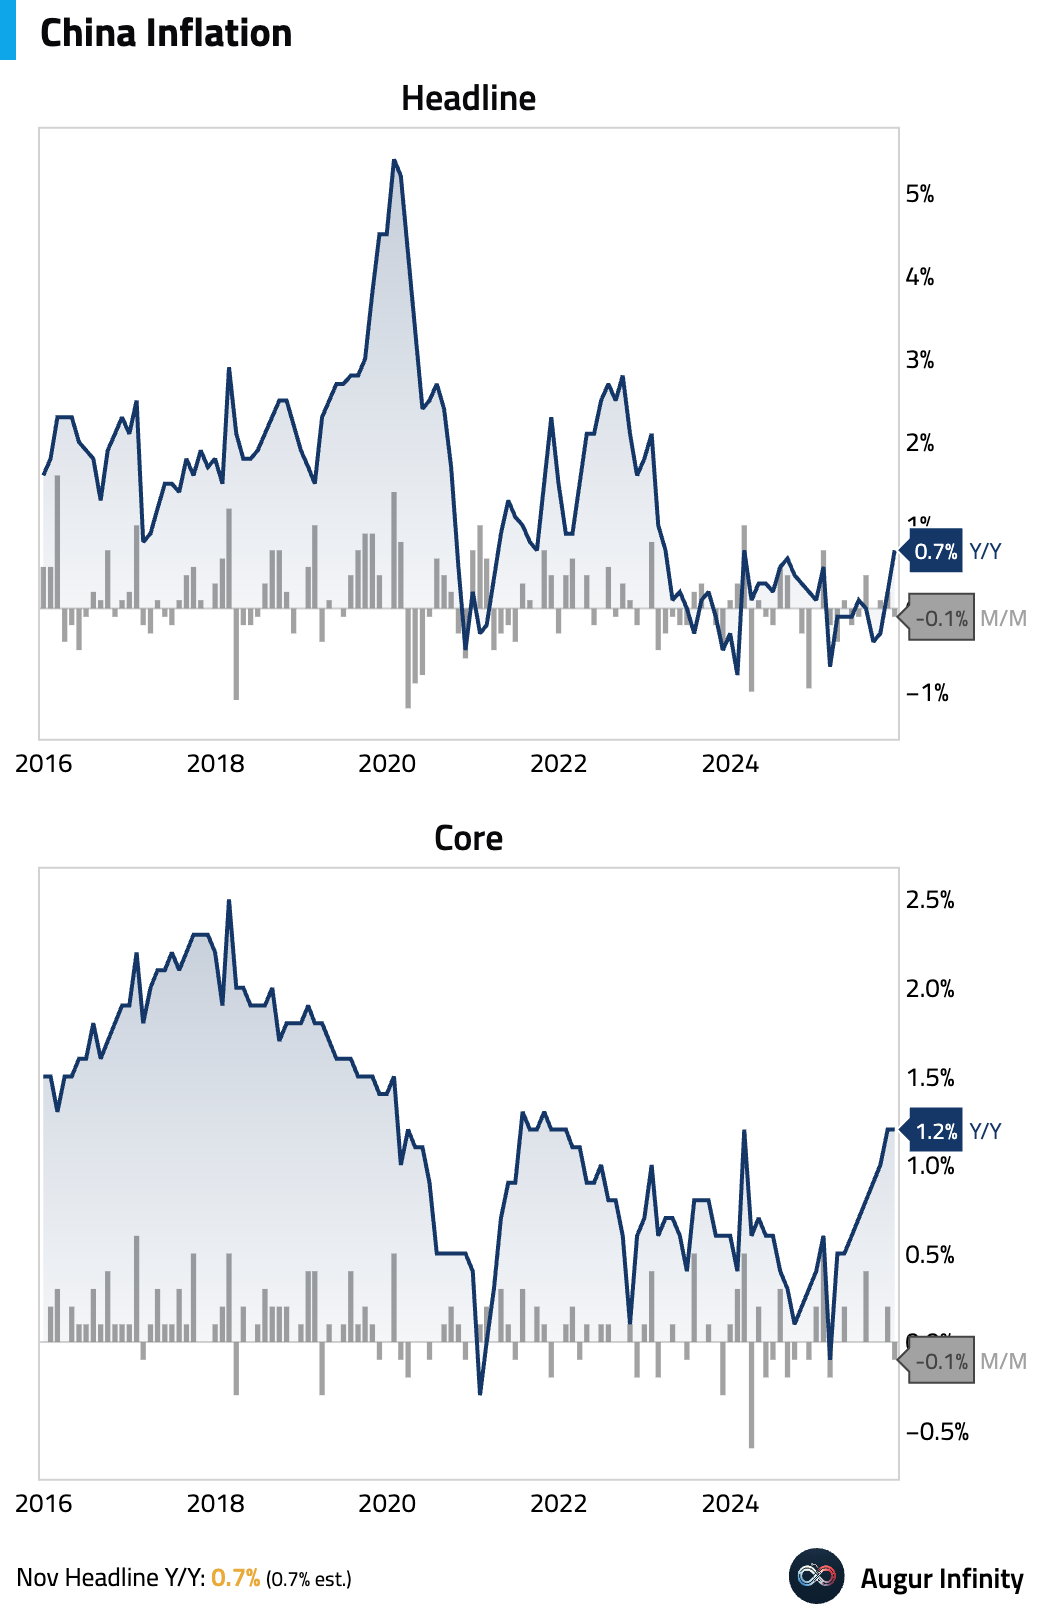

Source: Reuters
The year-over-year increase was driven entirely by a surge in food prices, particularly fresh vegetables, due to a supply shortage caused by adverse weather.
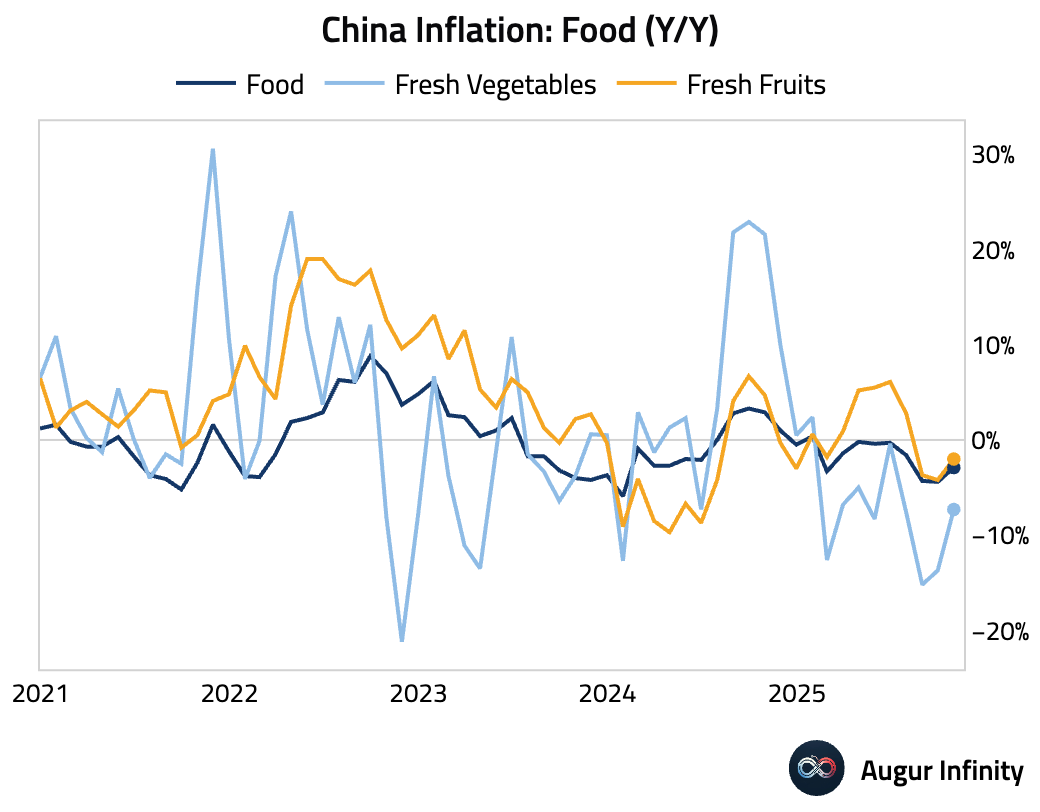
Excluding food, inflation pressure remained muted.

Source: Goldman Sachs
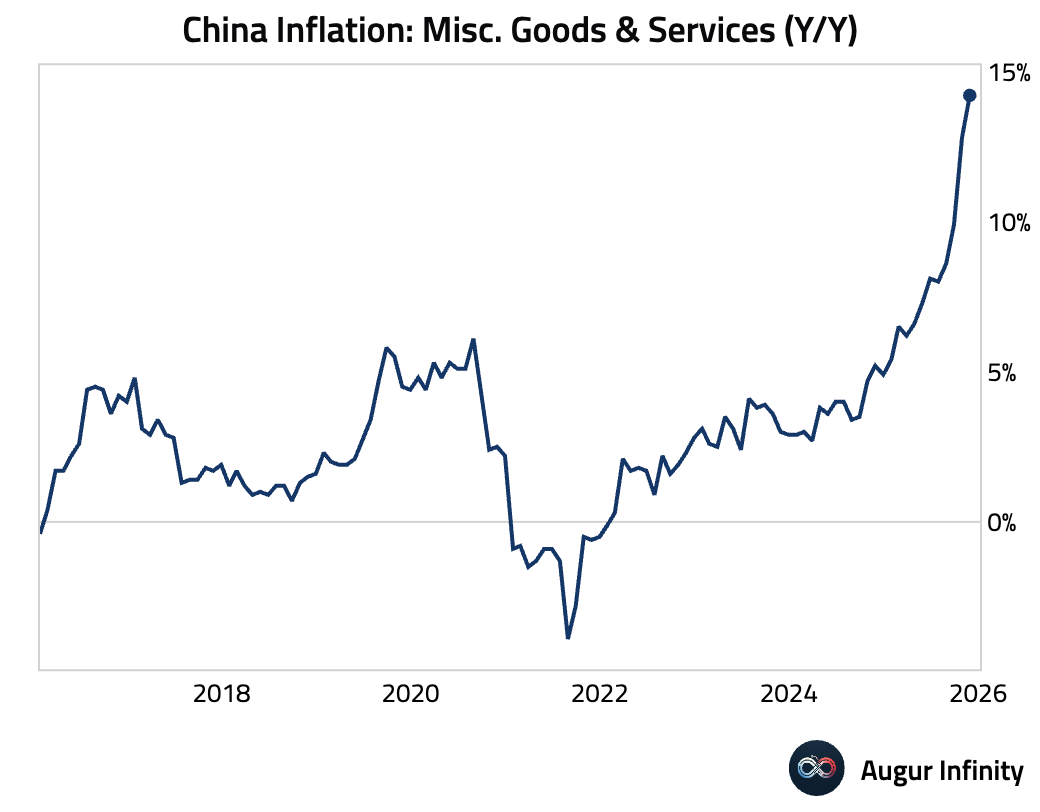
Prices of miscellaneous goods and services jumped again, reflecting higher gold jewelry prices.
Here’s the cumulative CPI inflation since 2021 for a sample of countries. China’s inflation path has significantly diverged from that of global peers.
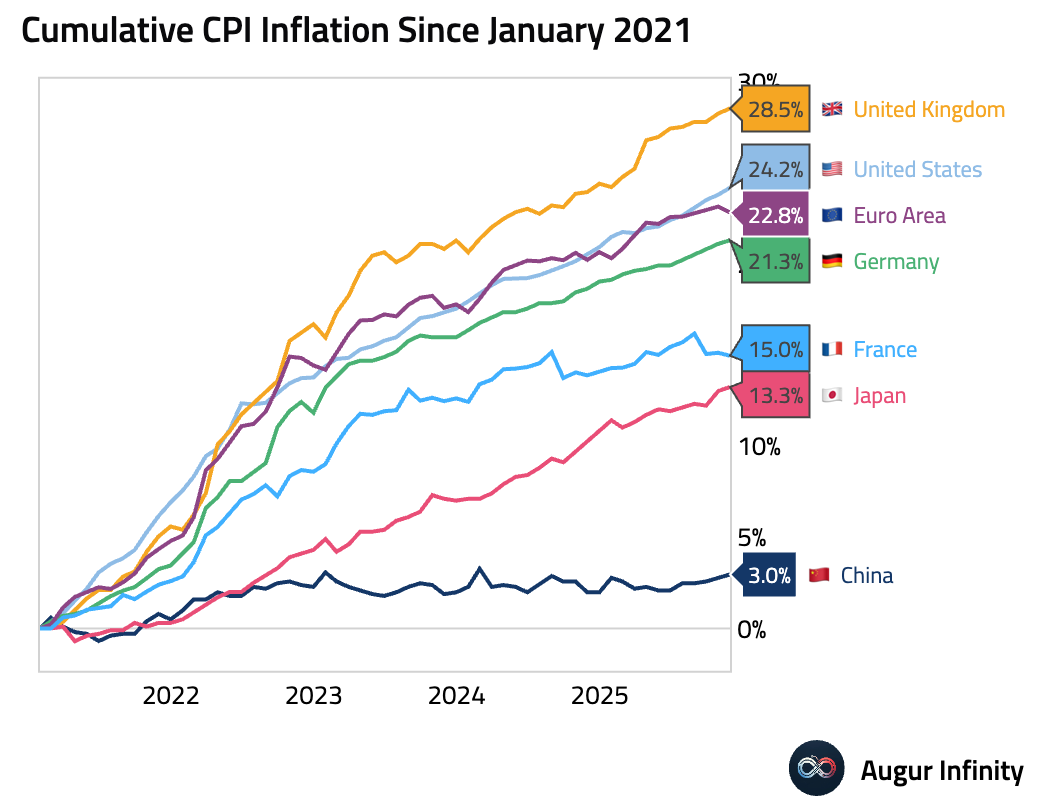
Interactive chart on Augur Infinity
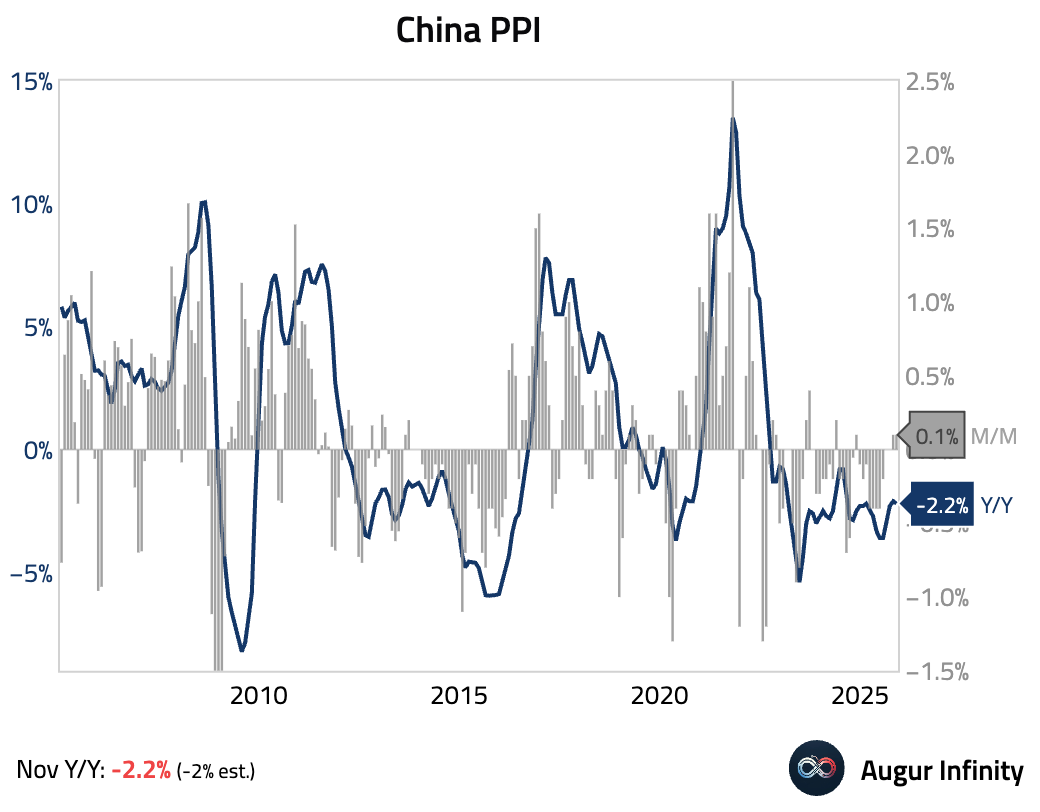
- Chinese producer price deflation worsened in November, reflecting weak final demand and persistent disinflationary pressure in the economy, particularly in downstream consumer goods.
- China’s trade surplus is shrugging off the trade war, surpassing USD 1 trillion in the first eleven months of the year, …
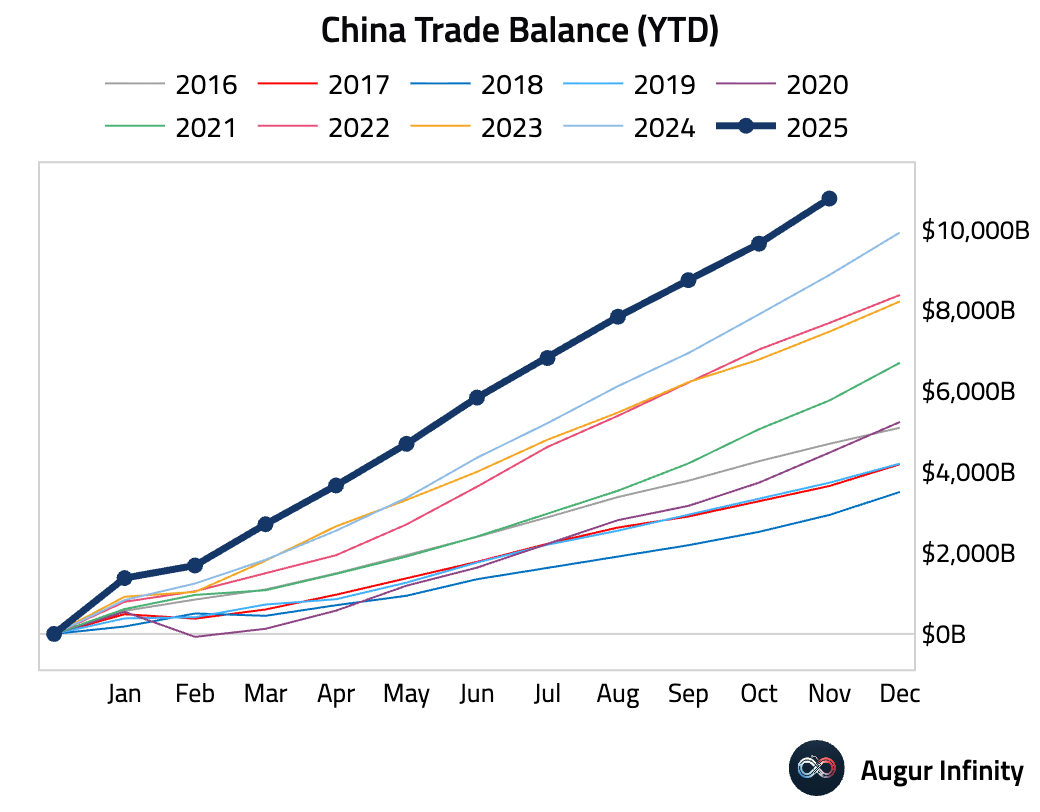
… as expanding exports to Asia, Europe, Latin America, and Africa more than offset a steep decline in direct shipments to the US.

Source: @WSJ
- China has become the top source of imported goods for roughly two-thirds of countries, overtaking the US across many markets over the past two decades.

Source: Our World in Data
- Chinese developer shares rallied on hopes of fresh policy support and progress in China Vanke’s debt-restructuring talks.
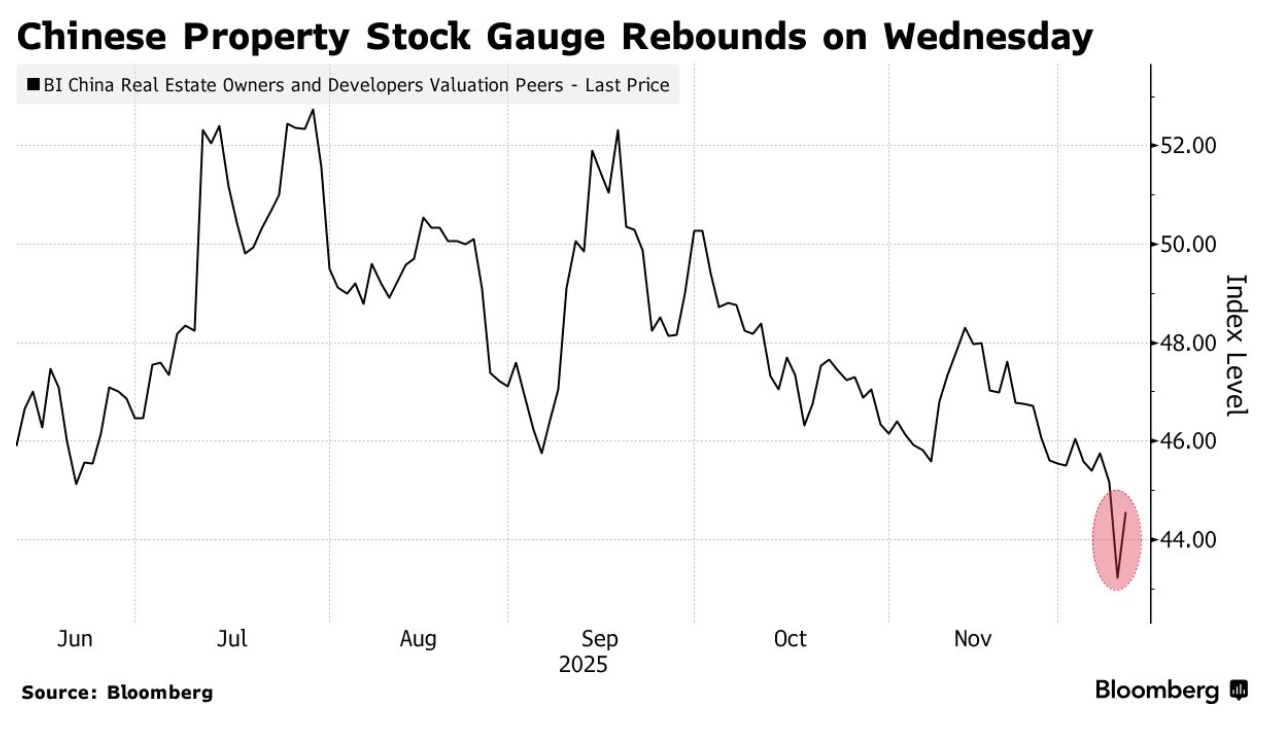
Source: @markets
Emerging Markets
- Brazilian inflation eased, landing just below consensus, heavily influenced by Black Friday discounts on goods. However, services inflation remains a key concern, as it accelerated due to a significant increase in airfare prices.
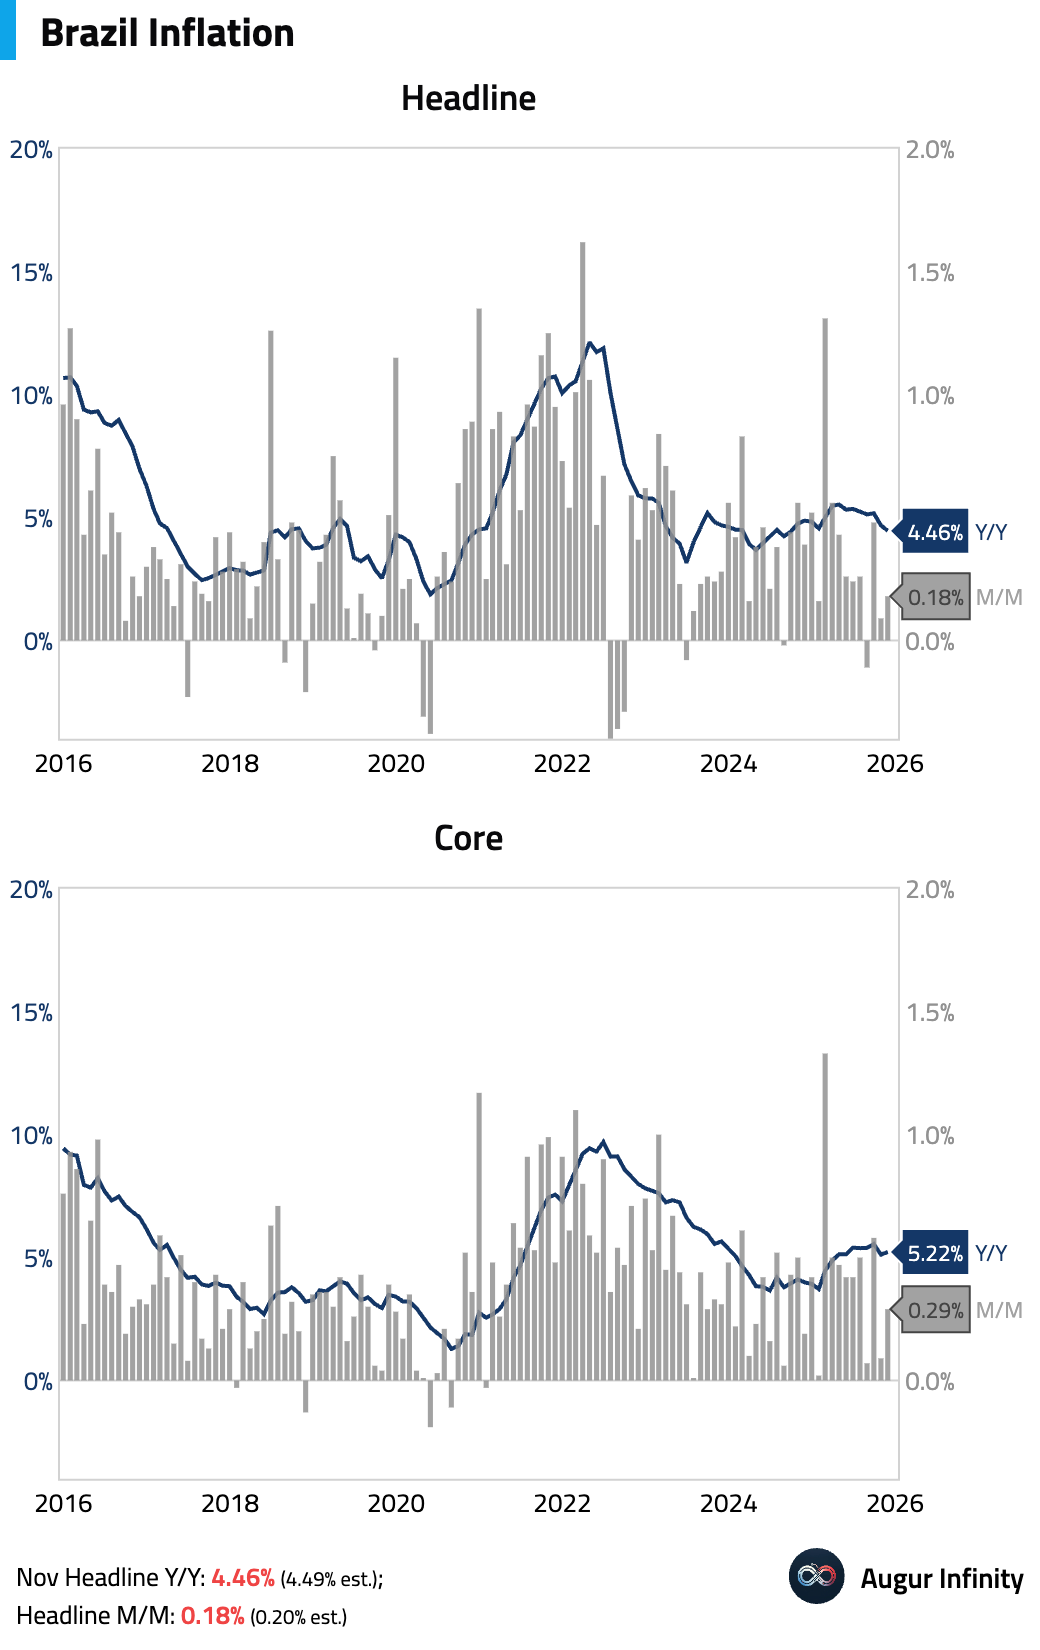

Source: @economics
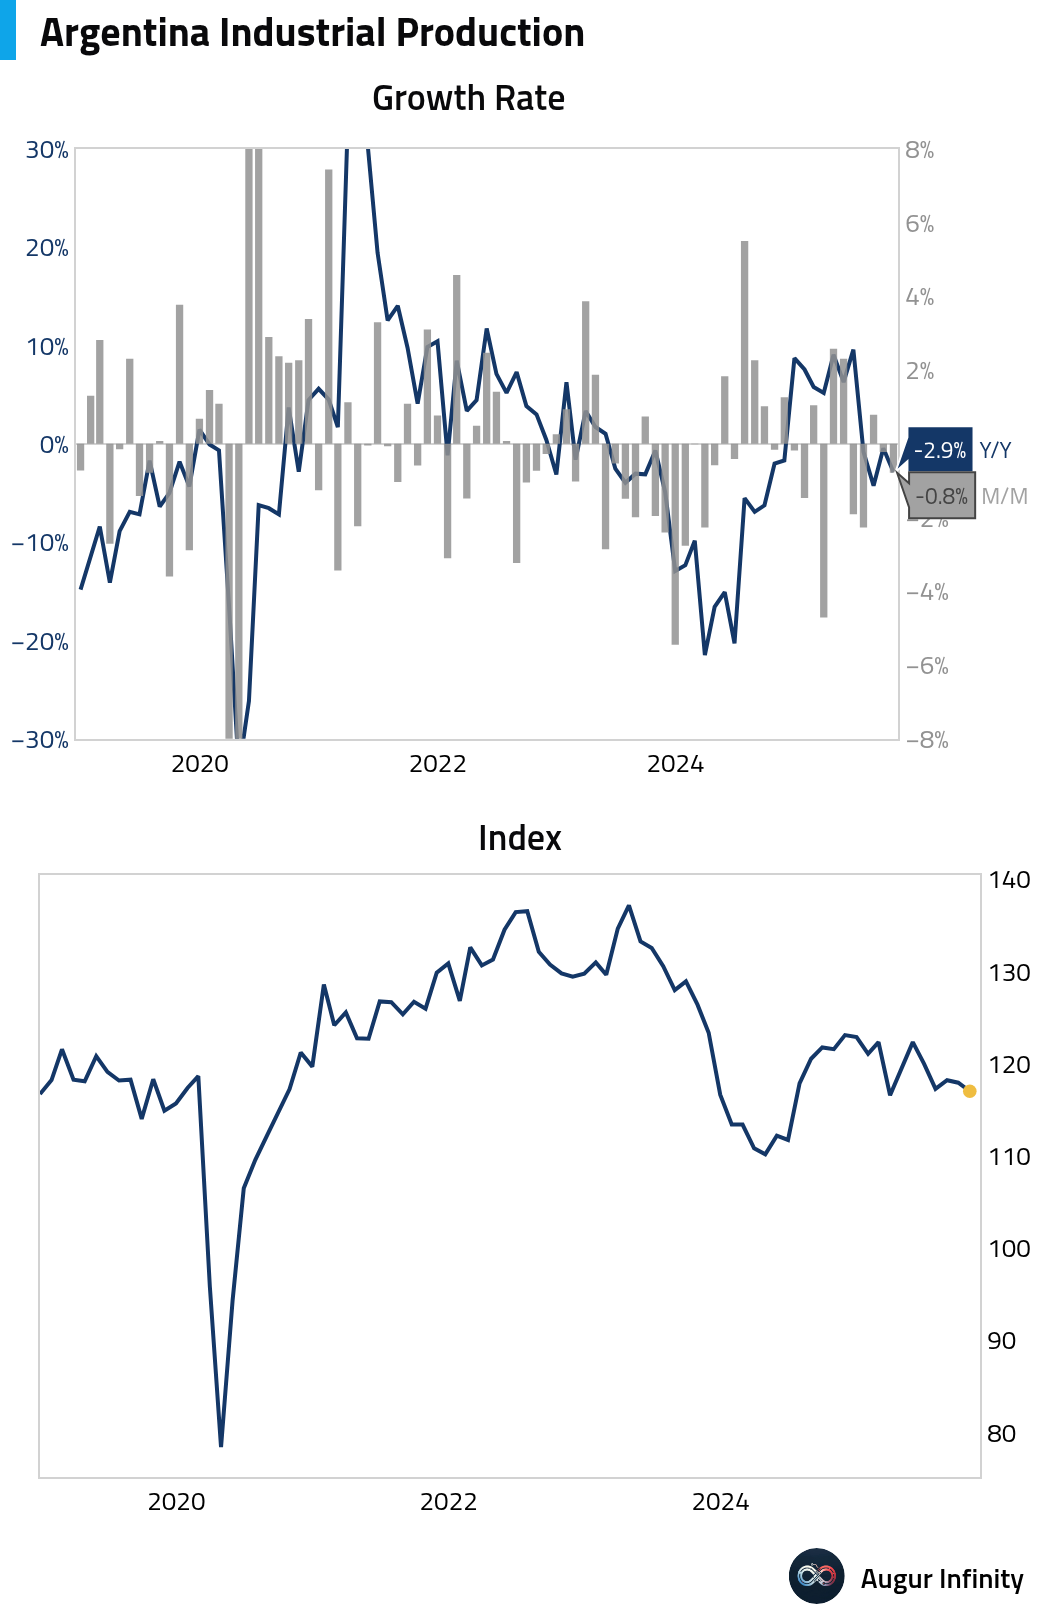
- Argentina’s industrial production declined for a second month in October.
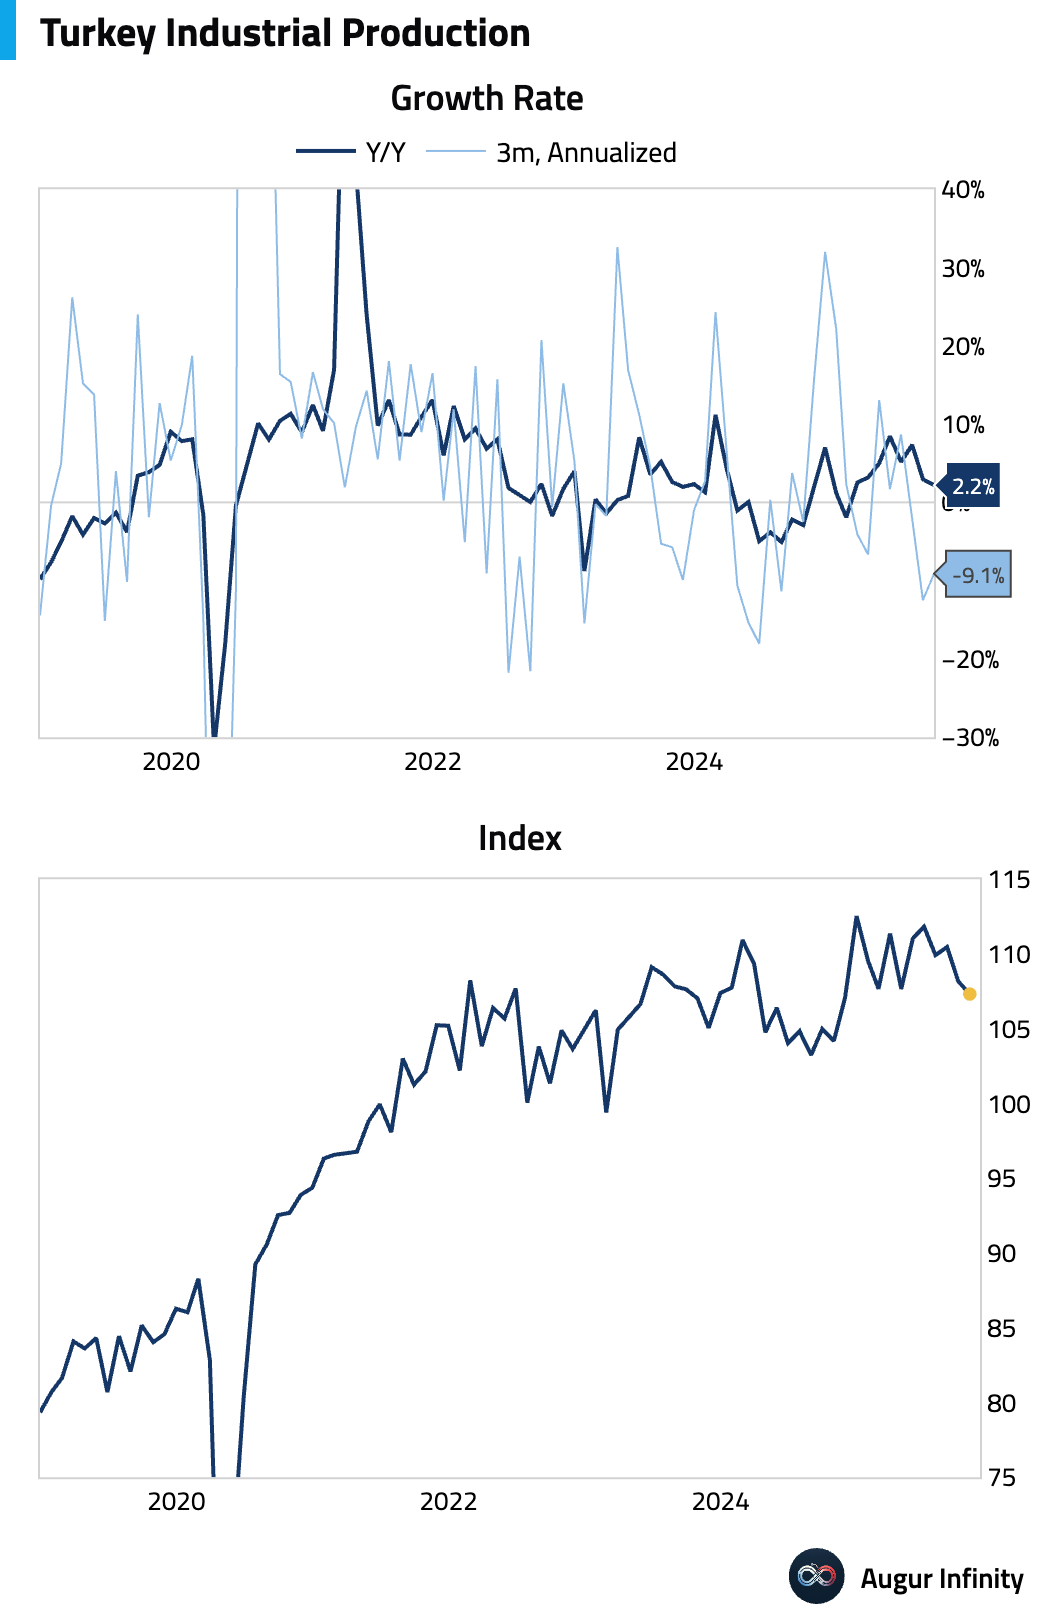
- Turkey’s industrial production contracted further.
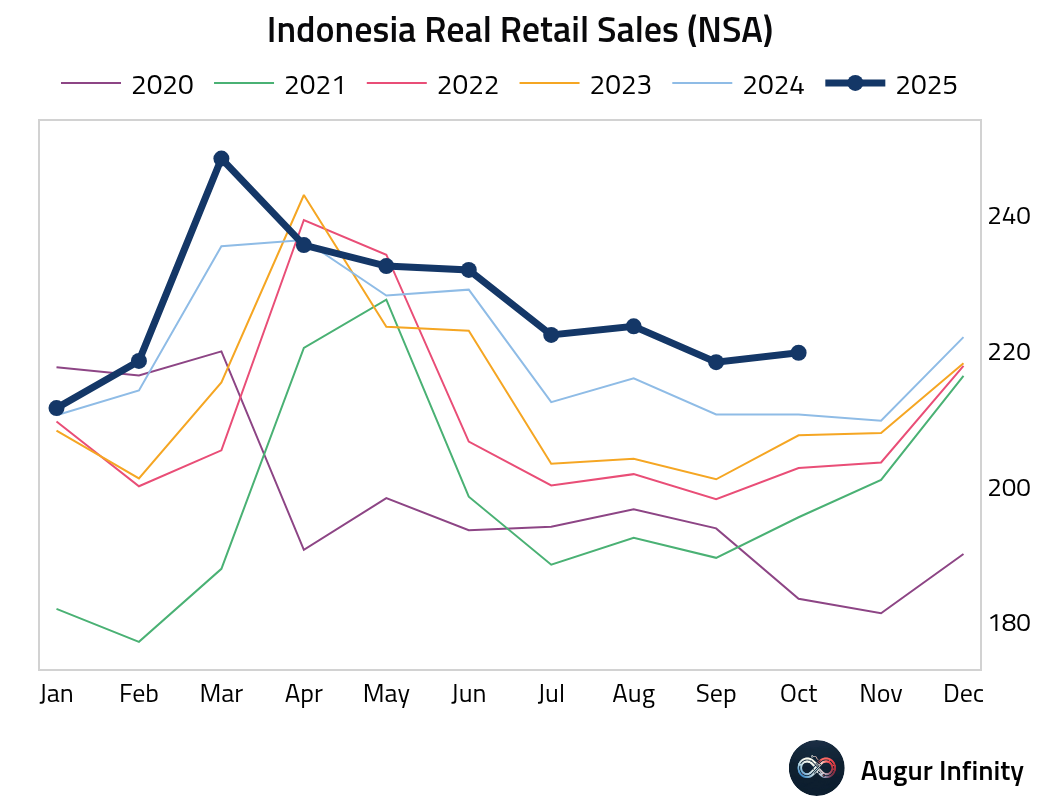
- Retail sales growth in Indonesia accelerated.
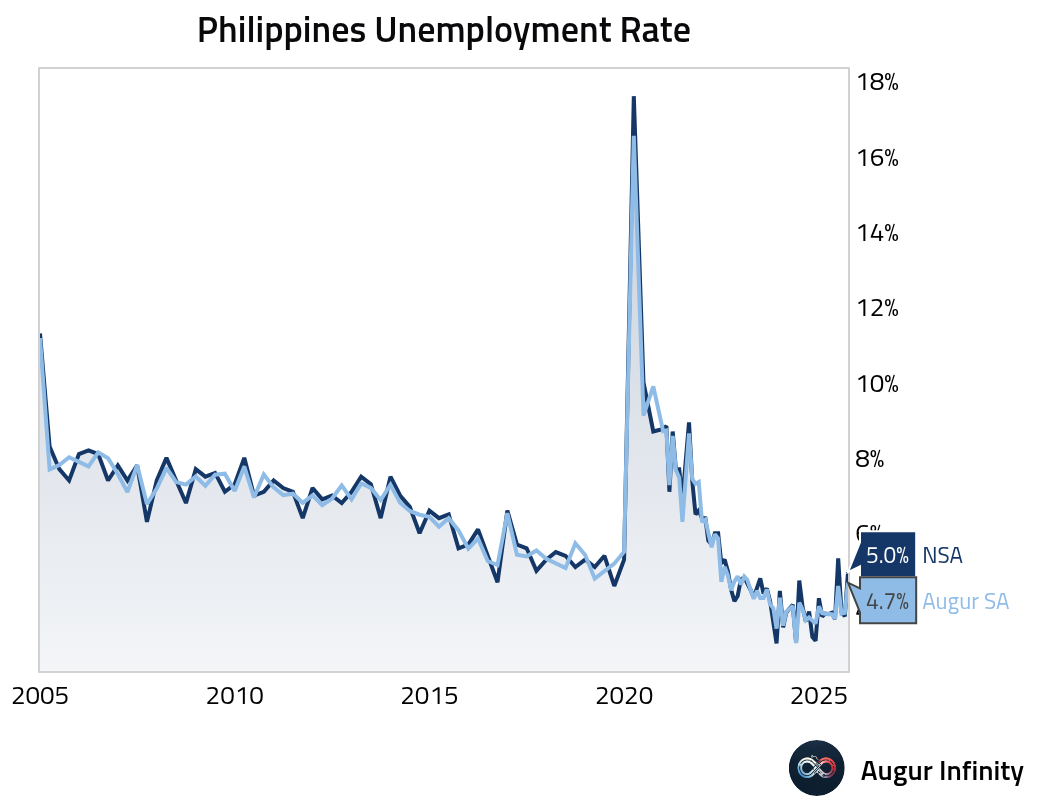
- The unemployment rate in the Philippines surged.
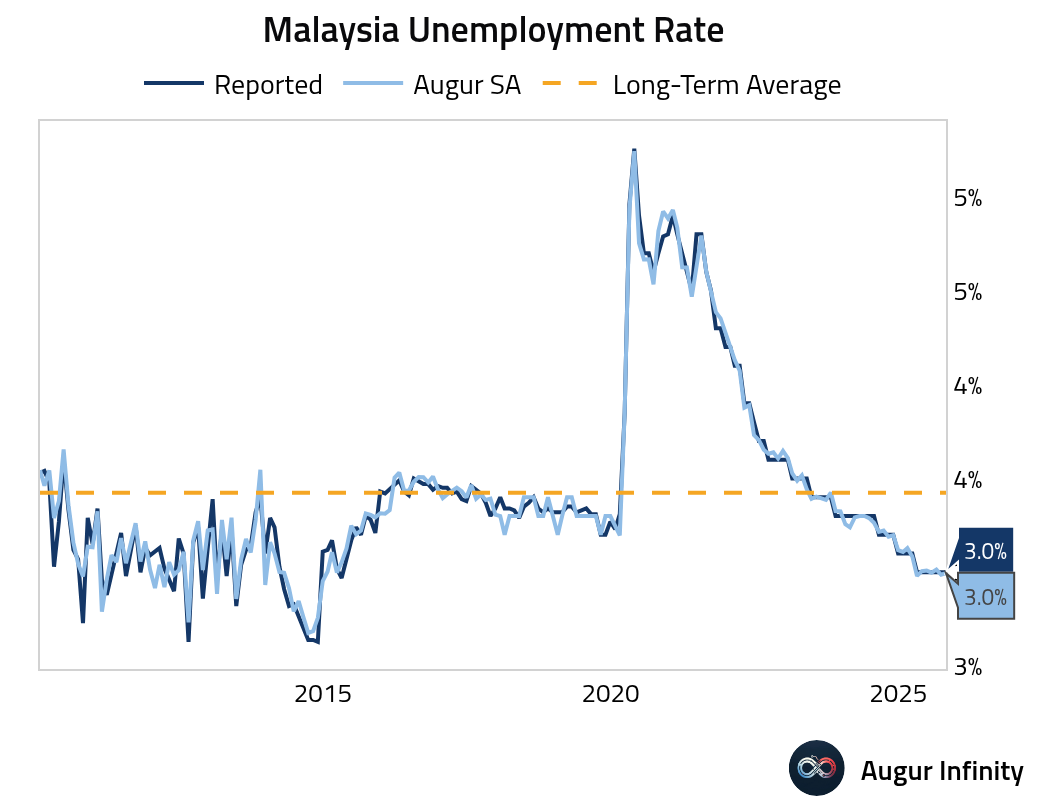
- Malaysia’s unemployment rate held steady at 3.0%.
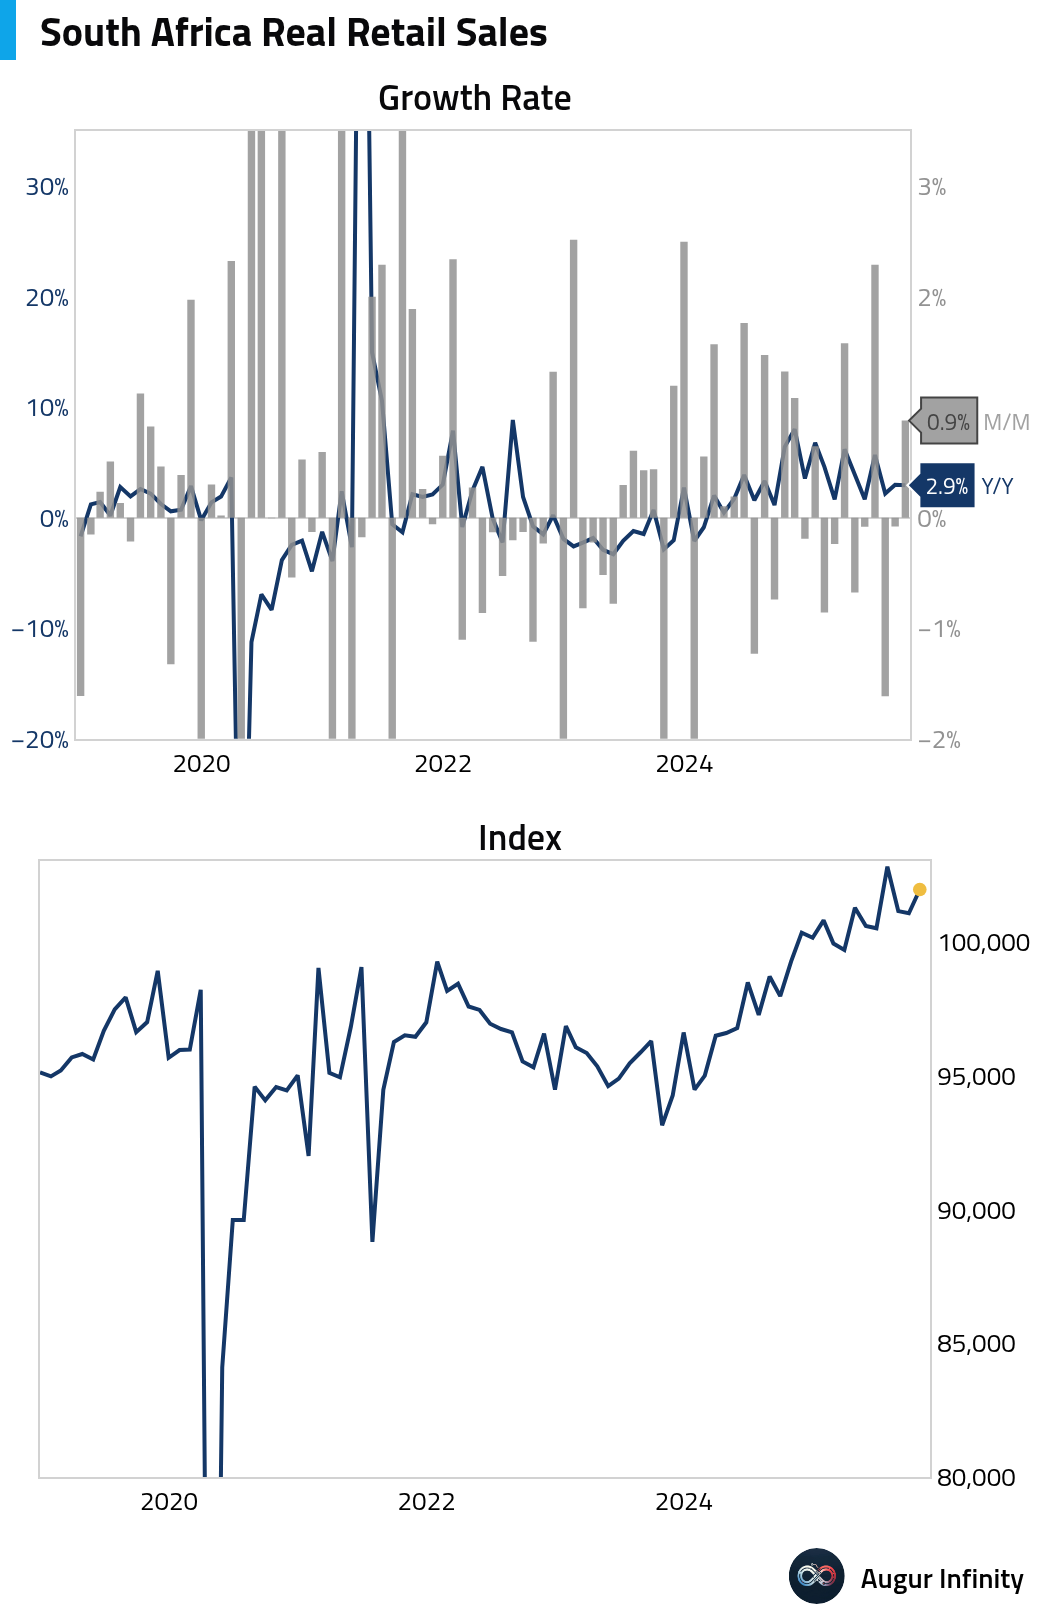
- South African retail sales rebounded in October.
Equities
- Global equities advanced following the Federal Reserve’s decision to lower interest rates. US stocks touched an all time high with a gain of 0.7%, with the market showing a positive reaction despite some intra-day mixed performance. Most international markets also rallied, with South Korea posting its fourth consecutive day of gains.
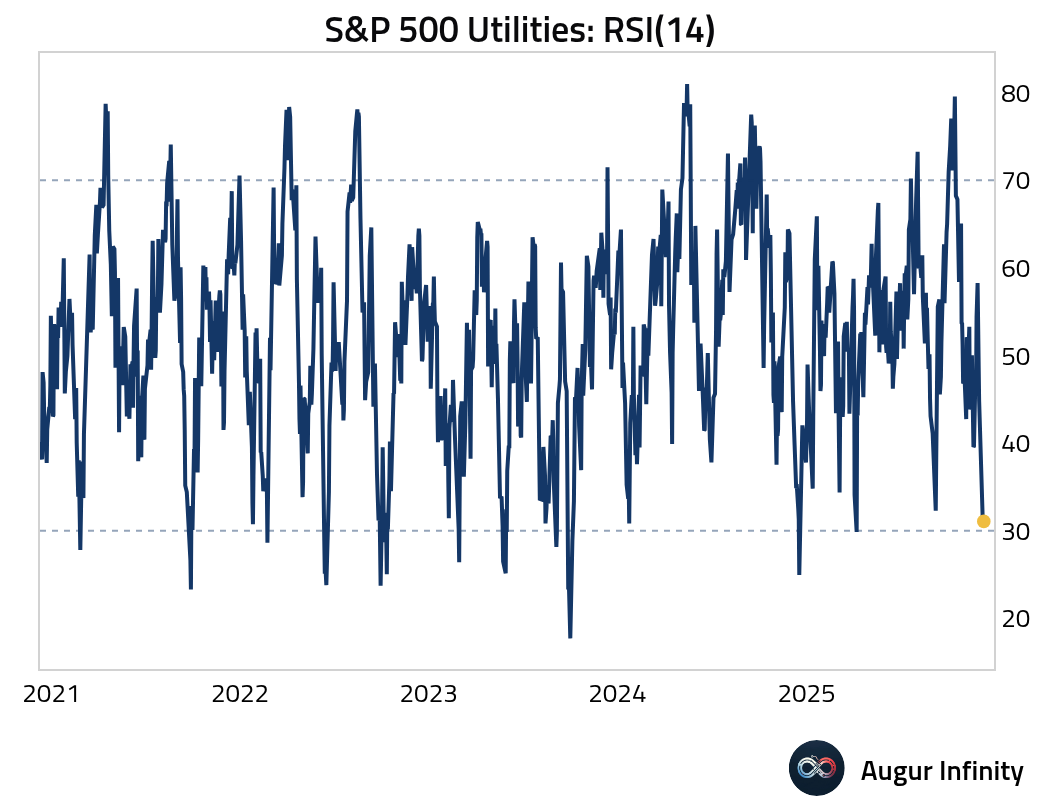
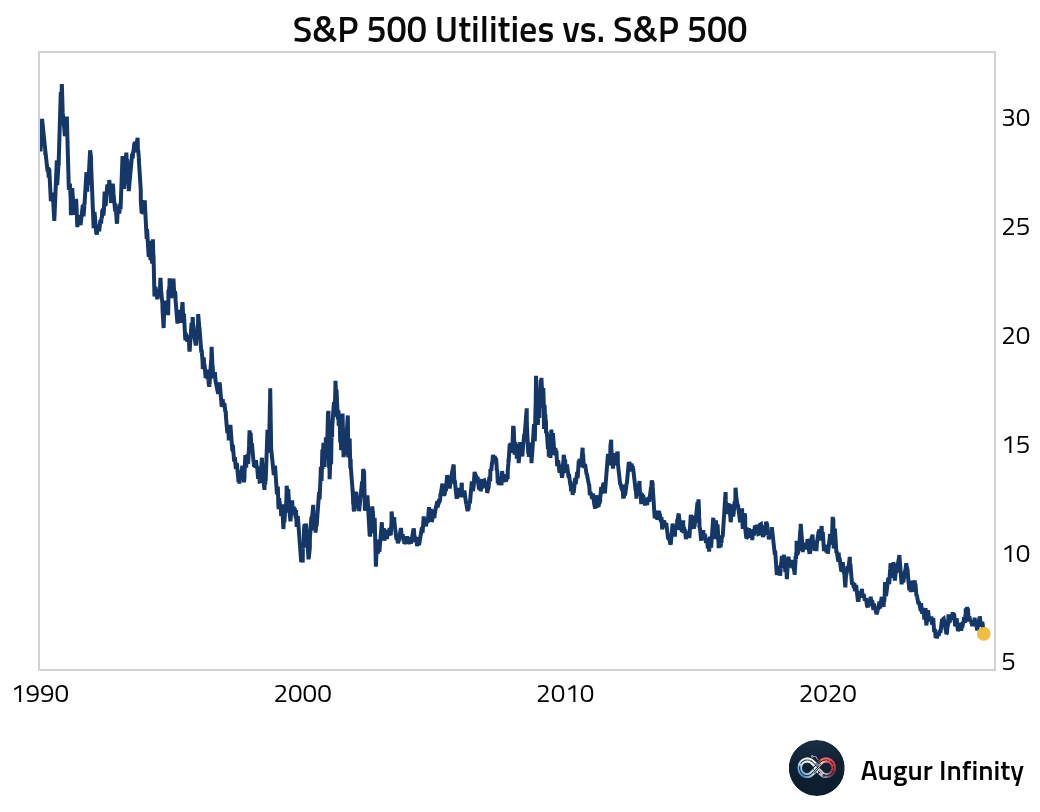
- The S&P 500 utilities sector index continues to decline and is down over 9% since the peak.
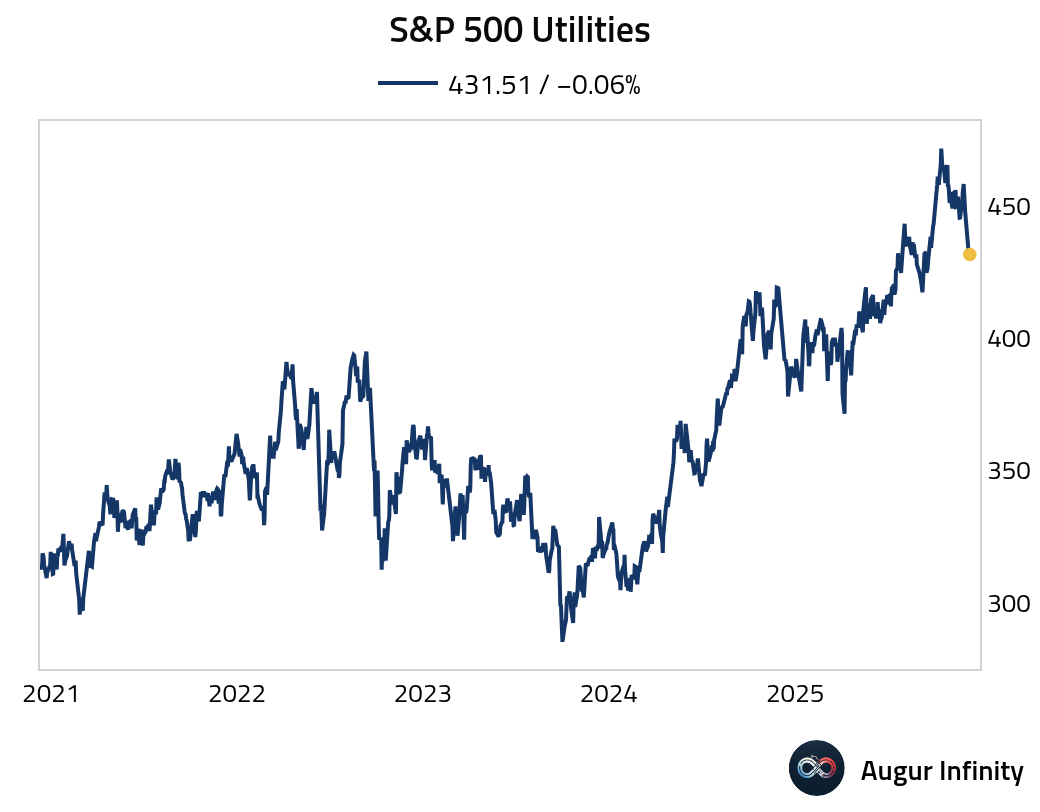
Based on RSI, the utilities appear oversold.
Here's the utilities index relative to S&P 500.
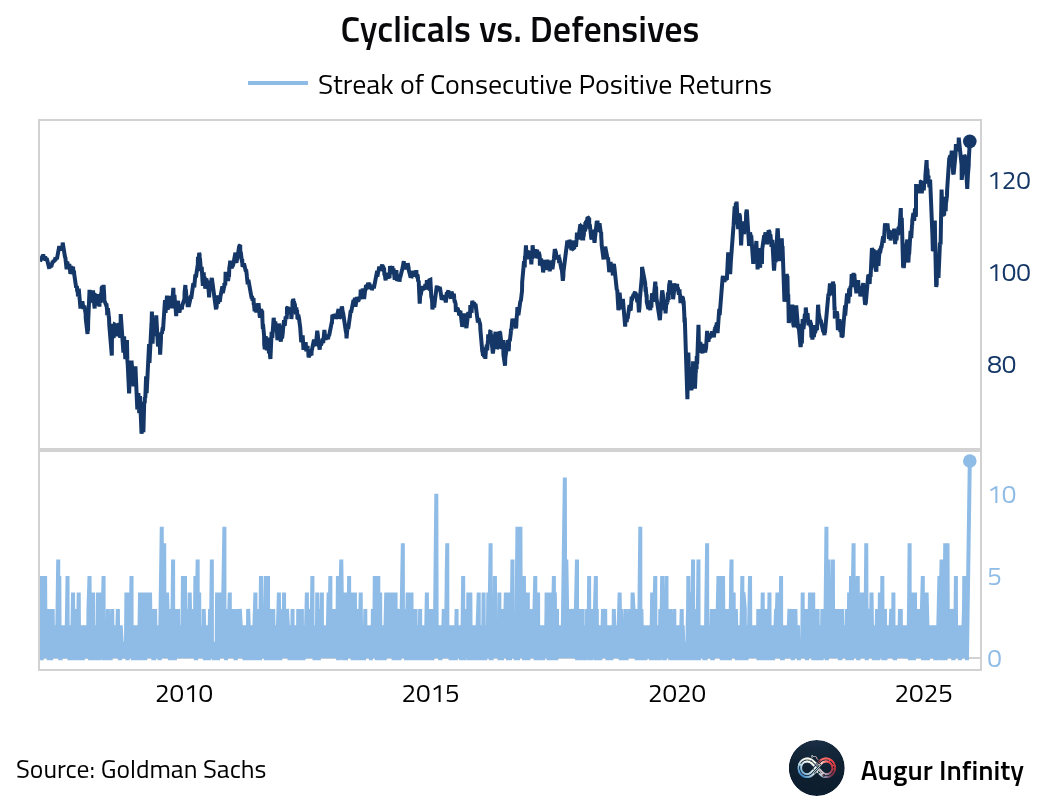
- Goldman’s cyclicals basket has outperformed defensives for twelve consecutive days, the longest streak ever.
- Investor risk appetite and expectations of market returns have risen to their highest level since December 2024.

Source: S&P Global
- Equities rallied as US recession odds decreased this year.
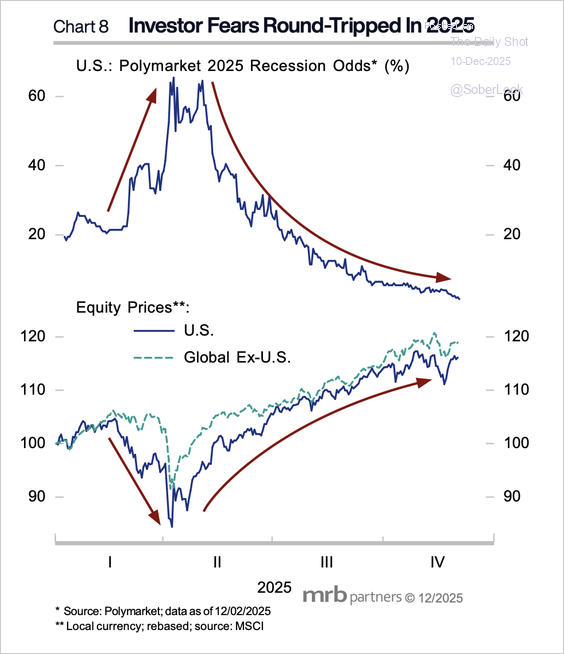
Source: MRB Partners
- Only two of the Magnificent 7 stocks are outperforming the S&P 500 this year.

Source: @philrosenn
- This chart compares the average strategist target for the S&P 500 at the start of each year and what was actually realized.
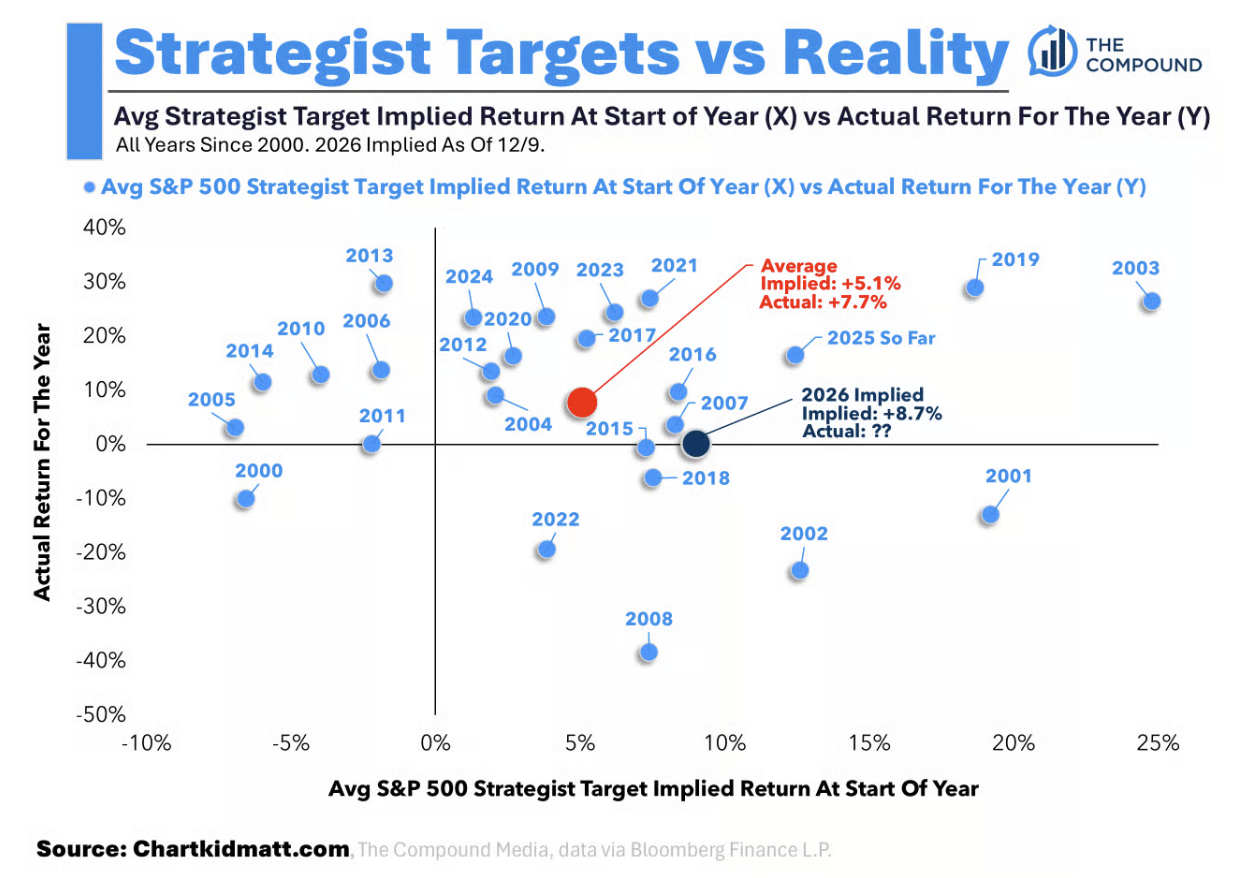
Source: Chart Kid Matt
- Workers across nearly all age groups are investing near-record portions of their 401(k) retirement accounts in equities.

Source: WSJ
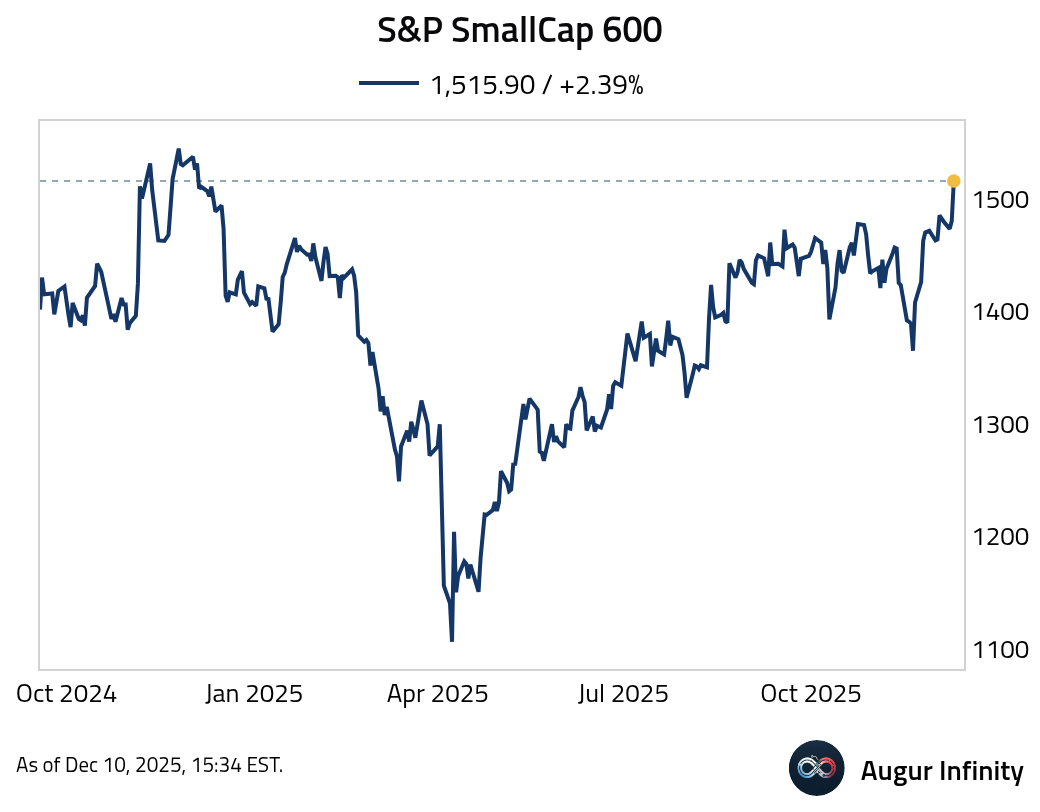
- S&P SmallCap 600 is at the highest level since December 2024.
Rates
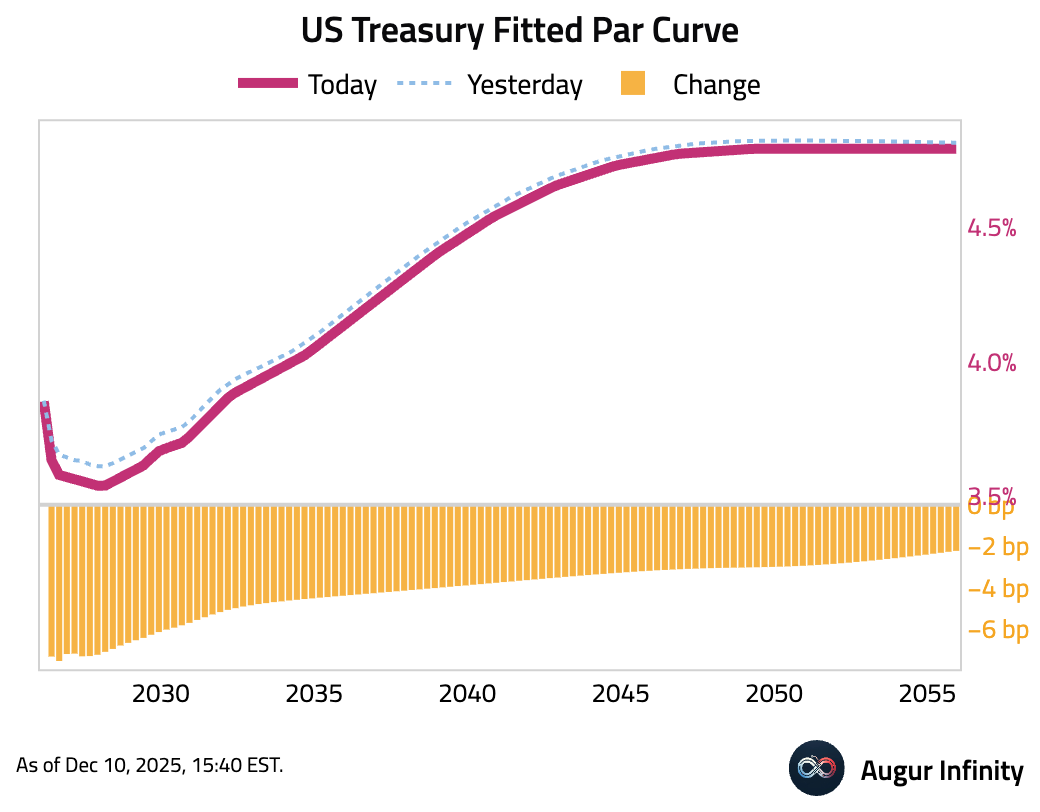
- US Treasury yields fell across the curve after the Federal Reserve cut its policy rate. The front end of the curve led the rally, with the 2-year yield dropping 7.7 bps, while the 30-year yield declined by a more modest 2.0 bps.
Energy
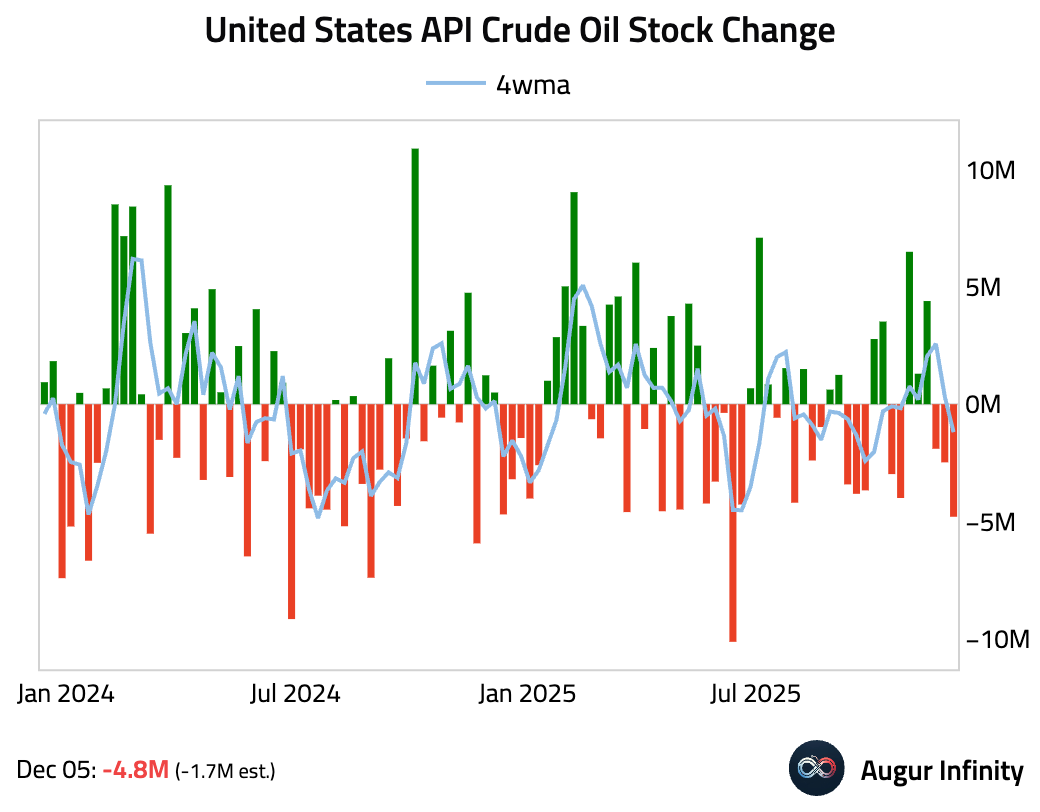
- US API crude oil inventories posted a larger-than-expected drawdown.
Commodities
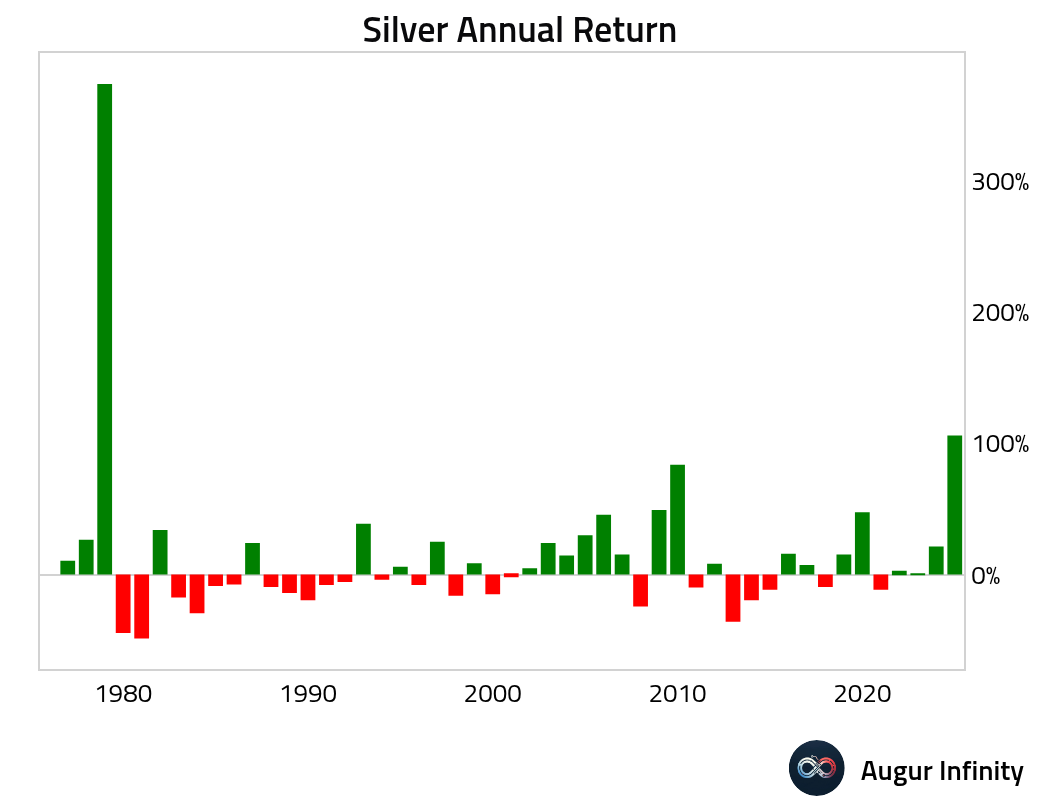
- Silver is set for the best year since 1979.
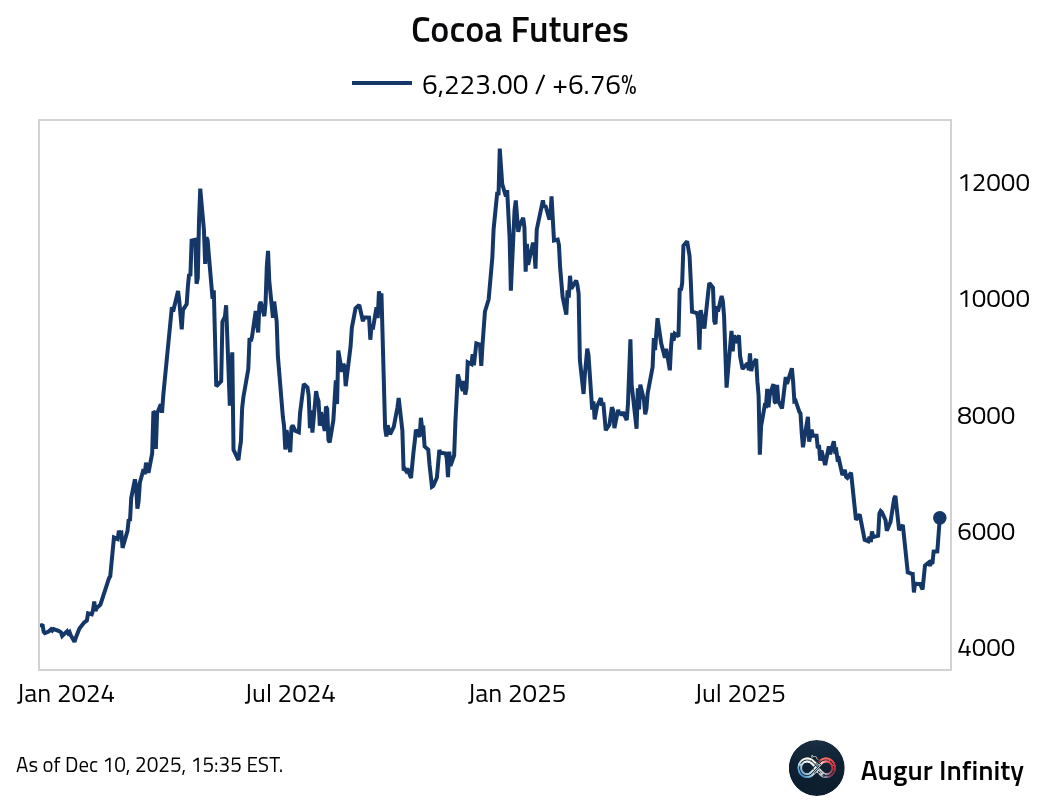
- Cocoa futures jumped.
- Battery pack prices fell in 2025 and are expected to decline further in 2026, driven by excess manufacturing capacity in China, rising competition, and continued adoption of lower-cost LFP technology.

Source: Bloomberg
Global Developments
- Global debt hit a new record in Q3, equating to 310% of GDP.
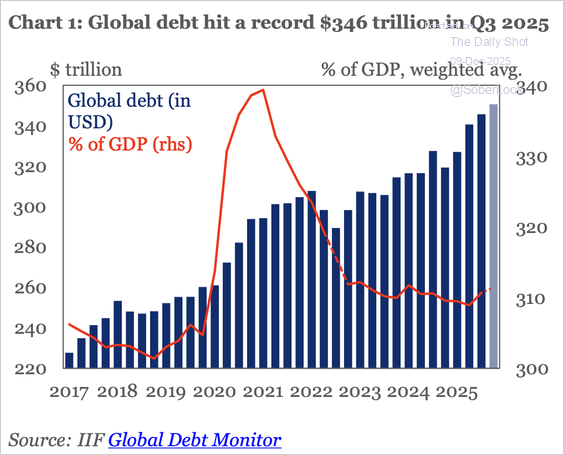
Source: Institute of International Finance
Bond issuance by US AI-linked firms hit a record high in 2025.
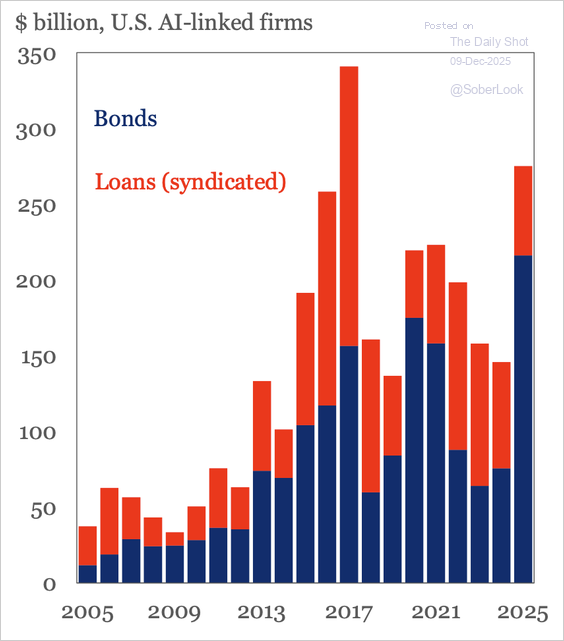
Source: Institute of International Finance
- Here’s FT’s new Geopolitical Mood Index.

Source: @financialtimes
Cryptocurrency
- Buying the Bitcoin ETF at the close and selling at the next open has significantly outperformed passive holding.
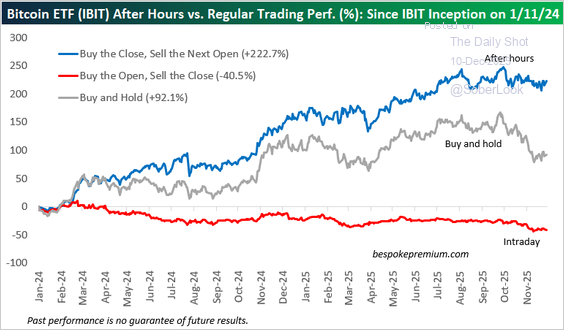
Source: @bespokeinvest
Disclaimer
Augur Digest is an automatically generated newsletter edited by humans. It may contain inaccuracies and is not investment advice. Augur Labs LLC will not accept liability for any loss or damage as a result of your reliance on the information contained in the newsletter.