- United States
- Canada
- United Kingdom
- The Eurozone
- Europe
- Japan
- Asia-Pacific
- China
- Emerging Markets
- Equities
- Rates
- Energy
- Commodities
- Global Developments
United States
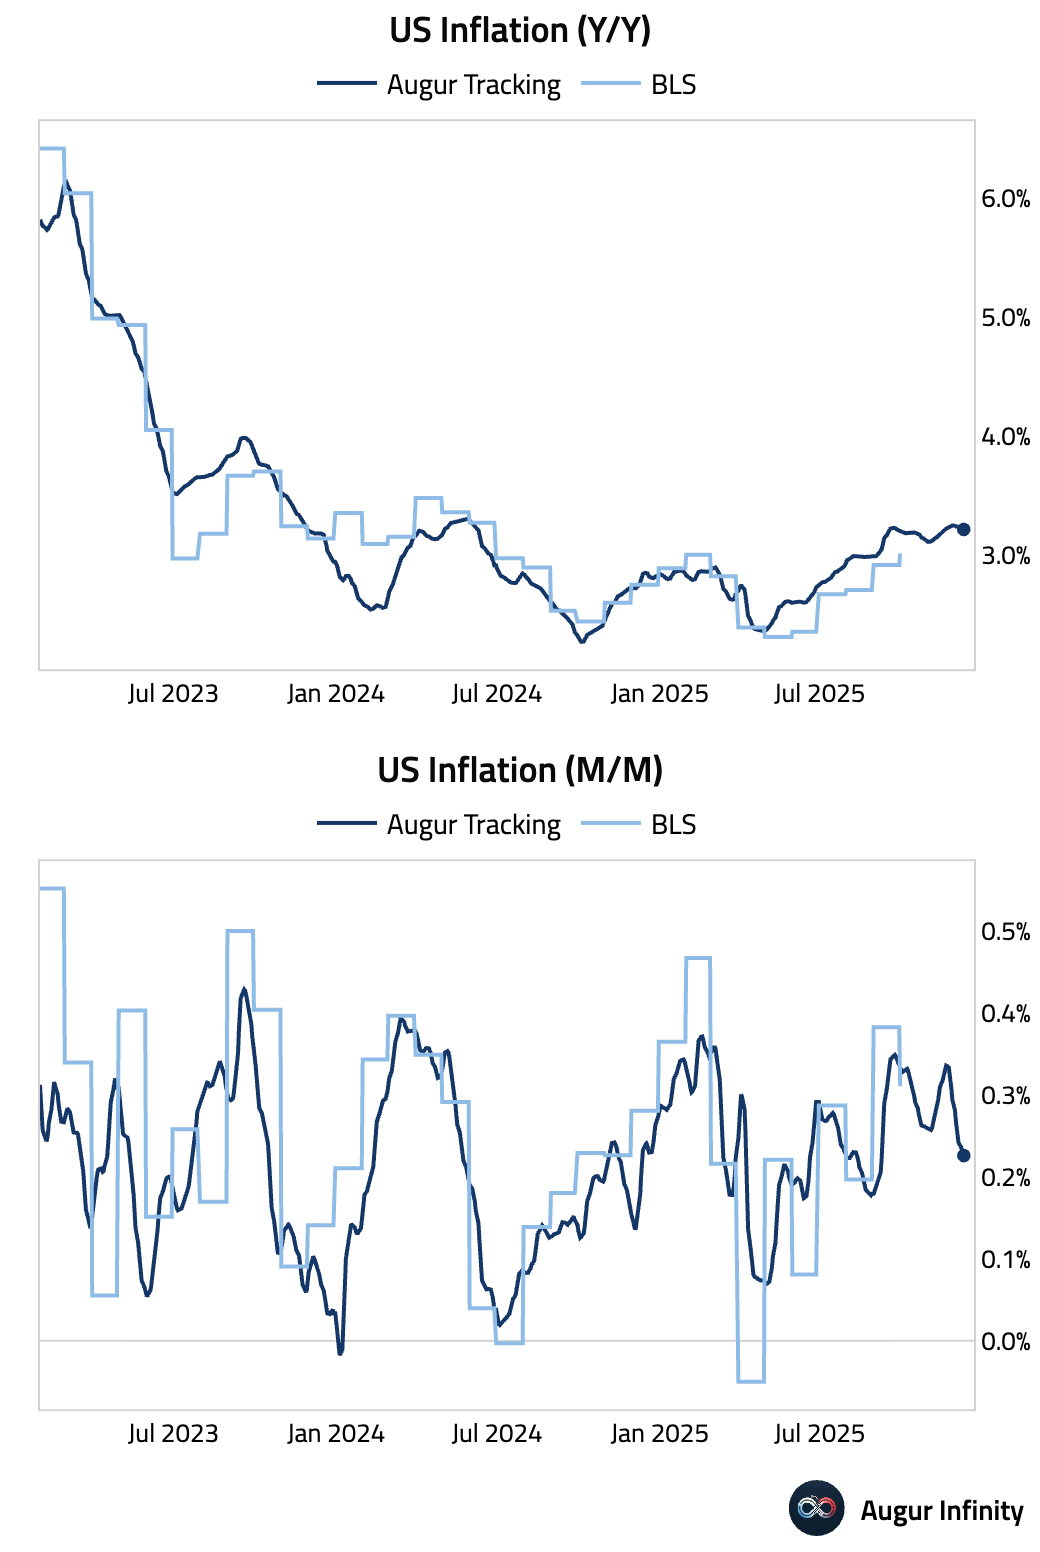
- Let's begin with some updates on inflation.
Our timely tracking suggests US inflation has been stable on a year-over-year basis. Month-over-month inflation fluctuated—softening in October, rising in November, and trending down this month.
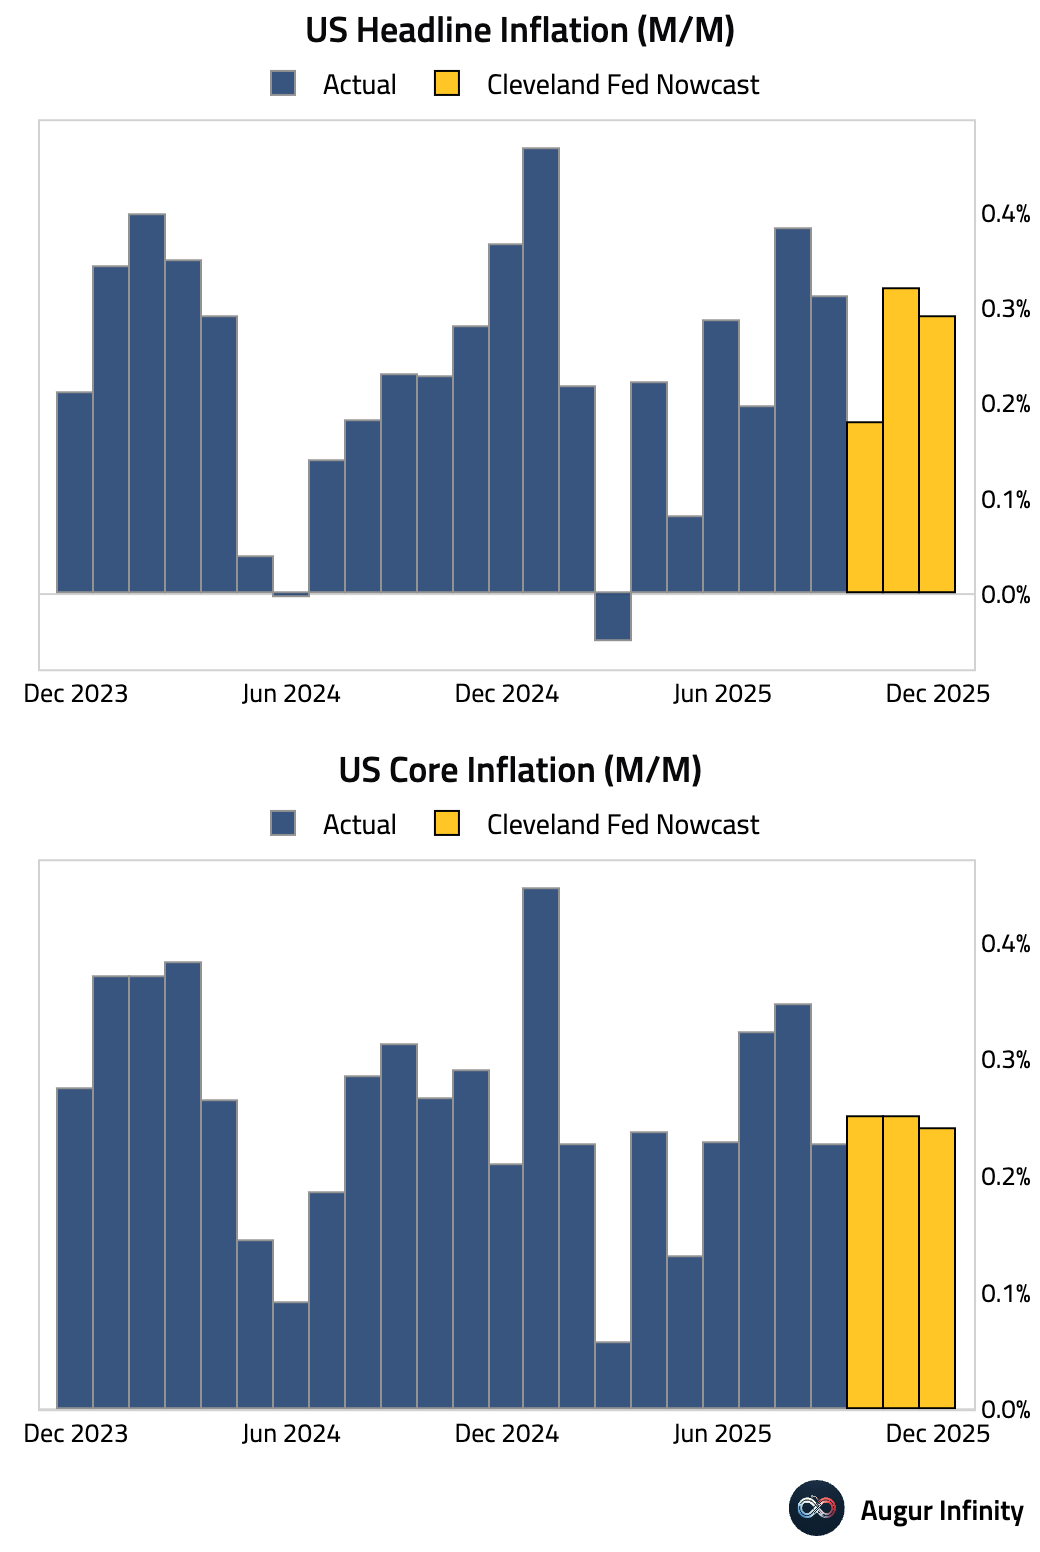
Here is a look at the Cleveland Fed's inflation nowcast.
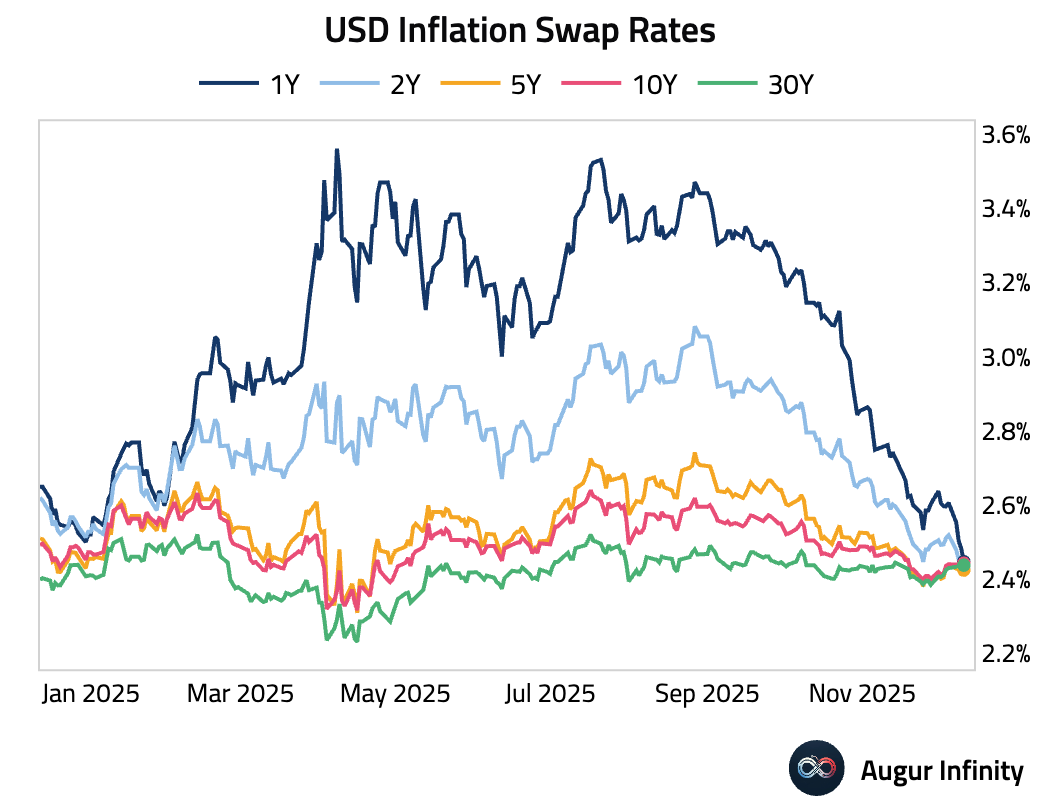
The front end of the inflation swap curve has seen dramatic declines, but intermediate- to long-end has firmed recently.
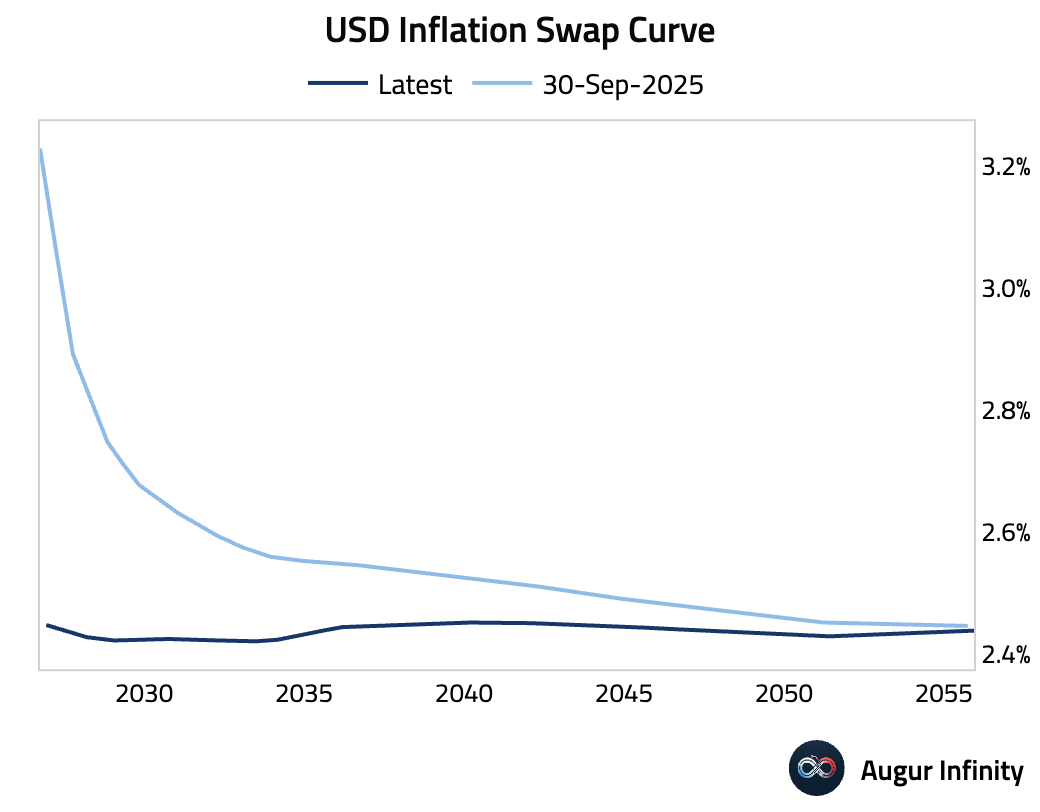
Here is a look at how the inflation swap curve has evolved this quarter.
Goldman's headline and core CPI forecasts for December 2026 both stand at 2.2% year over year, roughly 30 bps below the pace implied by market pricing.

Source: Goldman Sachs
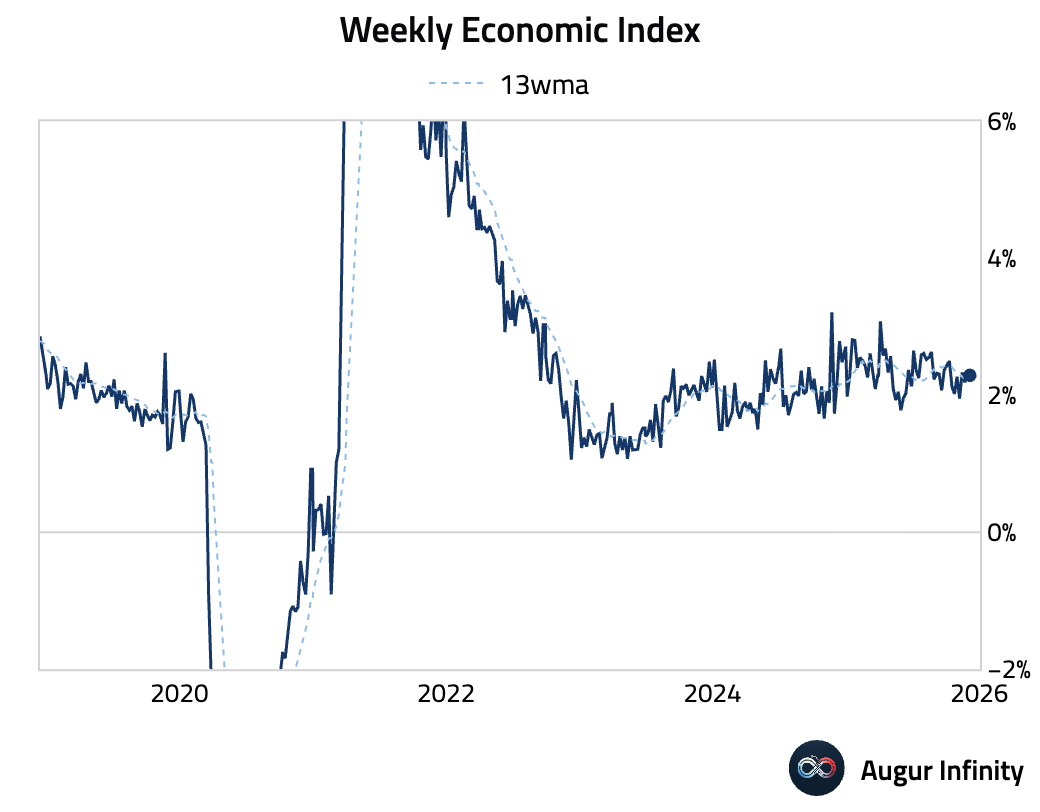
- The US Weekly Economic Index edged up.
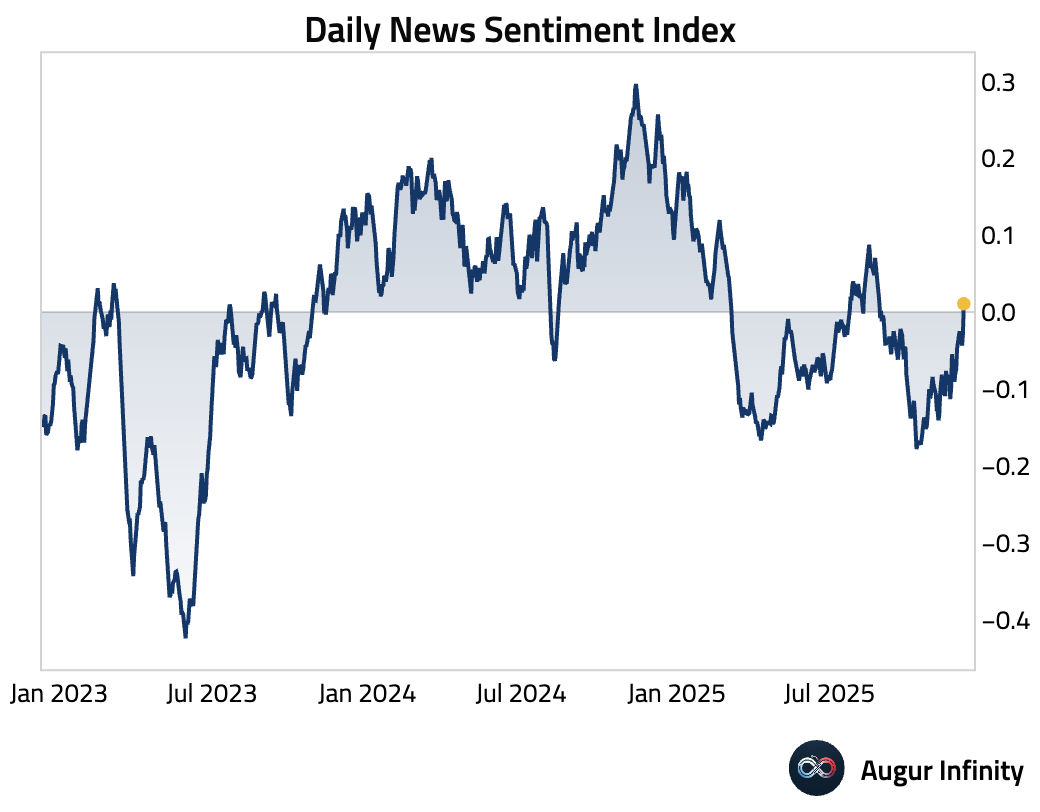
- The Dallas Fed's Daily News Sentiment Index turned positive for the first time since late August.
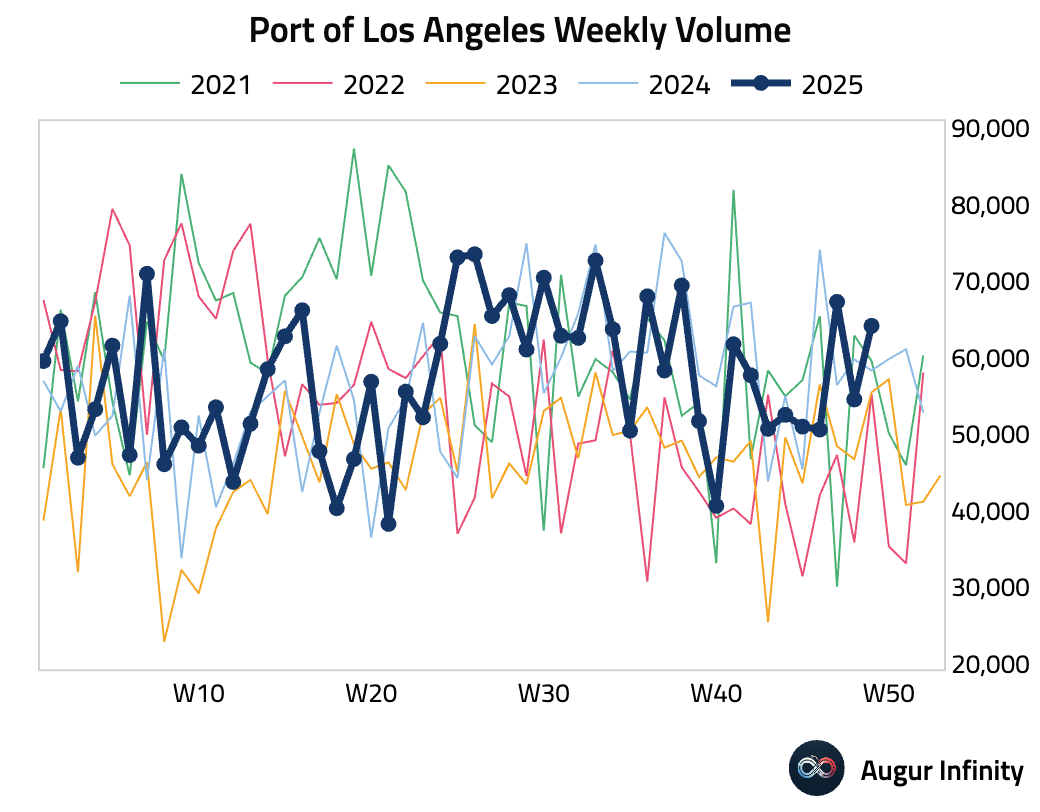
- Weekly volume at the Port of Los Angeles was strong.
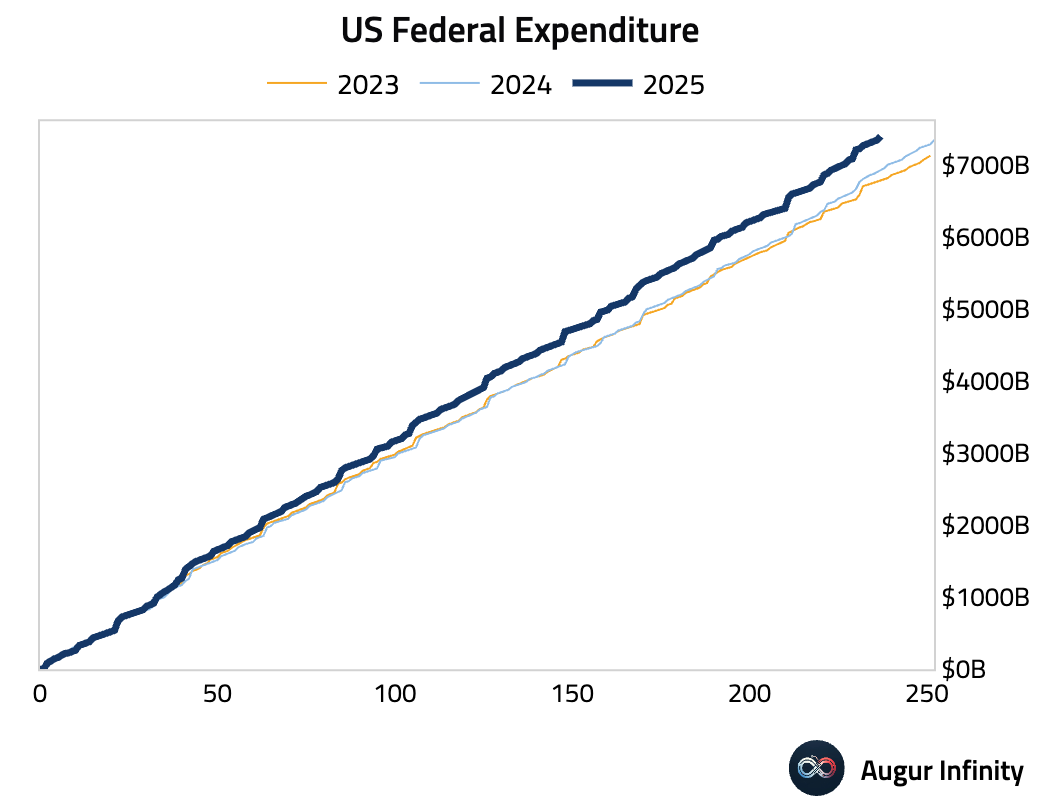
- Year-to-date federal expenditure is tracking well above prior year levels.
Canada
- Wholesale sales for October were revised upward from a small contraction to a small gain.
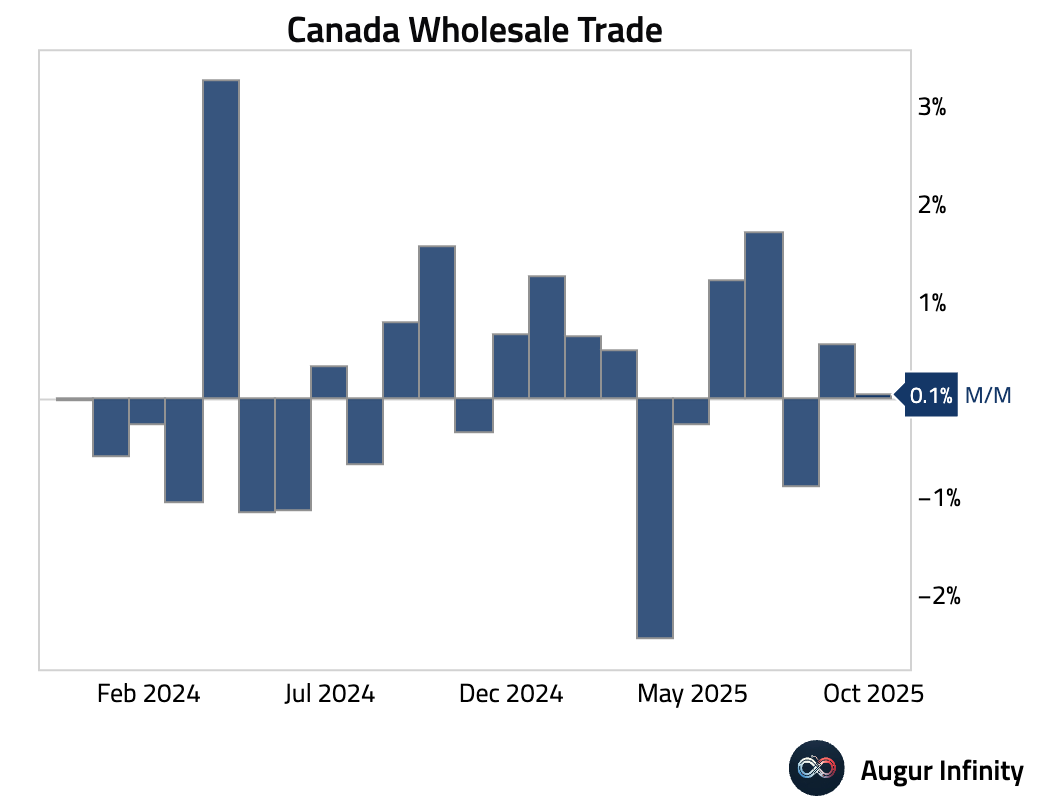
Interactive chart on Augur Infinity
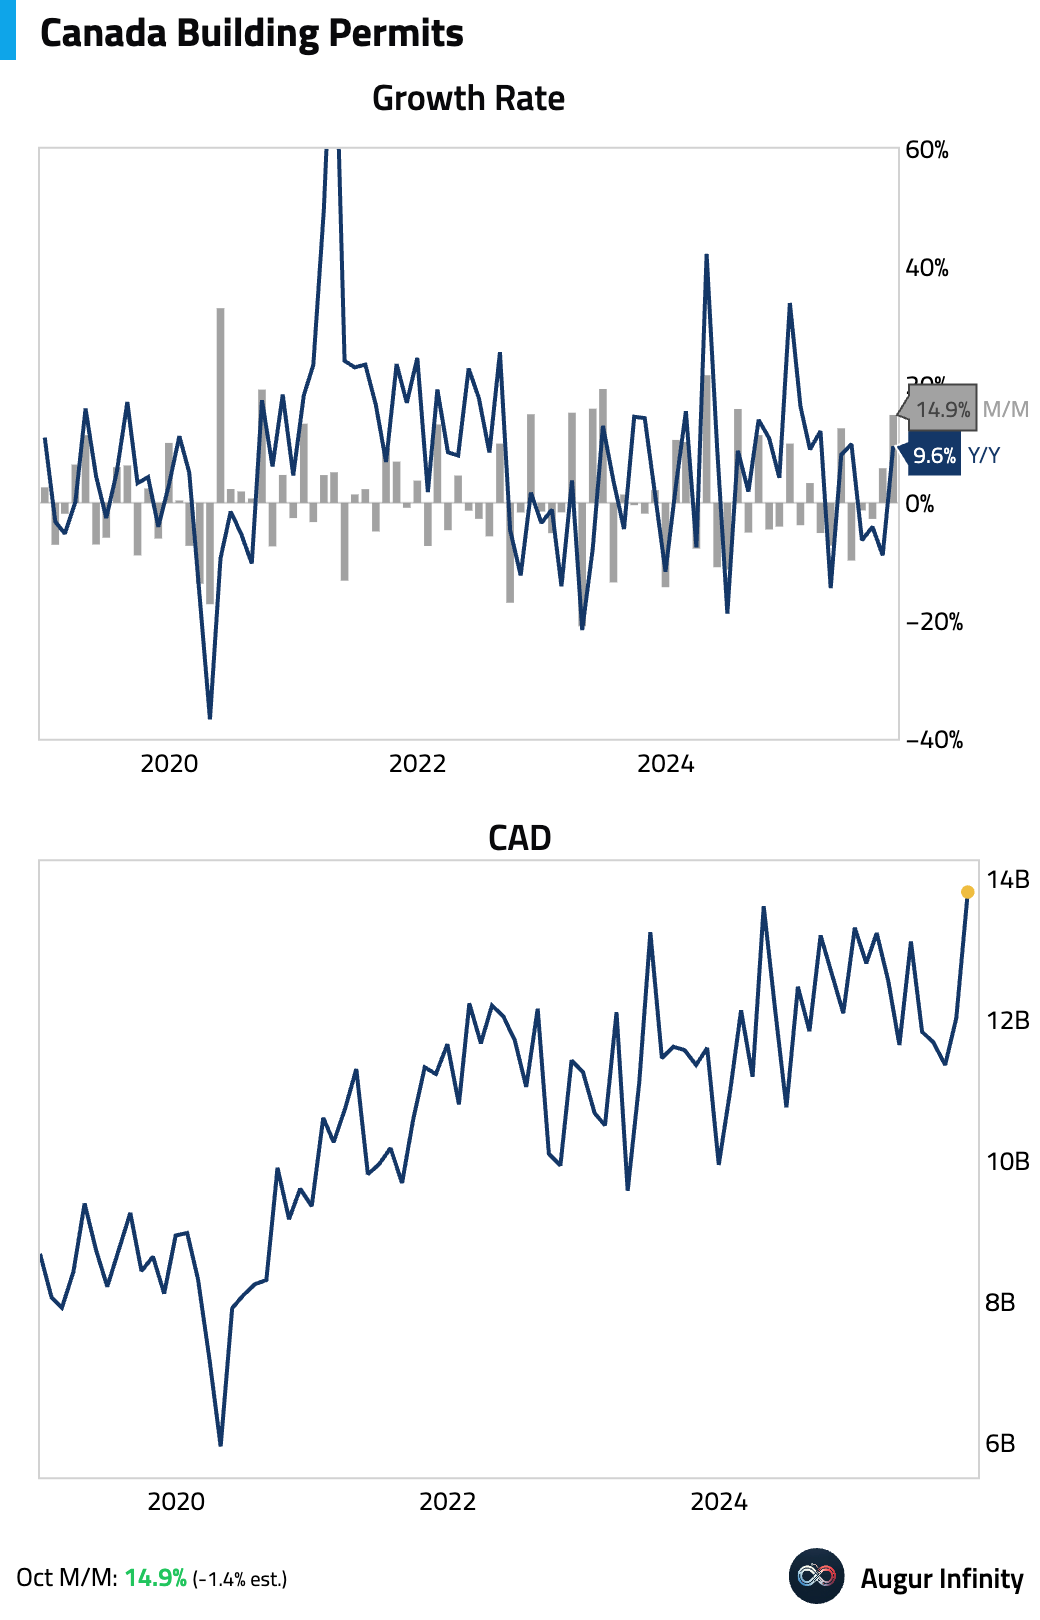
- Building permits surged in October, led by a surge in residential intentions—especially multi-family projects in Ontario—alongside solid gains in the commercial and institutional segments.
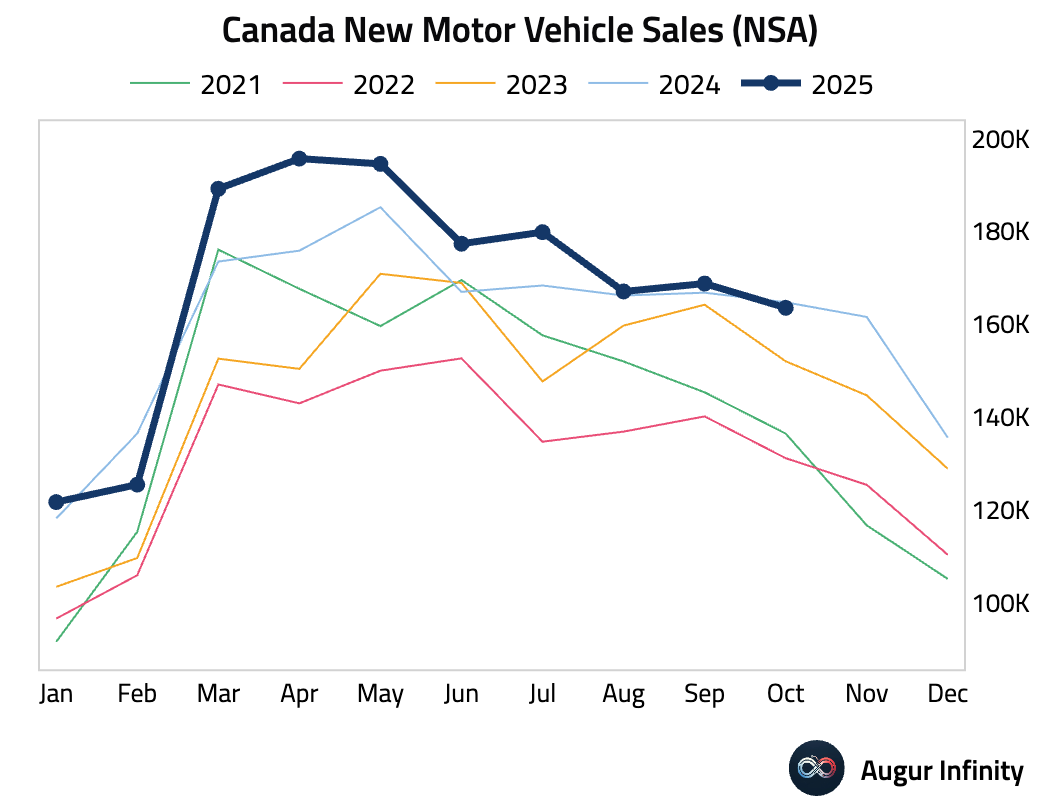
- New motor vehicle sales declined in October, the first year-over-year contraction since February.
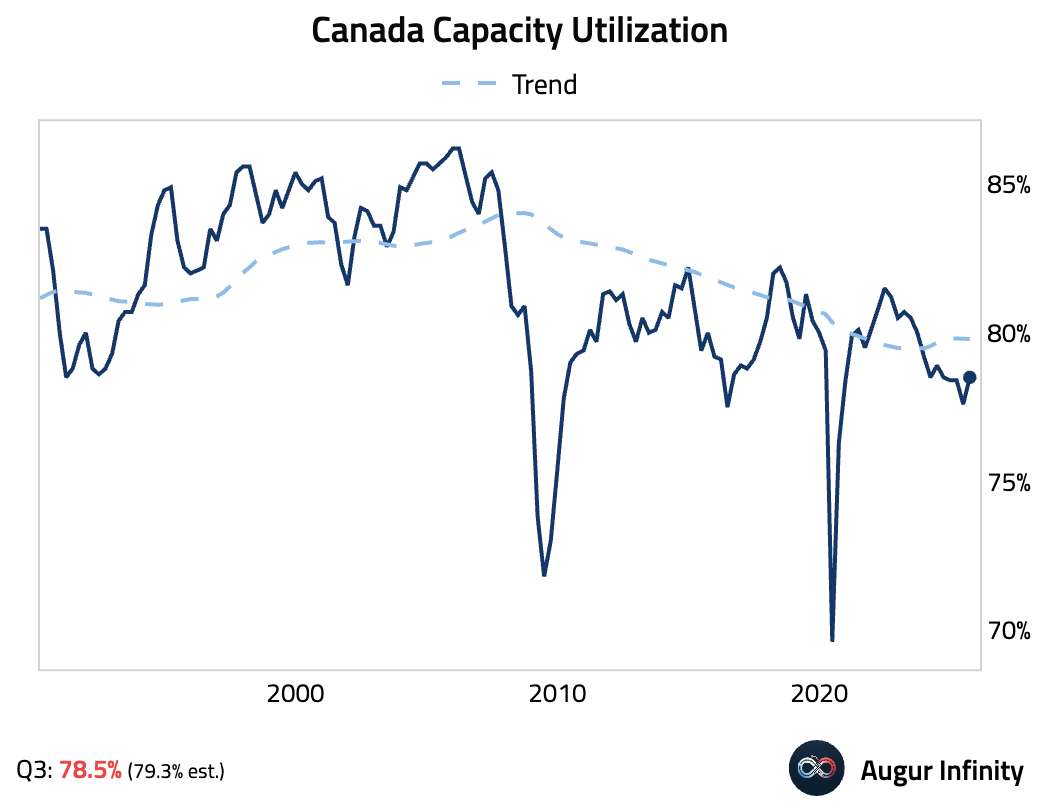
- Capacity utilization rose in Q3 but came in slightly below consensus estimates.
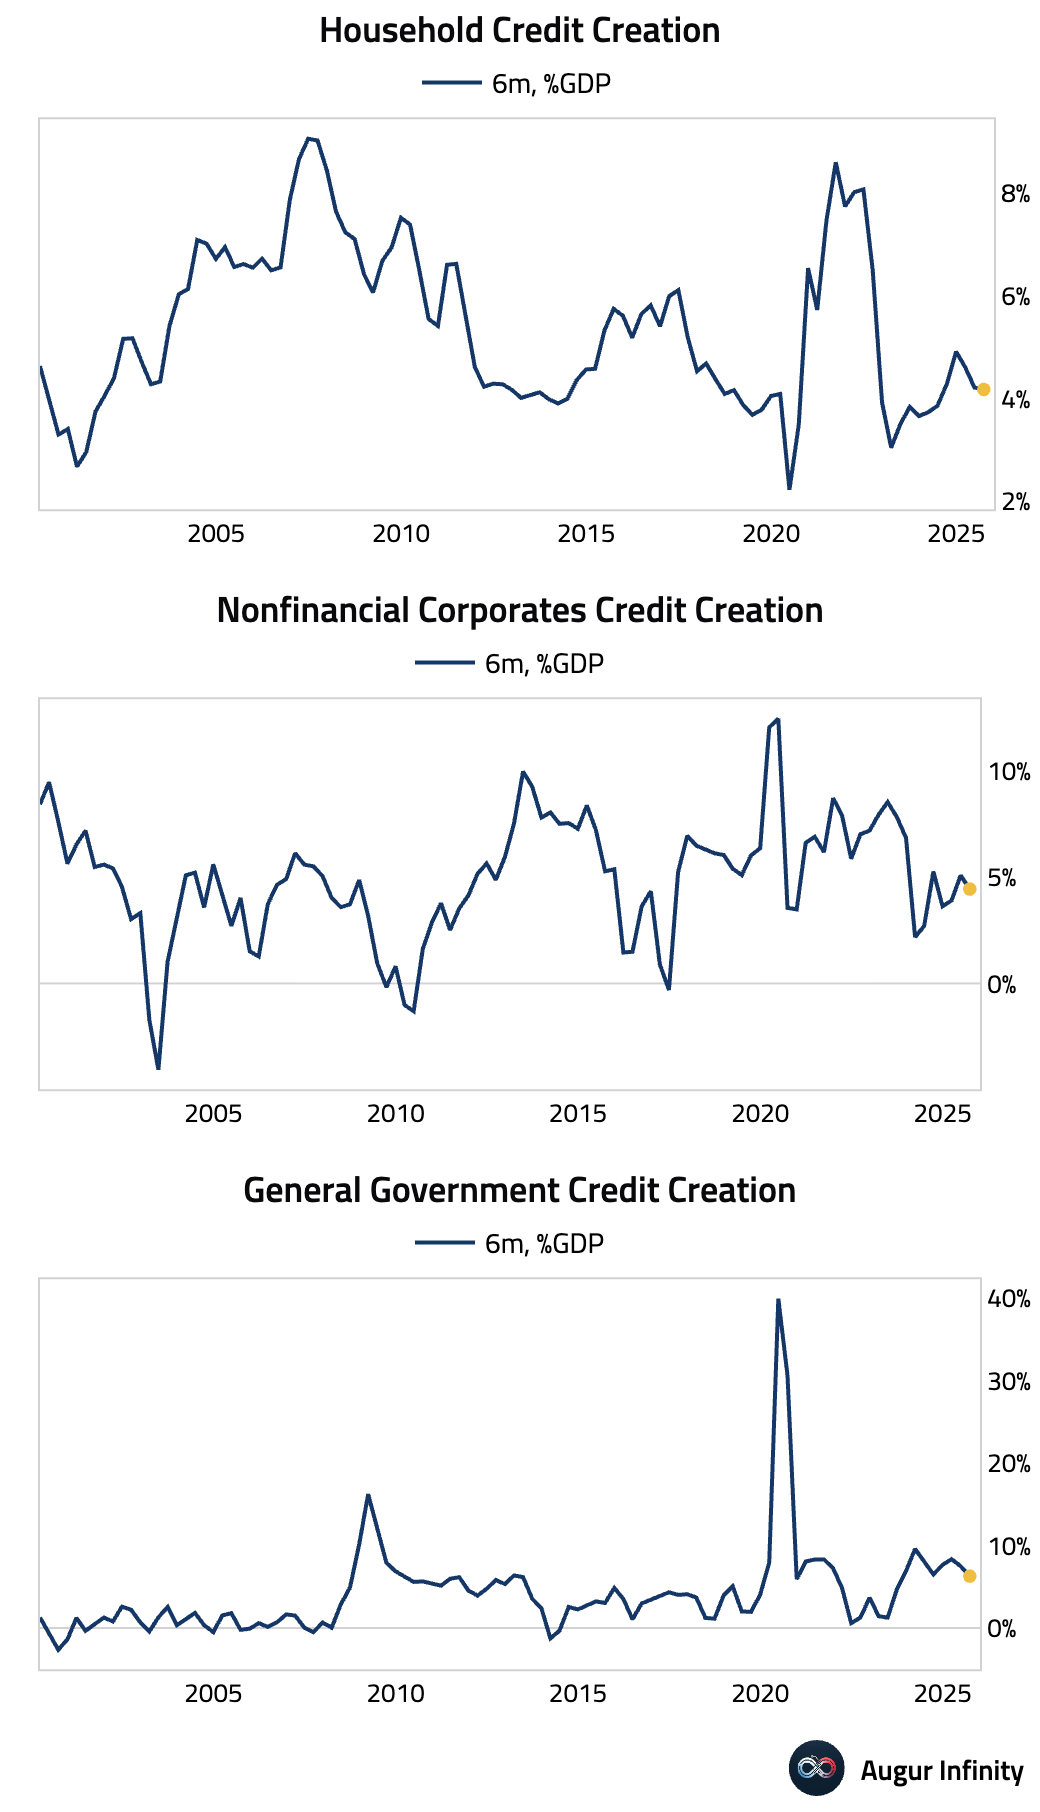
- Debt as a percentage of GDP ticked up slightly and remained elevated across sectors in Q3.
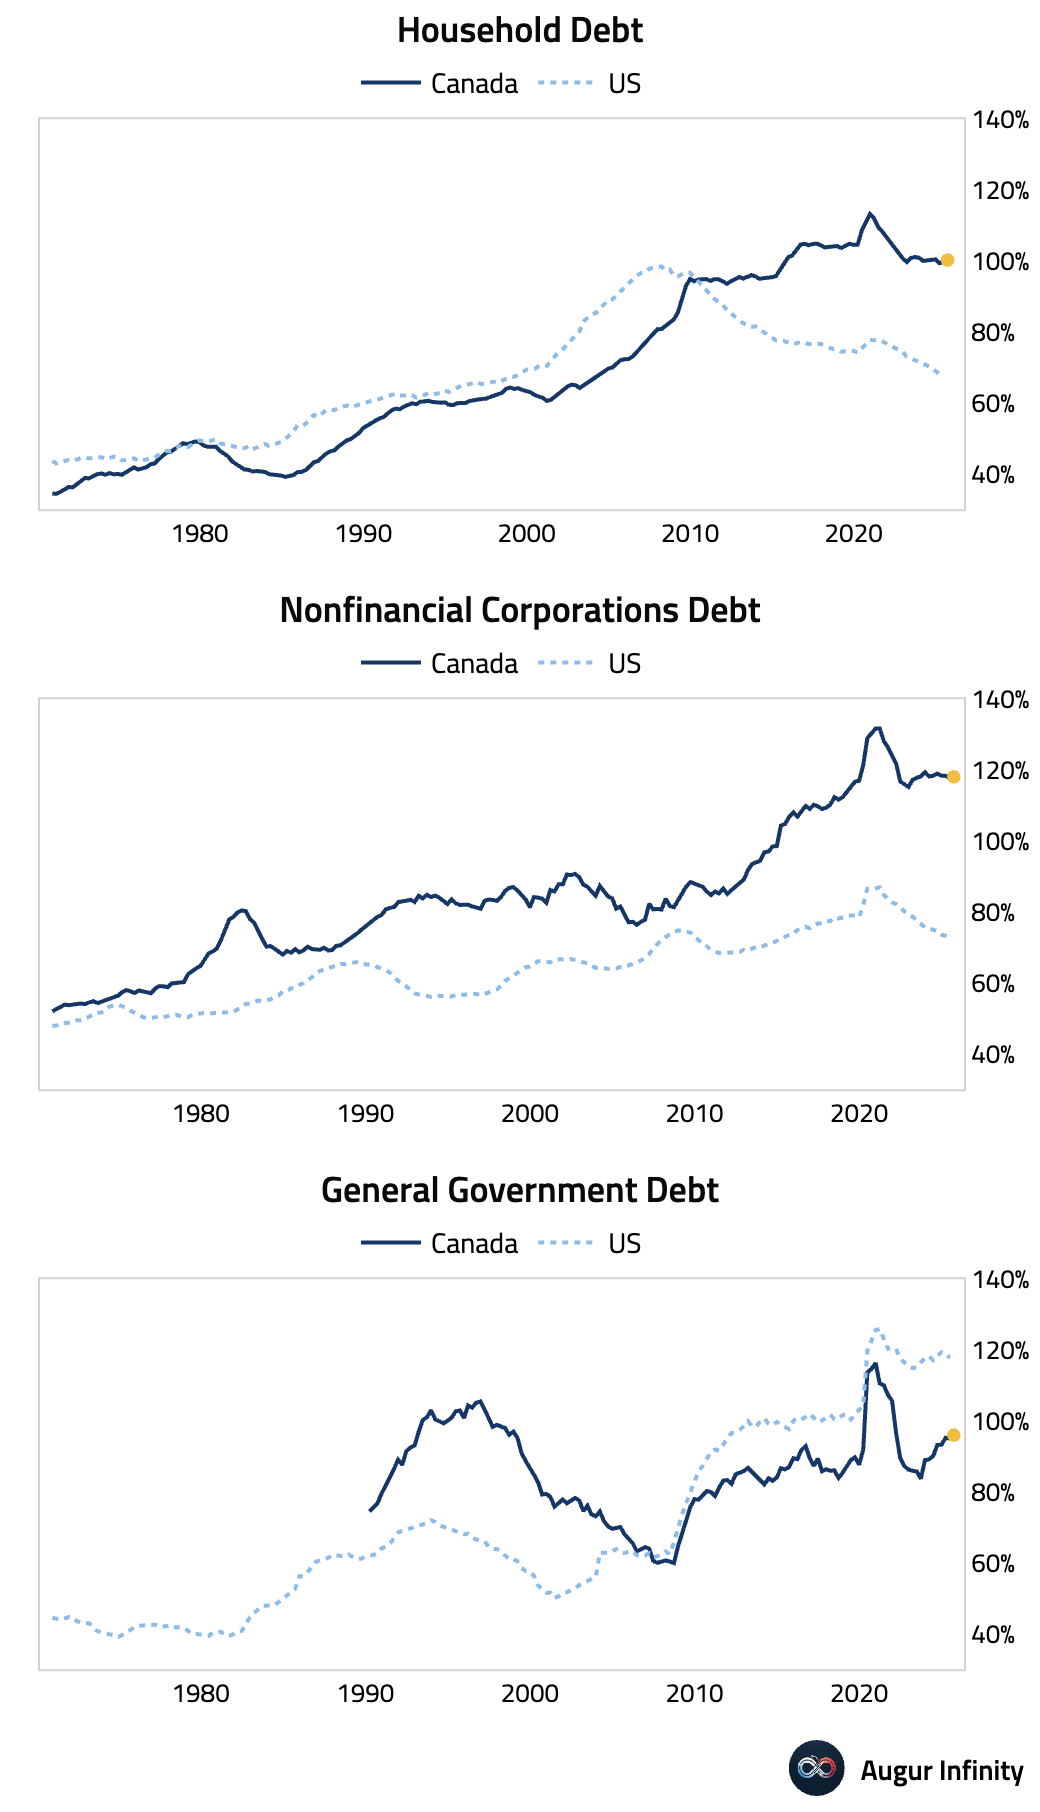
The pace of credit creation slowed over the past six months.
United Kingdom
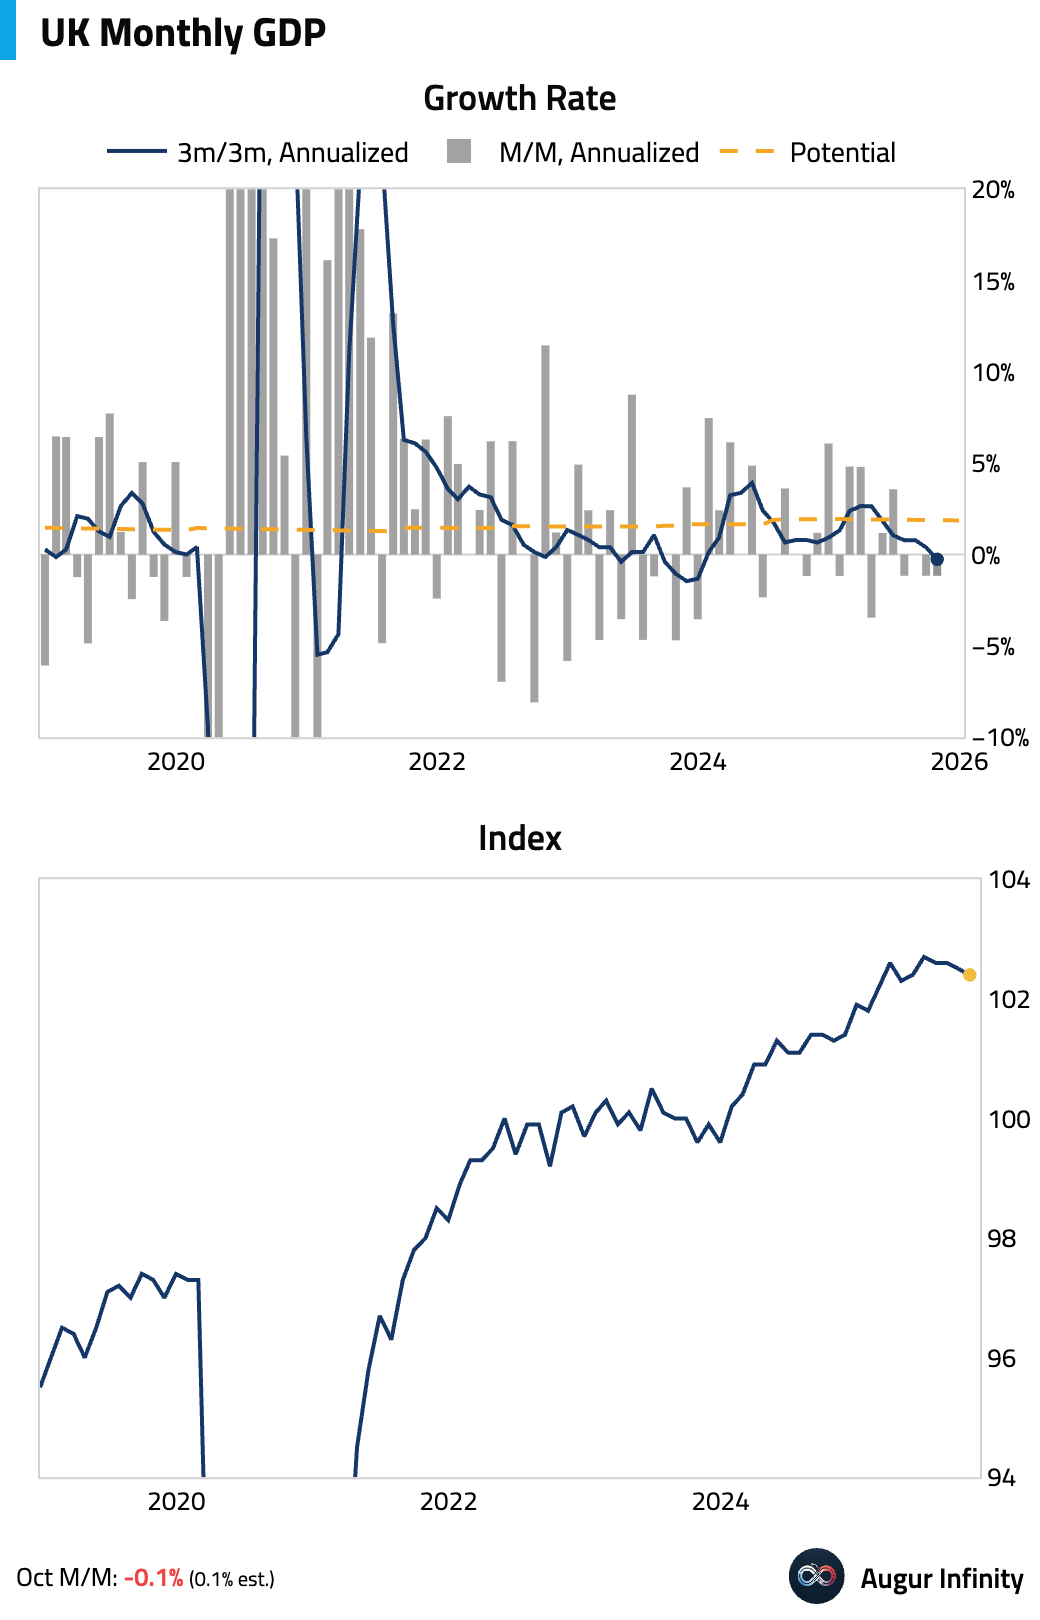
- GDP unexpectedly contracted by 0.1% month over month in October, missing consensus and marking the second consecutive monthly decline, with business uncertainty ahead of the Autumn Budget cited as a headwind.

Source: @financialtimes
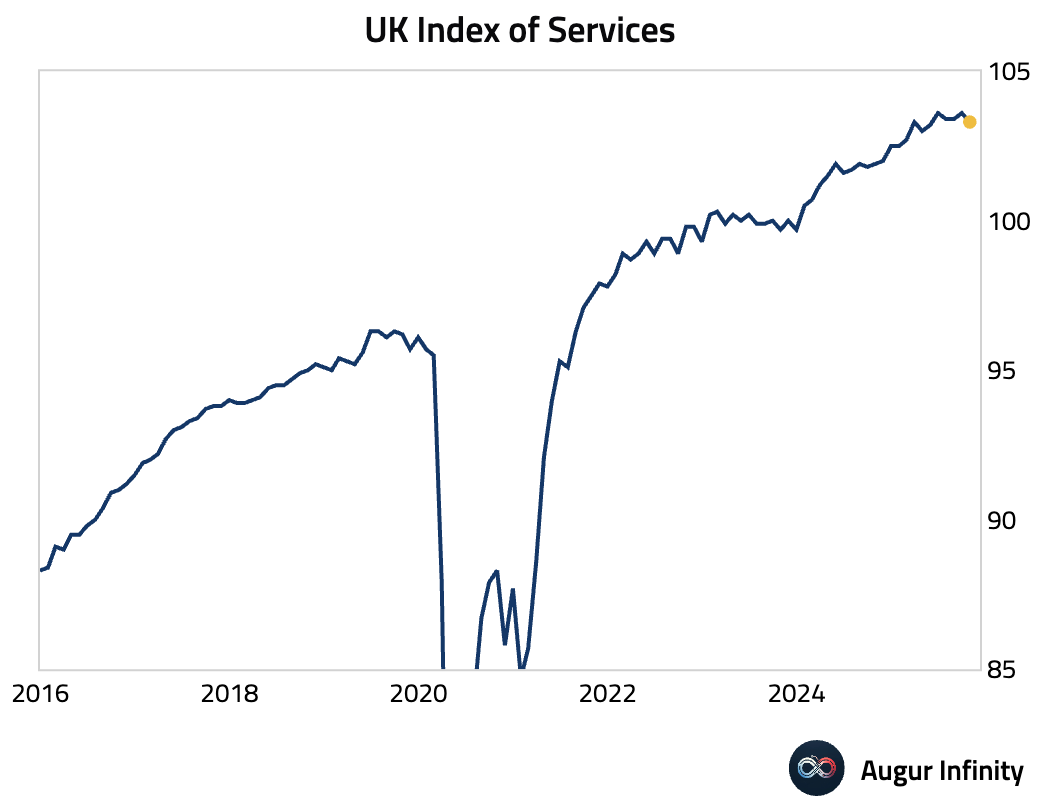
The drop was driven by a broad-based fall in the dominant services sector, with retailers, IT, and professional services showing particular weakness.
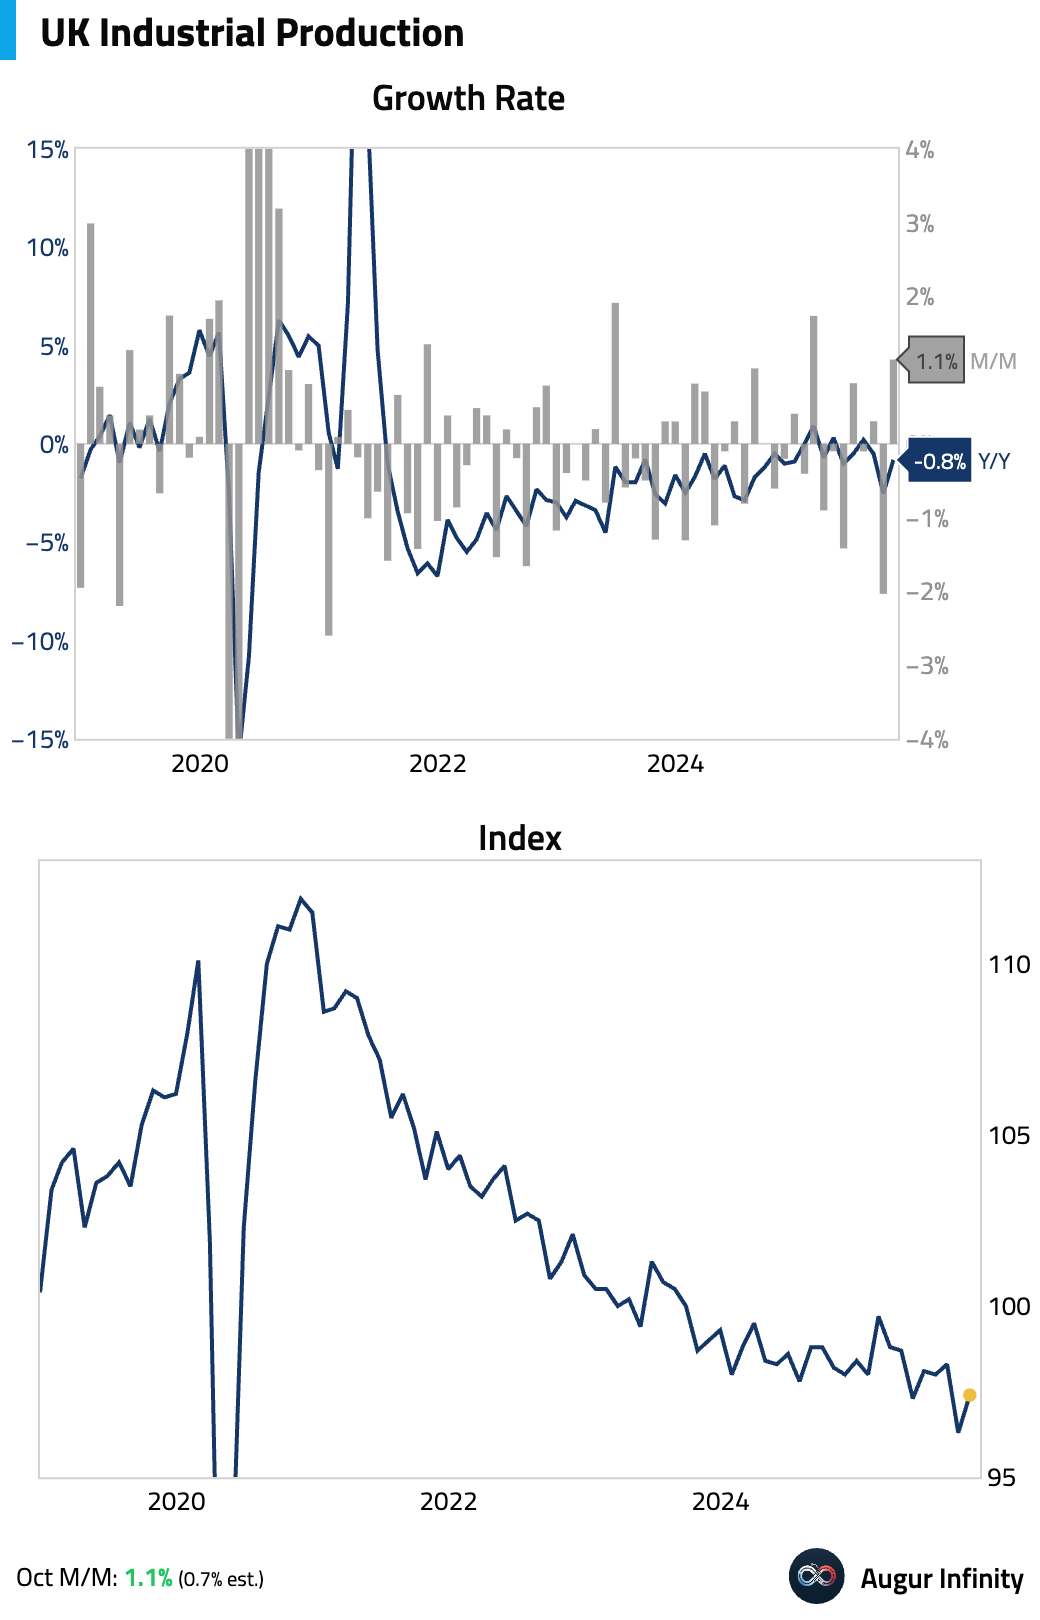
- Industrial production provided a bright spot in the UK’s October data, rebounding by a stronger-than-expected 1.1% M/M. The increase was partially driven by a recovery in auto production following a cyberattack in September.
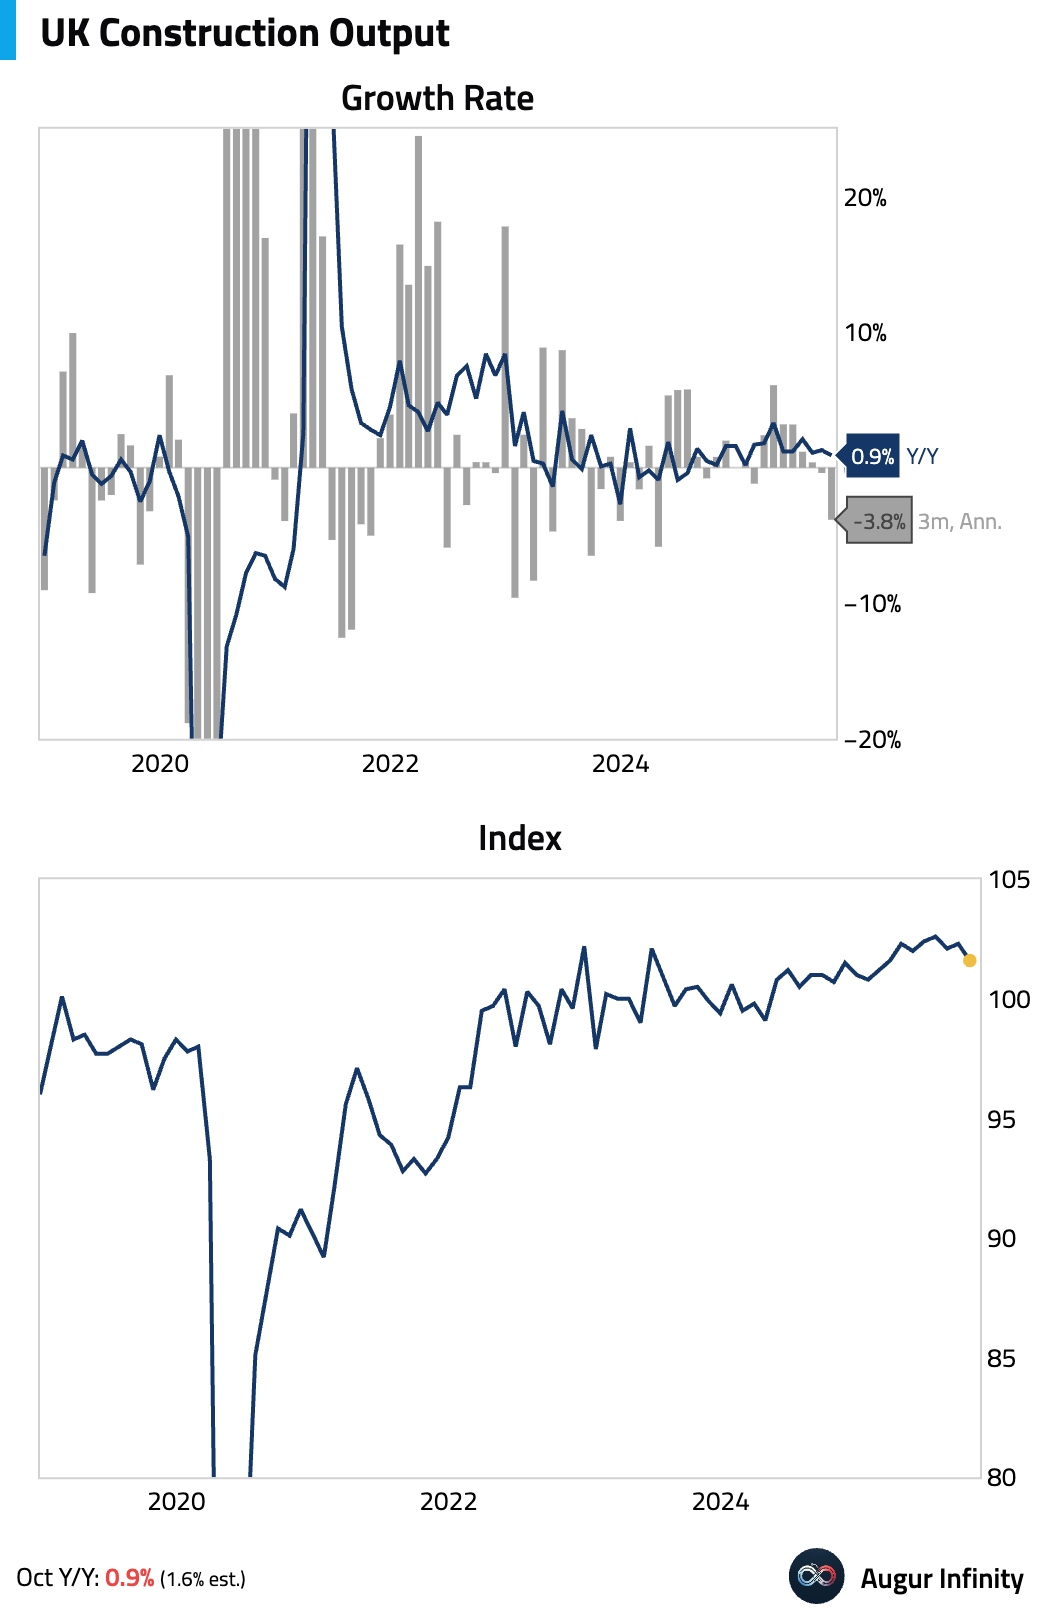
- Construction output declined, falling short of consensus estimates.
- Headline trade deficit widened sharply.
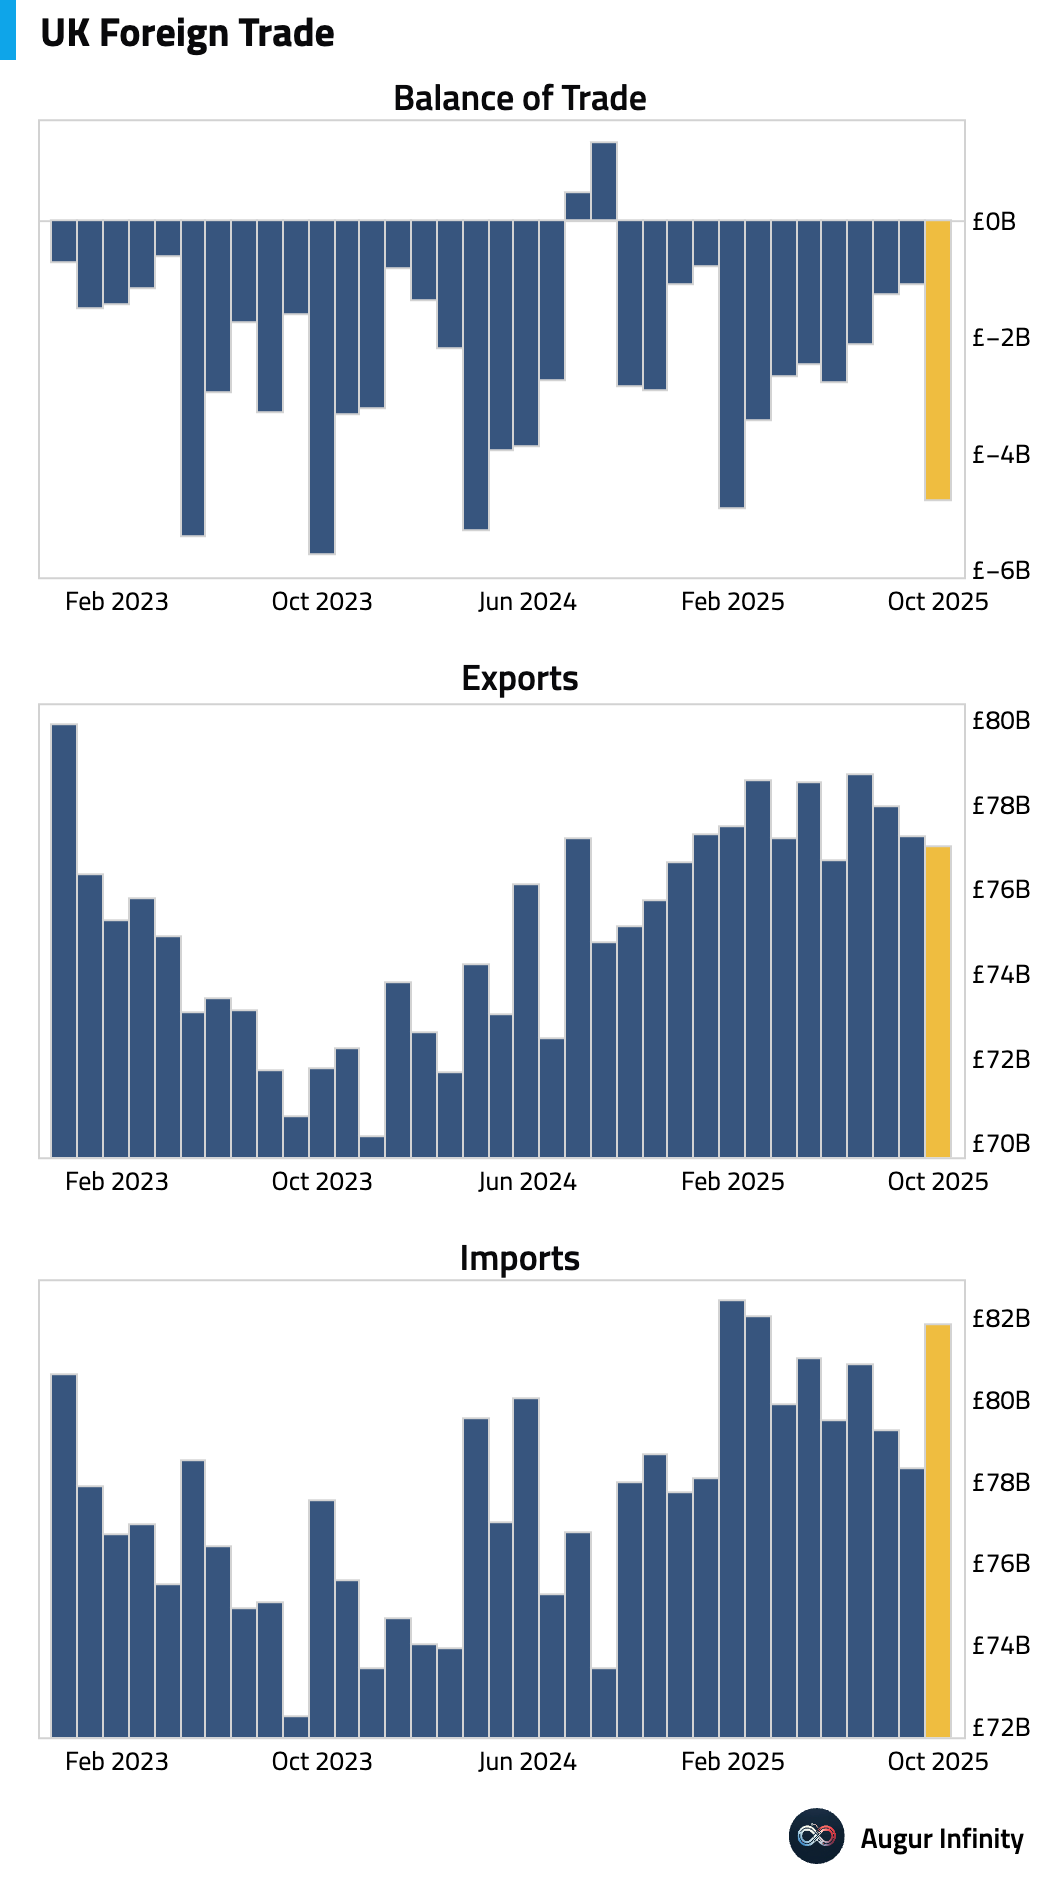
The deterioration was largely due to a plunge in volatile components like precious metals. The underlying balance, excluding these erratic items, swung to a surplus, suggesting hidden strength in core trade flows.

Source: Pantheon Macroeconomics
- The batch of data confirms our read that underlying growth has decelerated sharply.
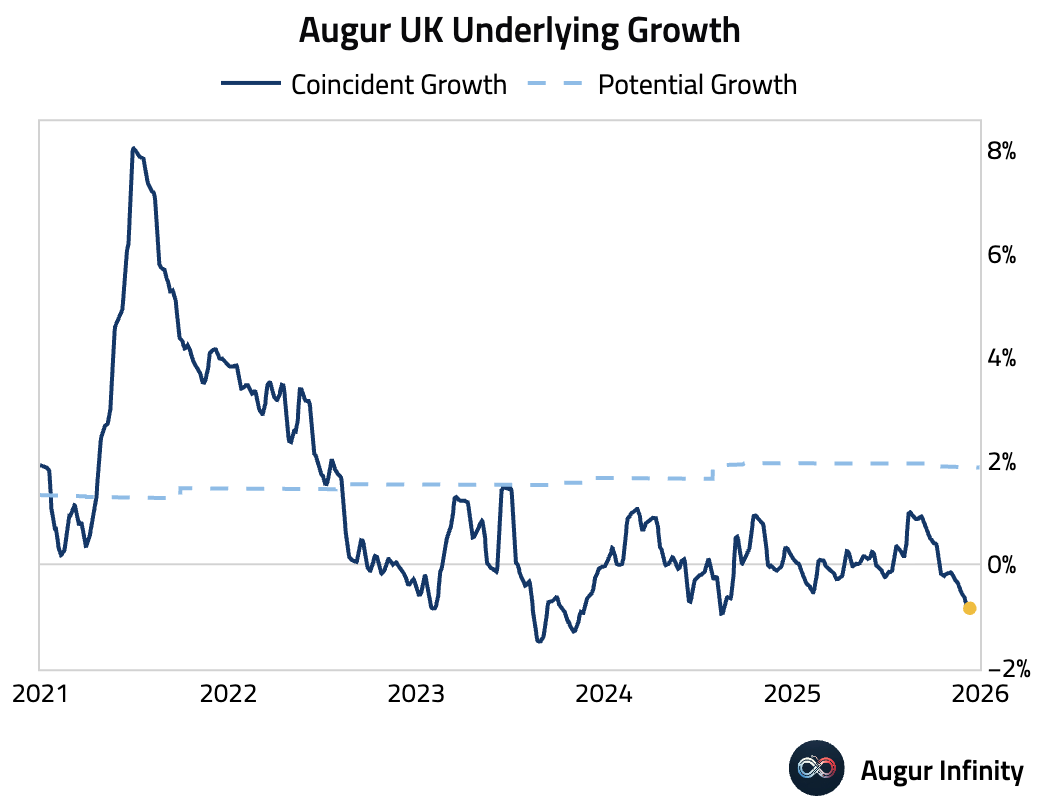
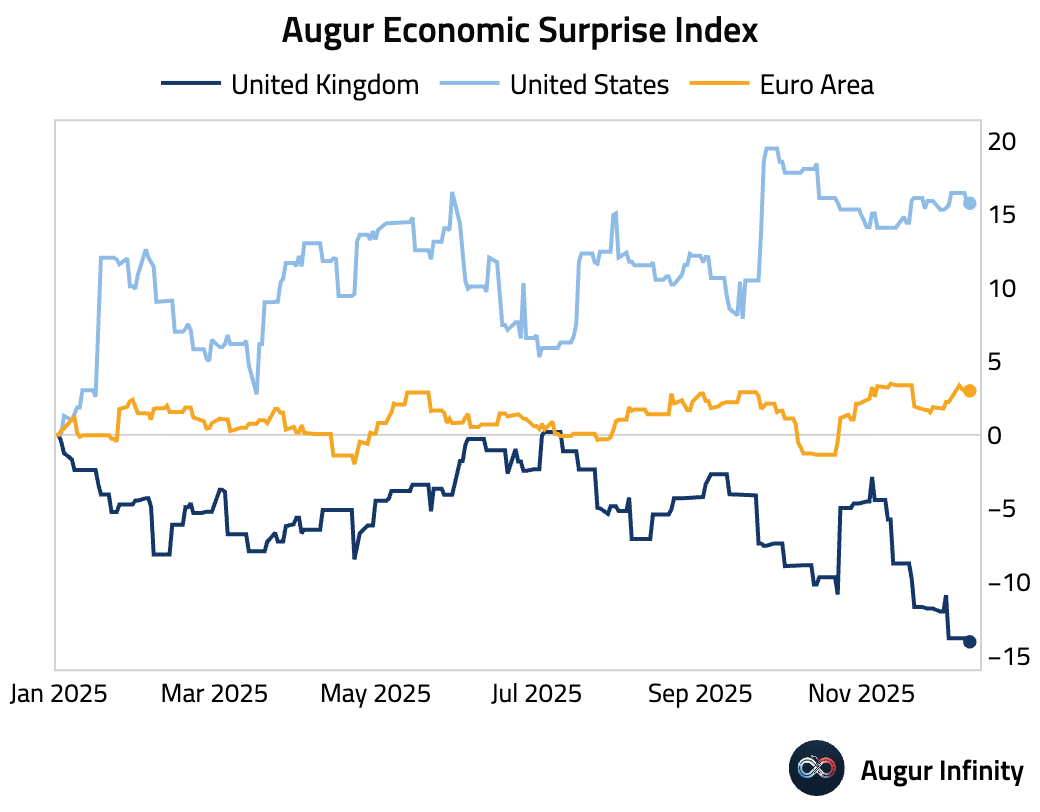
- UK economic data have also been weaker than analyst estimates this year, in contrast to the US and the euro area.
The Eurozone
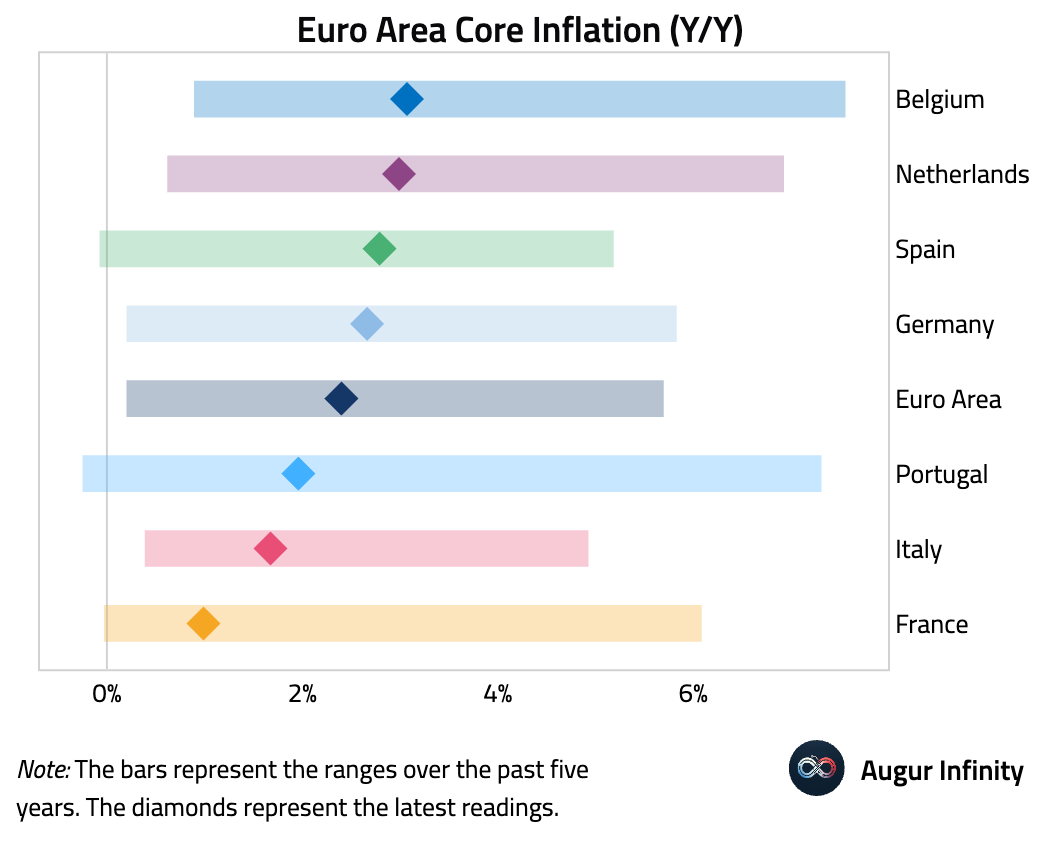
Here is a summary view of core inflation rates:
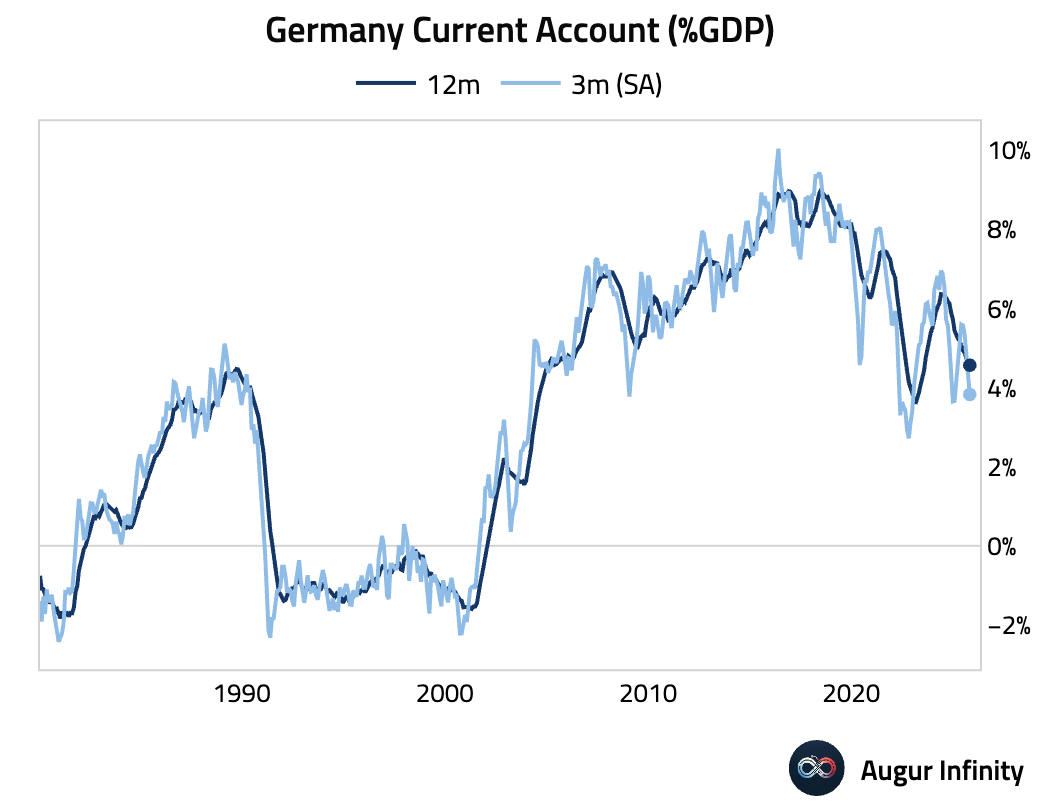
- Germany’s current account surplus narrowed.
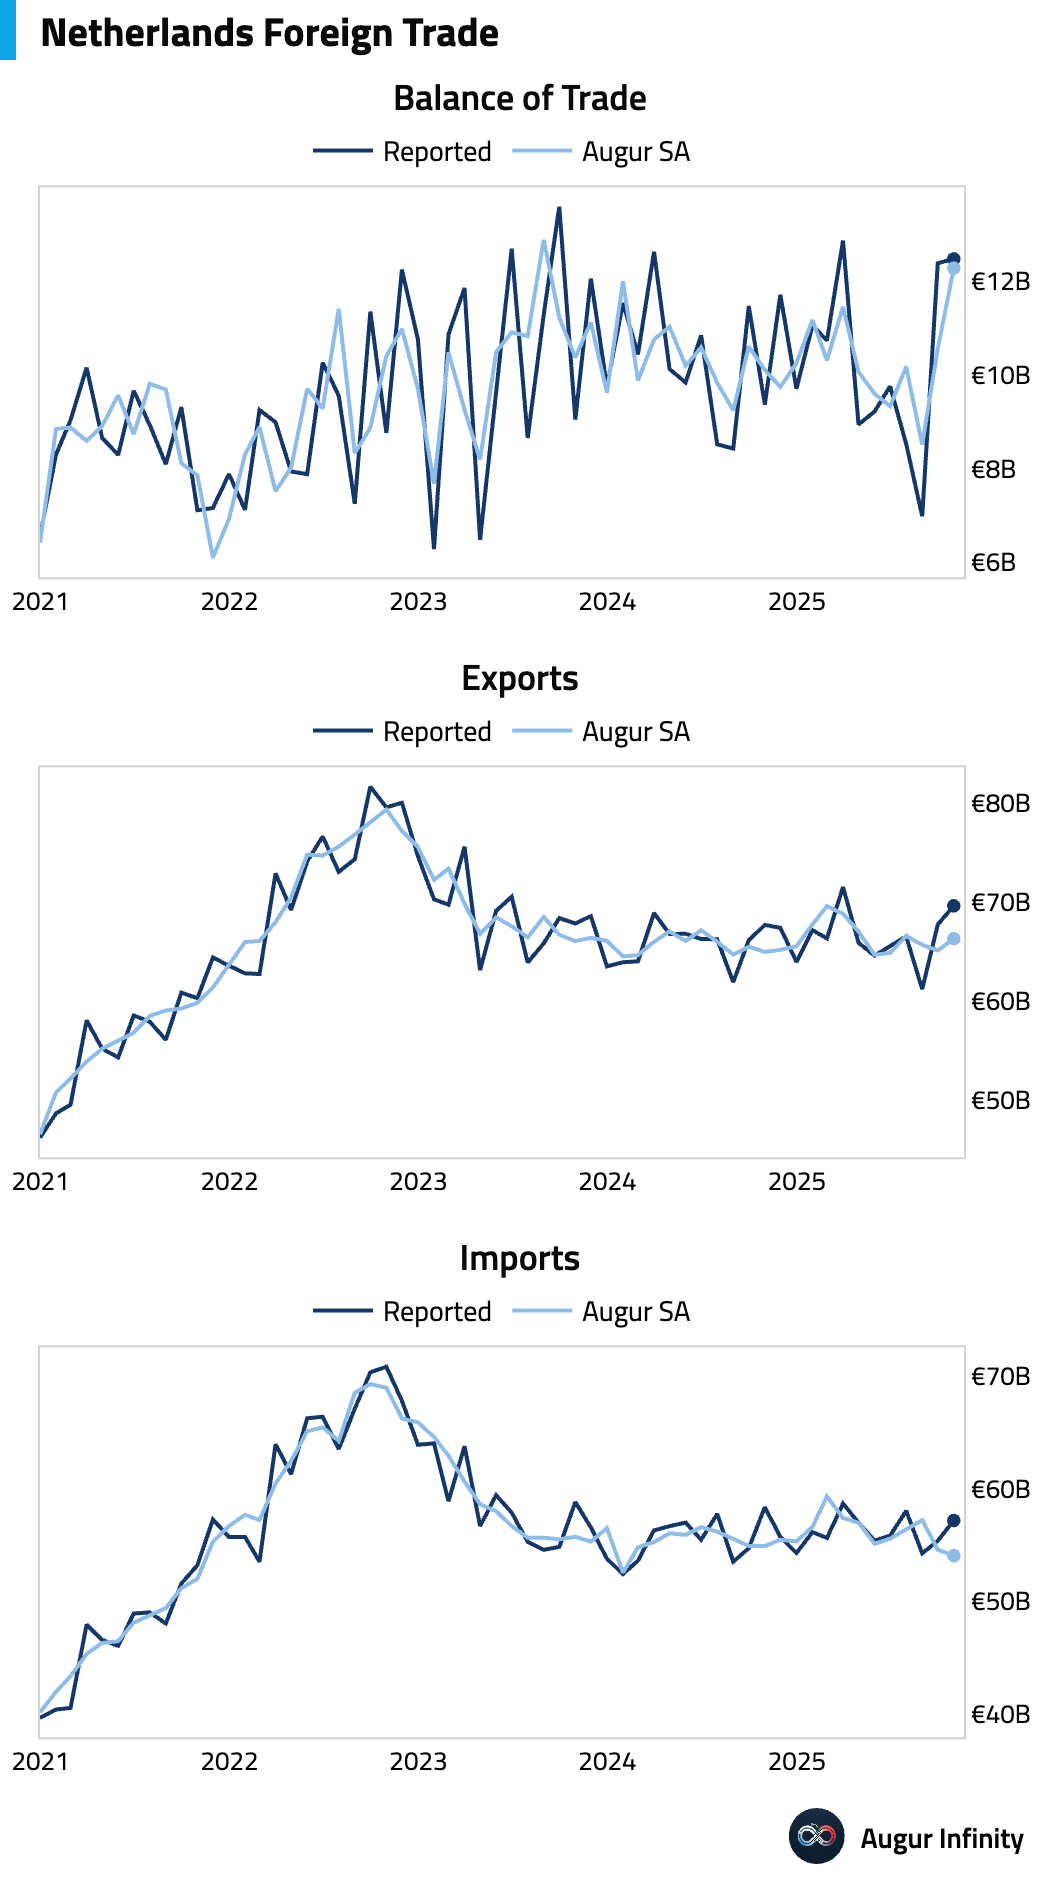
- The Netherlands’ trade surplus widened in October.
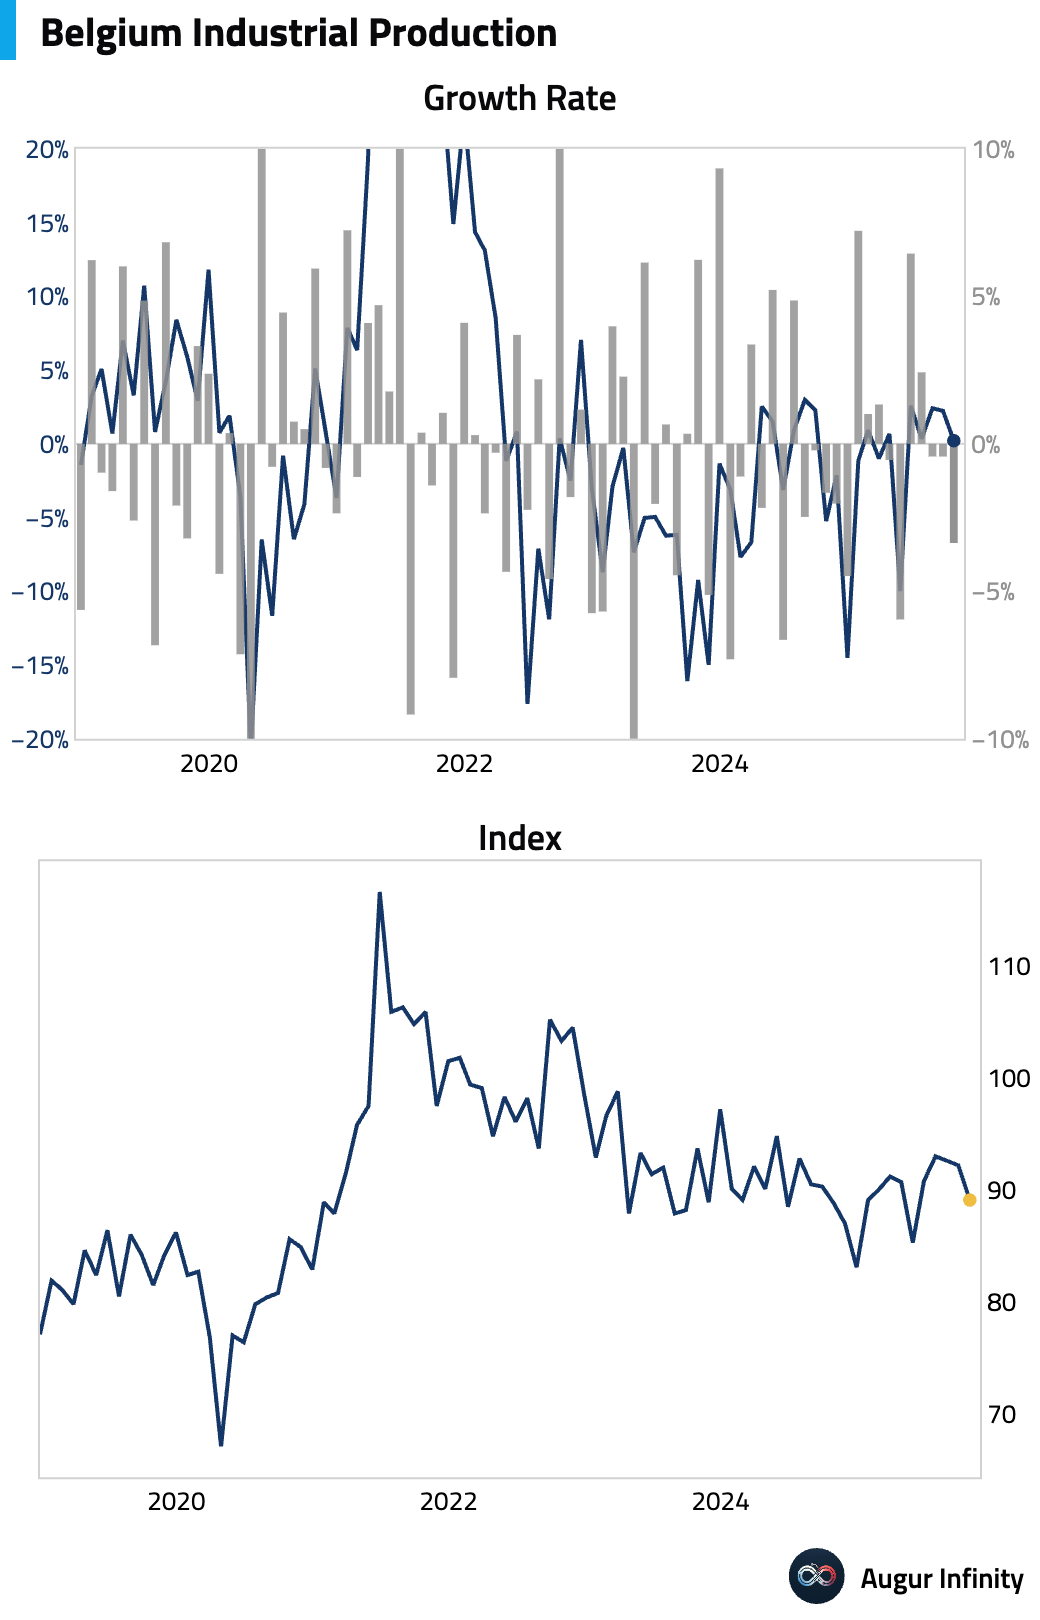
- Belgian industrial production fell sharply.
Europe
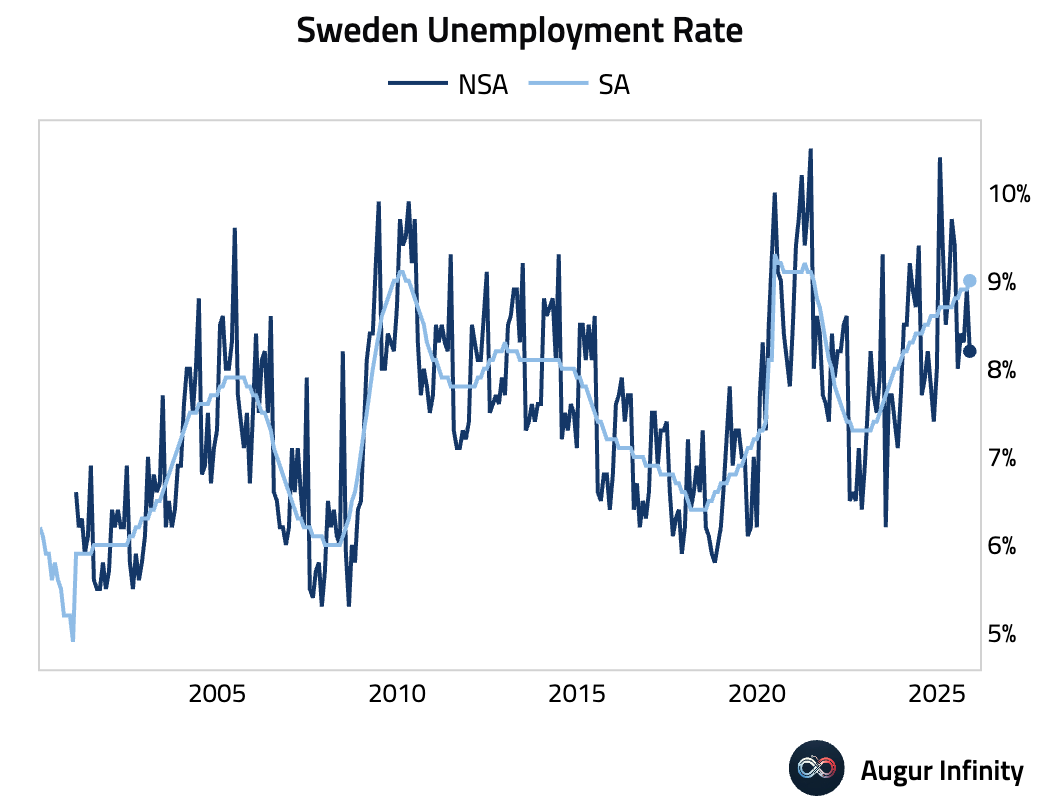
- Sweden’s unemployment rate remained elevated.
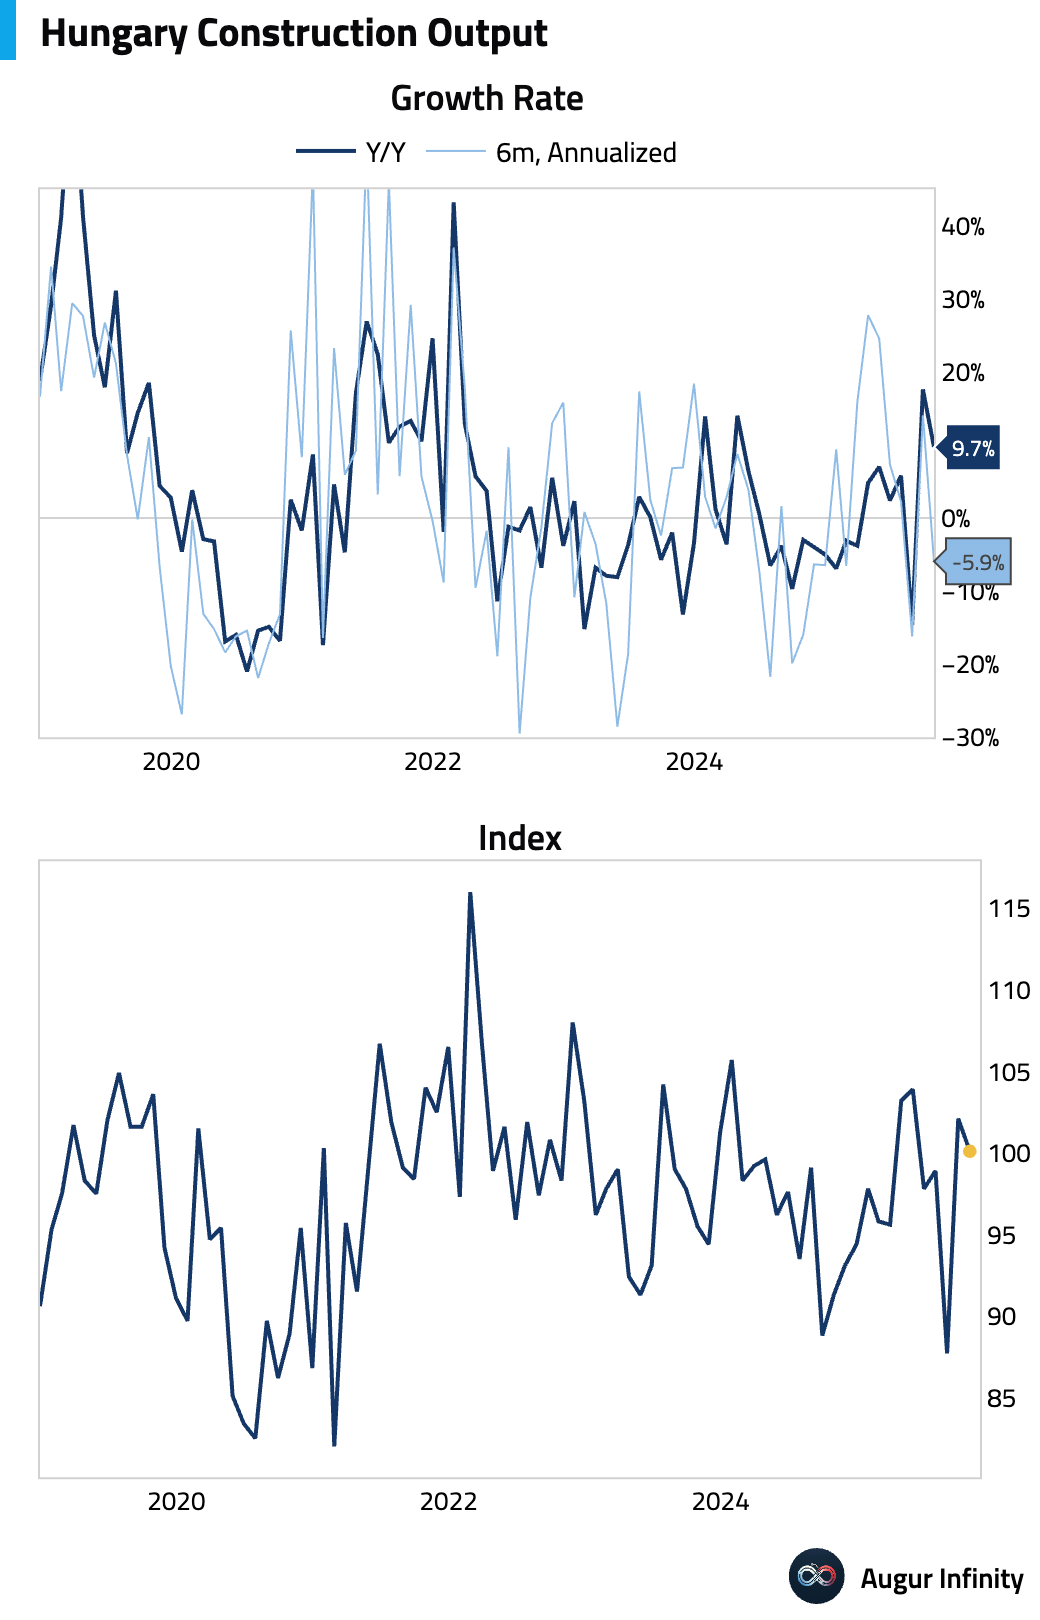
- Hungary’s industrial production improved month over month but contracted meaningfully year over year.

Construction output softened in October.
Hungary’s dollar bonds fell after reports that Prime Minister Orbán may seek to shift Hungary to a presidential system, raising political risk concerns ahead of April’s election.

Source: @markets
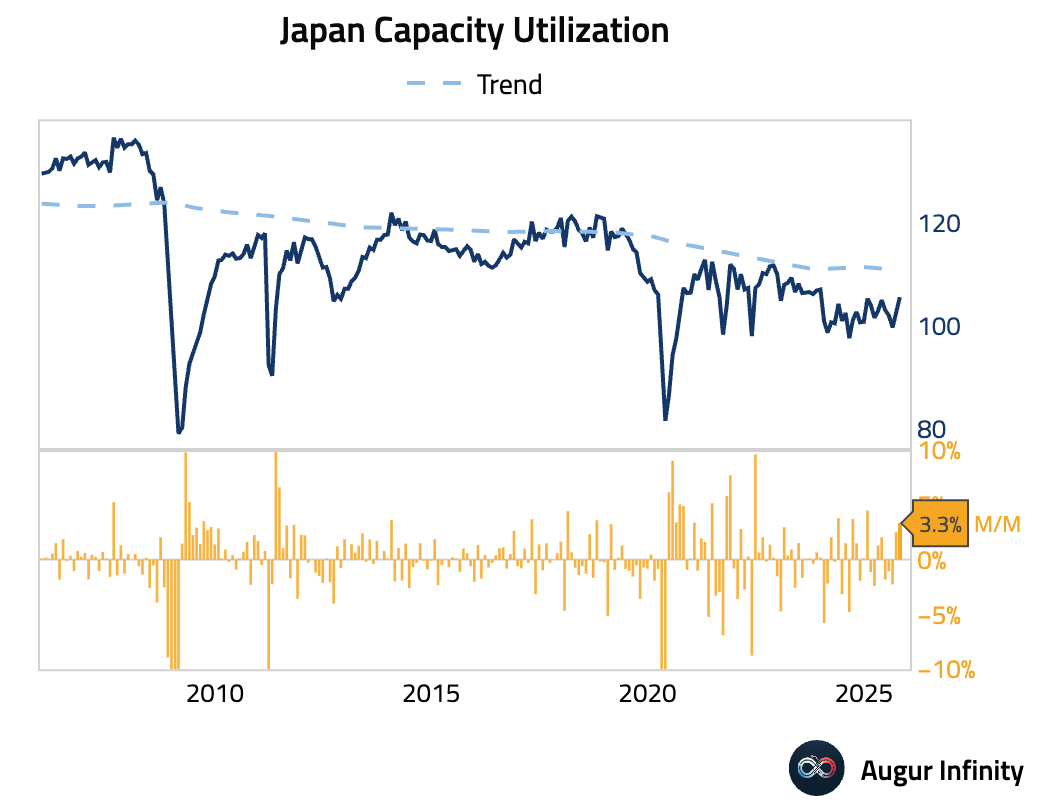
Japan
- Japan’s final industrial production for October was revised upward from 1.4% M/M to 1.5%.
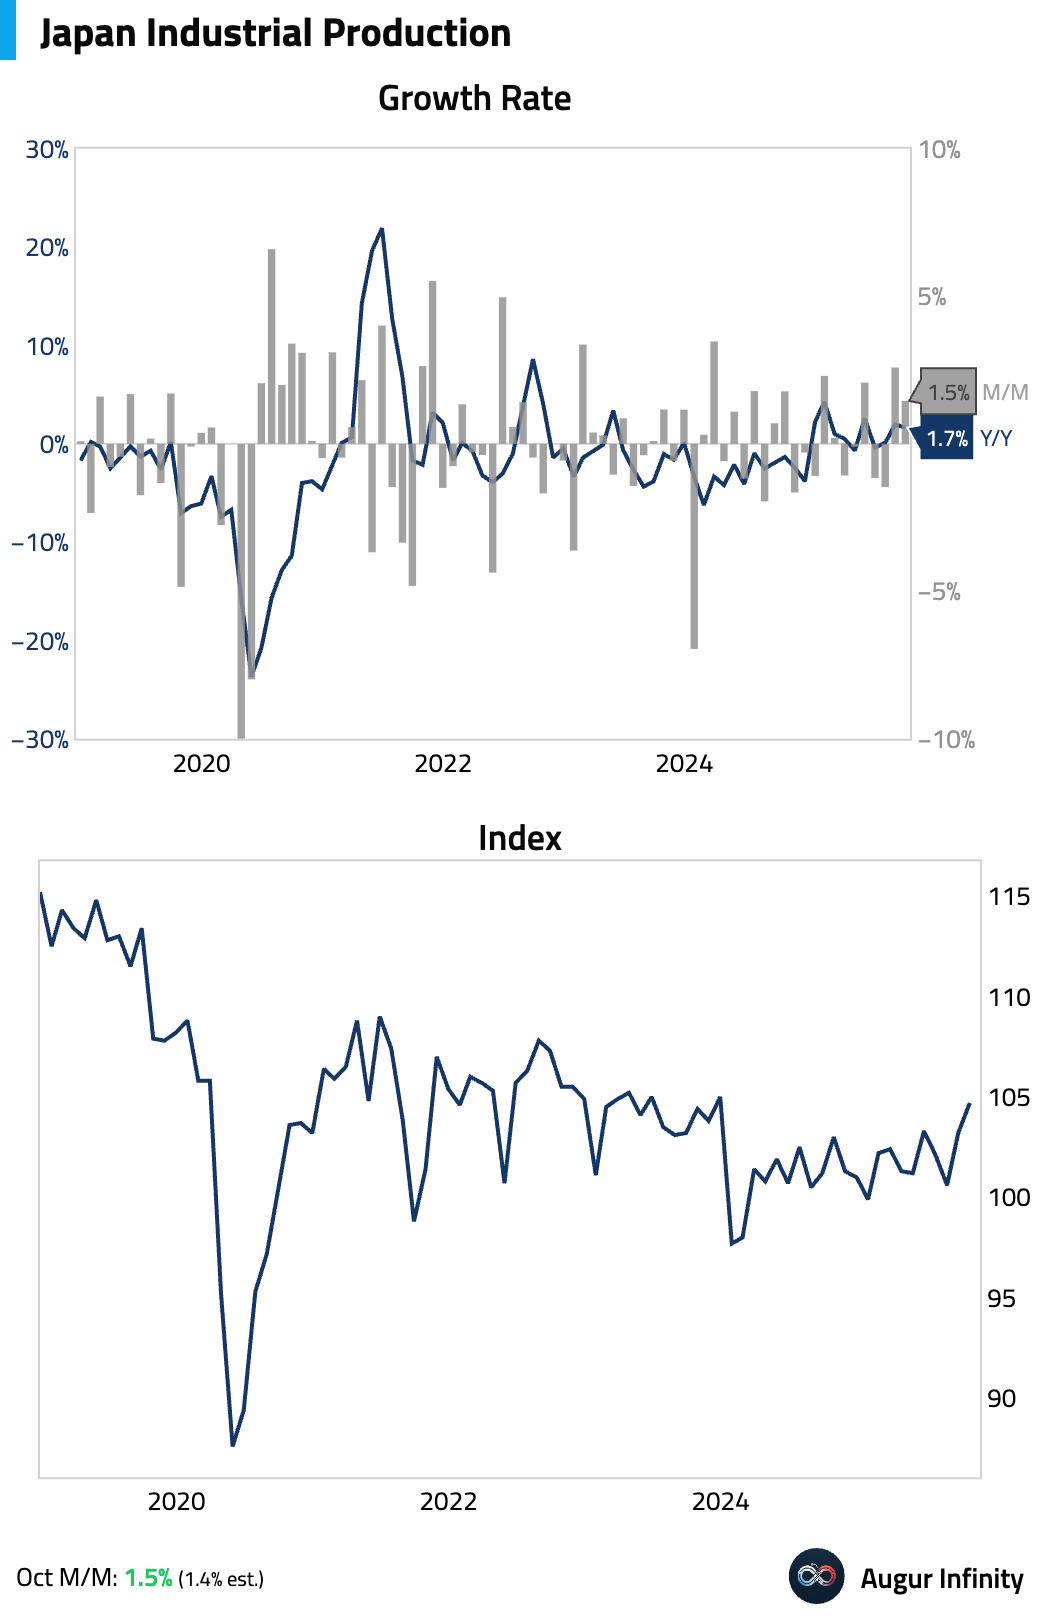
Capacity utilization improved to the highest level in nearly two years.
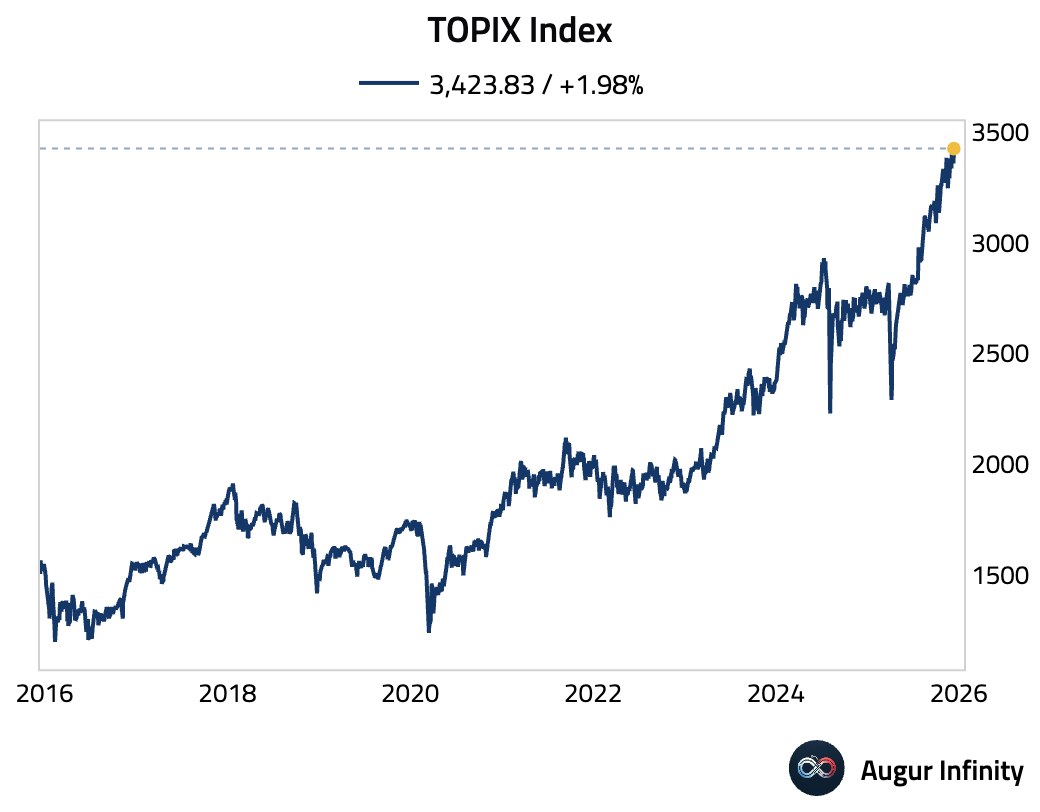
- The TOPIX Index closed at an all-time high.
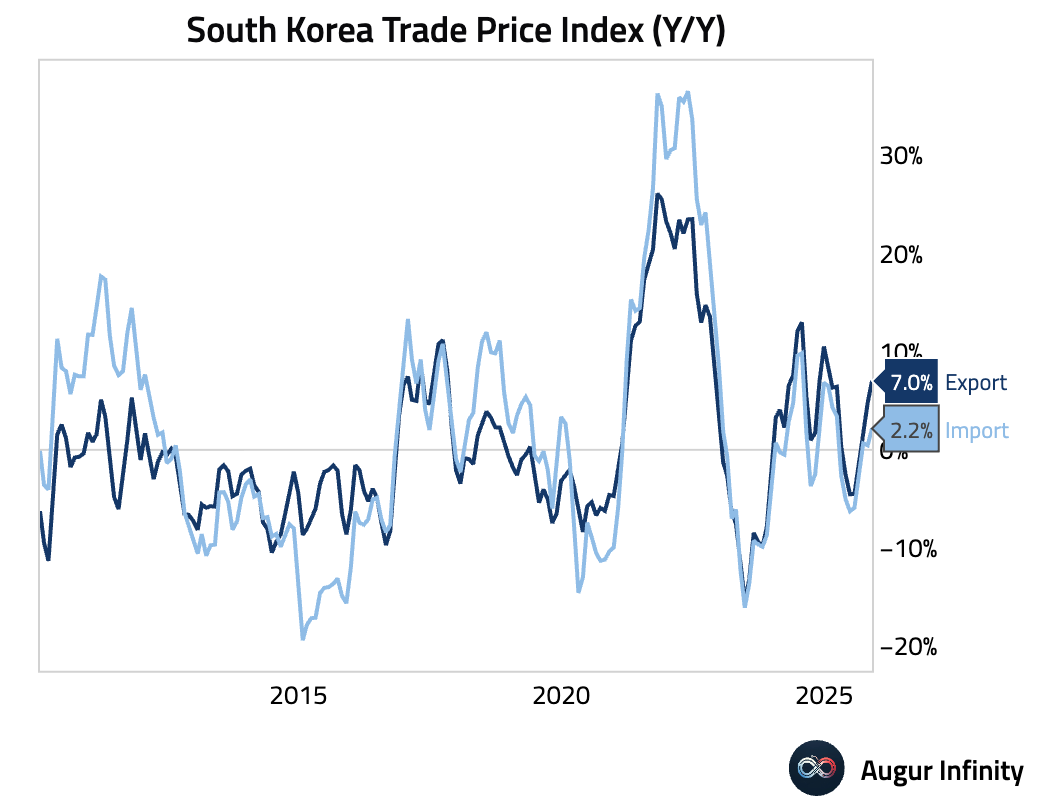
Asia-Pacific
- In South Korea, both export prices and import prices rose in November.
- New Zealand’s manufacturing PMI marked a second month of modest expansion driven by gains in production, employment, and new orders.
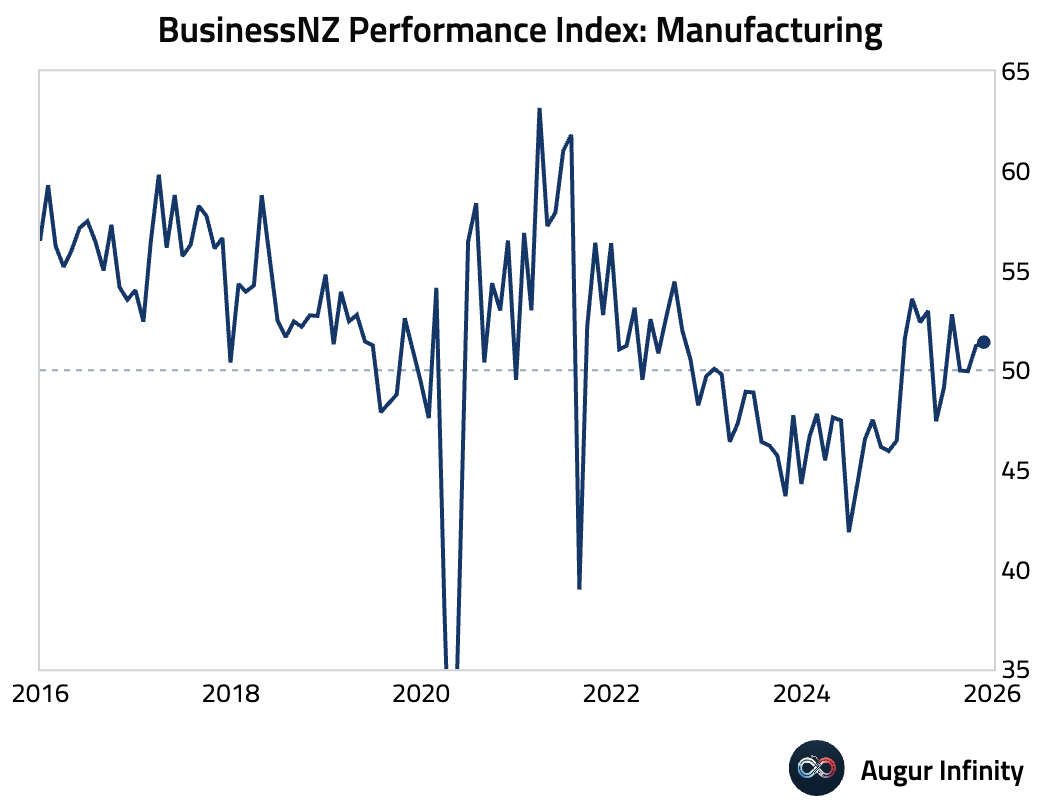
Electronic card spending jumped by 1.2% M/M, indicating solid demand growth.
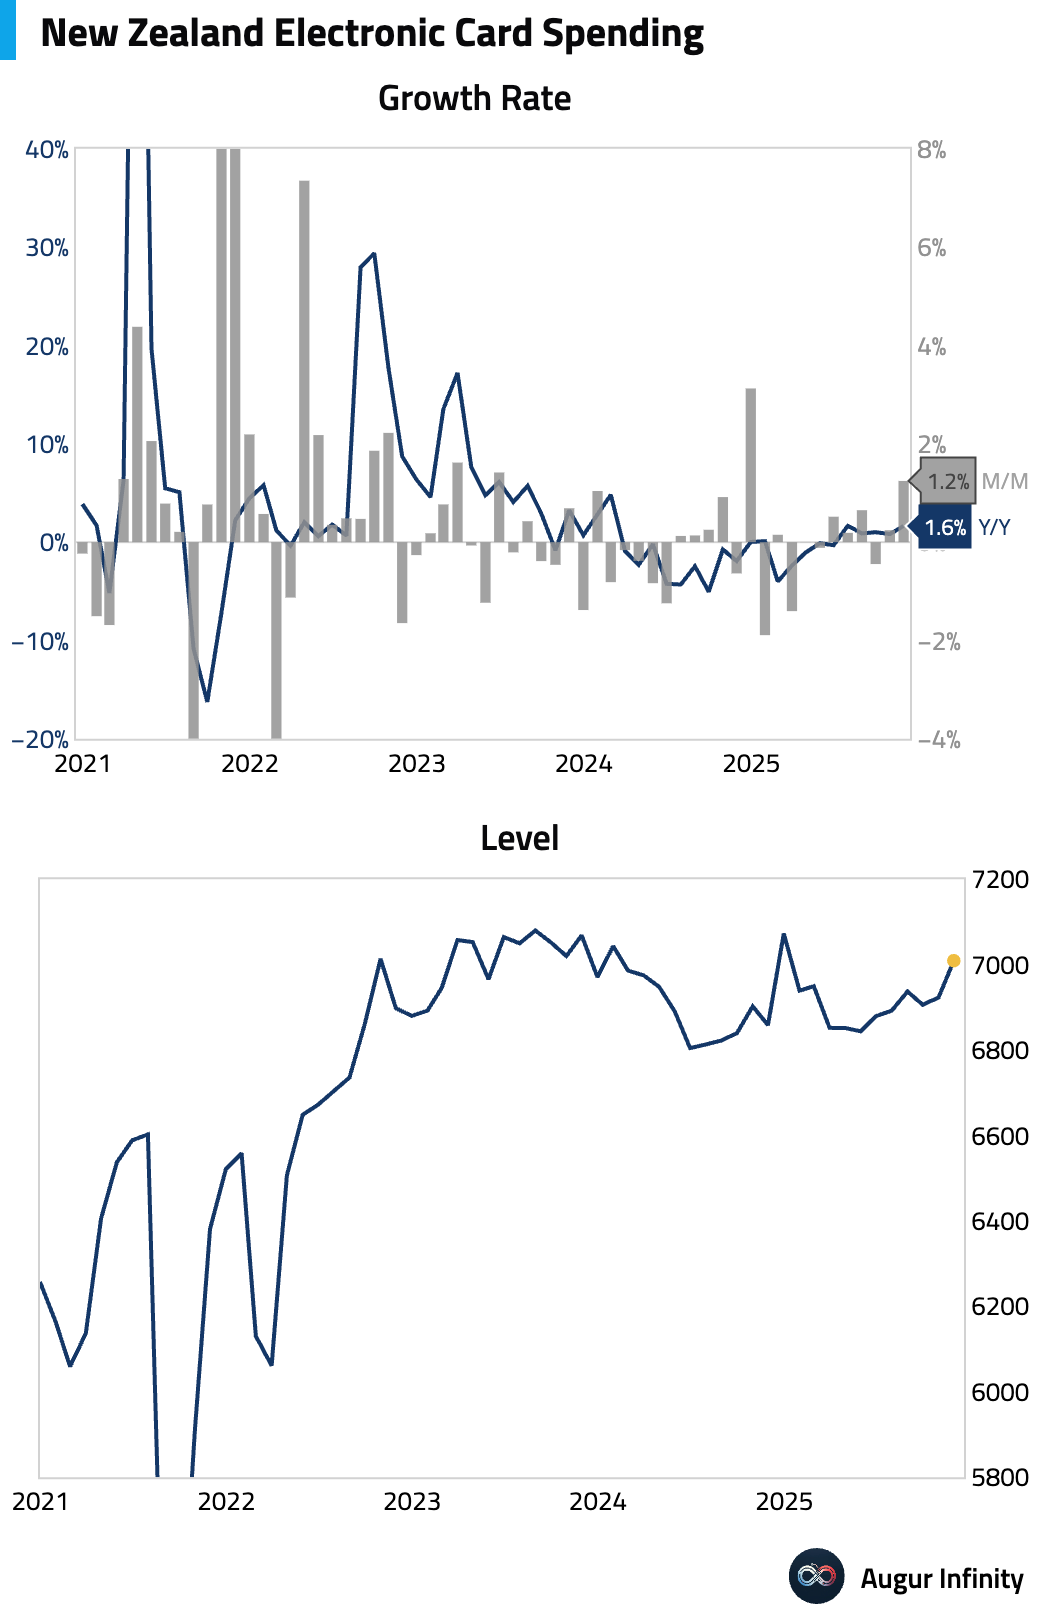
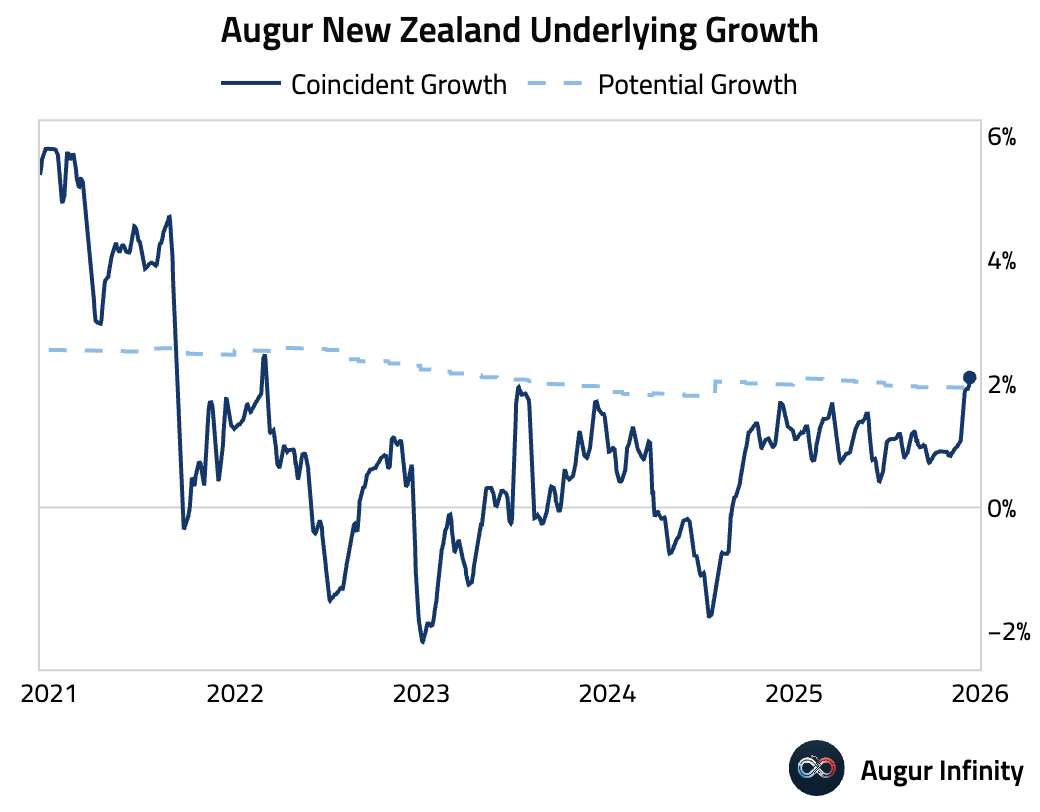
Our coincident growth estimate for New Zealand has improved meaningfully, now slightly above potential.
China
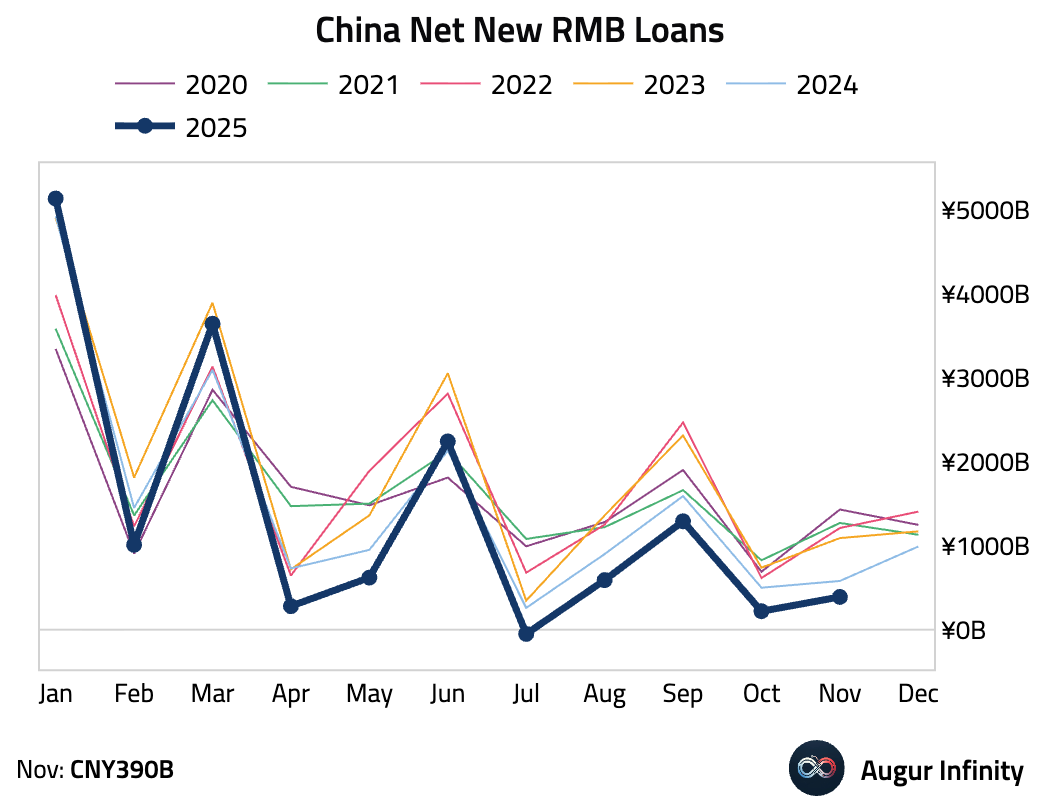
- China’s money and credit data paint a picture of weak credit demand.
New RMB loans remained much lower than the same month last year, with new household loans turning negative.
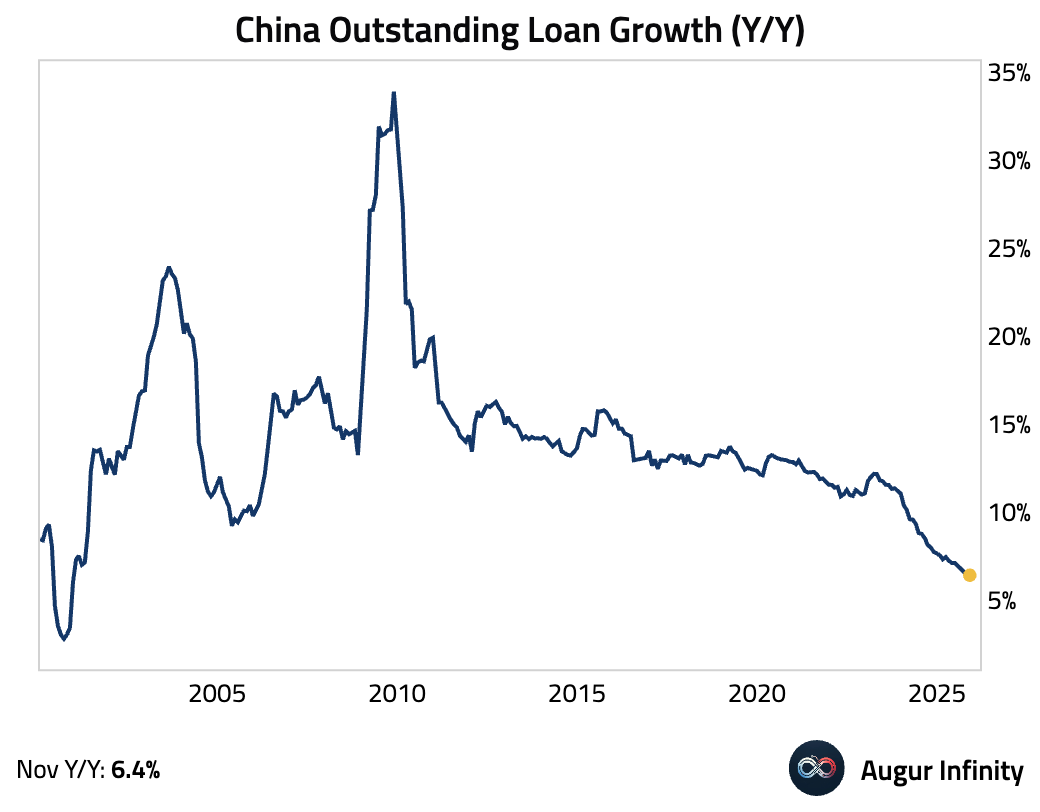
Outstanding RMB loan growth slowed to its slowest pace in 25 years.
Total social financing (TSF) rose month over month due to higher issuance of government bonds, corporate bonds, and undiscounted bankers’ acceptance bills.
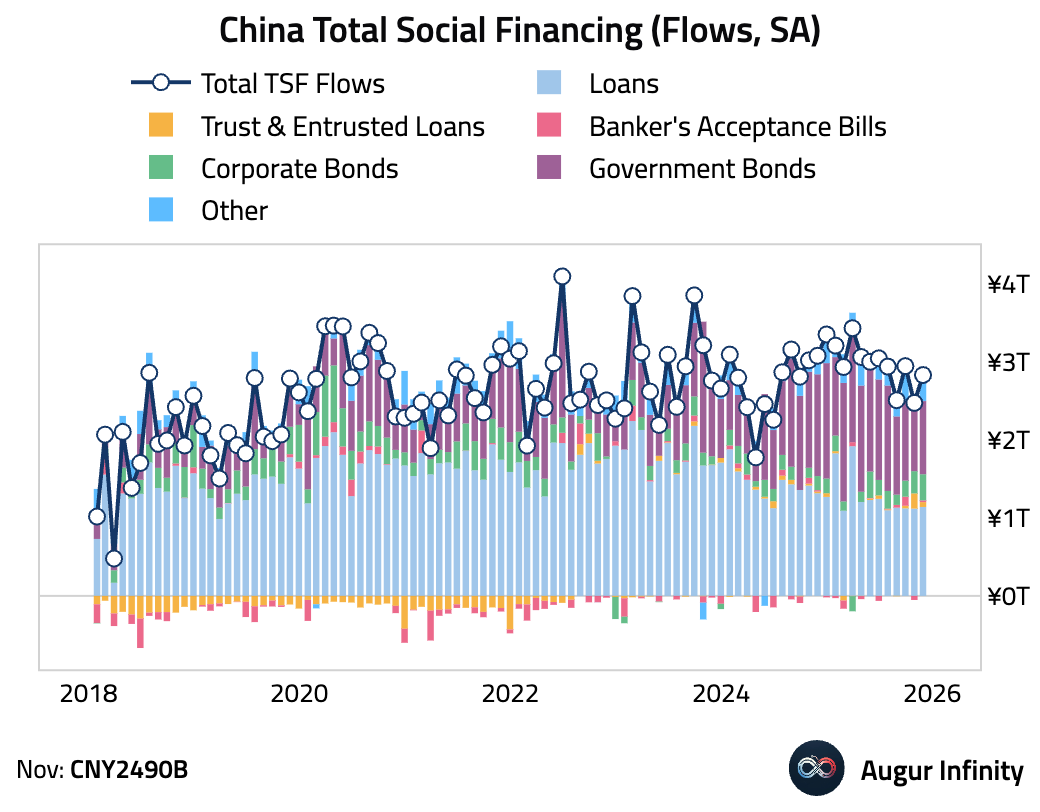
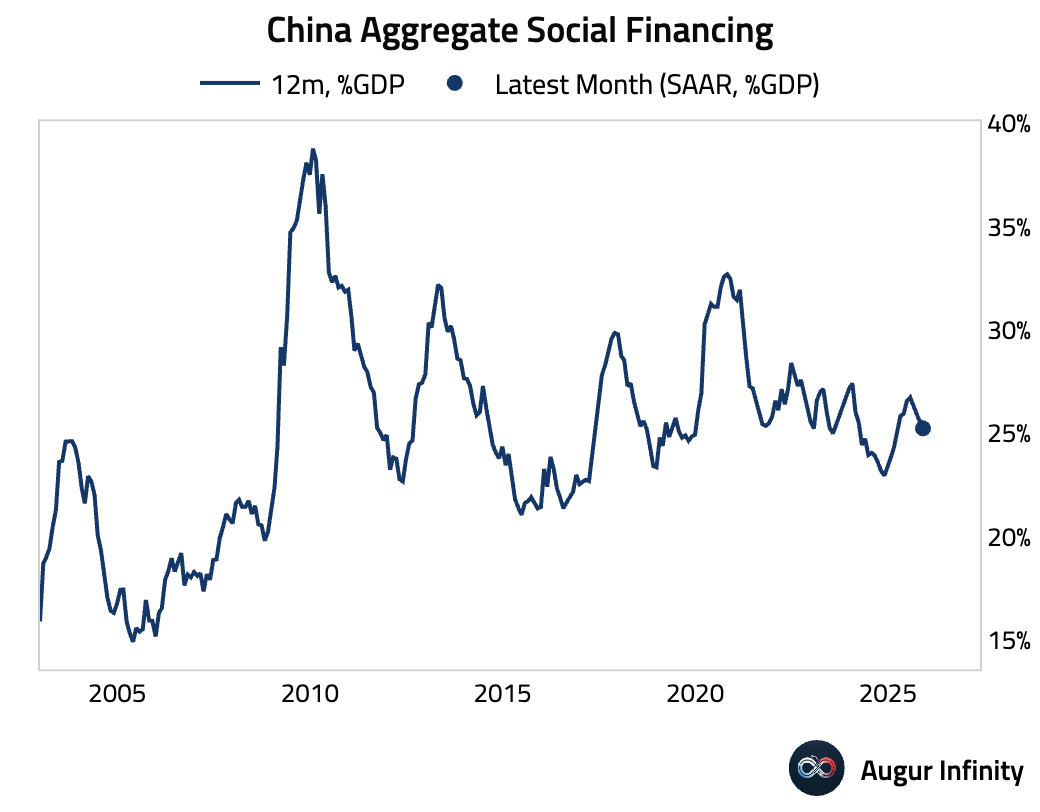
The trailing 12-month TSF flows, as a percentage of GDP, continued to moderate.
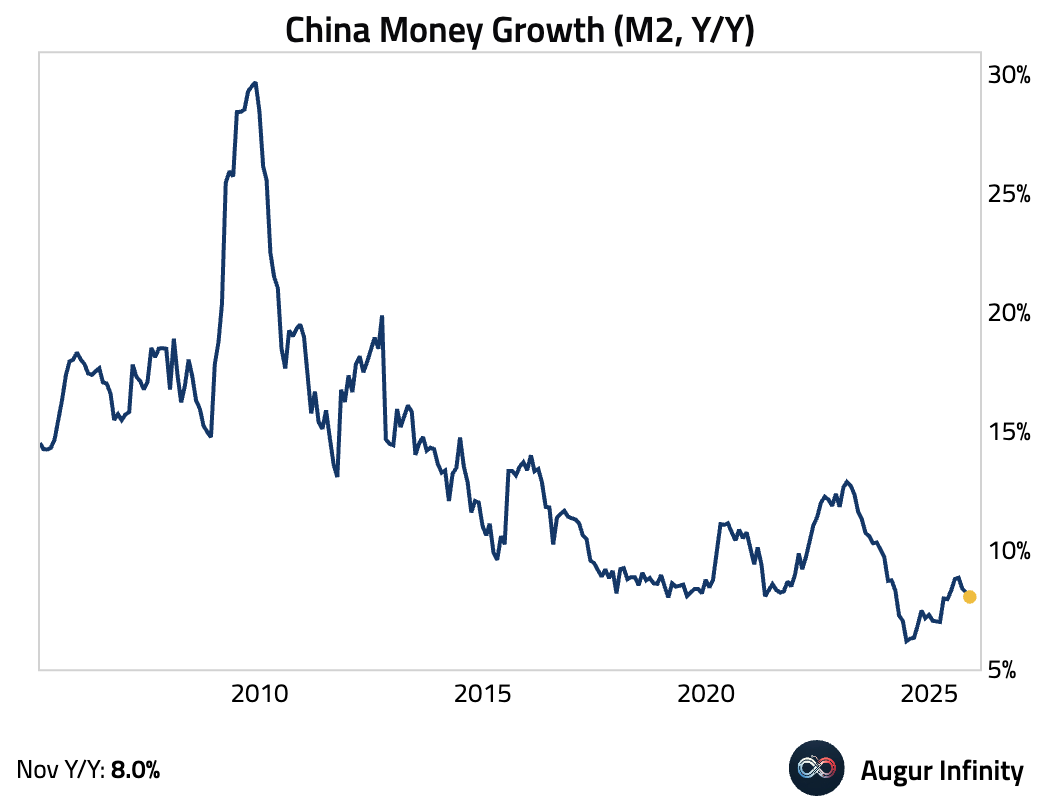
M2 money supply growth edged down, partially reflecting a high base last year.
- China signaled only modest stimulus for 2026, pledging “flexible and efficient” use of rate and RRR cuts while maintaining a “necessary” fiscal deficit amid mounting domestic headwinds.

Source: @economics
- China’s vast and rapidly expanding power grid is giving its AI sector a cost advantage, with data center electricity prices running at a fraction of US levels.

Source: @WSJ
Emerging Markets
- Let's start with some updates on Latin America.
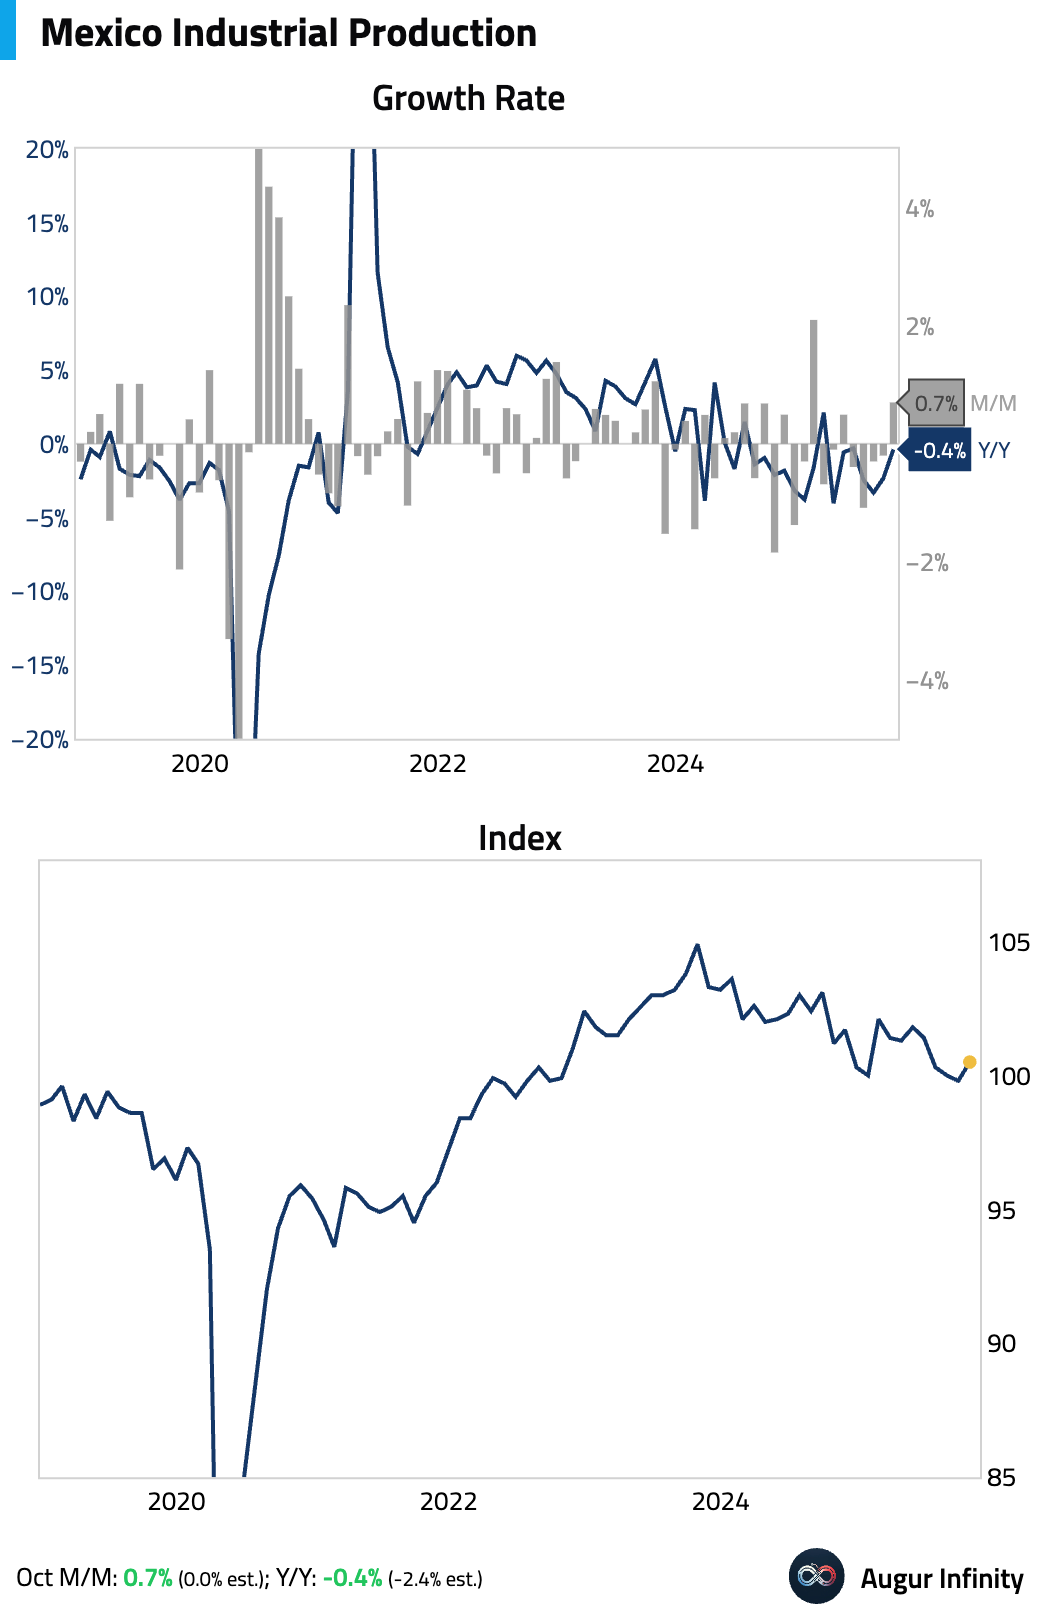
Mexico’s industrial production beat expectations, driven by a sharp rebound in construction, which offset a renewed contraction in manufacturing.
Mexico will impose a 50% tariff on Chinese car imports as it moves to preserve USMCA access amid heavy pressure from Washington.

Source: @financialtimes
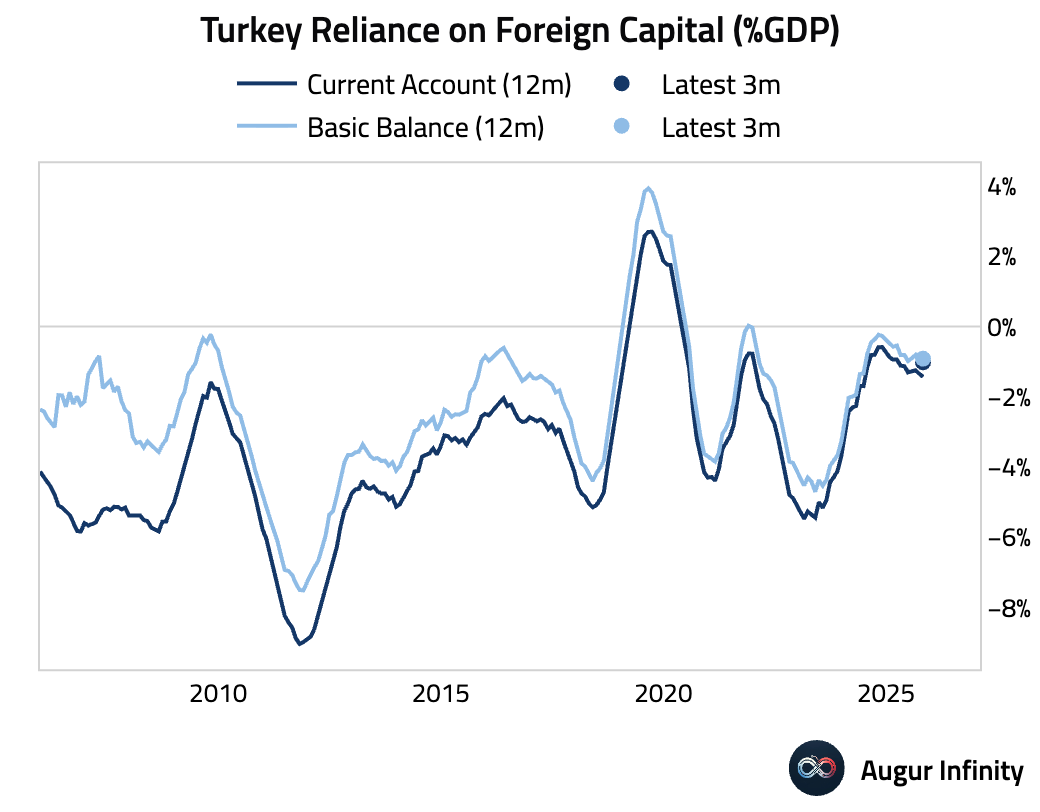
- Turning to EMEA, Turkey continues to be reliant on foreign capital, as reflected in its current account and basic balance.
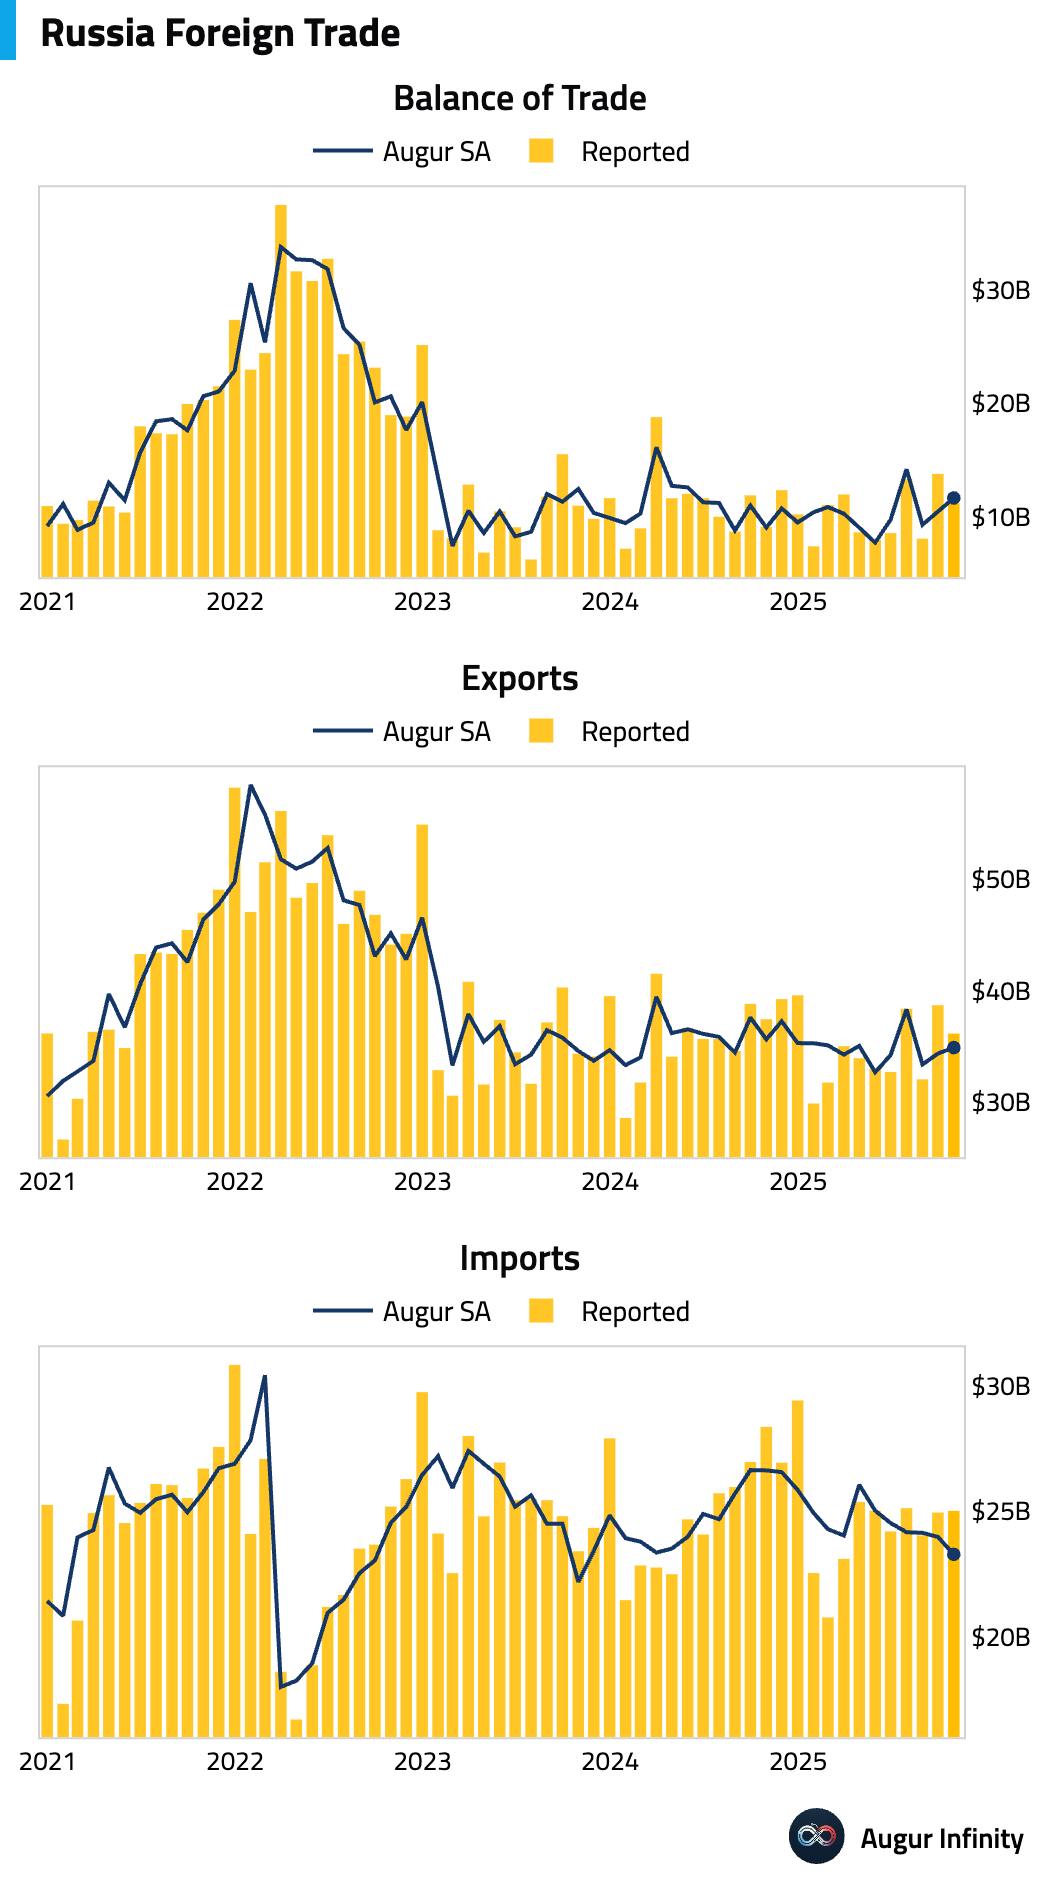
Russia’s trade surplus narrowed in October as reported, but rose after seasonal adjustment.
- South Africa inflation expectations fell to a record low.
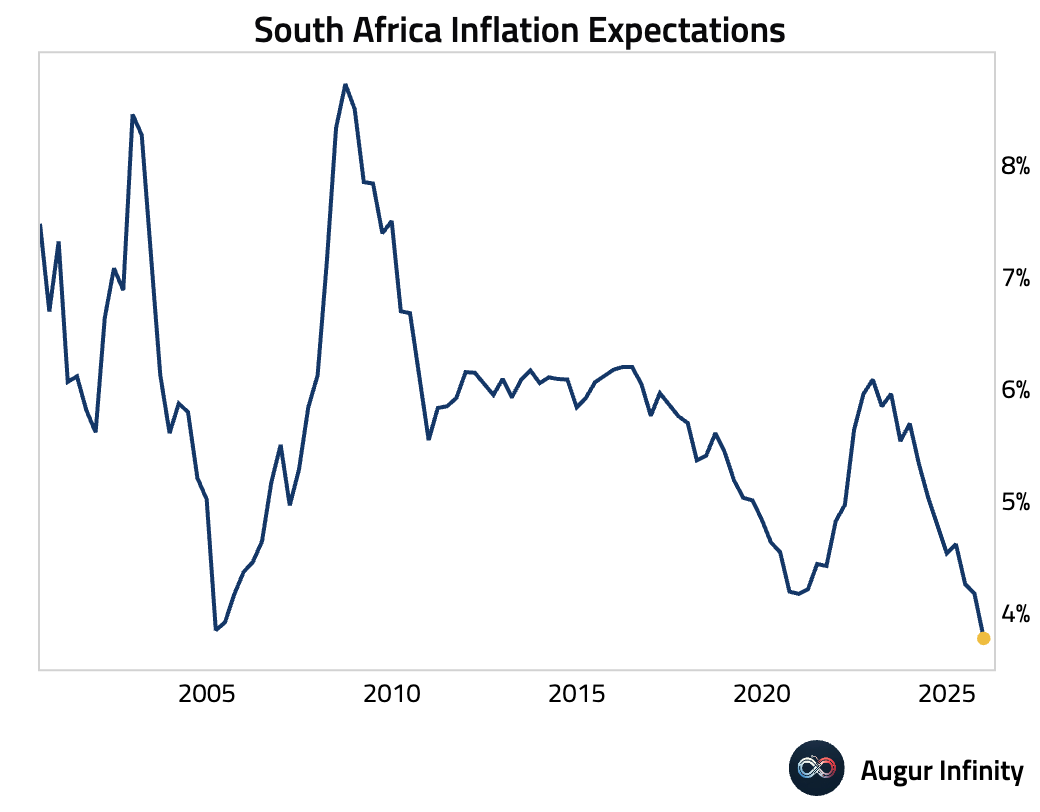

Source: @economics
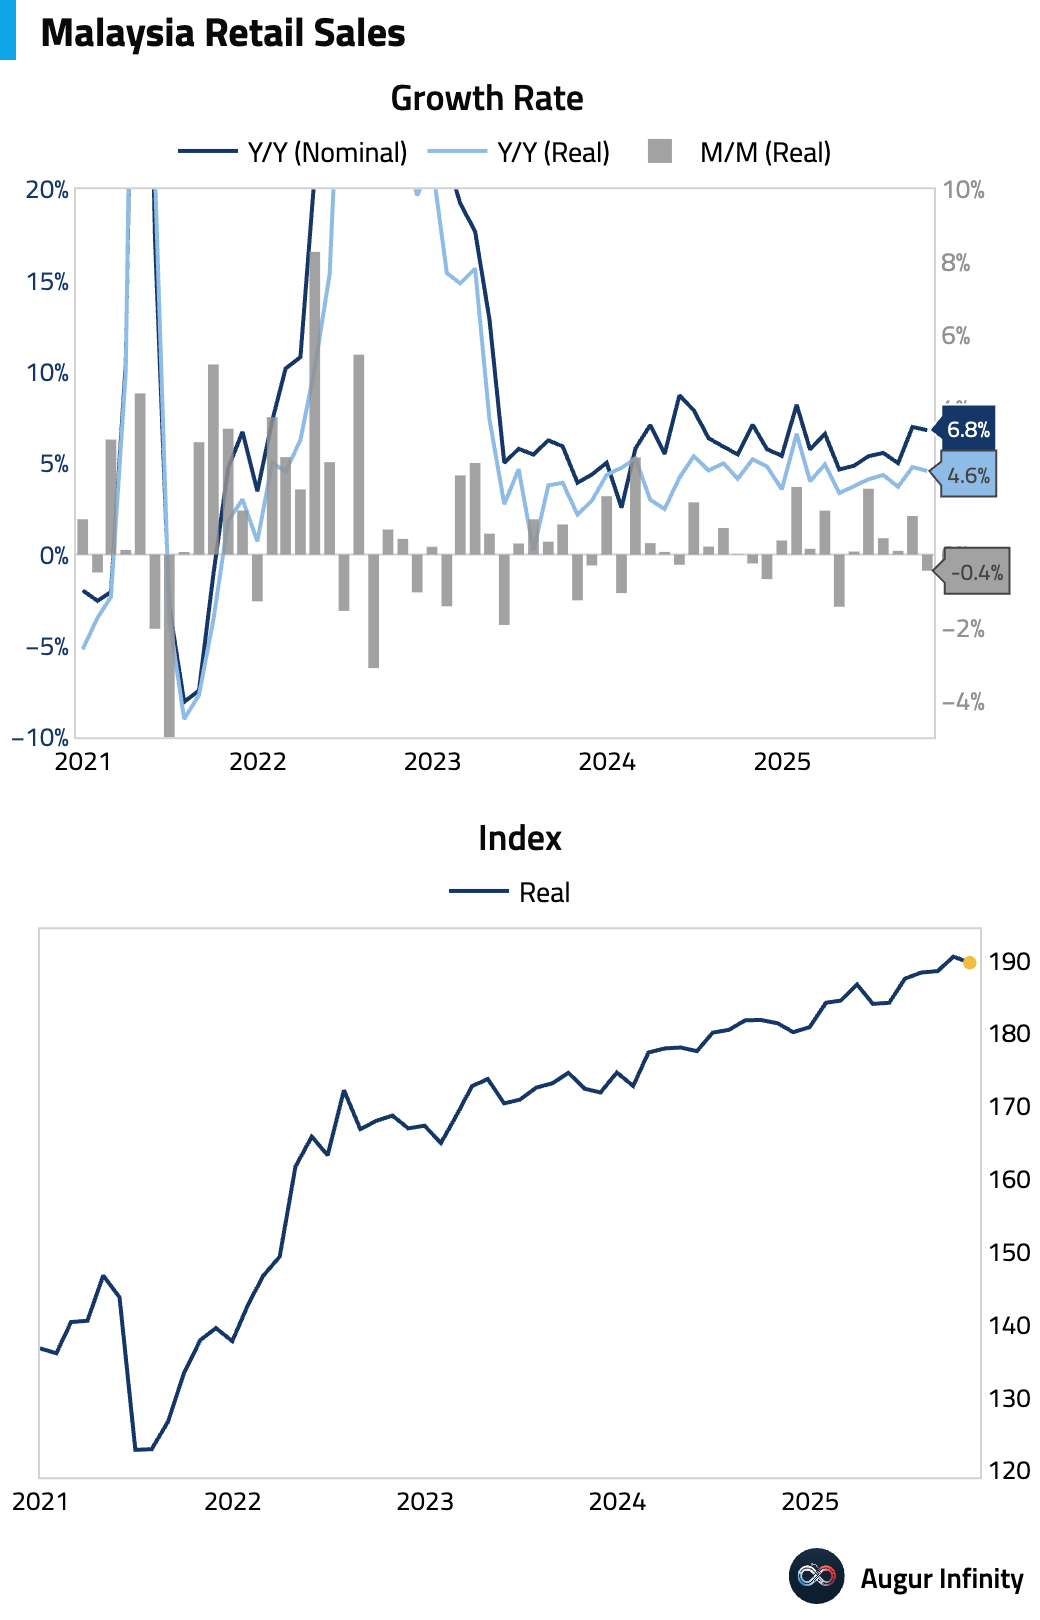
- In EM Asia, Malaysia's industrial production rebounded slightly after two consecutive months of declines and exceeded consensus estimates.
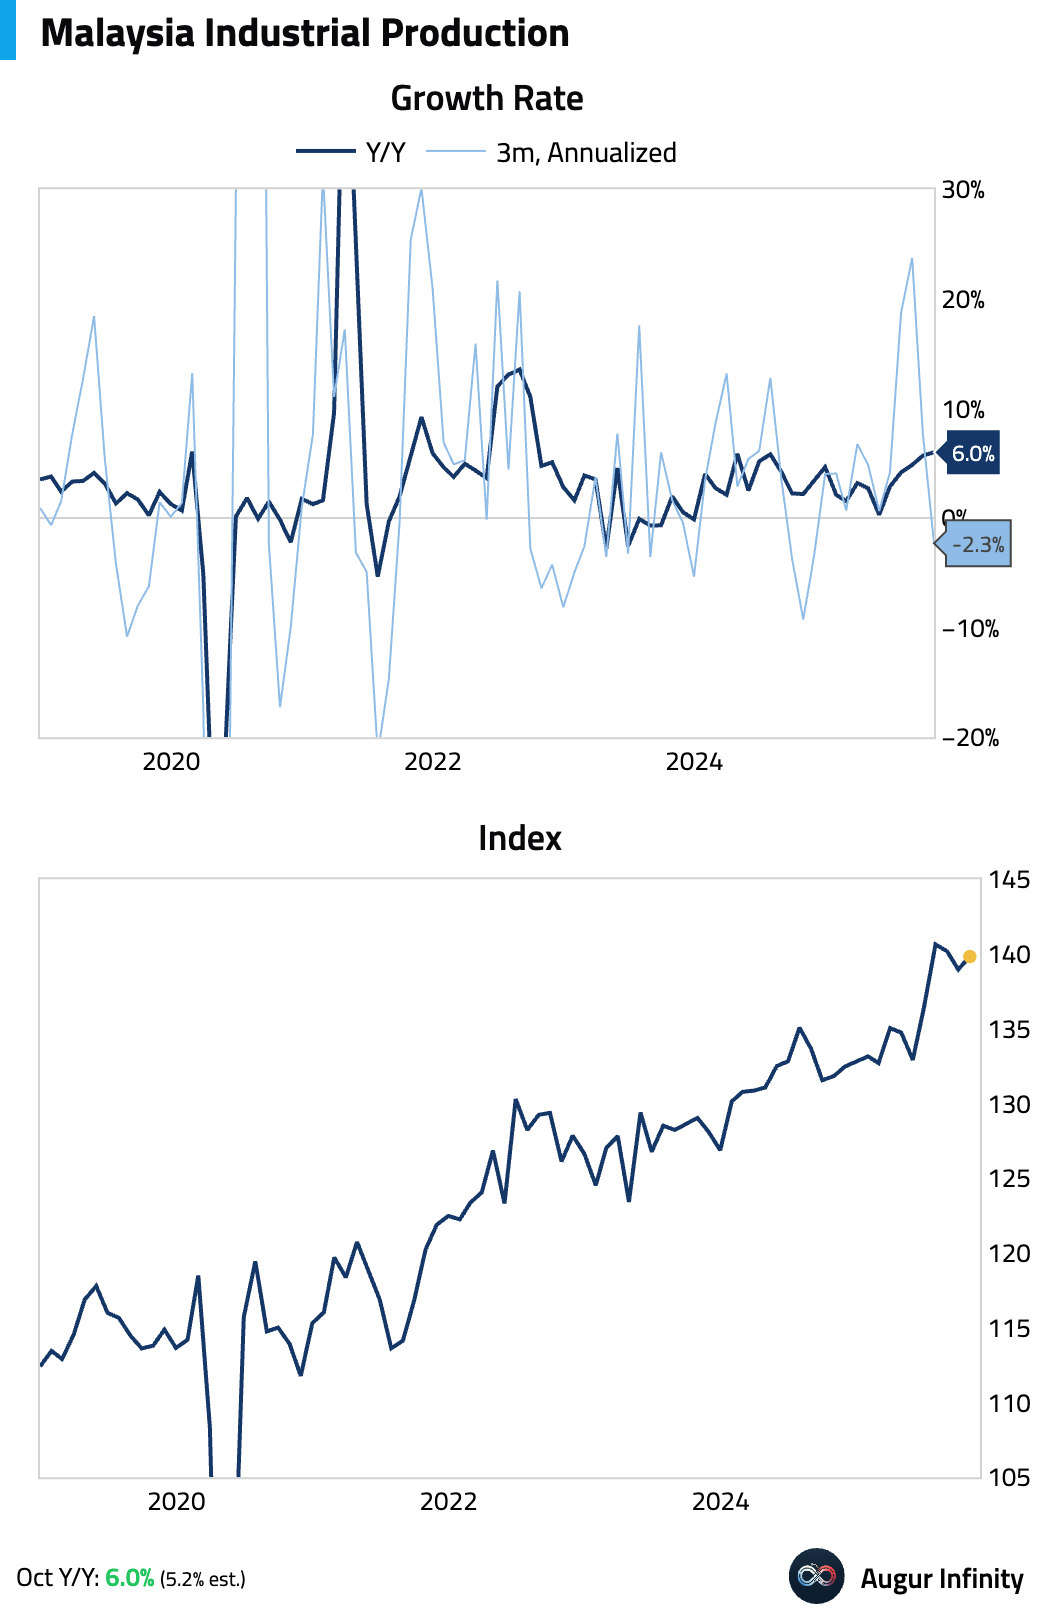
Retail sales growth eased.
Equities
- Global equities declined, with US markets leading the way down. The tech-heavy Nasdaq fell 1.7%, underperforming the broader US market, which was down 1.1%. South Korea also saw a significant drop of 2.3%. In contrast, Brazil bucked the trend, rising for the third consecutive day.
- US cannabis stocks surged after reports that President Trump may issue an executive order to reclassify marijuana as a Schedule III drug, potentially easing federal restrictions, lowering taxes, and improving access to banking and capital.
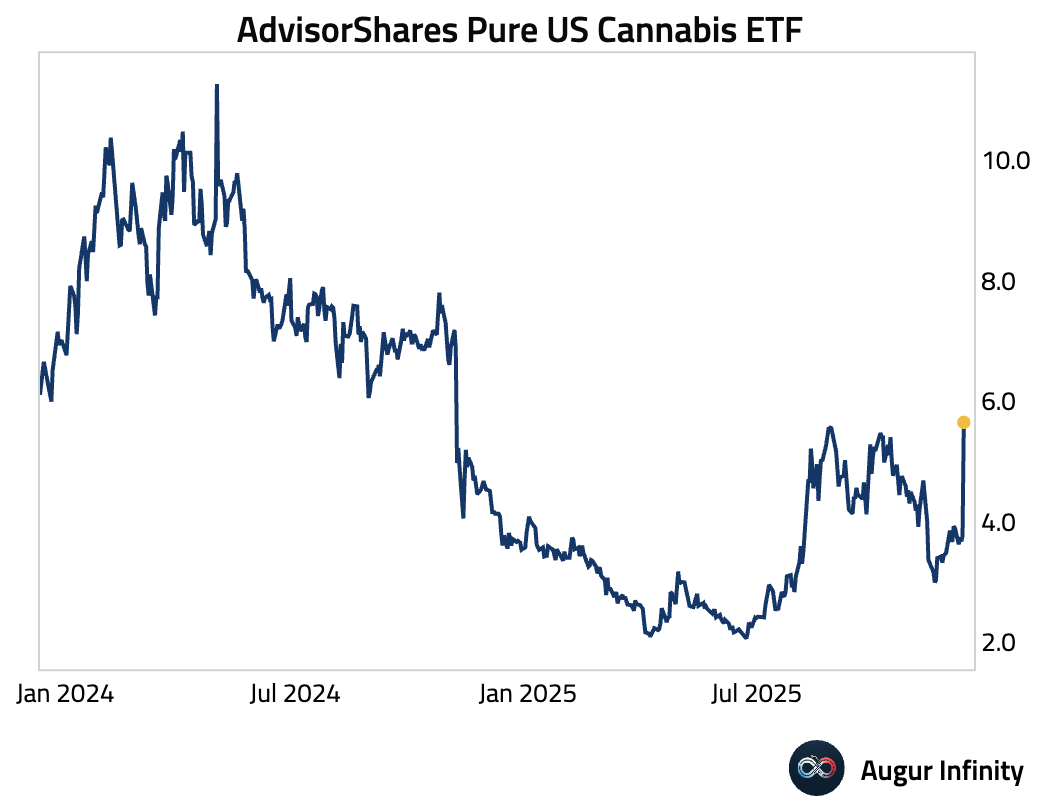

Source: Reuters
- The largest 7 stocks and the remaing 493 members each contributed five percentage points to this year's EPS growth, with the latter group expected to contribute more next year.

Source: Goldman Sachs
- Breadth is improving, with the share of stocks hitting one-month highs rising across size groups.
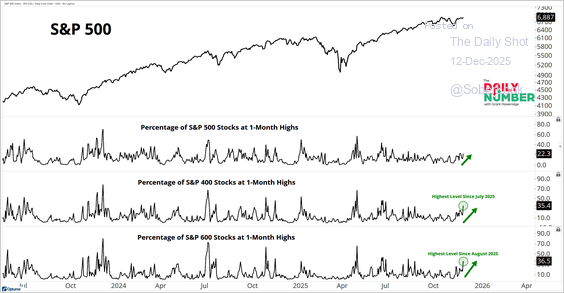
Source: Grant Hawkridge
- The AAII Bull-Bear spread (retail investor sentiment) remained positive for a second week.
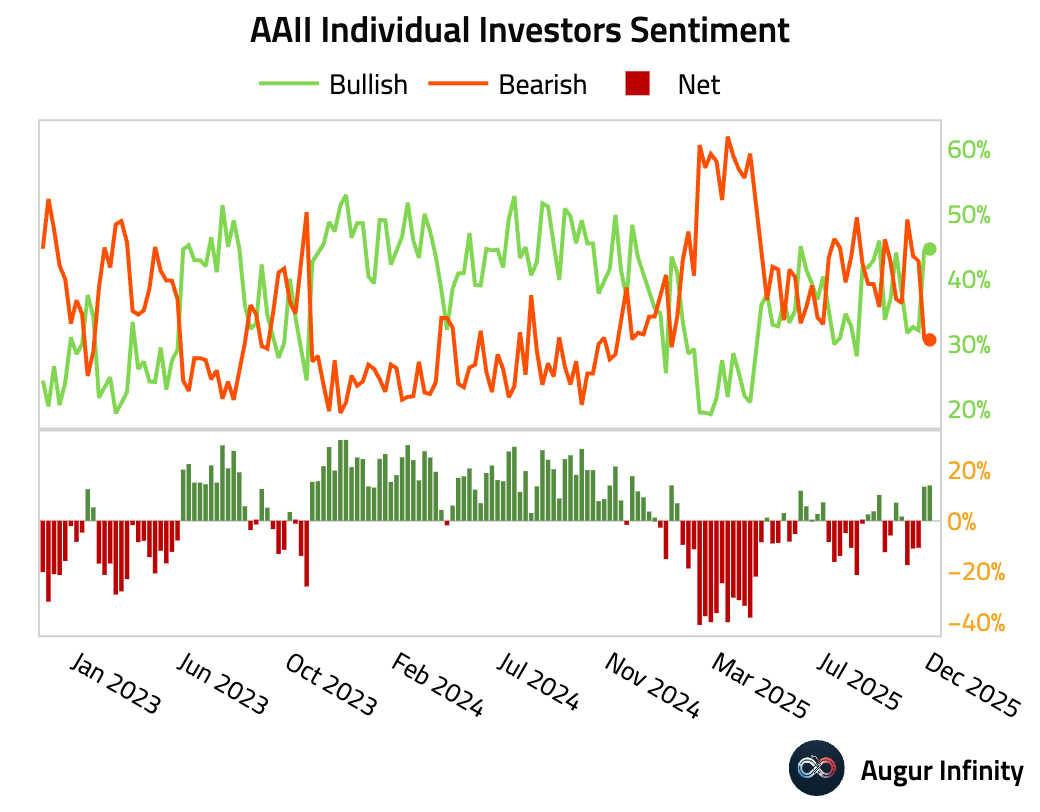
Interactive chart on Augur Infinity
- Flows show retail investors rotating away from megacap tech toward ETFs.
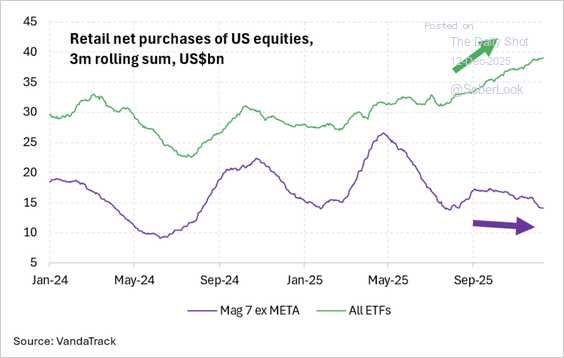
Source: VandaTrack
- This chart highlights the realized earnings growth of global tech companies versus non-tech companies.
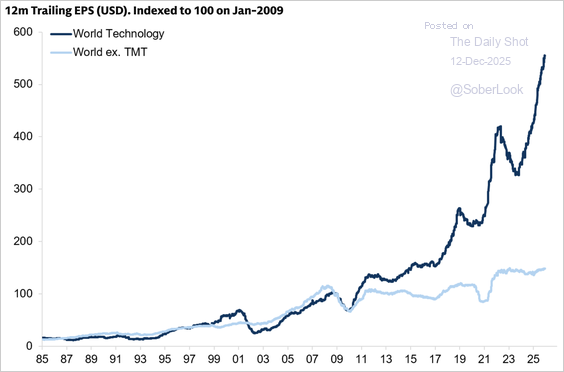
Source: Goldman Sachs
- Systematic investors endured an unusually turbulent 2025 marked by a series of brief, idiosyncratic “quant tremors” that hit different strategies at different times.

Source: @financialtimes
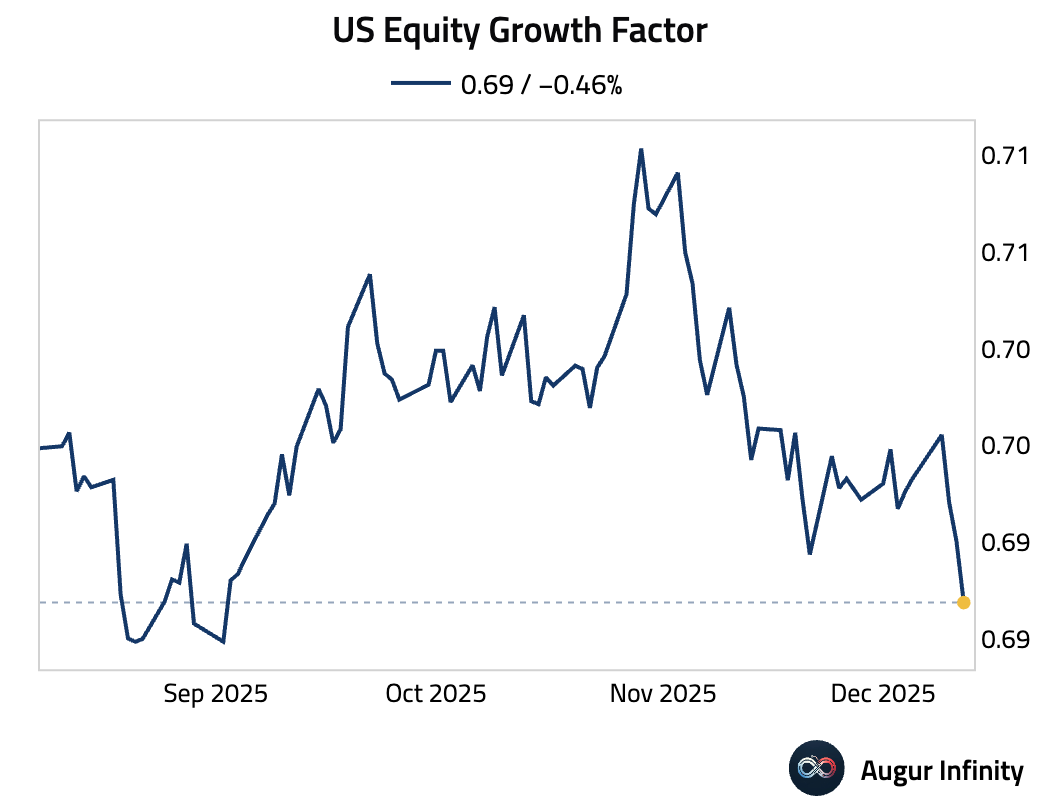
- US Equity Growth Factor is at the lowest level since September 2025.
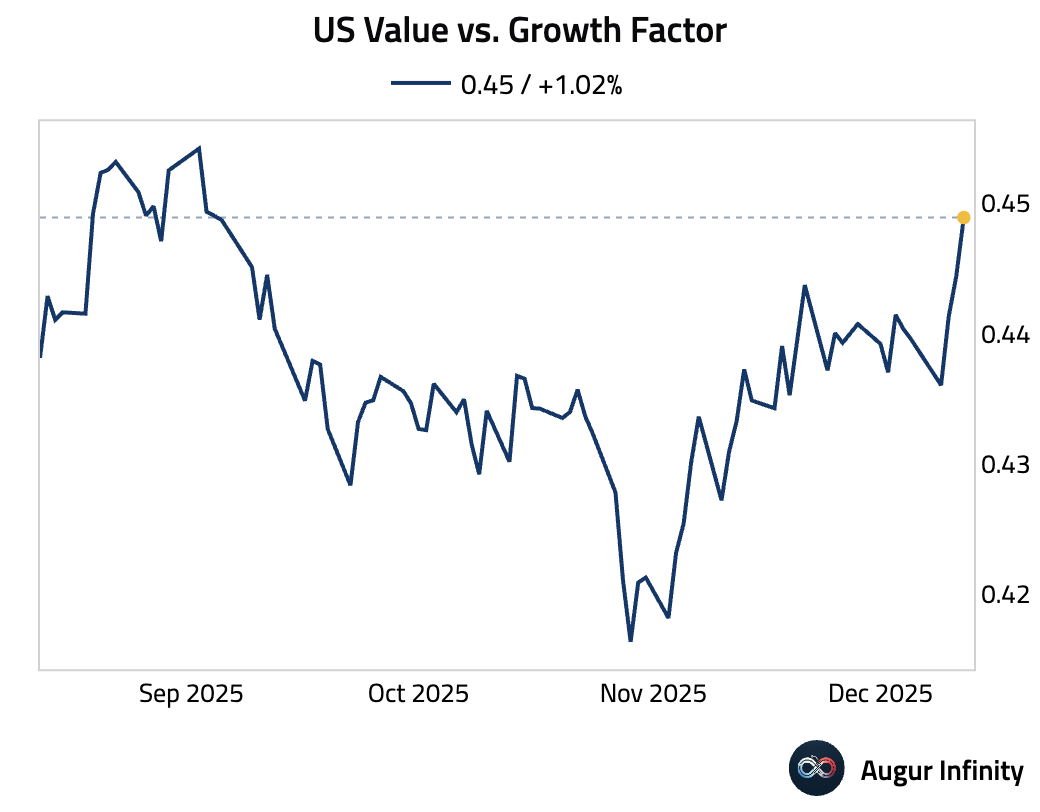
- US Value vs. Growth Factor is at the highest level since September 2025.
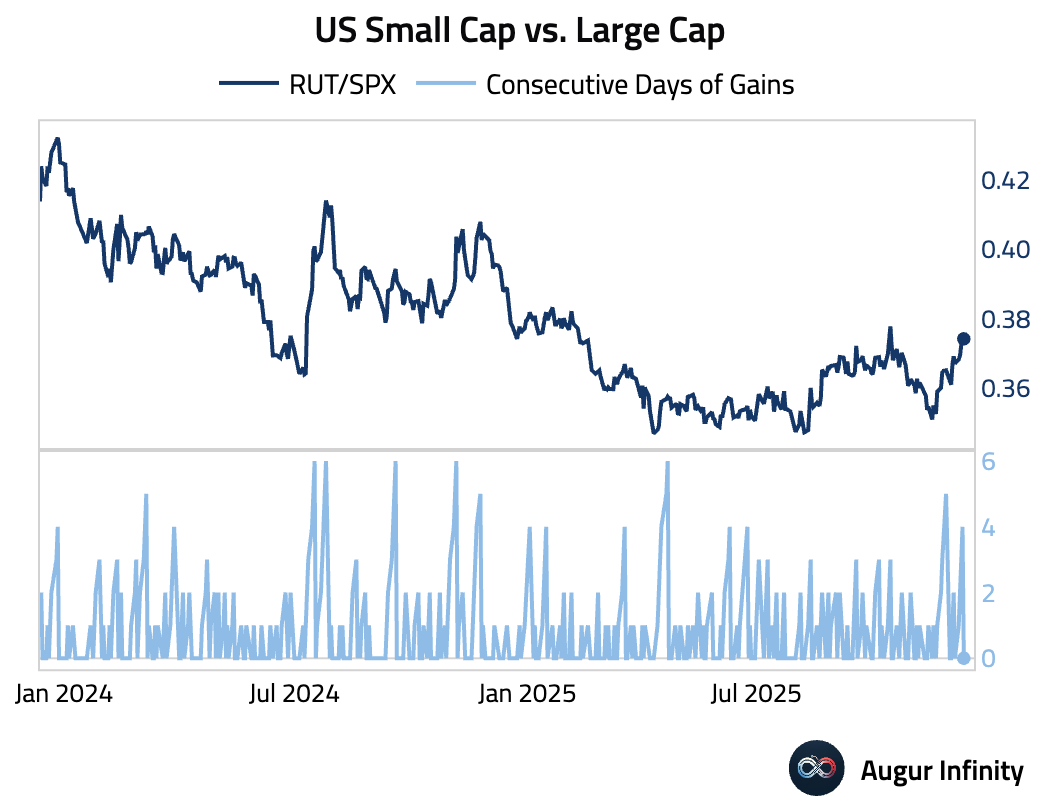
- US Small Cap vs. Large Cap has gained for five consecutive days.
Rates
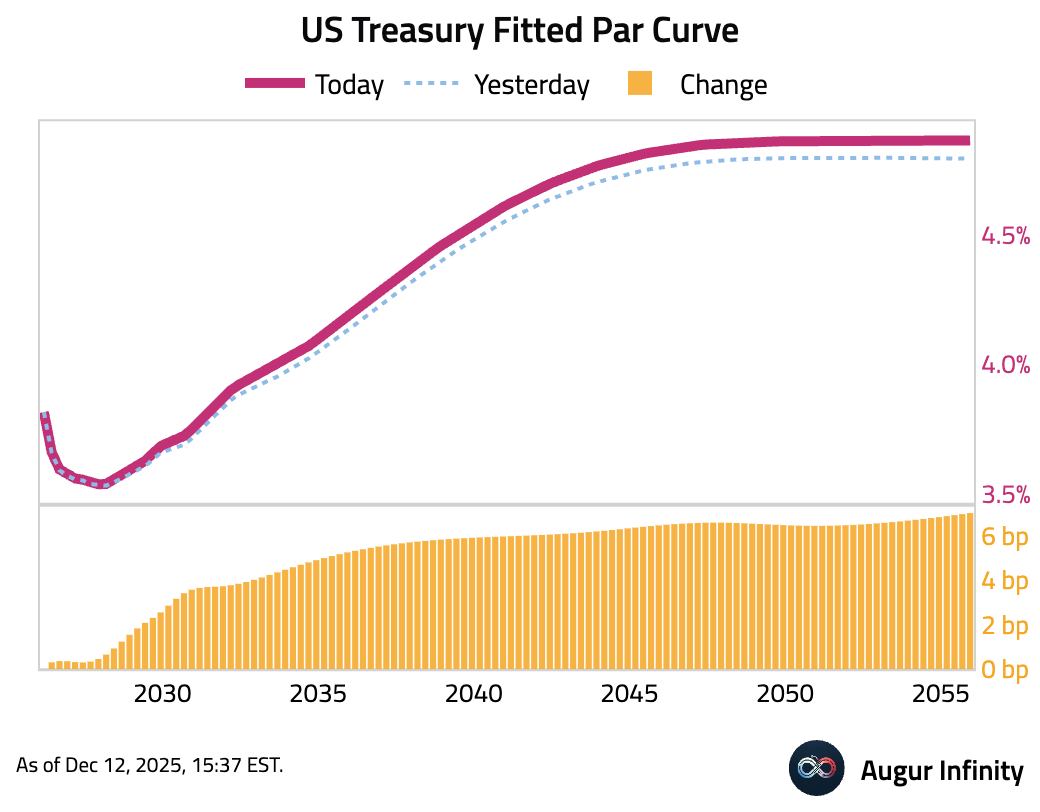
- US Treasury yields rose, with the curve steepening. The largest moves were at the long end of the curve, where the 10-year yield increased by 5.0 bps and the 30-year yield by 6.5 bps.
- Here are the returns of US Treasuries over the past month by tenor, with the front end outperforming longer duration papers.
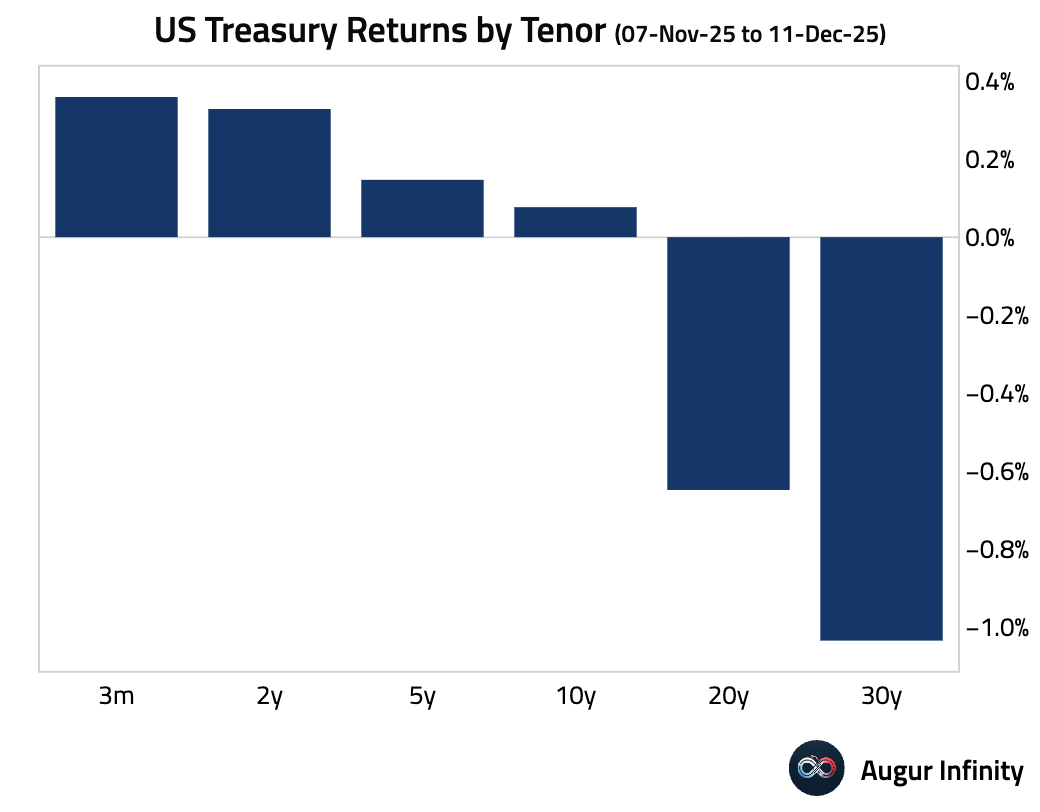
- Front-end Treasuries have also outperformed global peers over the past month.

Source: Barclays Research
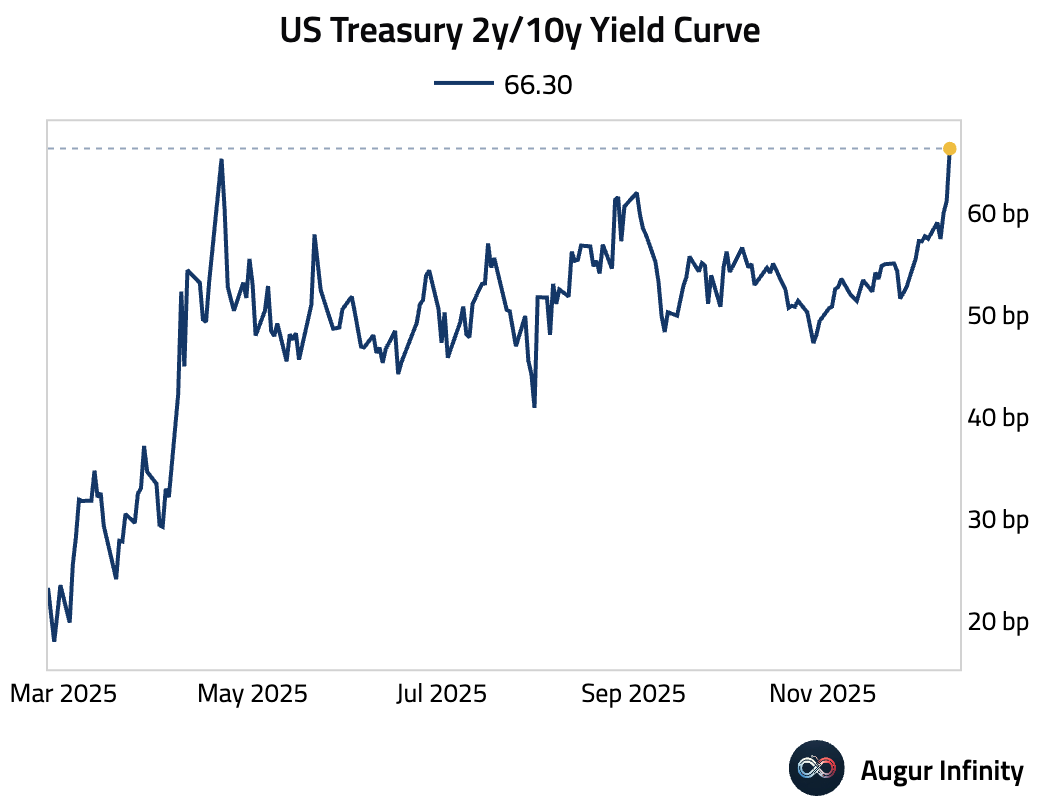
- The 2-year/10-year yield curve is at the steepest level since April 2025.
Energy
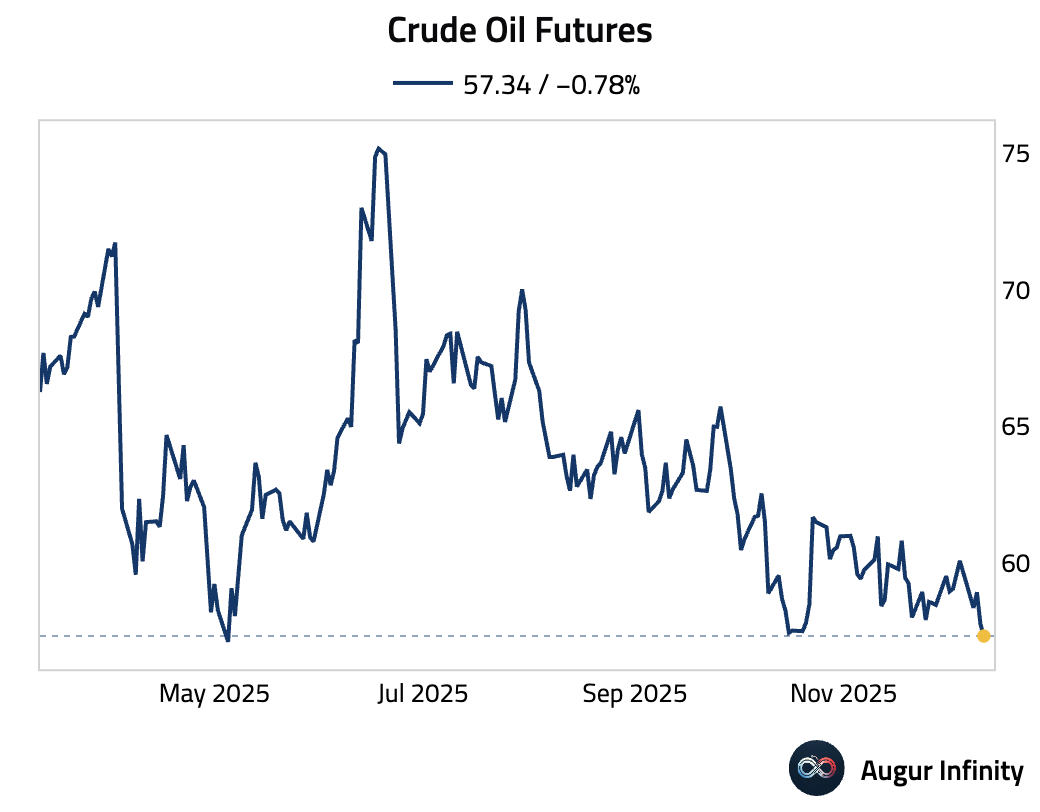
- Crude oil fell to its lowest level since May 2025.
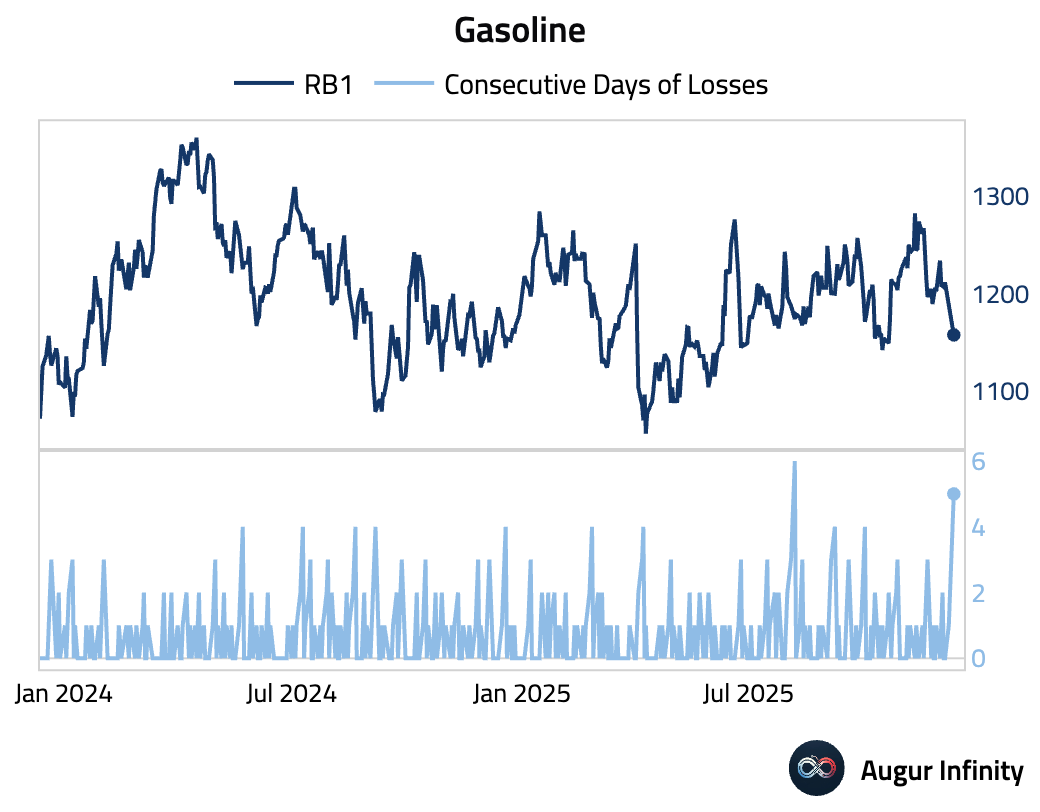
- Gasoline fell for five consecutive days.
Commodities
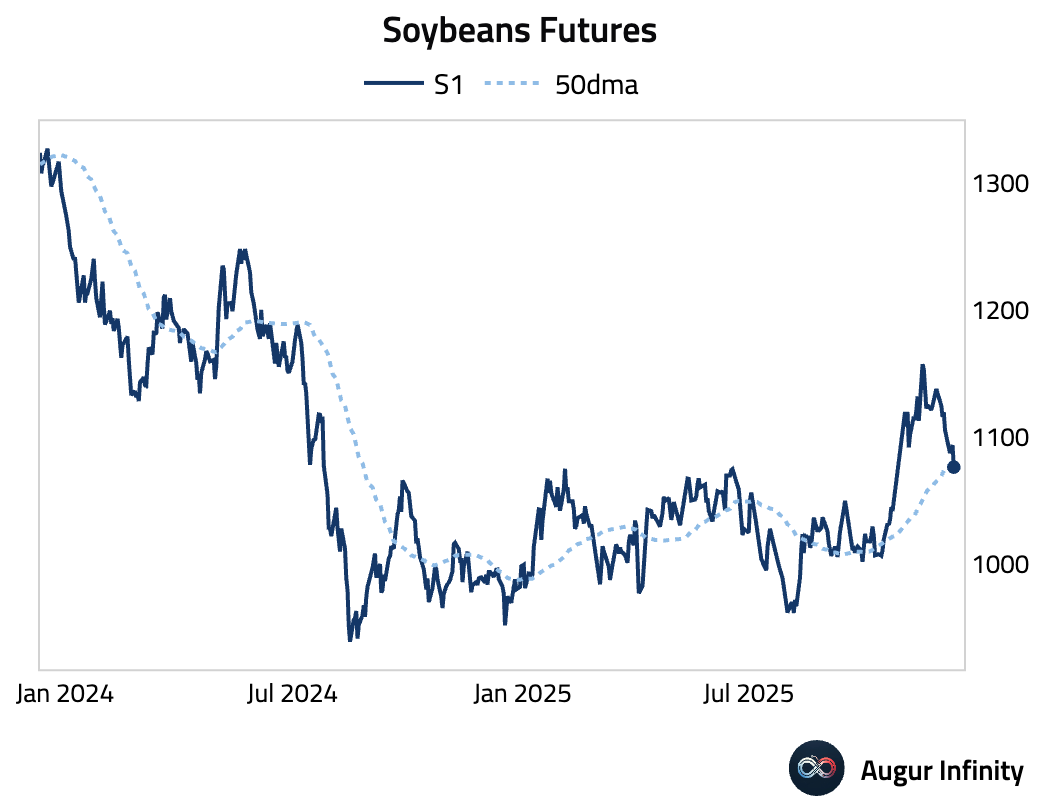
- Soybean futures fell below their 50-day moving average.
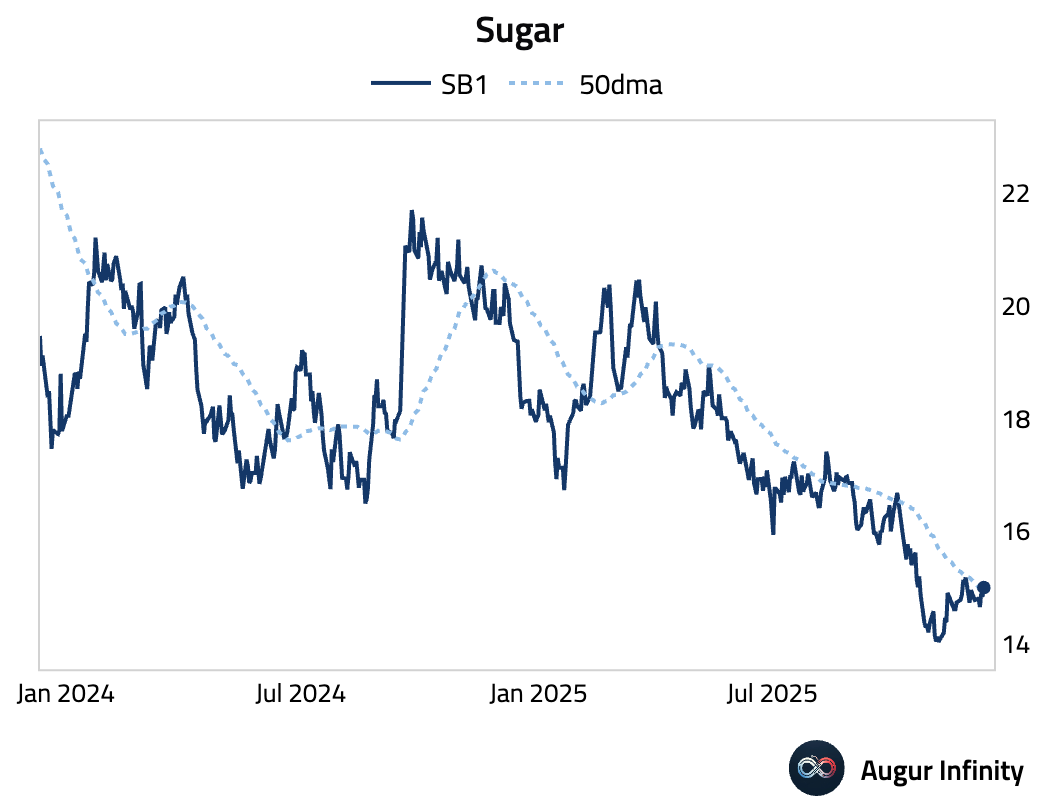
- Sugar is testing its 50-day moving average.
Global Developments
- Here is a long-term view of global government spending as a percentage of GDP.

Source: Incrementum AG via Jeremy Kauffman
Disclaimer
Augur Digest is an automatically generated newsletter edited by humans. It may contain inaccuracies and is not investment advice. Augur Labs LLC will not accept liability for any loss or damage as a result of your reliance on the information contained in the newsletter.