- Global Developments
- United States
- Canada
- The Eurozone
- Europe
- Japan
- Asia-Pacific
- China
- India
- Emerging Markets
- Equities
- Rates
- Energy
- Cryptocurrency
Global Developments
1 Let’s begin with a recap of 2025.
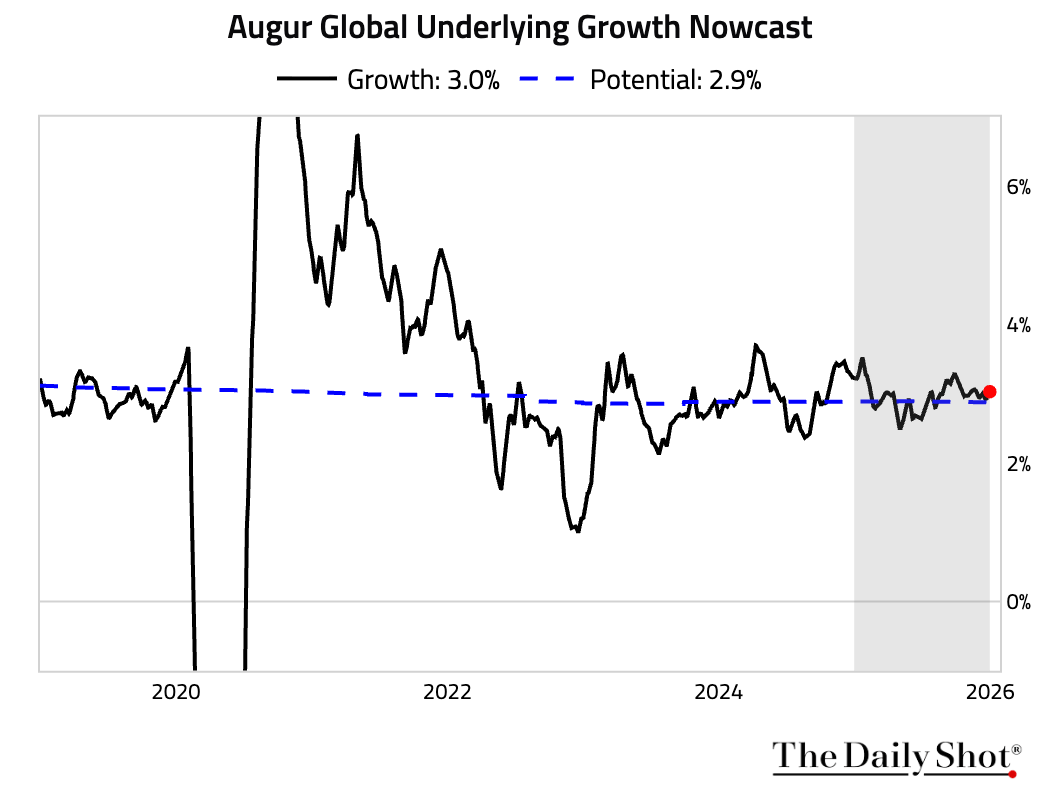
• Global economies entered last year on a solid footing. Growth gyrated amid tariff-induced trade uncertainties but ended the year slightly above potential.
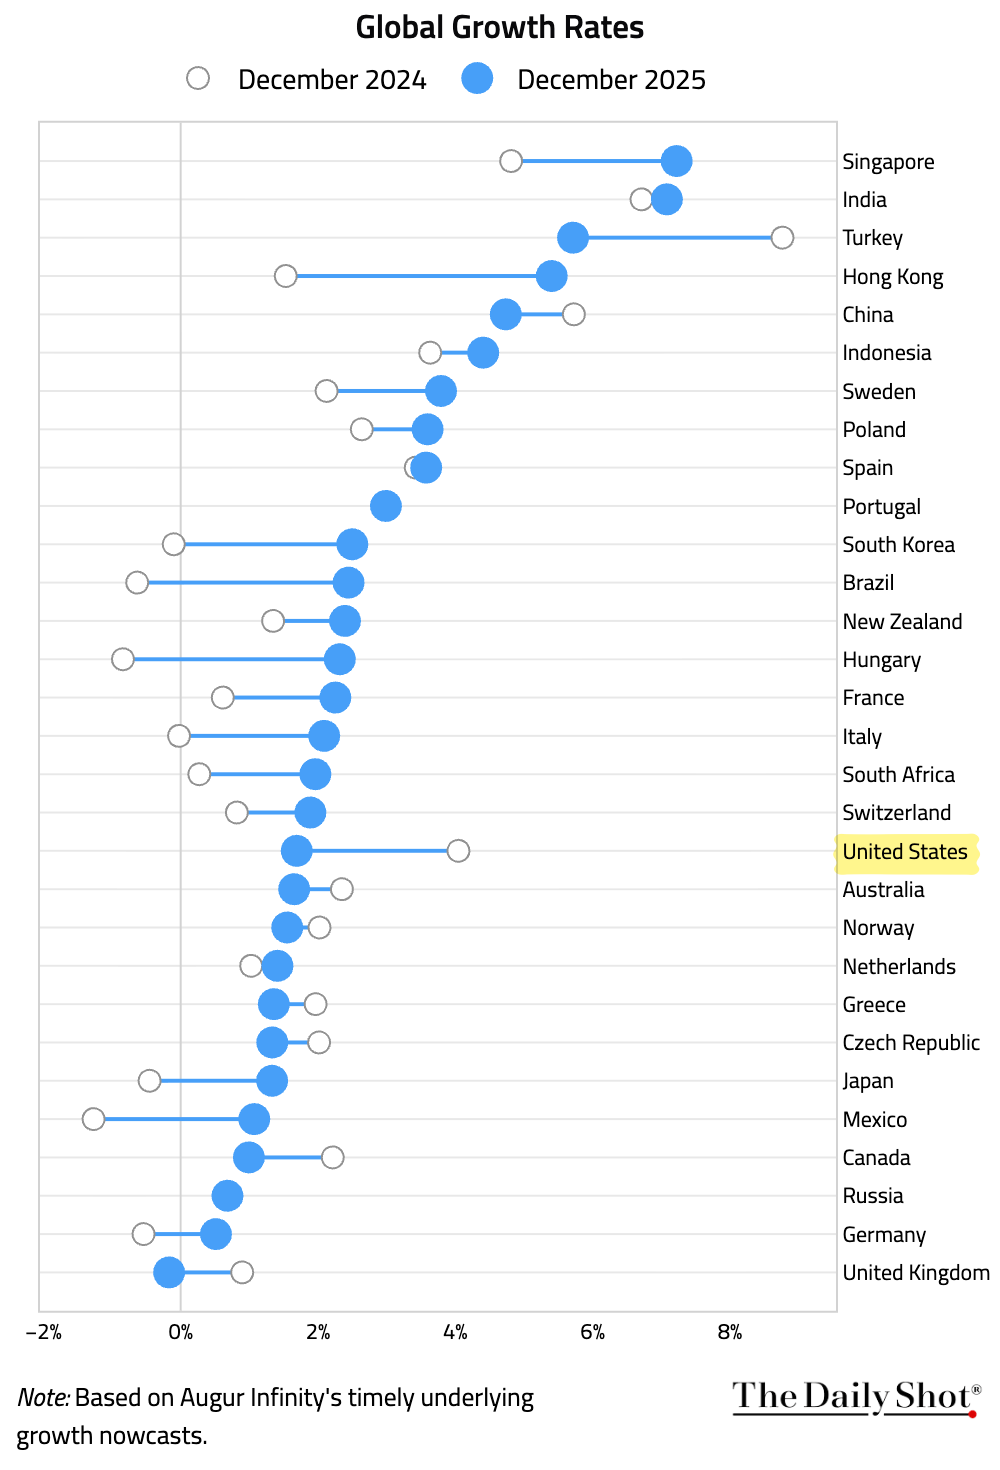
– This chart shows how growth rates shifted over the course of the year by country.
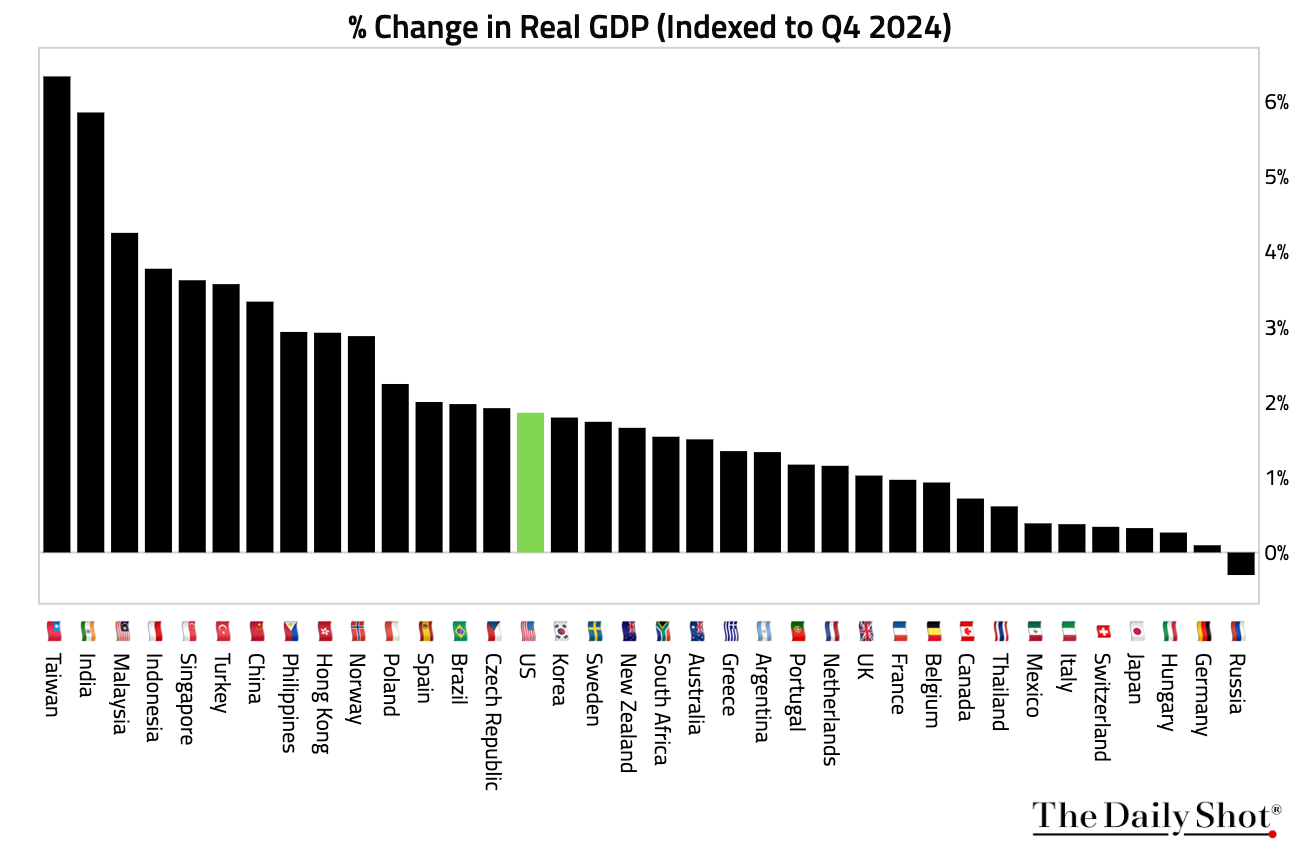
– Here is how much each country’s economy expanded in the first three quarters of 2025, based on real GDP.
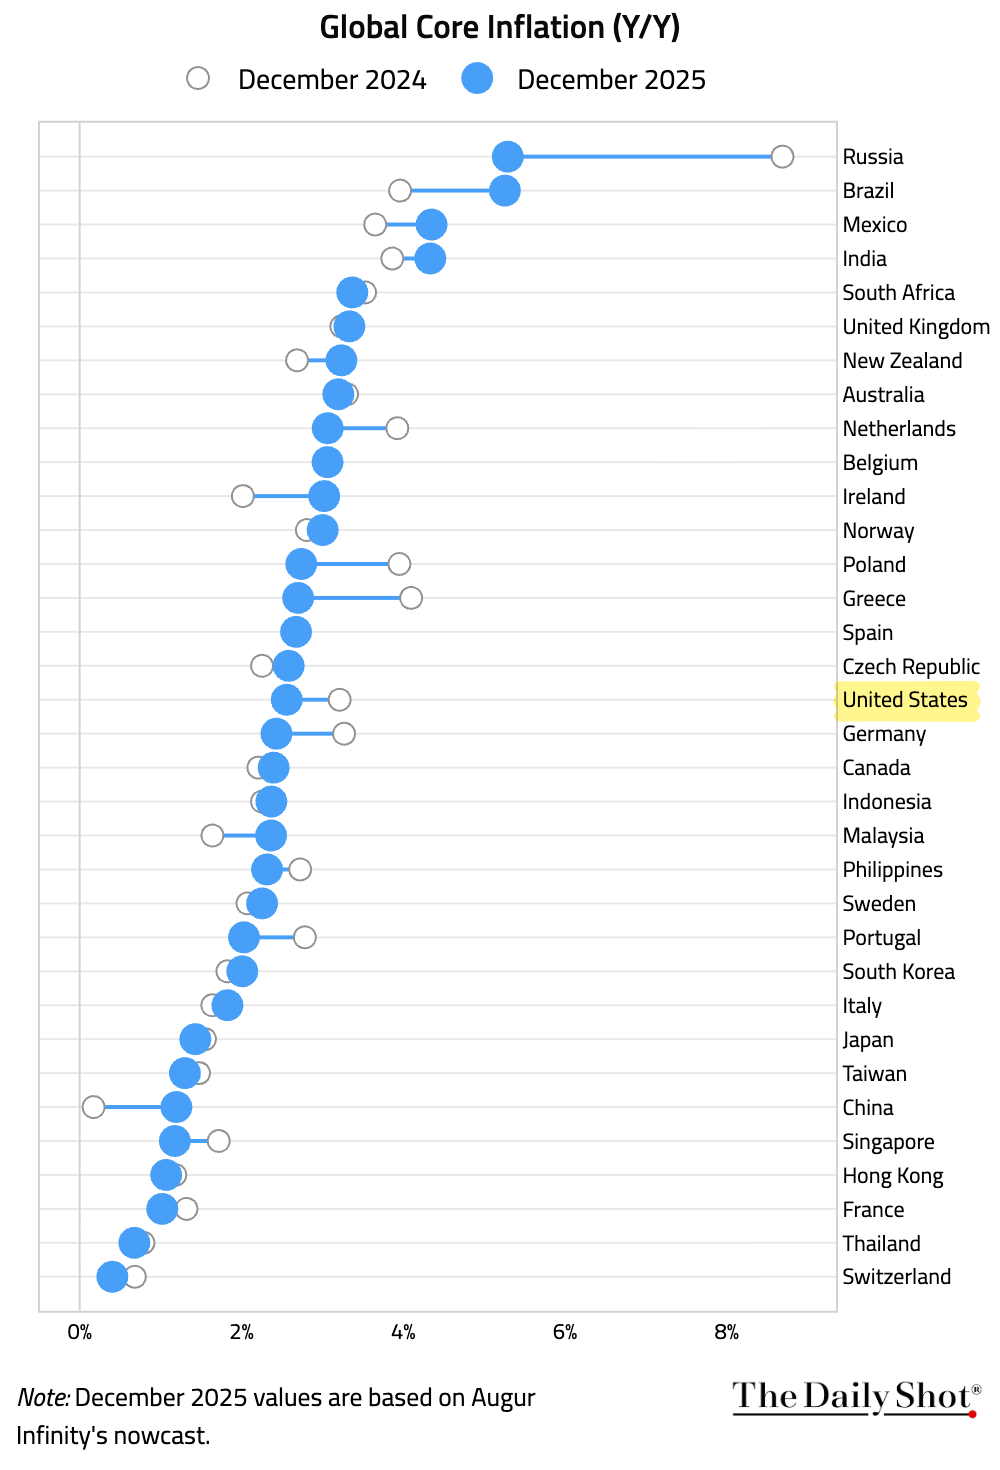
• Global inflation continued to ease, although the pace of disinflation slowed.
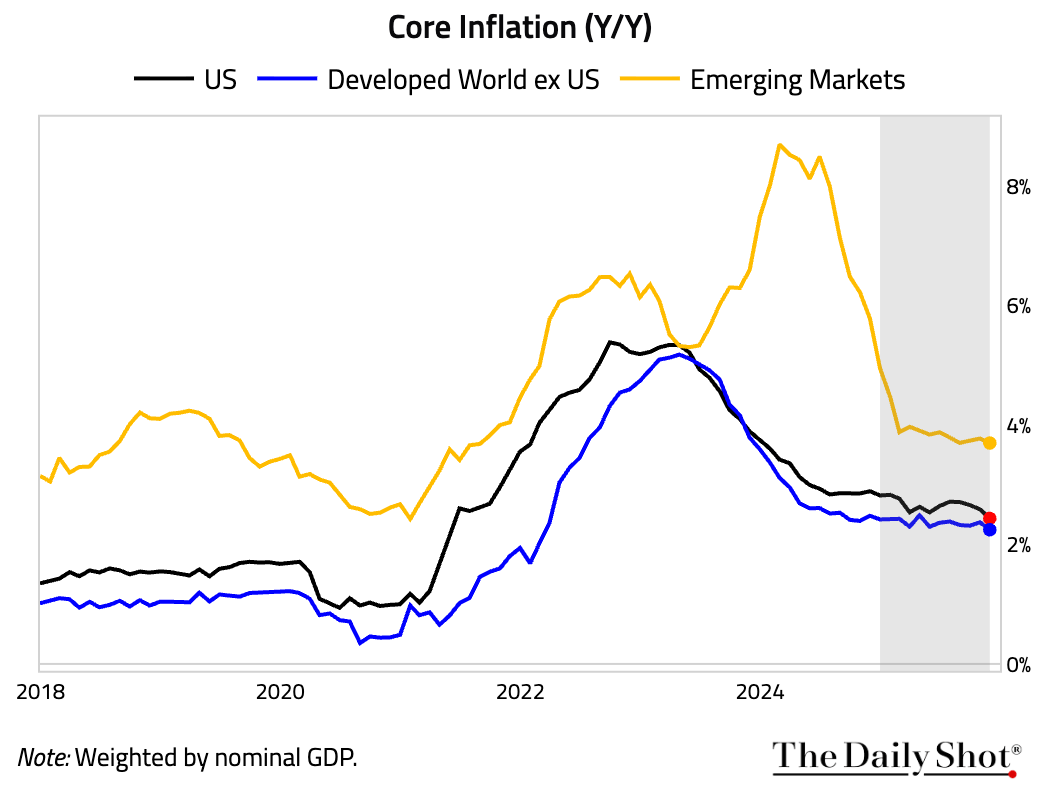
– This chart shows the evolution of core inflation in 2025 by country.
• Most central banks cut rates last year.
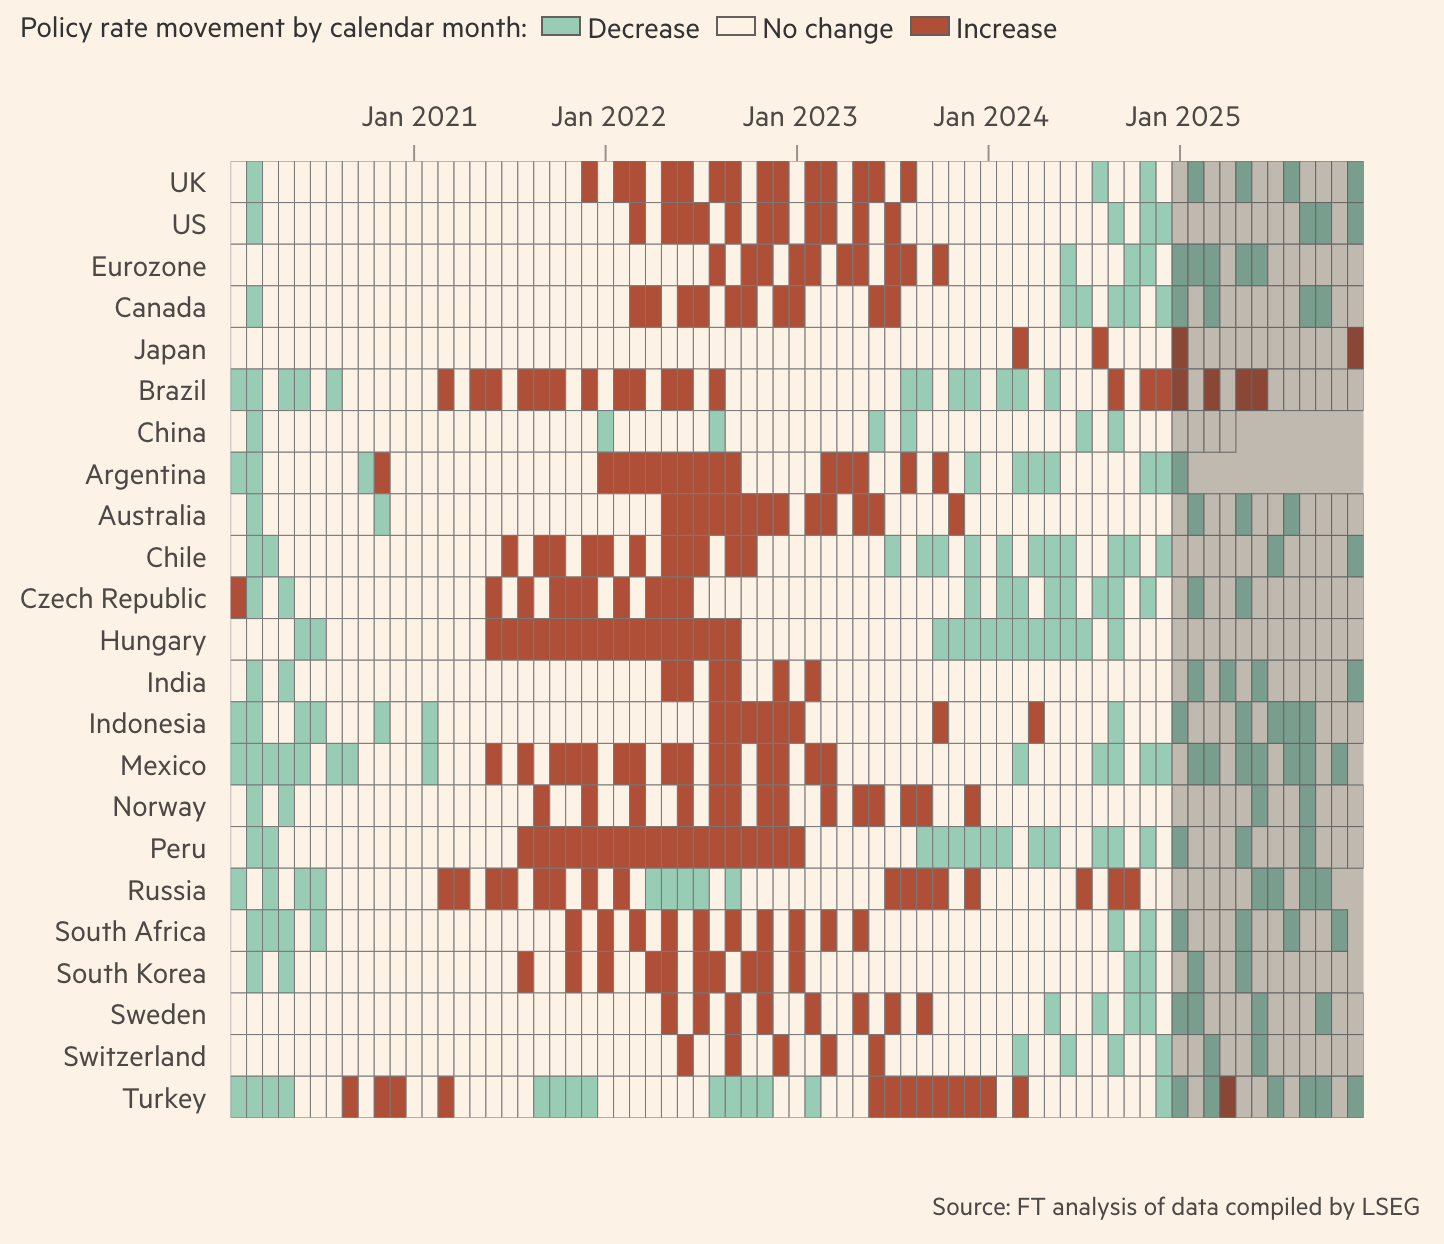 Source: @financialtimes Read full article
• Global equities delivered exceptional returns, …
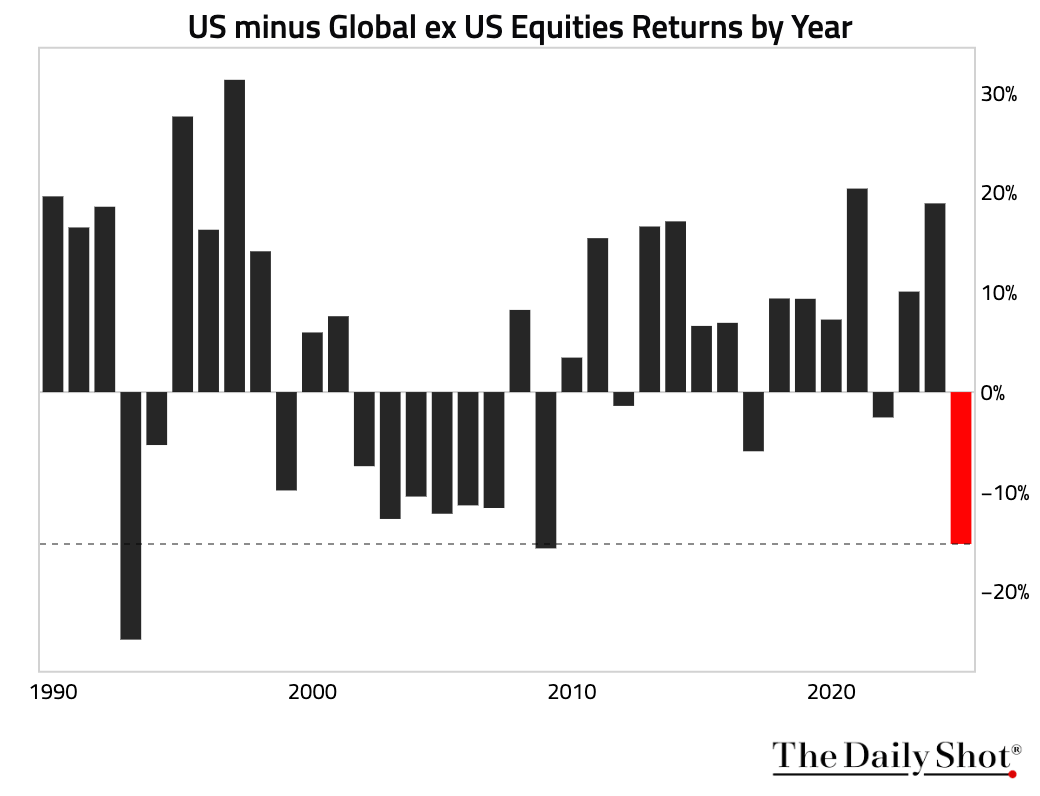
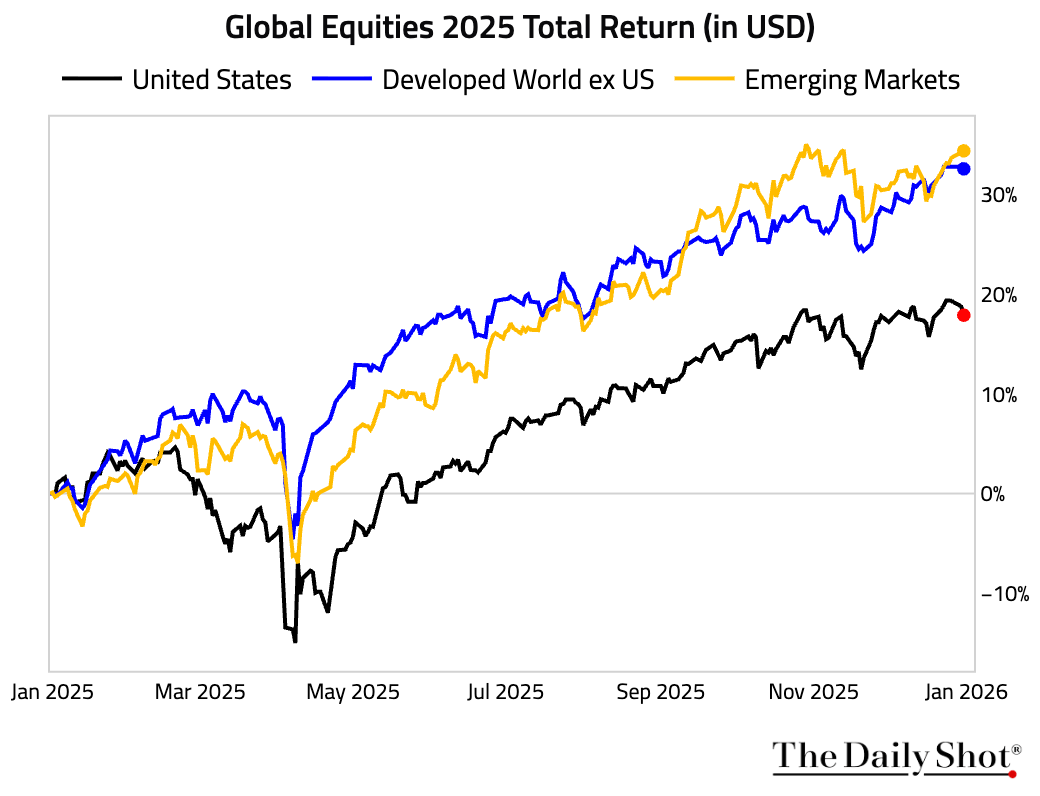 … but US equities underperformed the rest of the world by the largest margin since 2009.
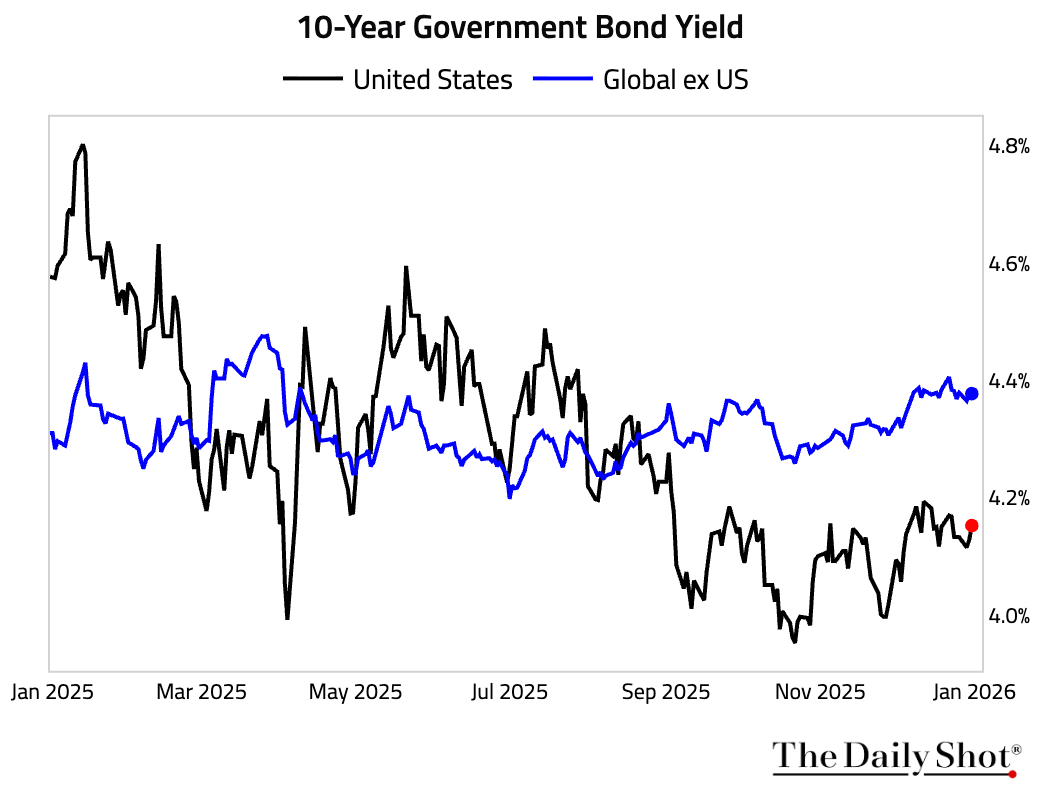
• The US 10-year Treasury yield declined, while the GDP-weighted average yields in the rest of the world edged up.
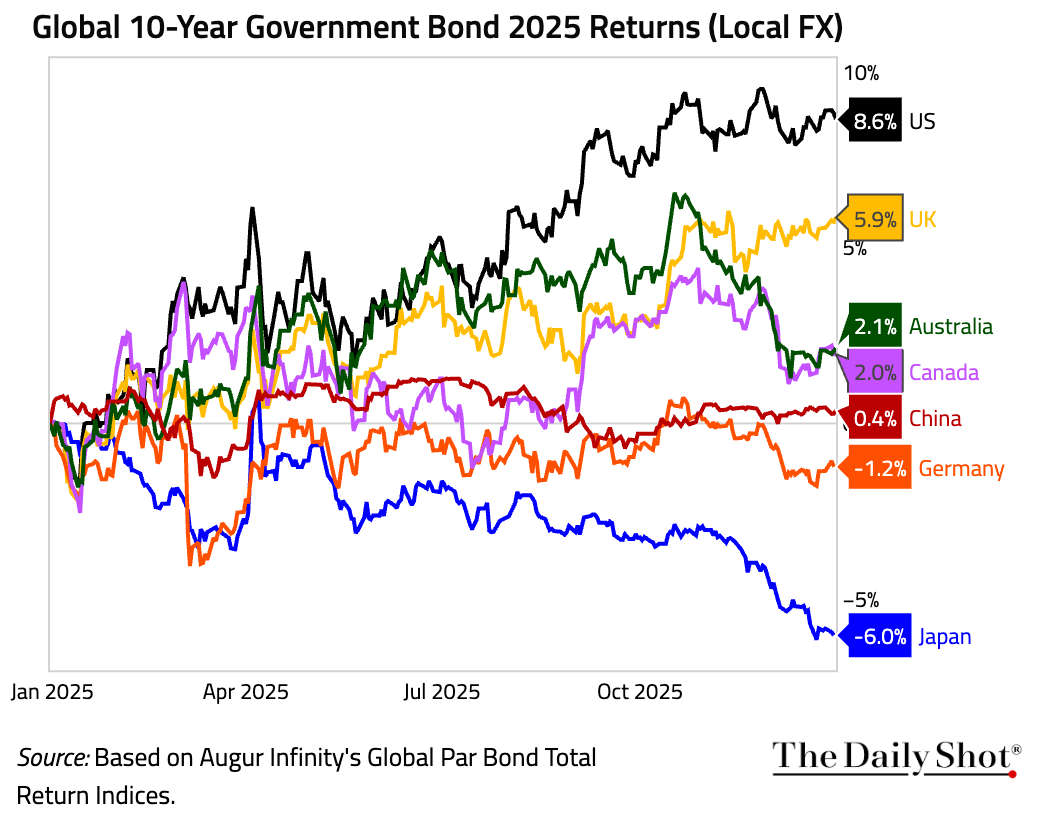
– This chart shows the returns of 10-year government bonds for major economies.
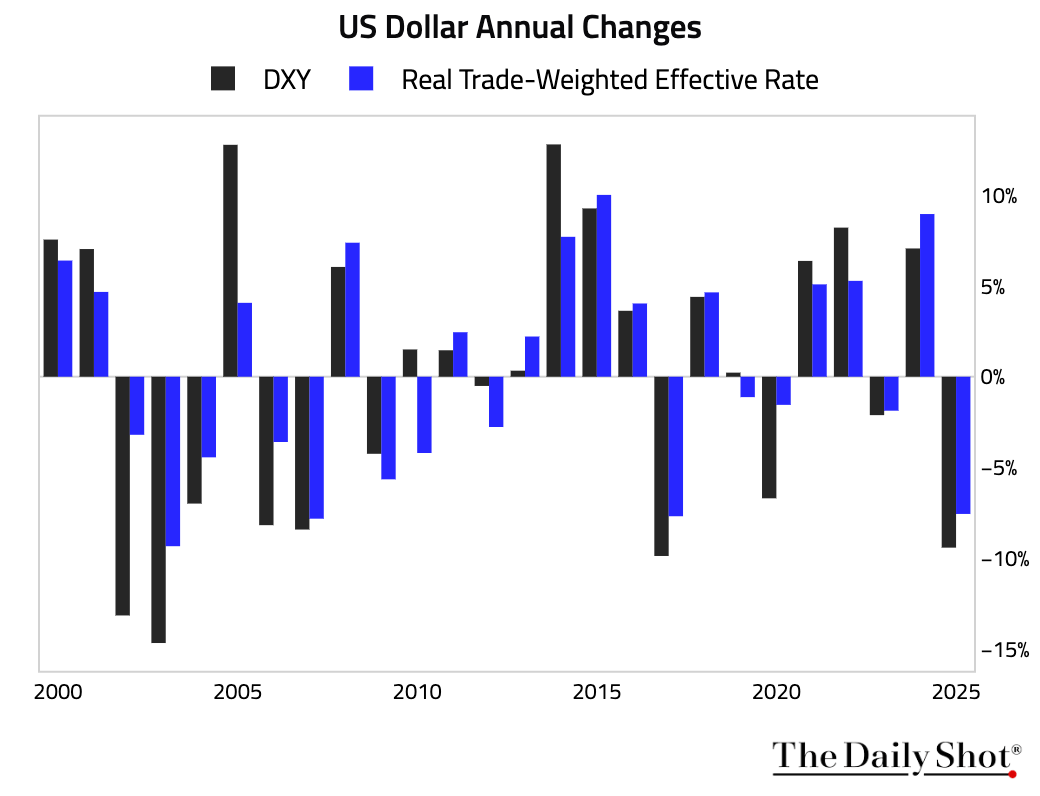
• The dollar had its worst year since 2017.
Back to Index
United States
1 Let’s look at some updates in the housing market.
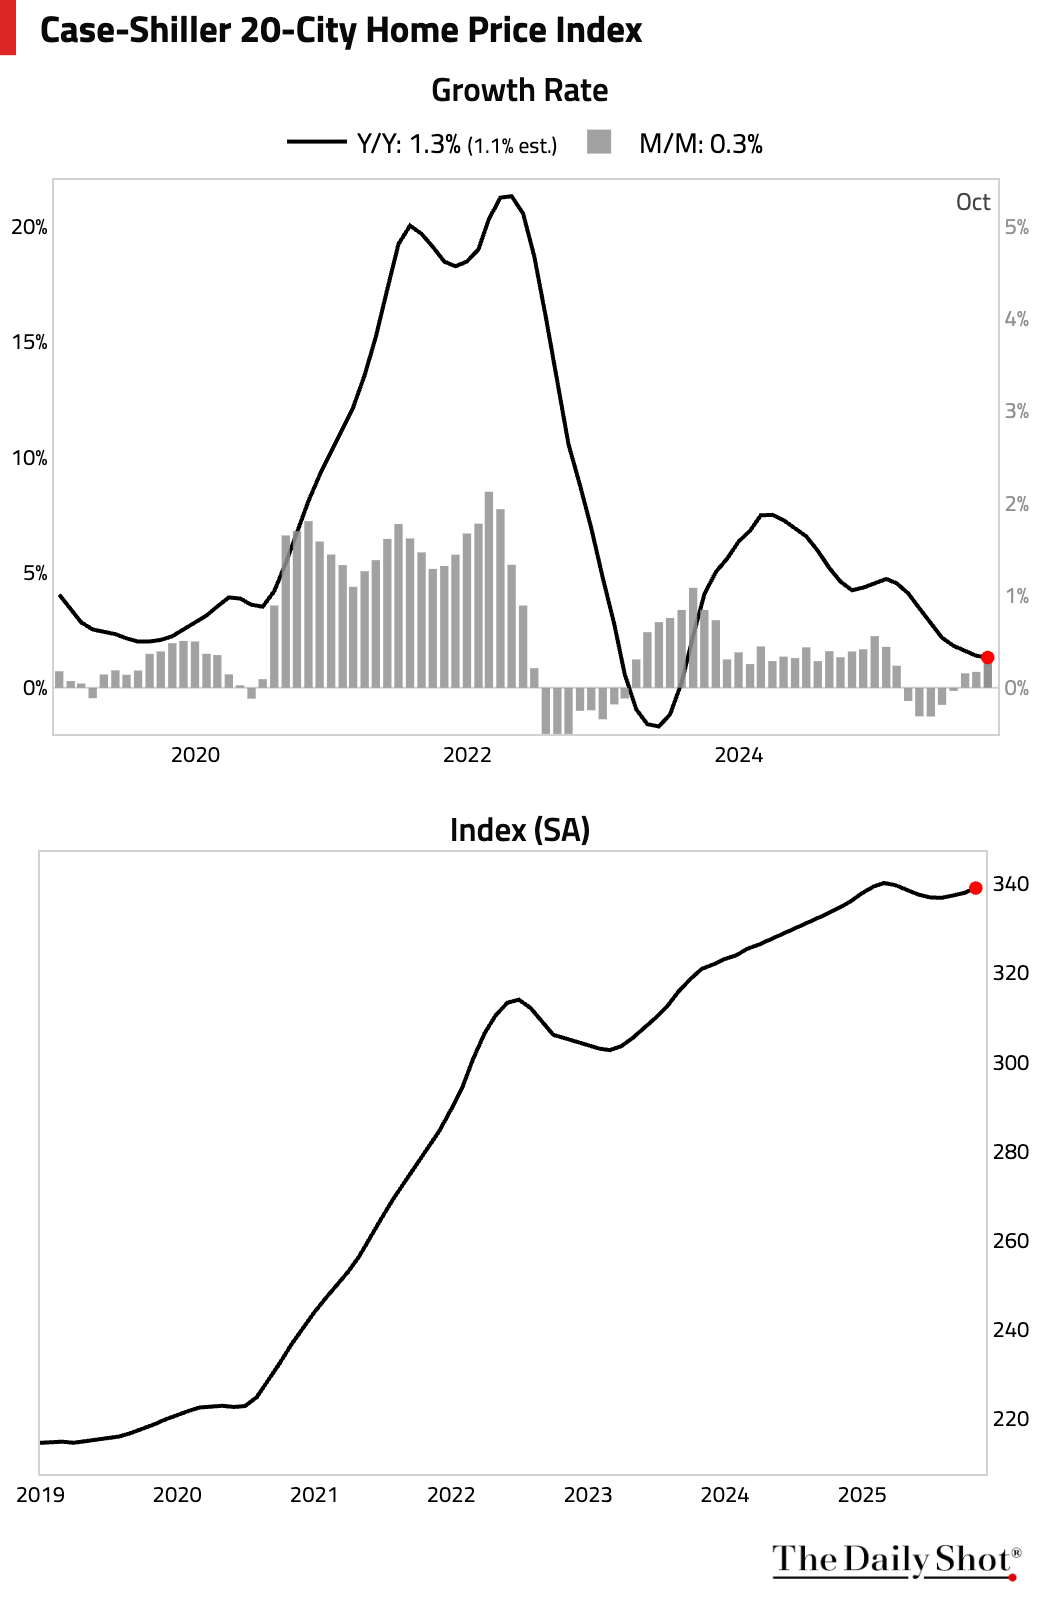
• The FHFA house price index rose in October to a record high, though the year-over-year gains continued to decelerate.
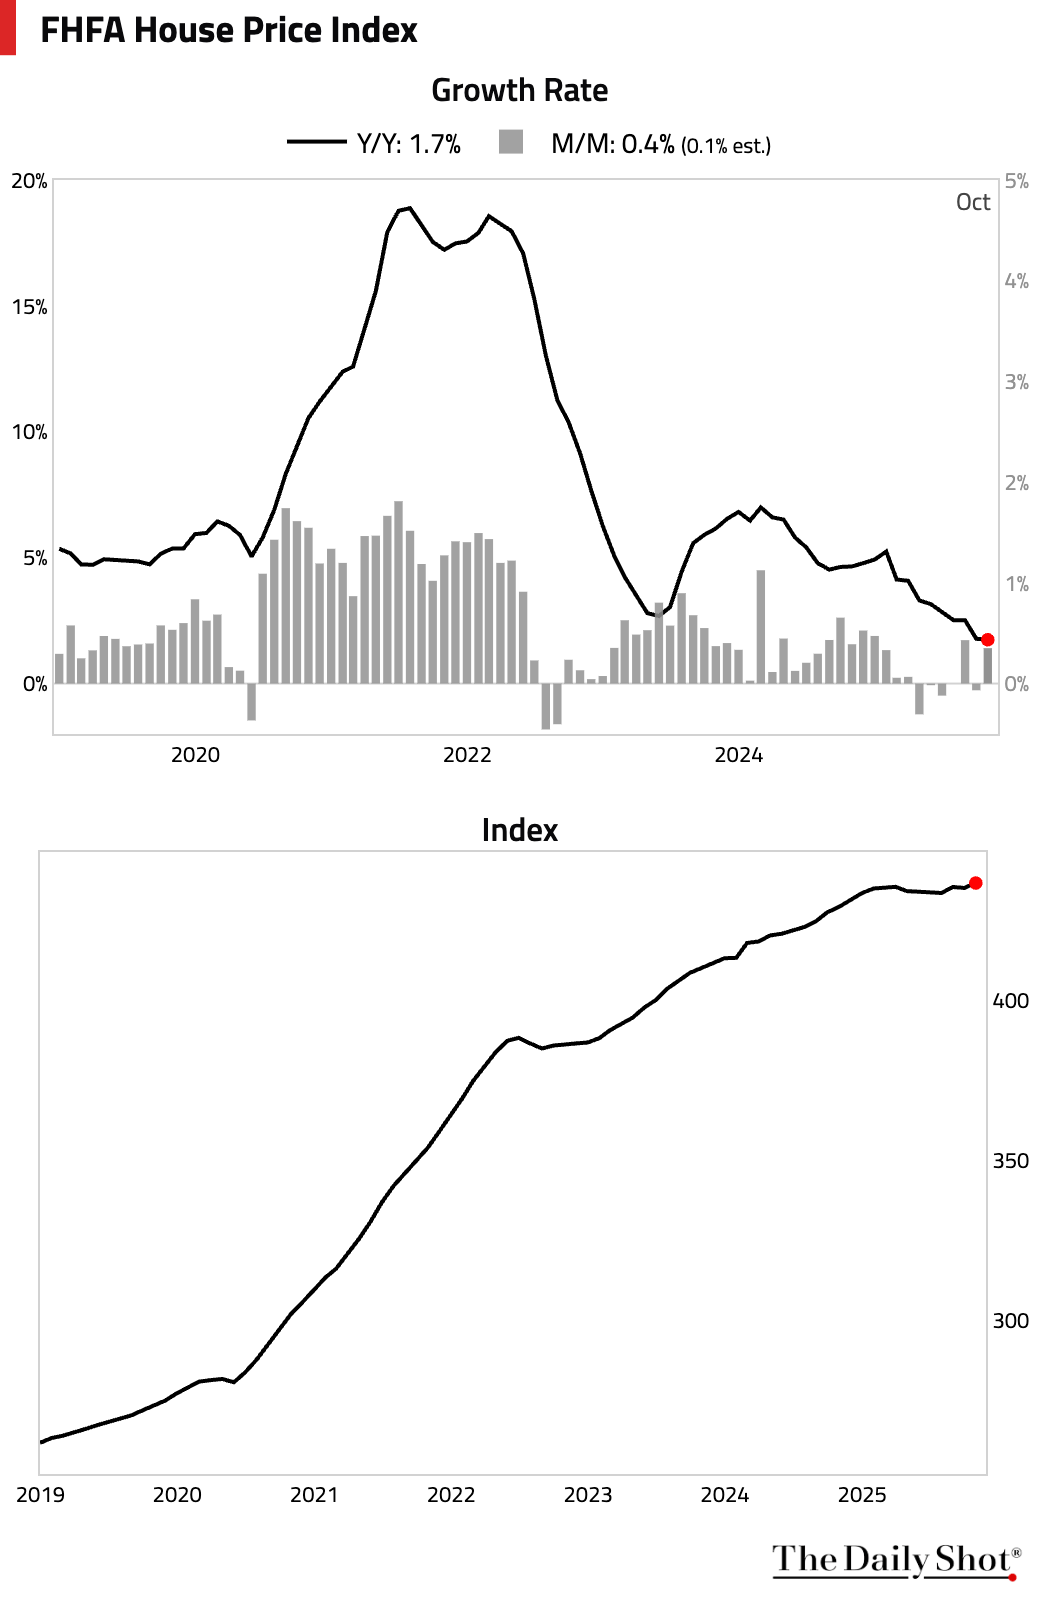
– The Case-Shiller home price index painted a similar picture, with prices rising month over month but slowing year over year.
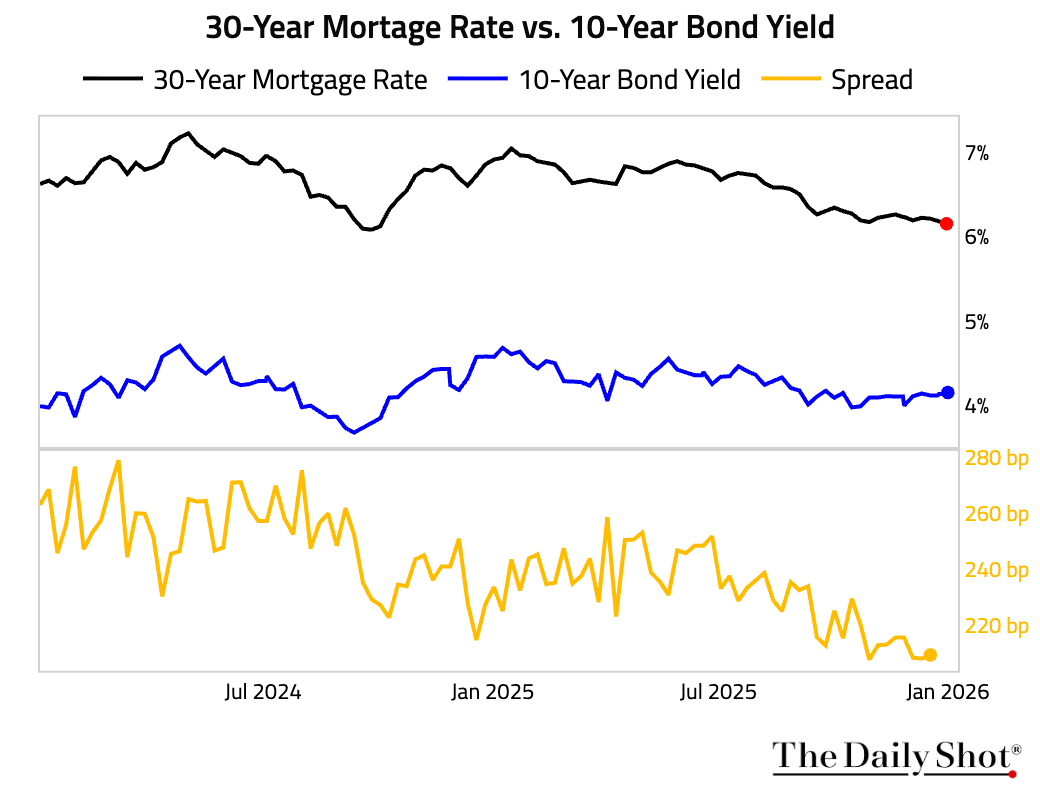
• Mortgage rates ended 2025 at the lowest point for the year.
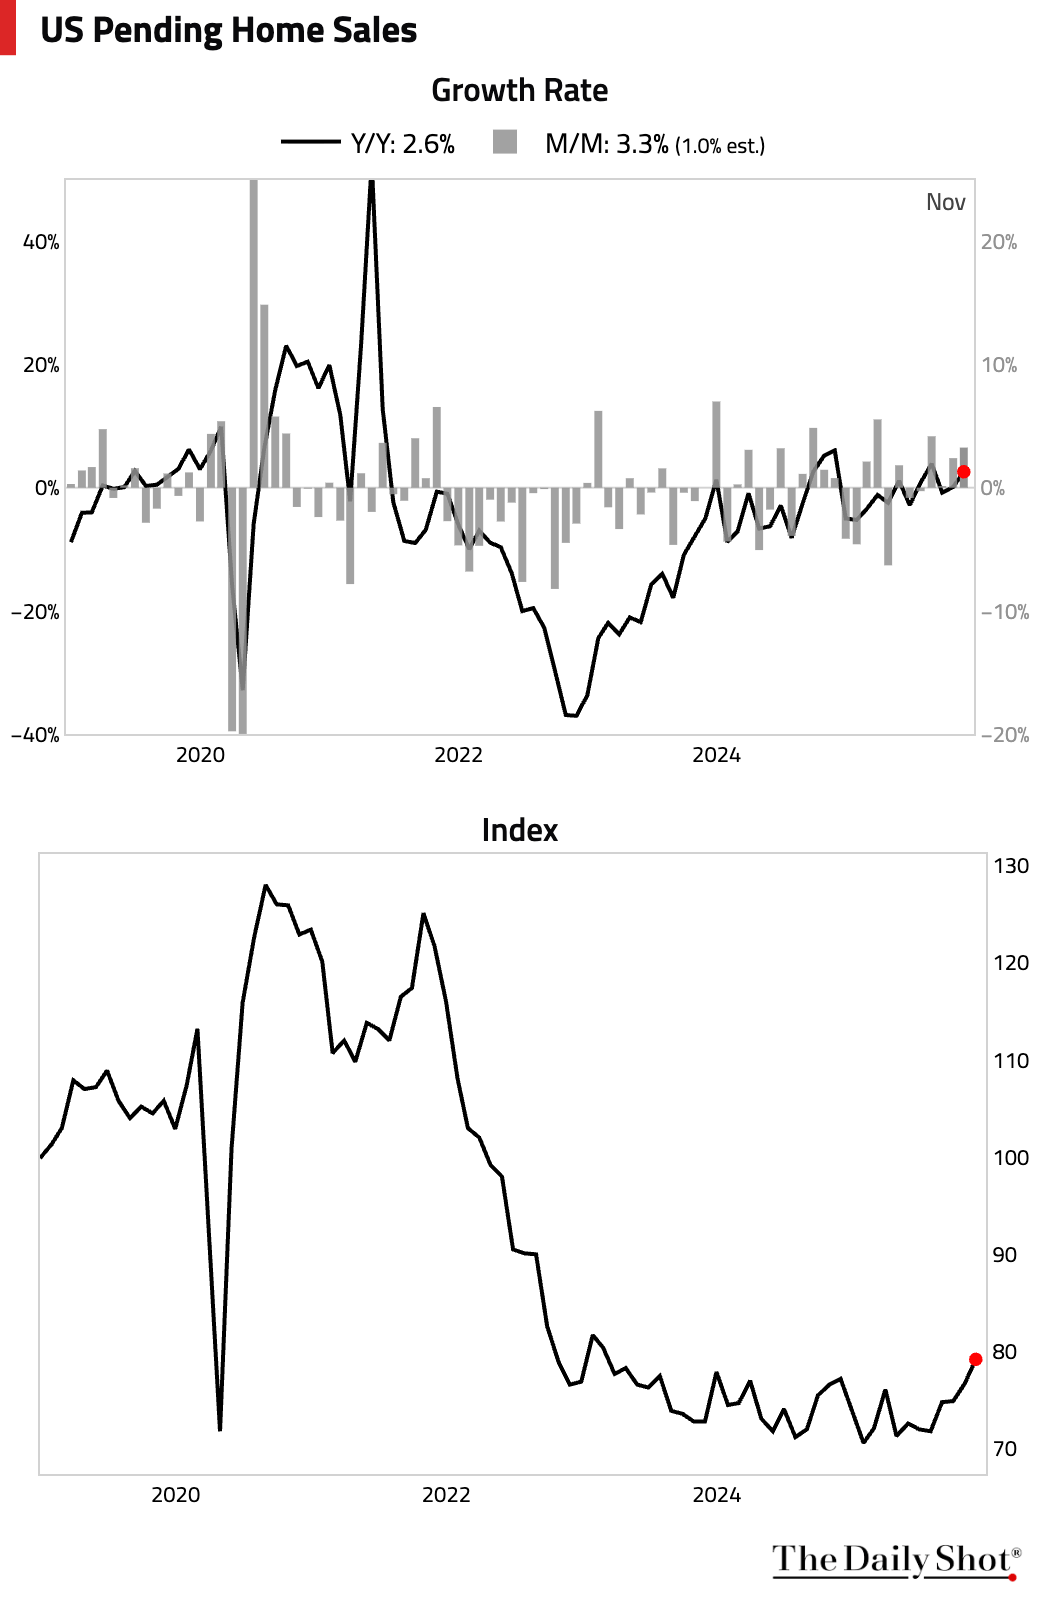
• The moderating mortgage rates and slower price growth helped push pending home sales to their highest level since February 2023.
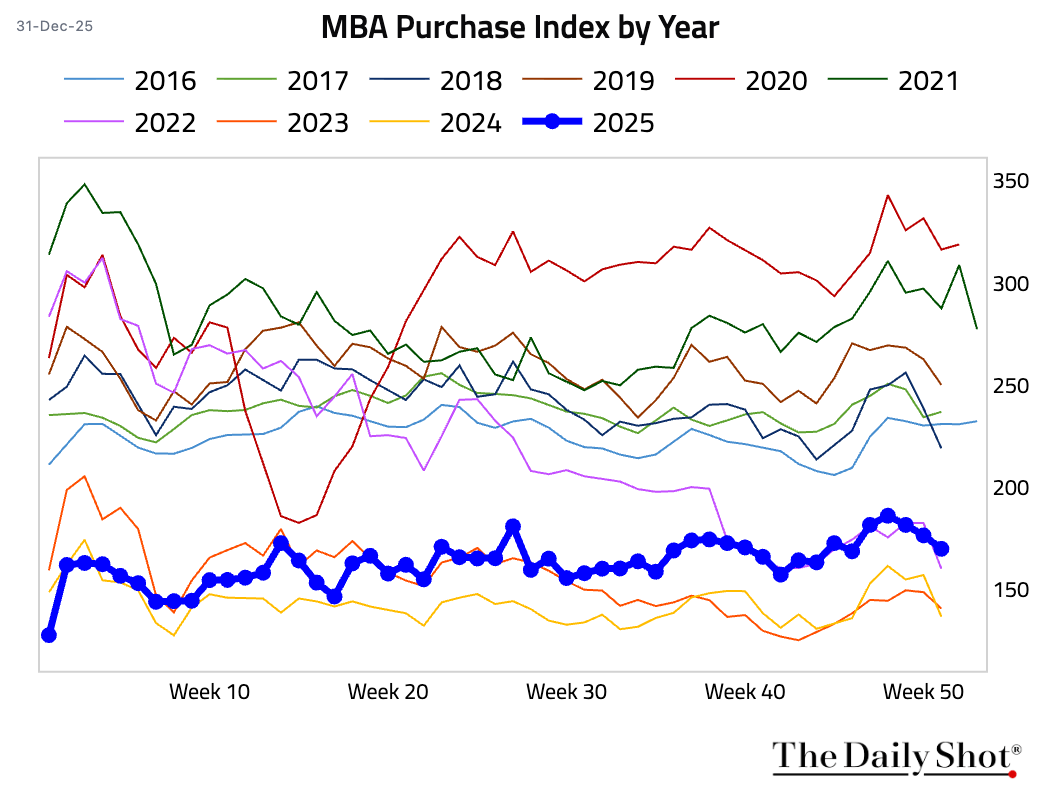
• Mortgage applications fell for the third consecutive week.
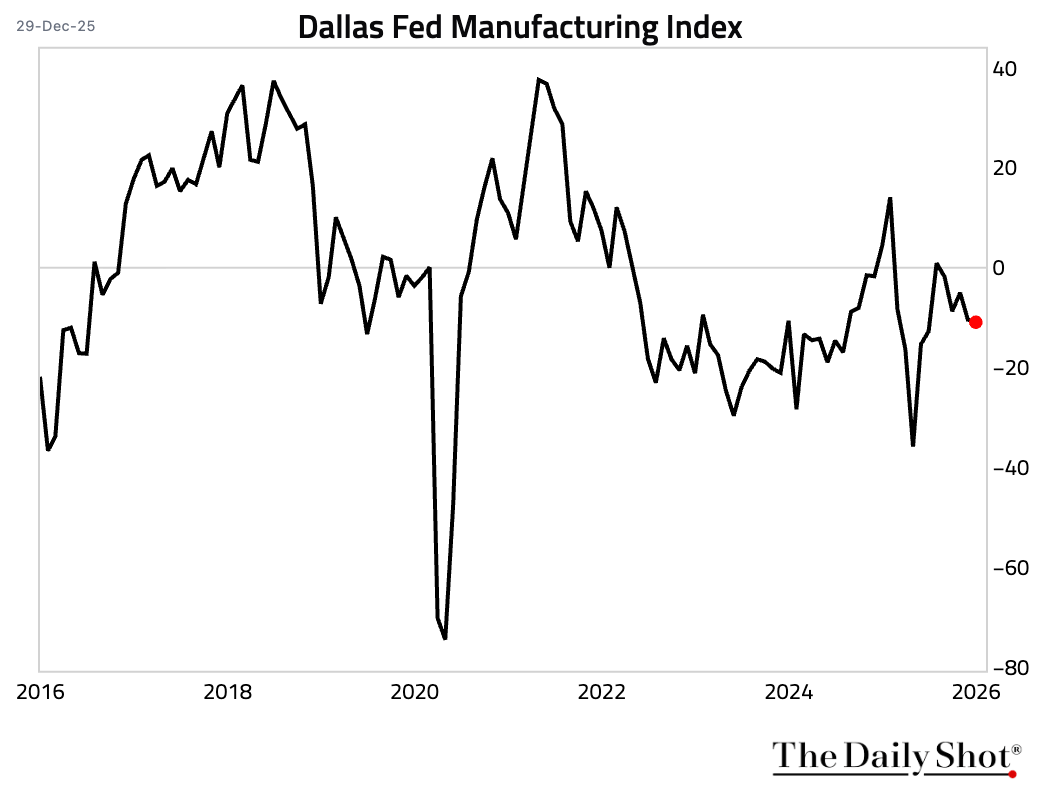
2 The Dallas Fed Manufacturing Index edged down further into contractionary territory this month.
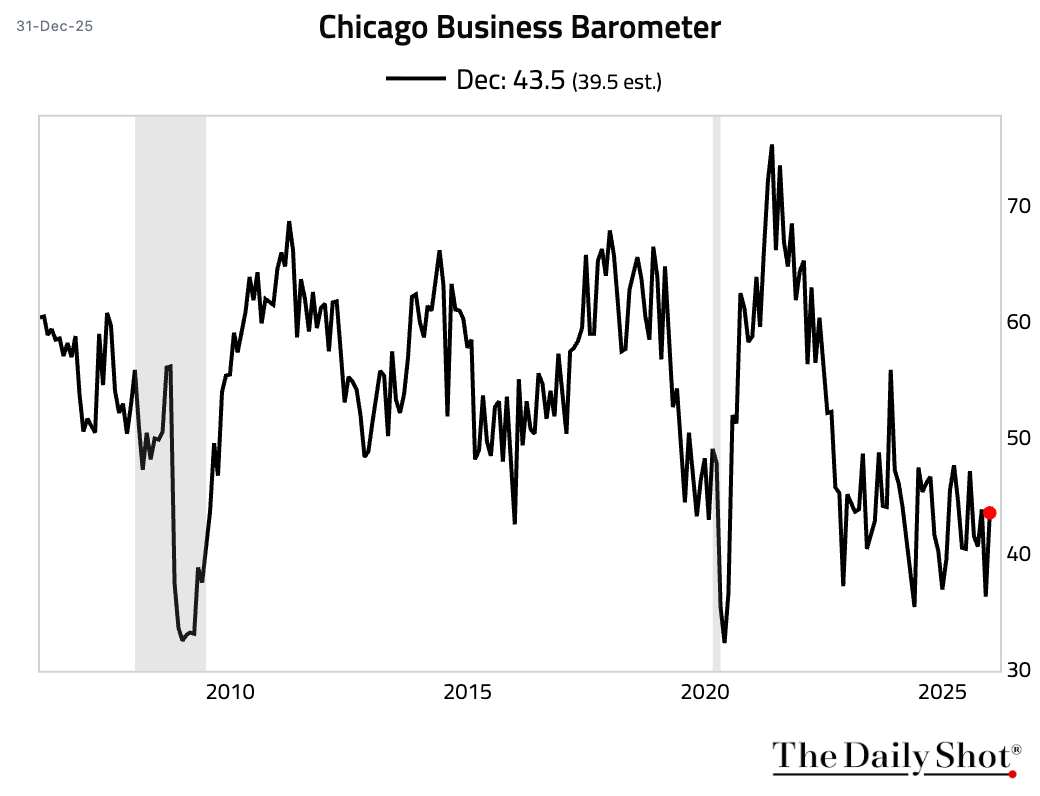
3 The Chicago PMI improved more than expected.
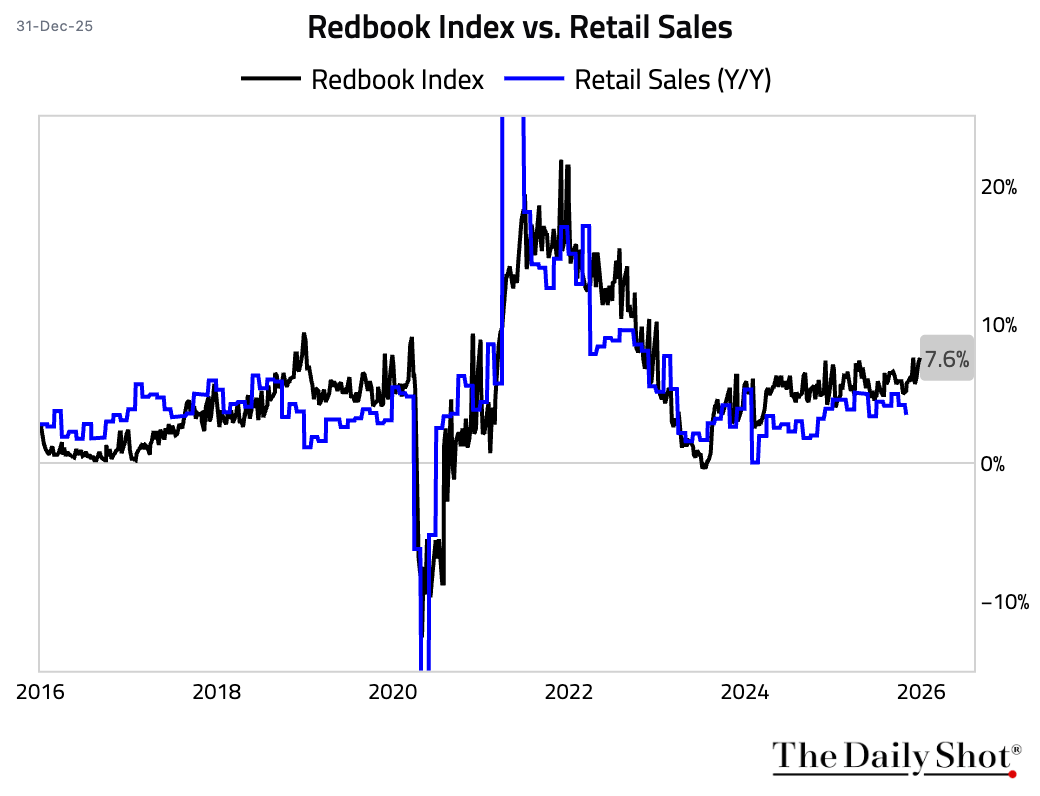
4 The Redbook index surged during the holiday season to a multi-year high.
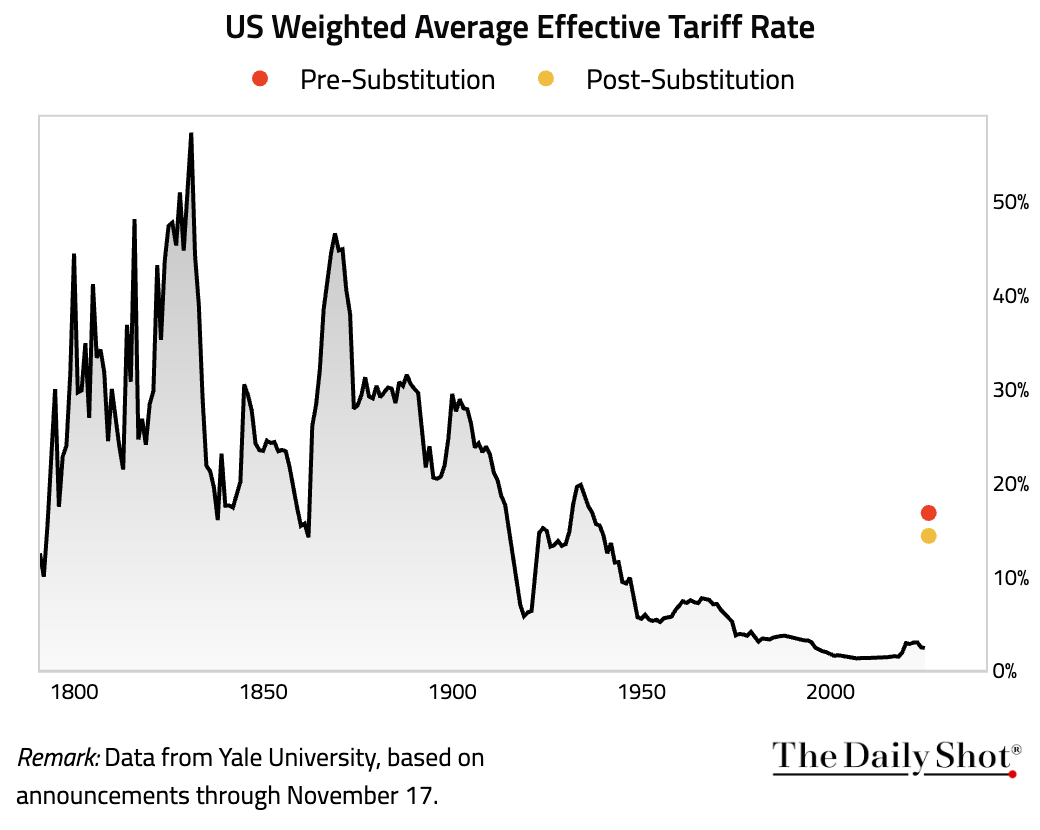
5 The weighted-average tariff rate ended 2025 at the highest level since the 1930s.
Back to Index
Canada
1 The manufacturing PMI edged up to 48.6 in December from 48.4, but the sector remained in contraction.
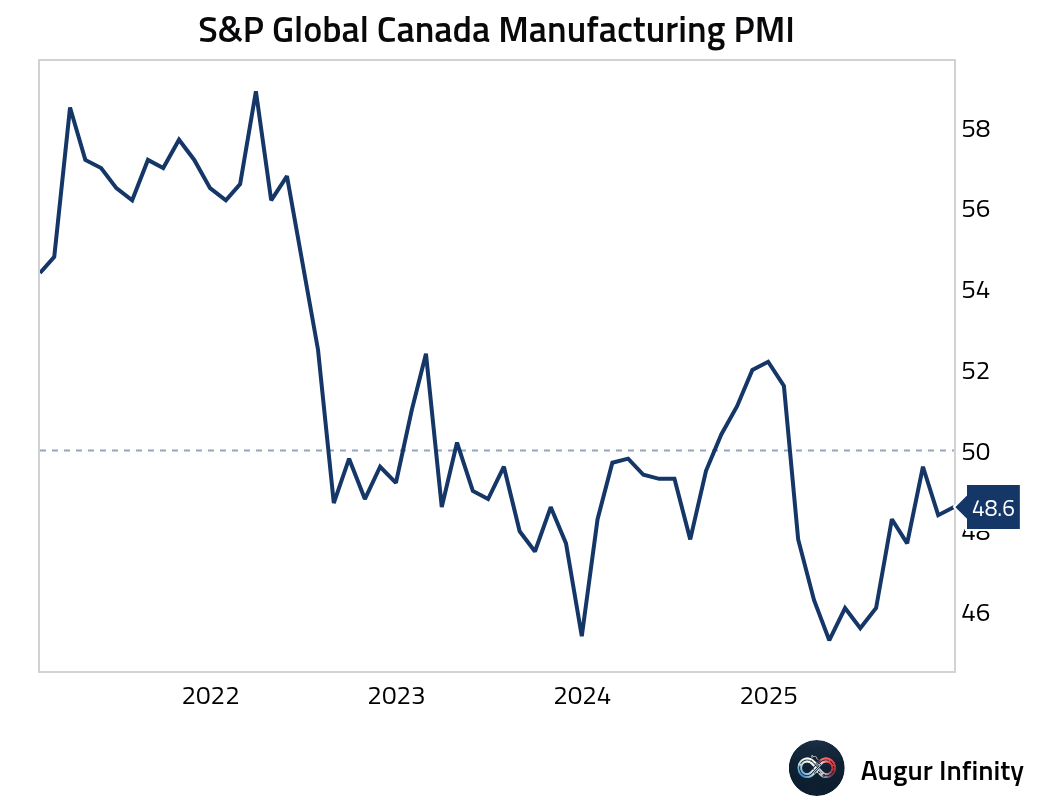 Source: S&P Global PMI
Back to Index
The Eurozone
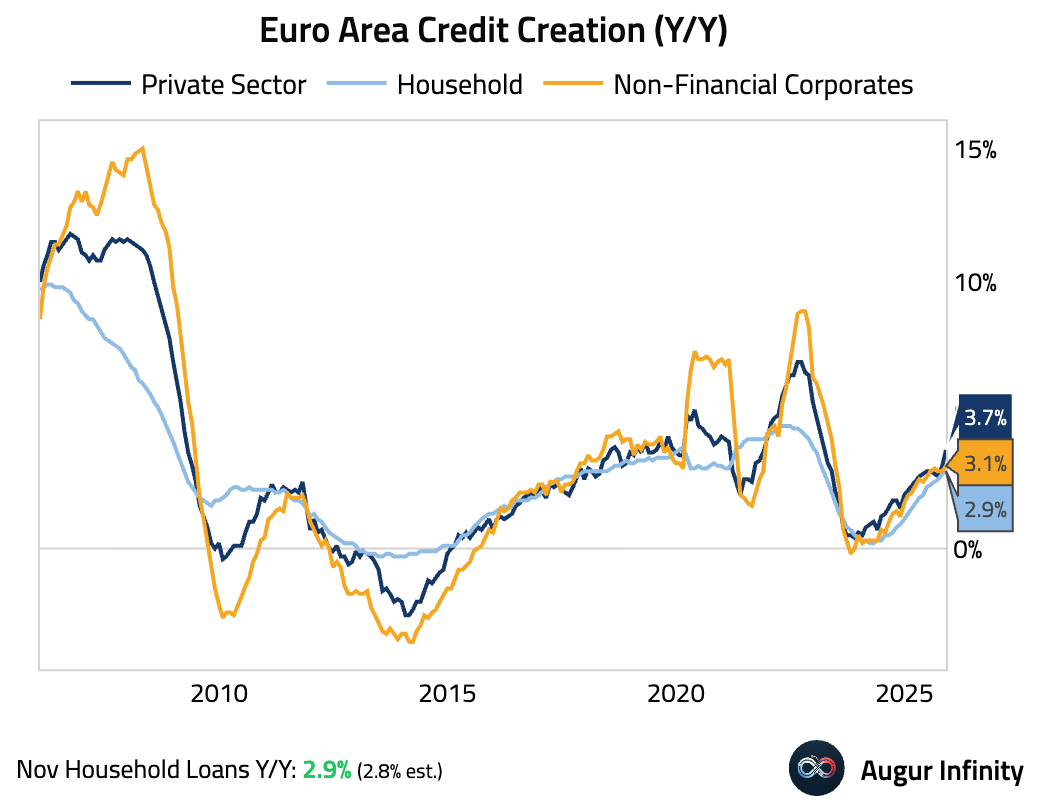
1 Lending growth in the euro area accelerated.
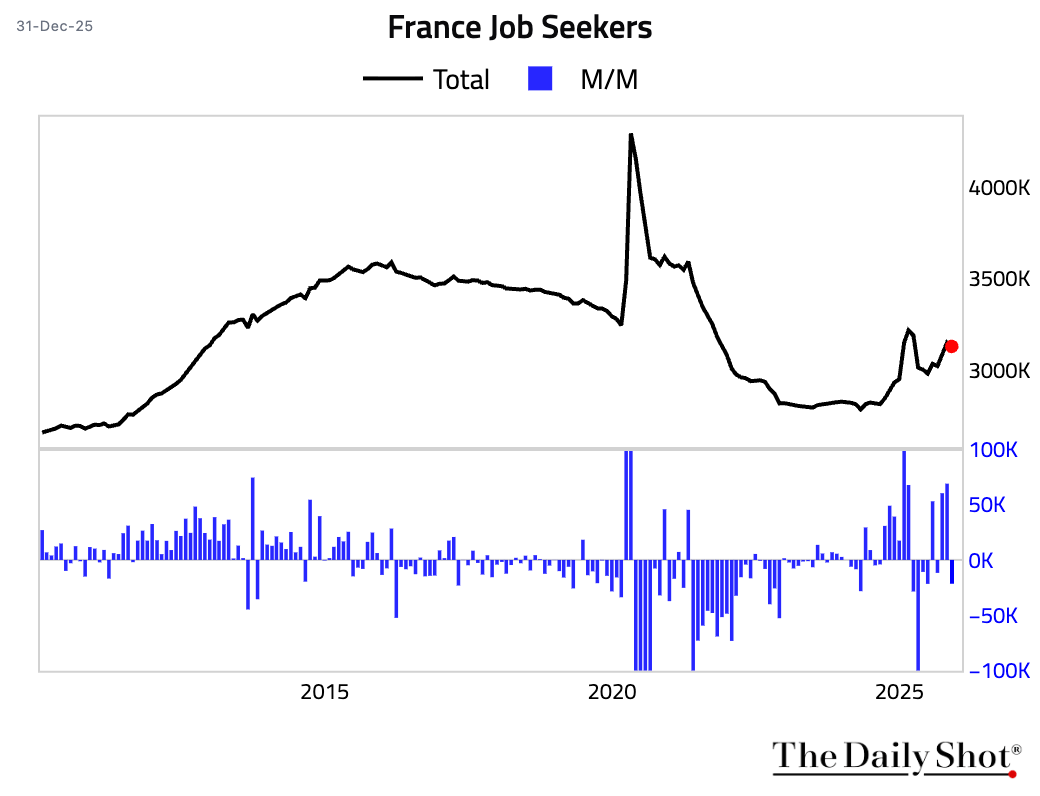
2 The French labor market showed signs of improvement as the number of jobseekers fell in November.
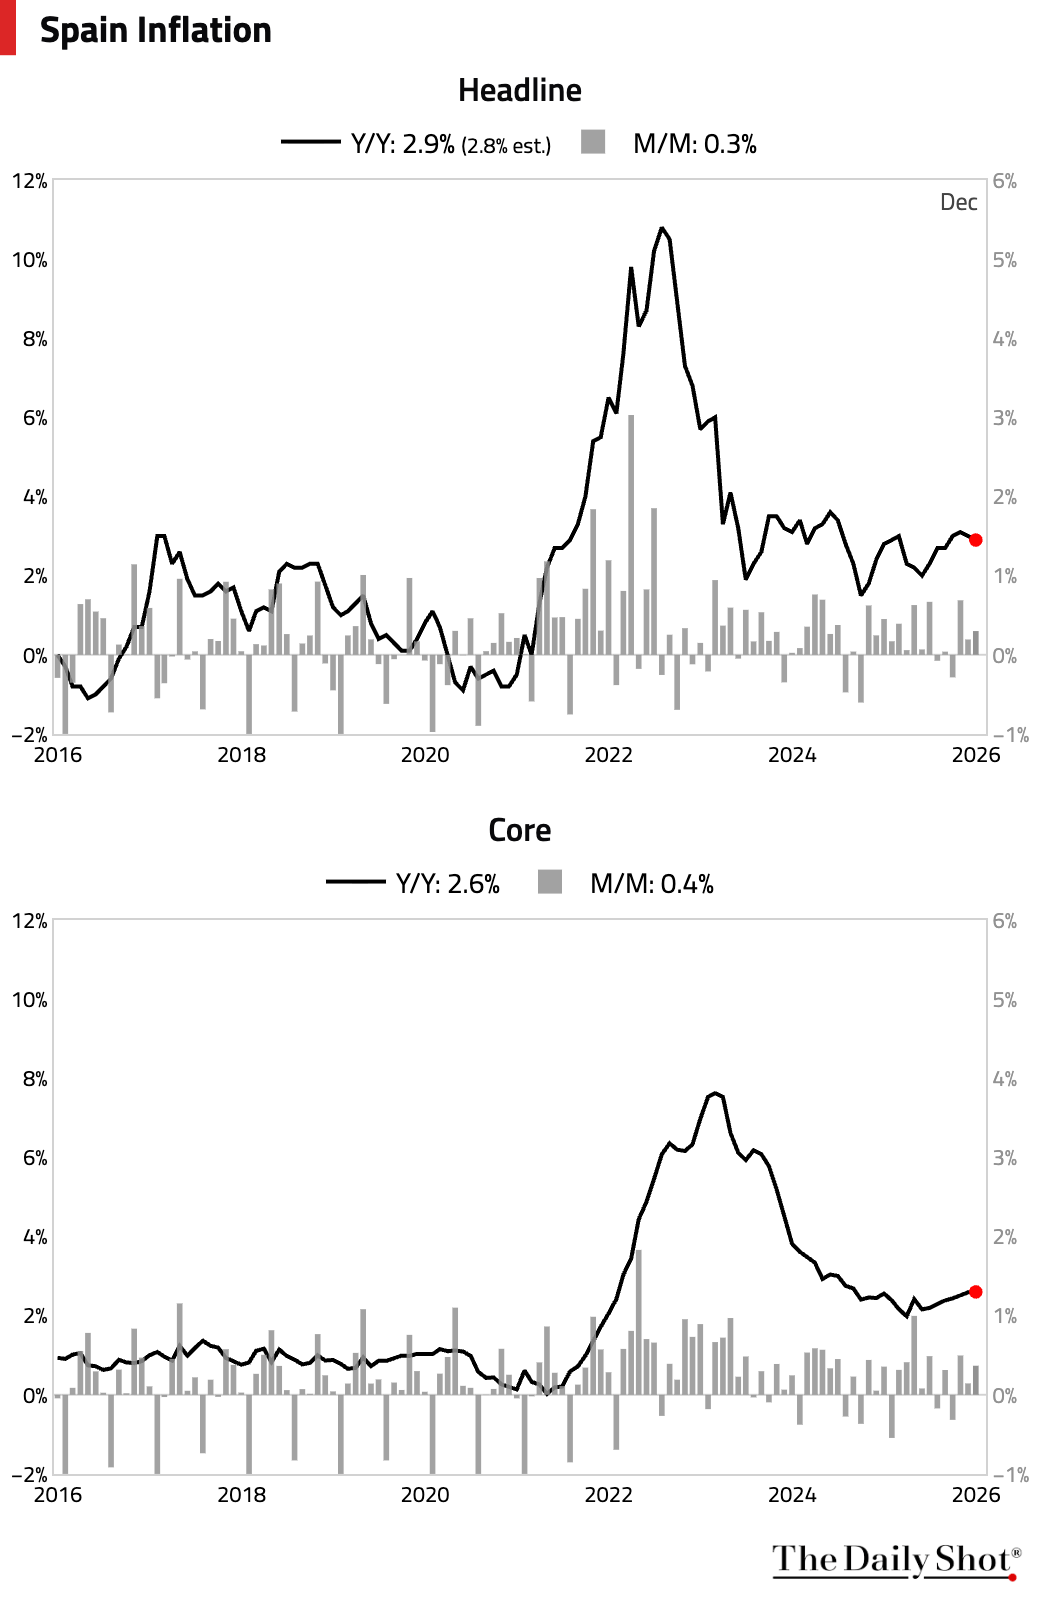
3 Turning to Spain, inflation eased in December, driven by lower fuel prices and softer leisure and culture inflation. Core inflation, however, remained firm.
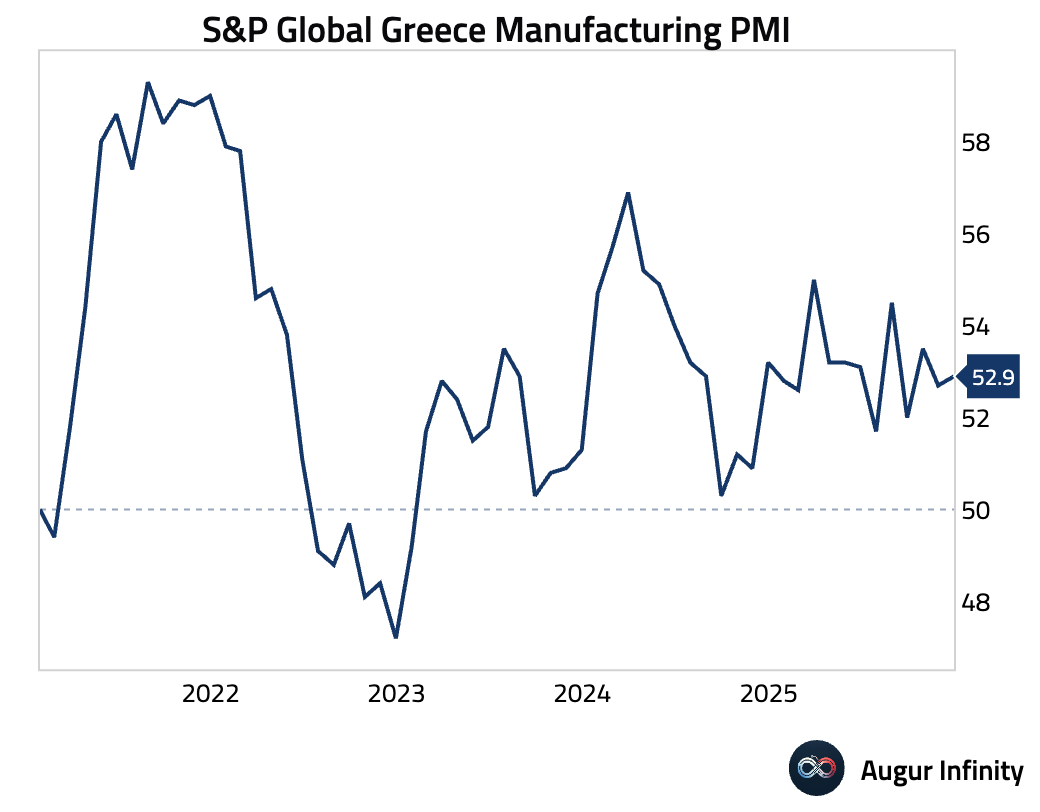
4 Greece’s manufacturing PMI rose, as improving demand led to faster growth in new orders.
Back to Index
Europe
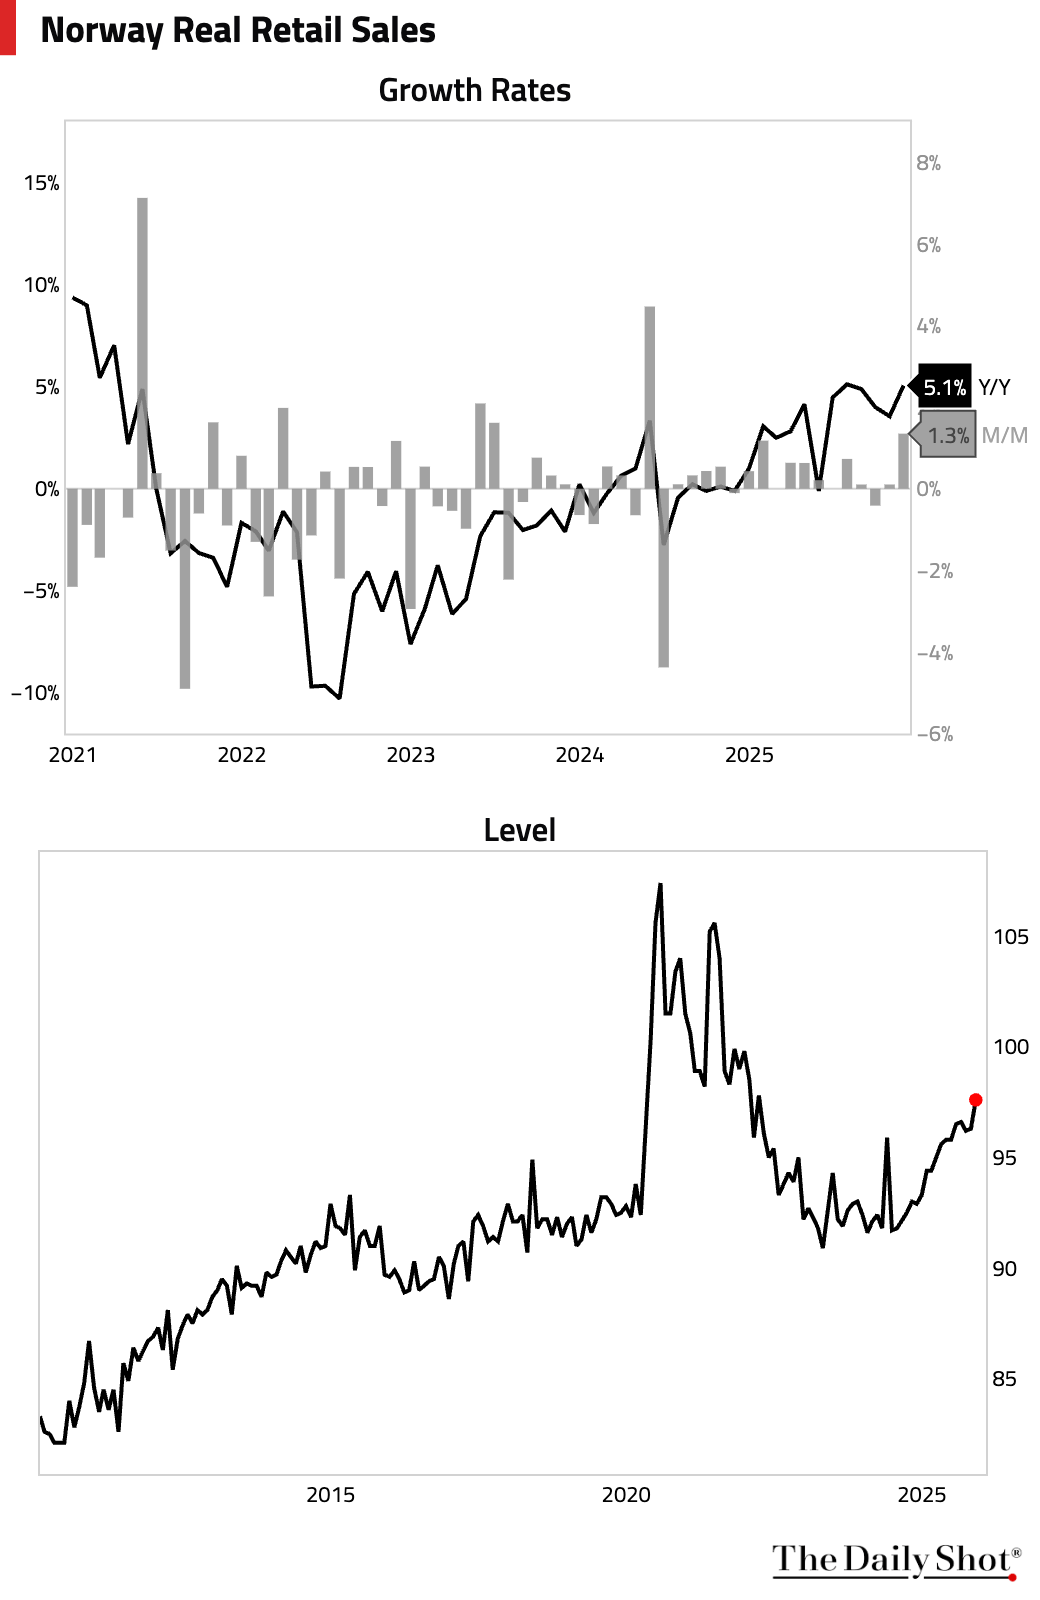
1 Norway’s retail sales jumped.
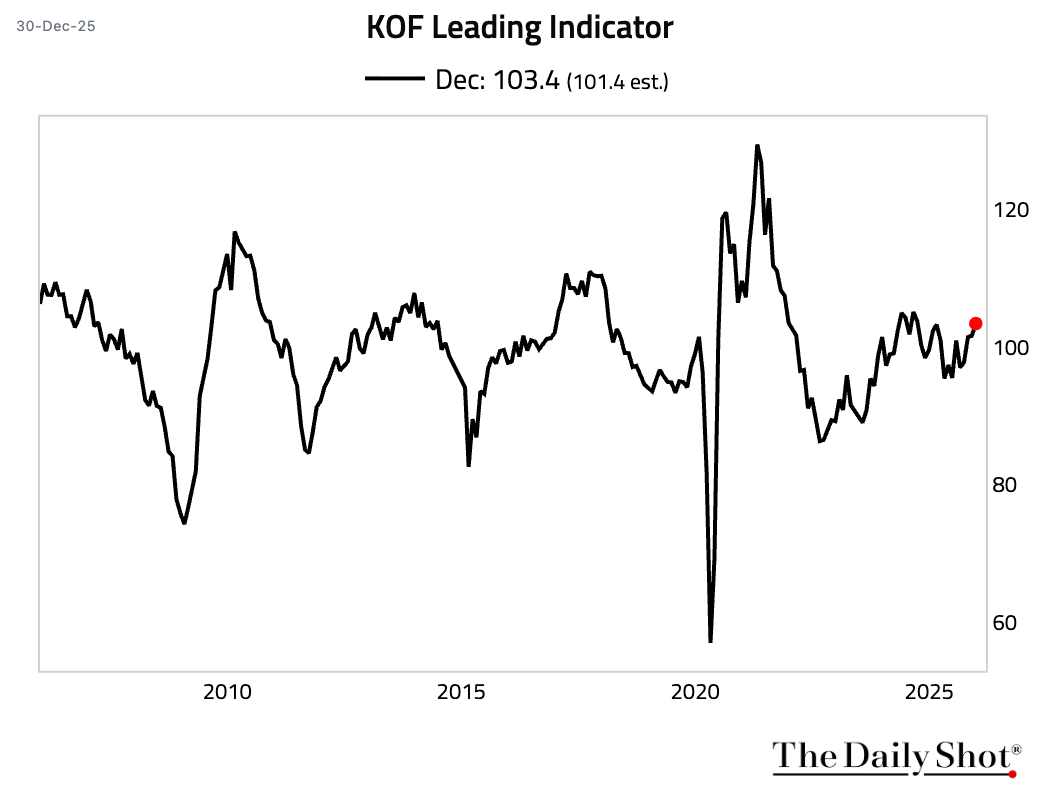
2 Switzerland’s KOF leading indicator improved to its highest level in 15 months.
Back to Index
Japan
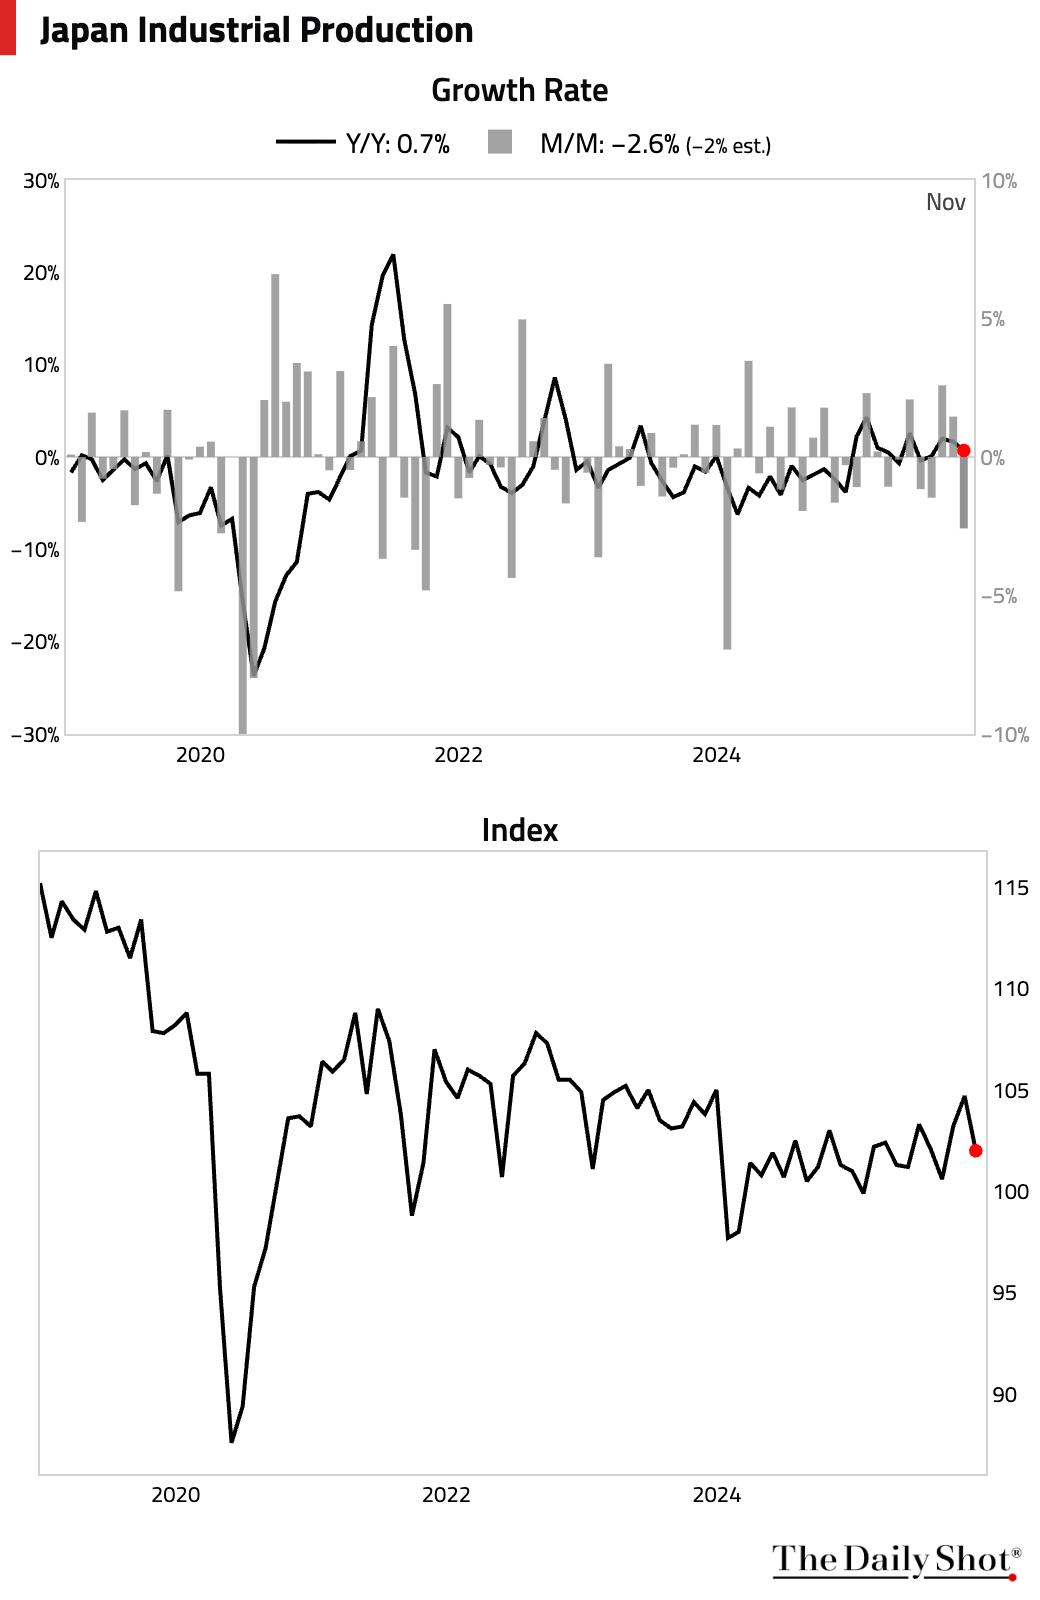
1 The contraction in industrial output was worse than expected, with 12 of 15 sectors registering declines in November.
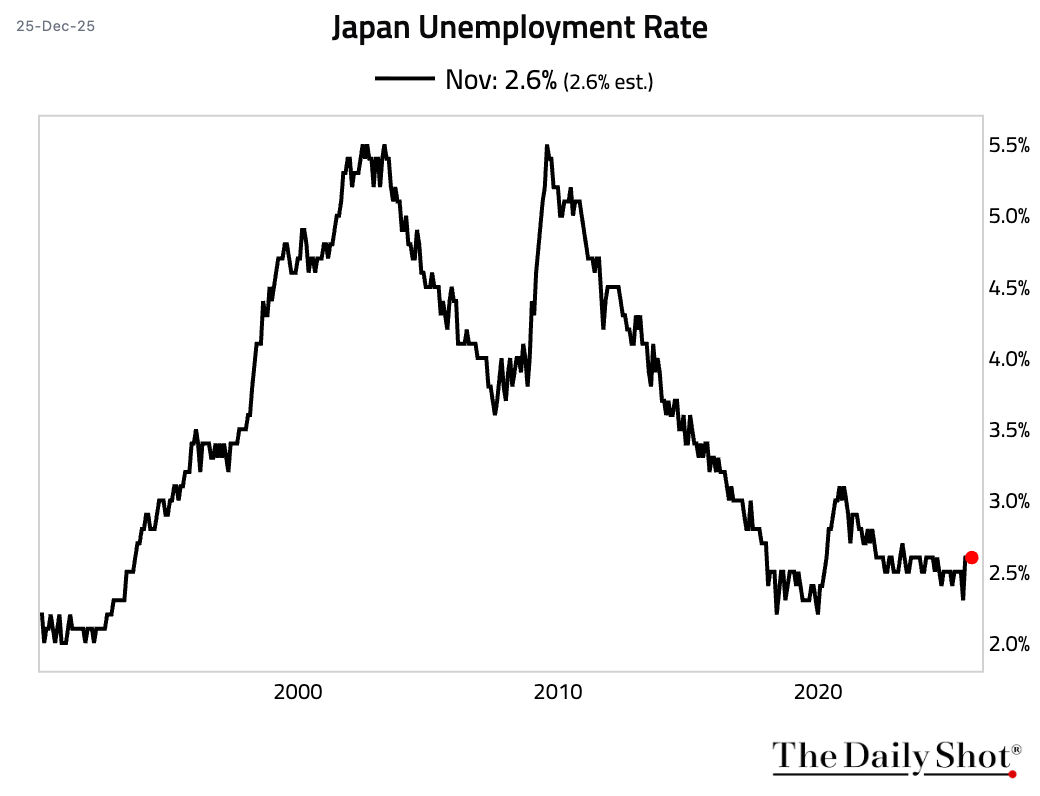
2 The unemployment rate was stable.
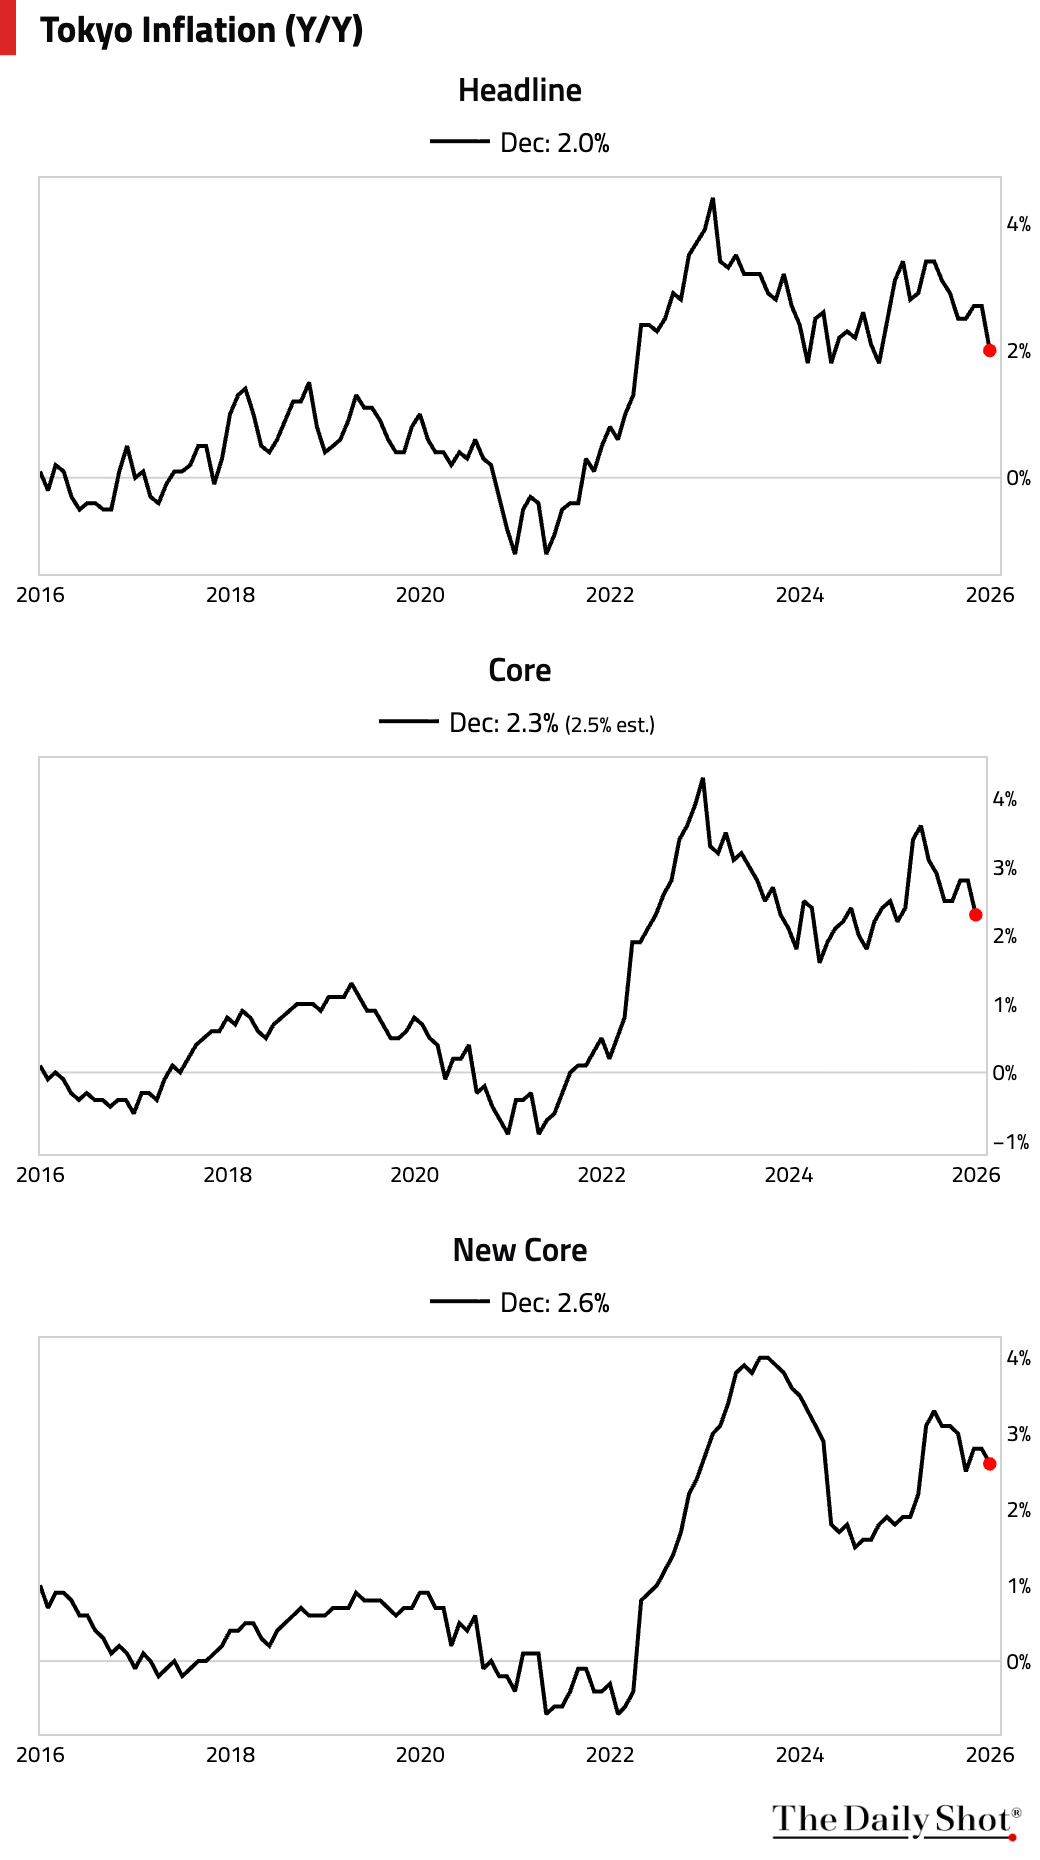
3 Core inflation in Tokyo slowed to 2.3% year over year in December, undershooting expectations as falling energy prices weighed on inflation. The decline in energy prices was due to the base effect from the end of price control measures in December 2024. Excluding both fresh food and fuel, “New Core” inflation eased to 2.6% but remained above the BoJ target.
Back to Index
Asia-Pacific
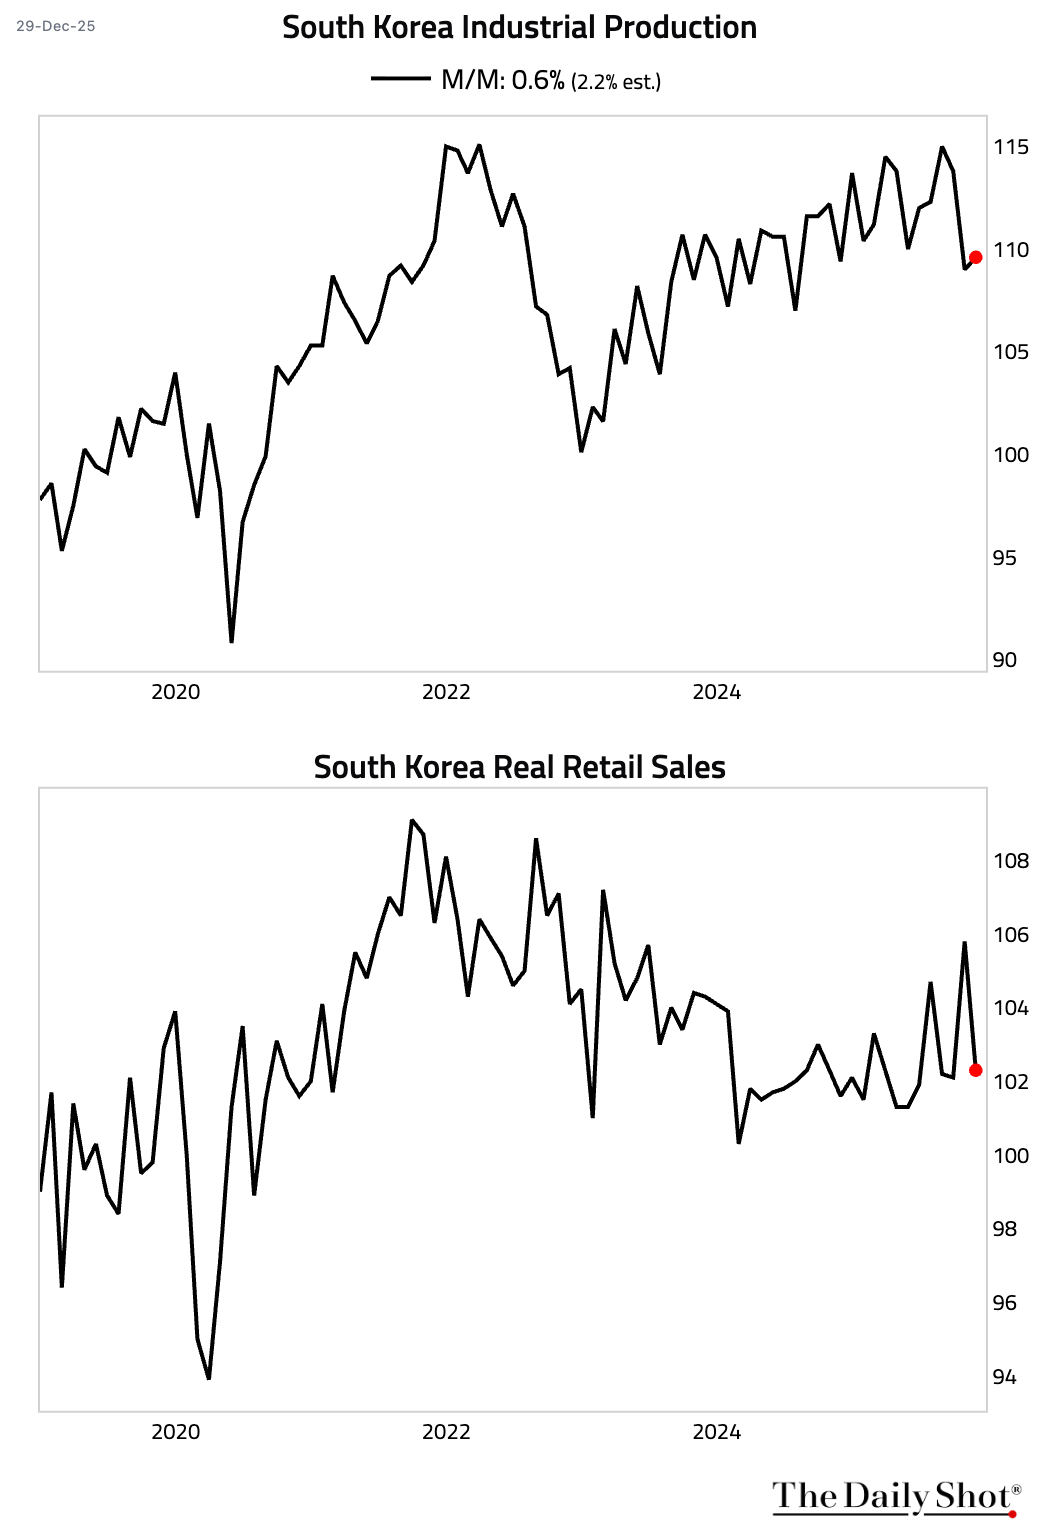
1 South Korea’s industrial production improved by less than expected in November, while retail sales slumped.
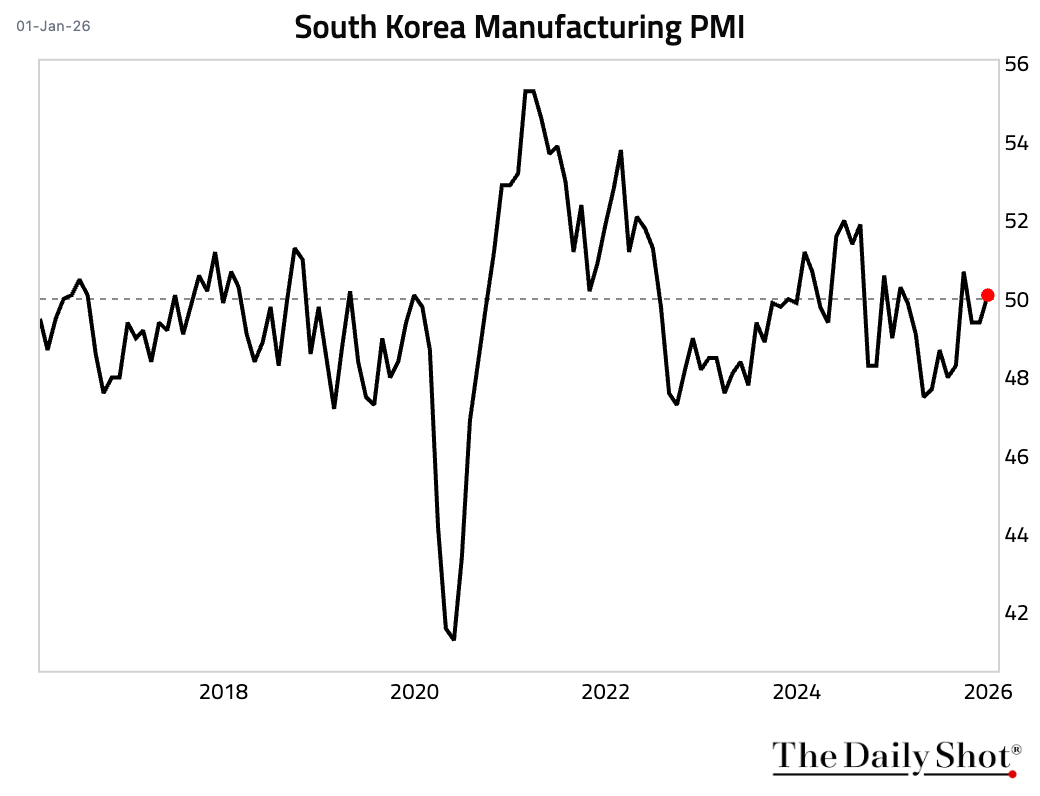
• Manufacturing PMI returned to expansionary territory in December, driven by the strongest new orders growth in over a year.
 Source: S&P Global PMI
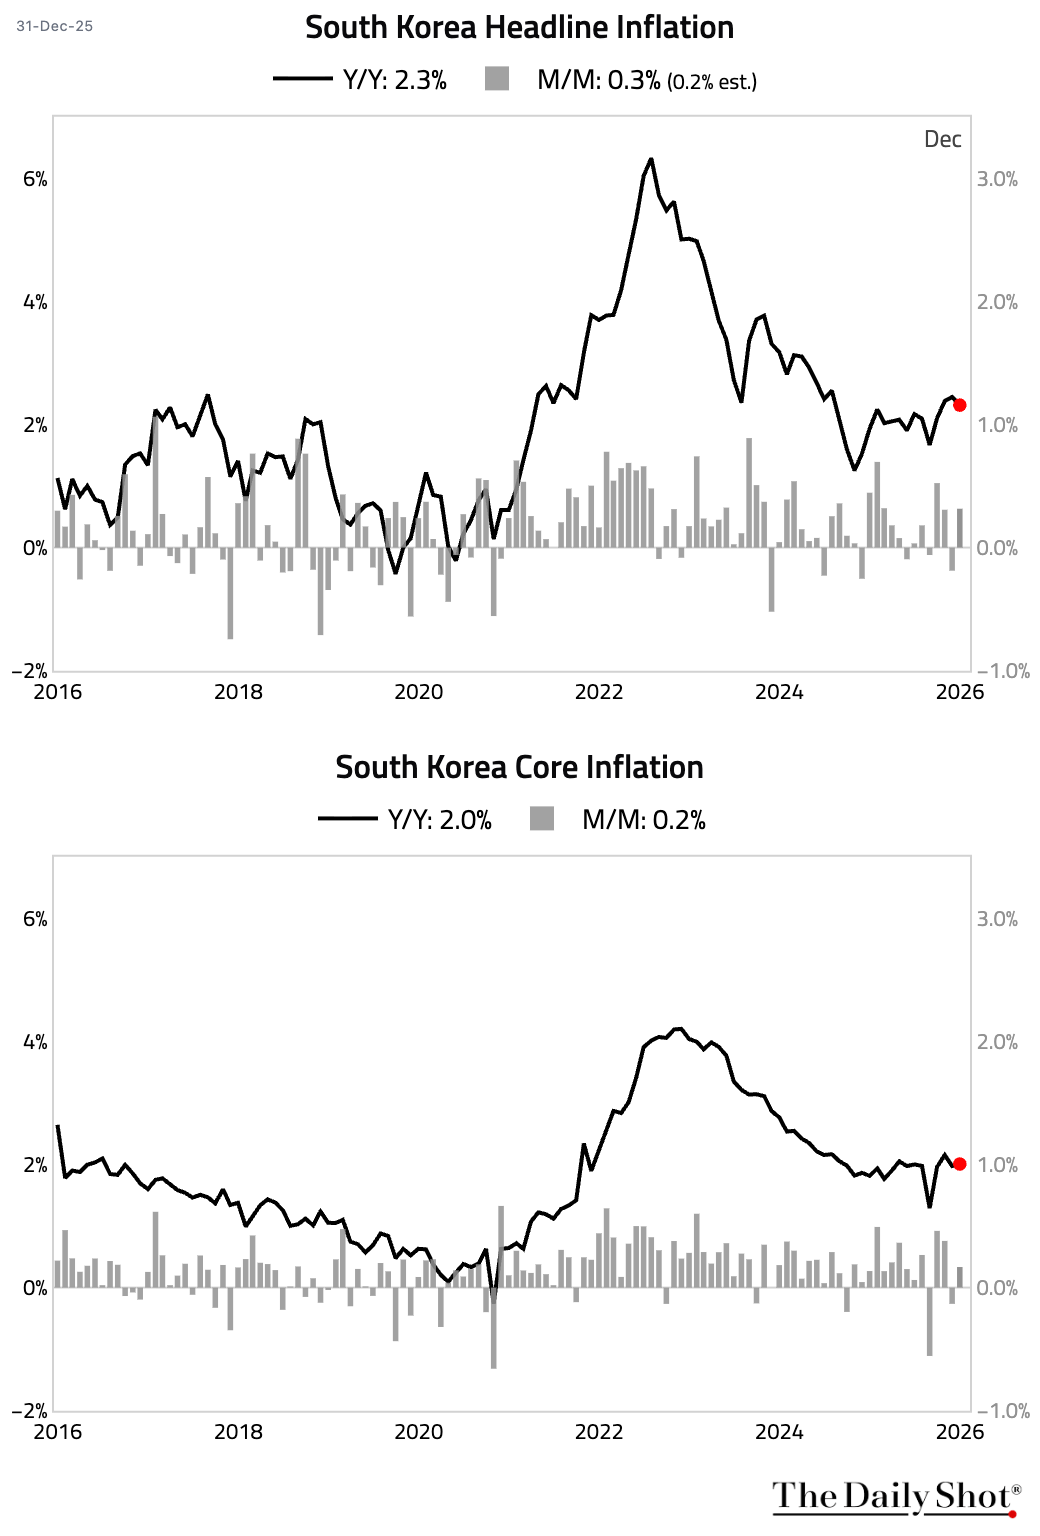
• Headline inflation moderated in December, partially due to base effects. Core inflation was unchanged.
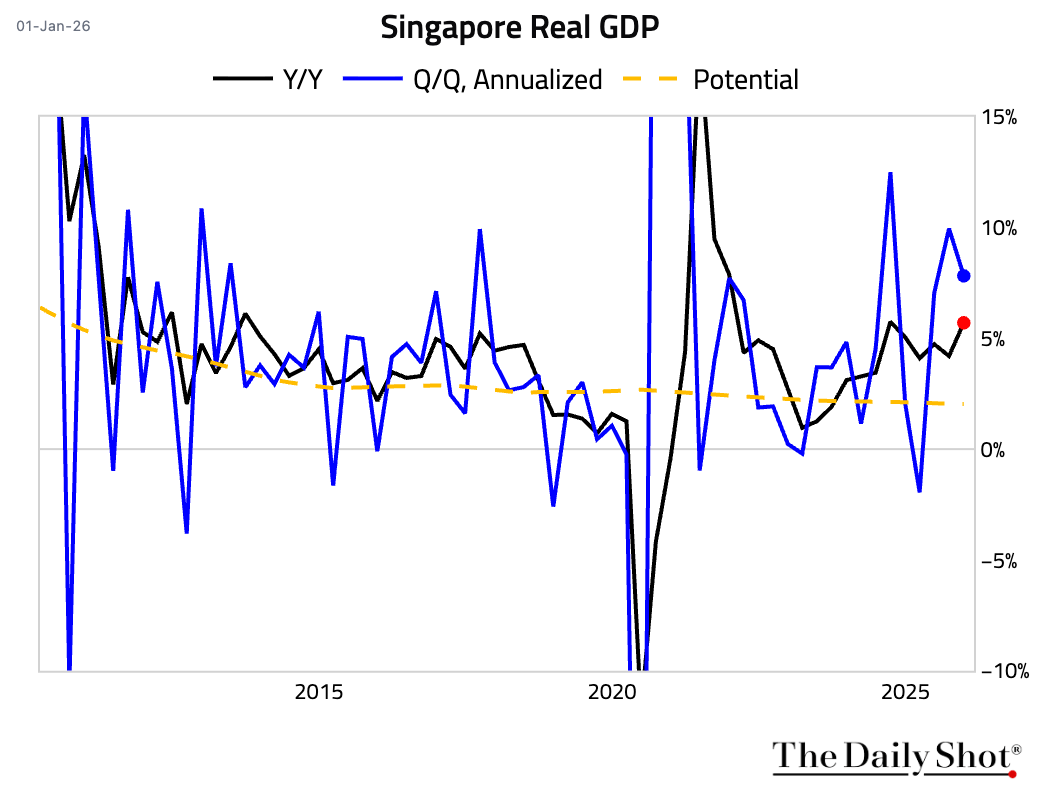
2 Singapore’s economy continued its robust expansion, driven by delayed US tariffs and an AI-related surge in semiconductor demand.
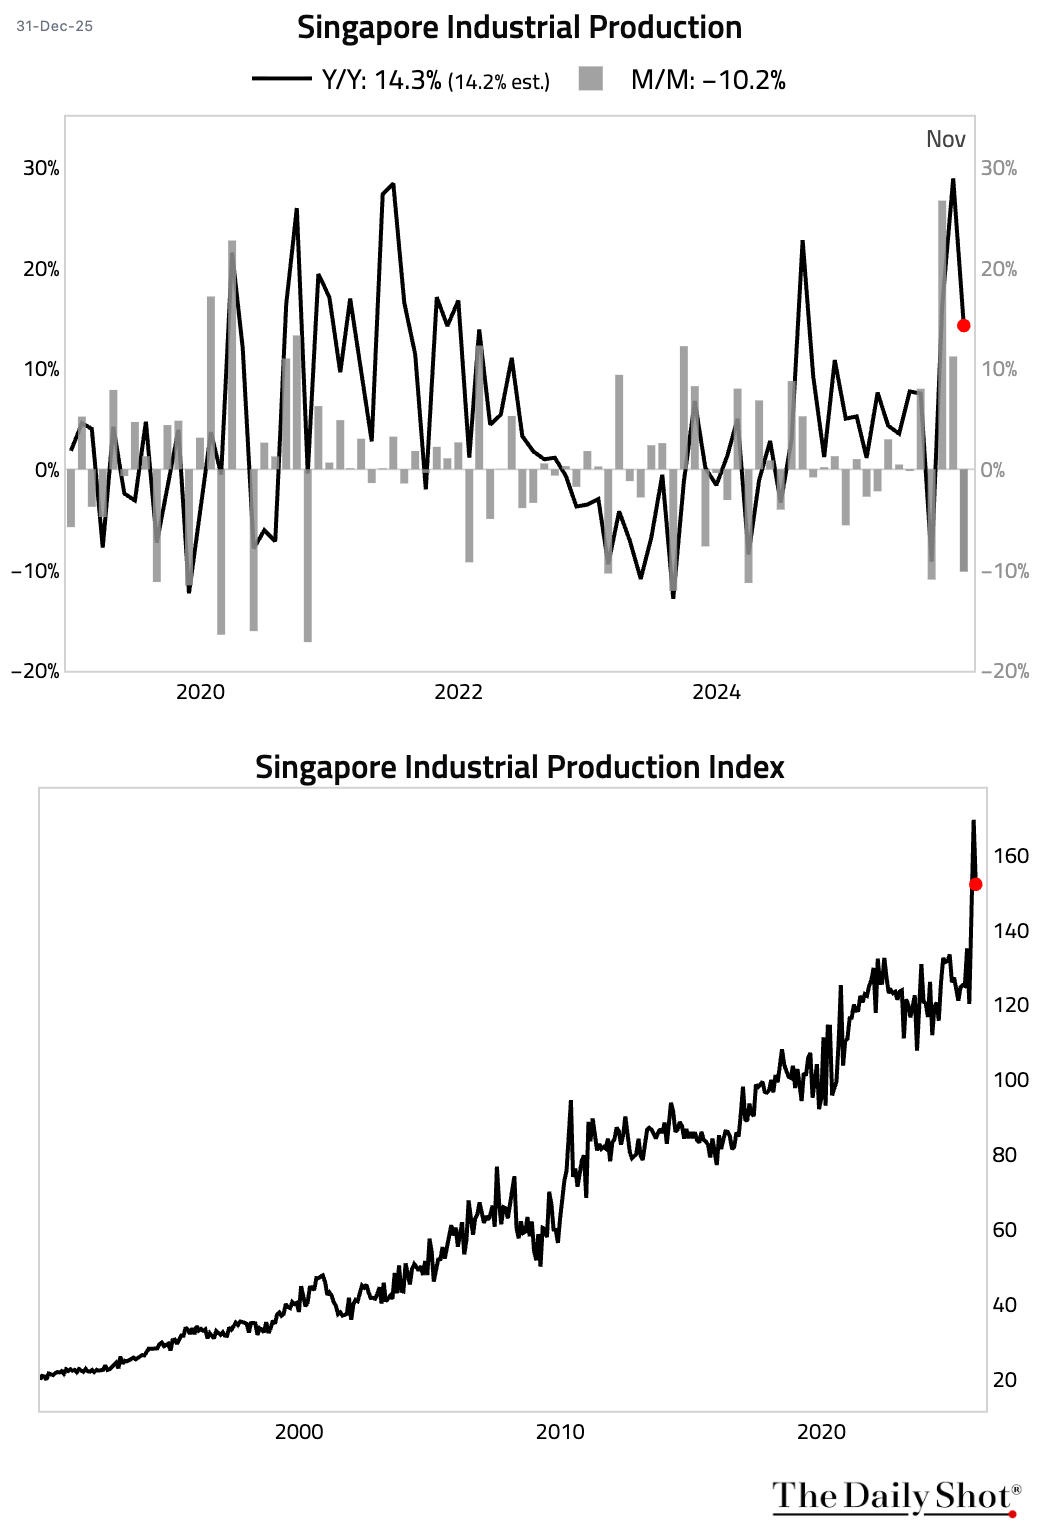
• Industrial output cooled after two blockbuster months.
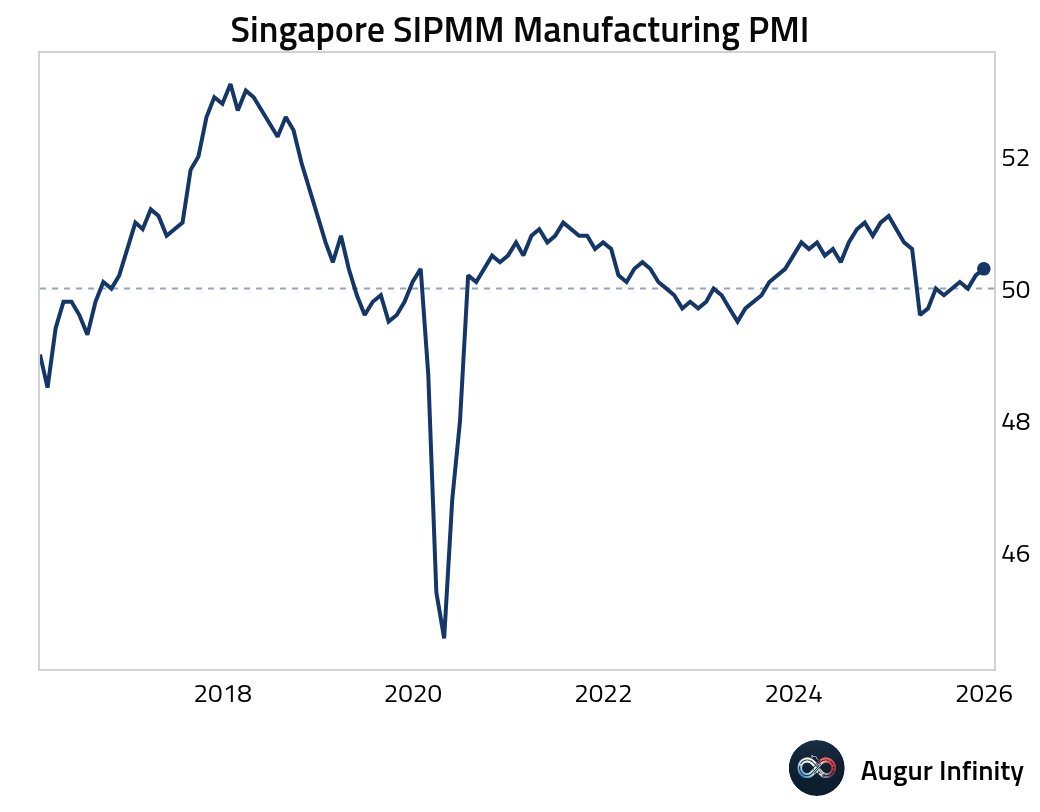
• The SIPMM Manufacturing PMI edged up further into expansionary territory.
Back to Index
China
1 China’s industrial profits in the first eleven months were roughly flat relative to the same period last year. On a single-month year-over-year basis, industrial profits fell by a steep 13.1%.
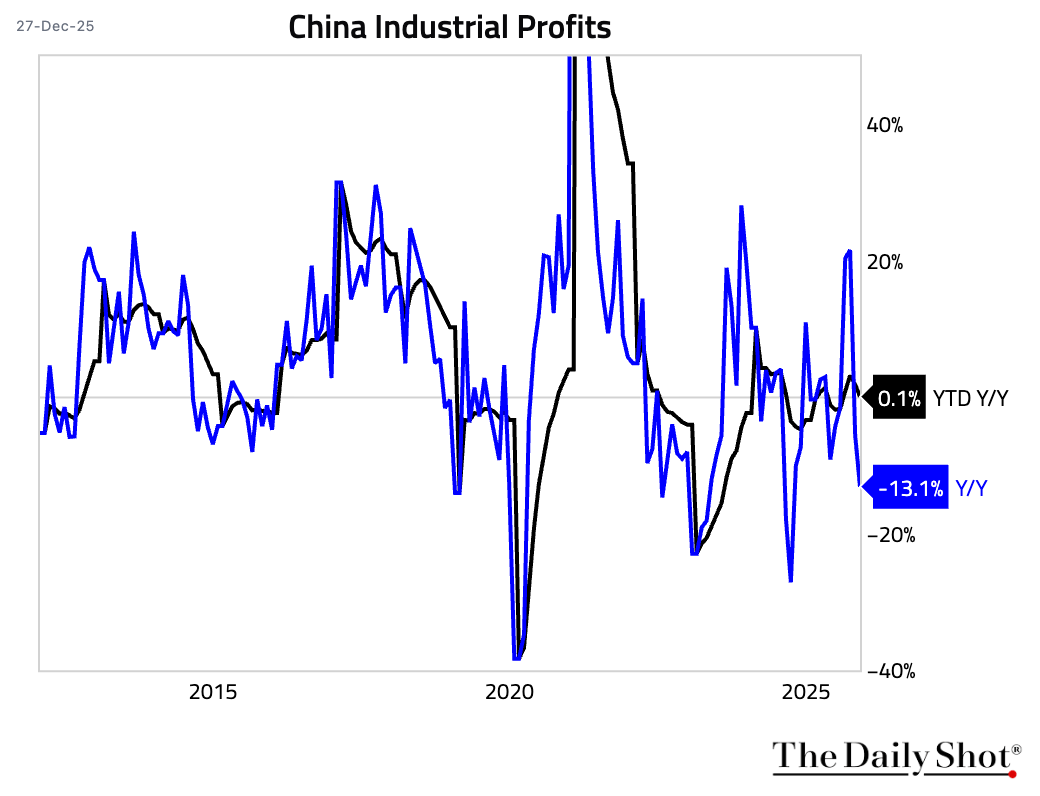
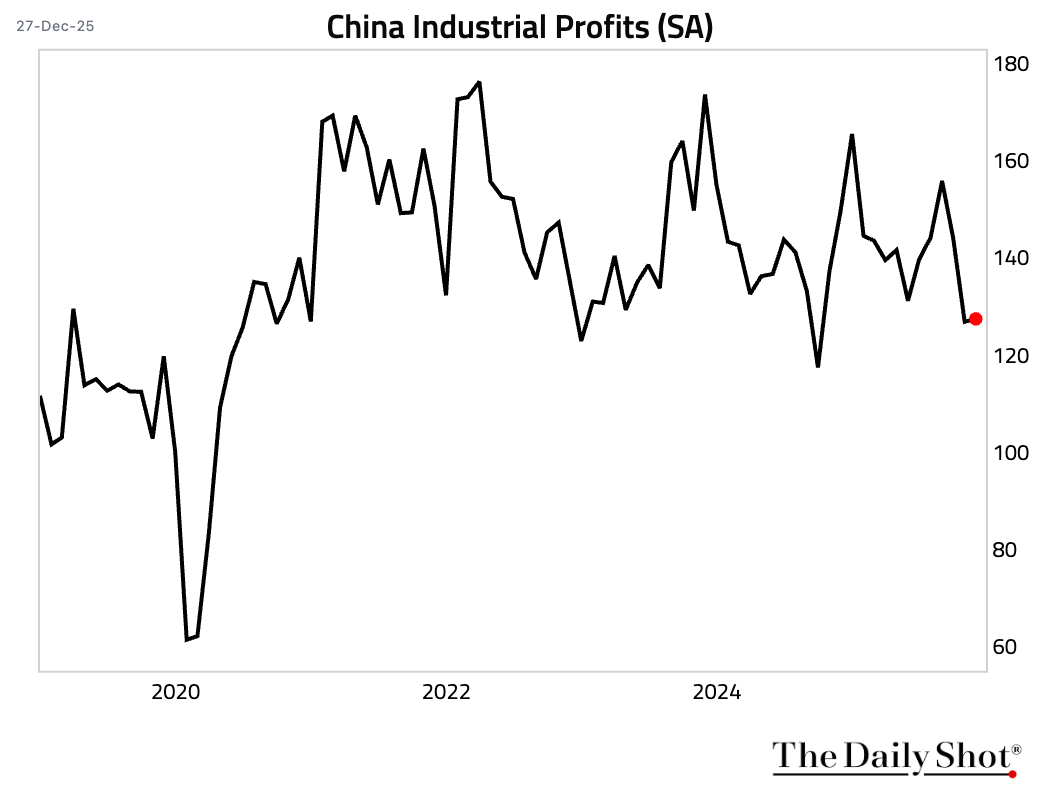
• The silver lining is that industrial profits showed signs of stabilization on a seasonally-adjusted month-over-month basis.
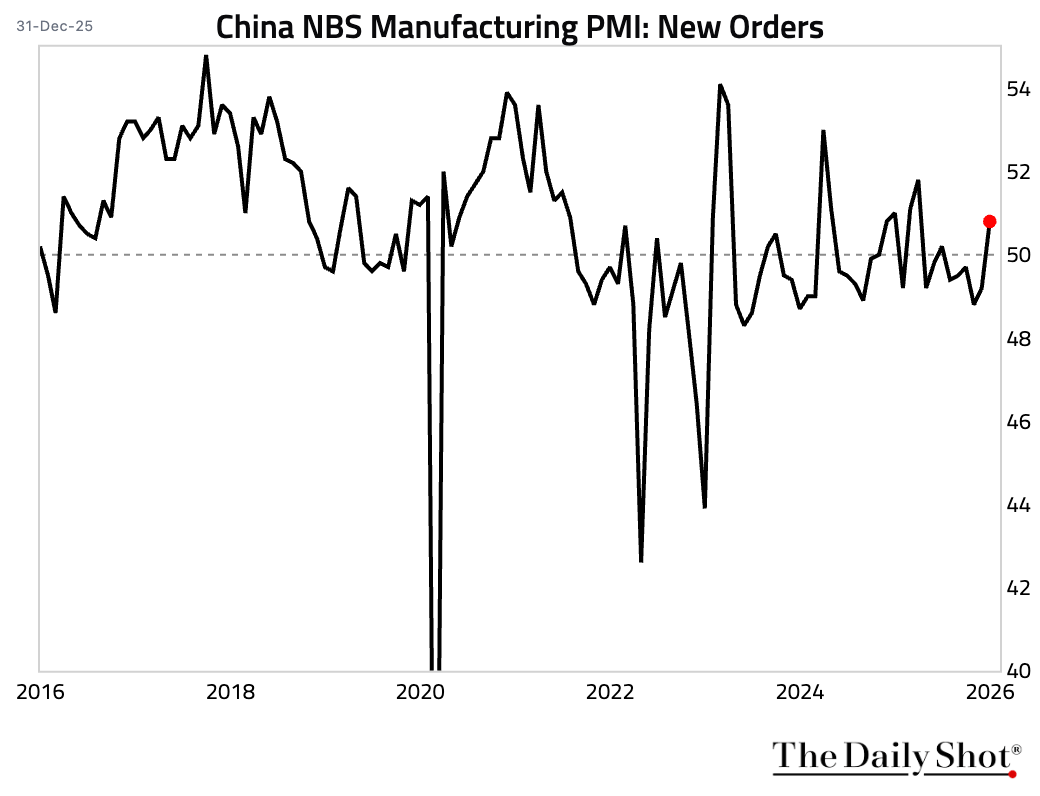
2 China’s official NBS Manufacturing PMI moved back into expansionary territory for the first time since March, …
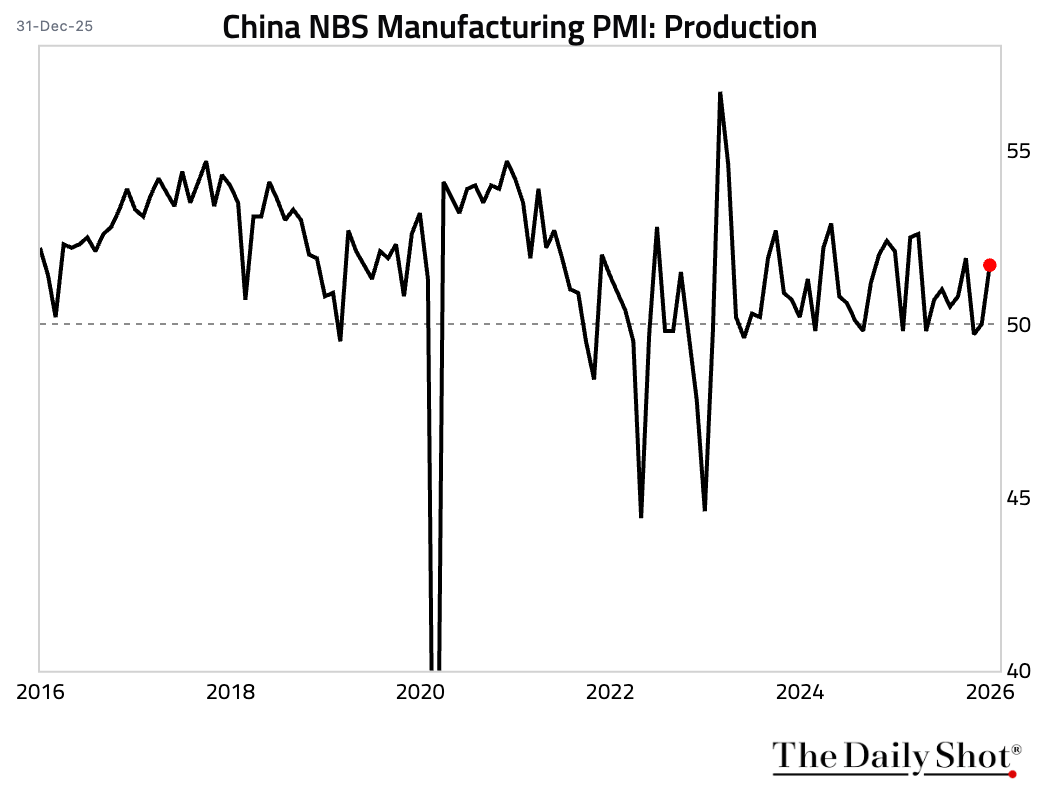
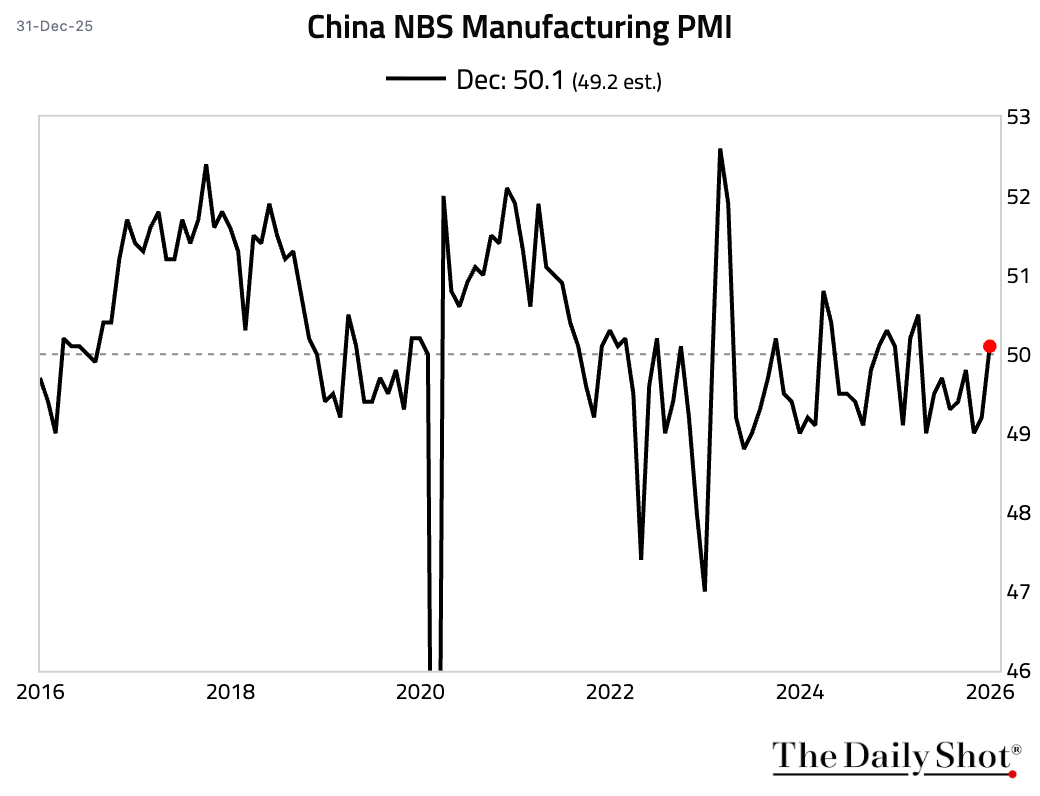 … driven by stronger output …
 … and new orders.
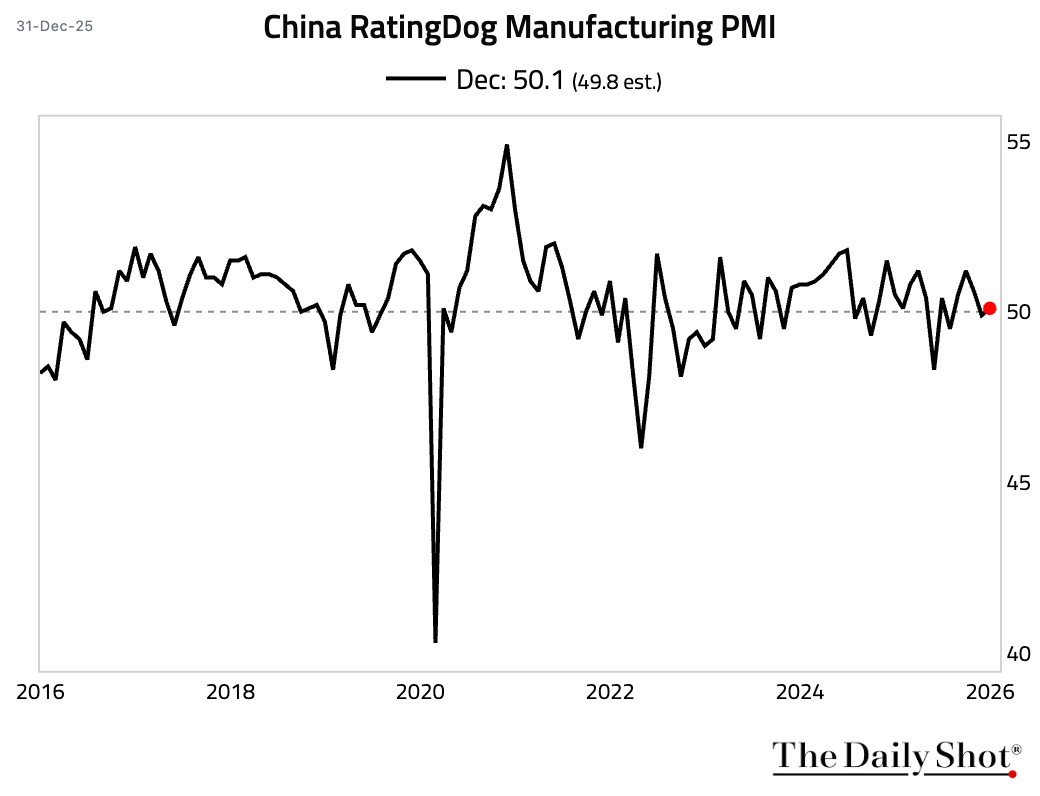
• The RatingDog (formerly Caixin) Manufacturing PMI corroborated the official report, indicating that China’s factory activity has returned to growth.
 Source: S&P Global PMI
3 China’s statistics bureau revised down its final 2024 GDP estimate to 134.8 trillion yuan ($19.23 trillion), trimming 101.8 billion yuan from the preliminary figure.
 Source: Reuters Read full article
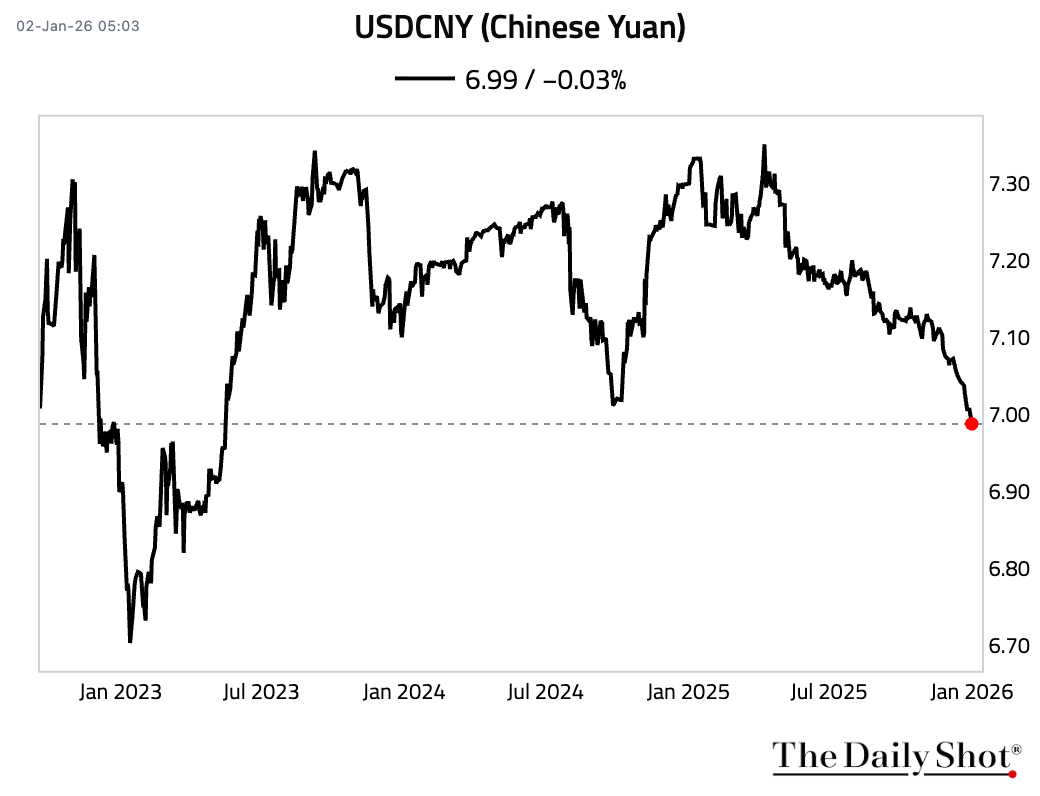
4 China’s onshore yuan strengthened past the key 7-per-dollar level for the first time since 2023.
Back to Index
India
Industrial production growth accelerated sharply in November, marking the fastest pace of expansion in 26 months. The recovery was broad-based, led by a surge in manufacturing.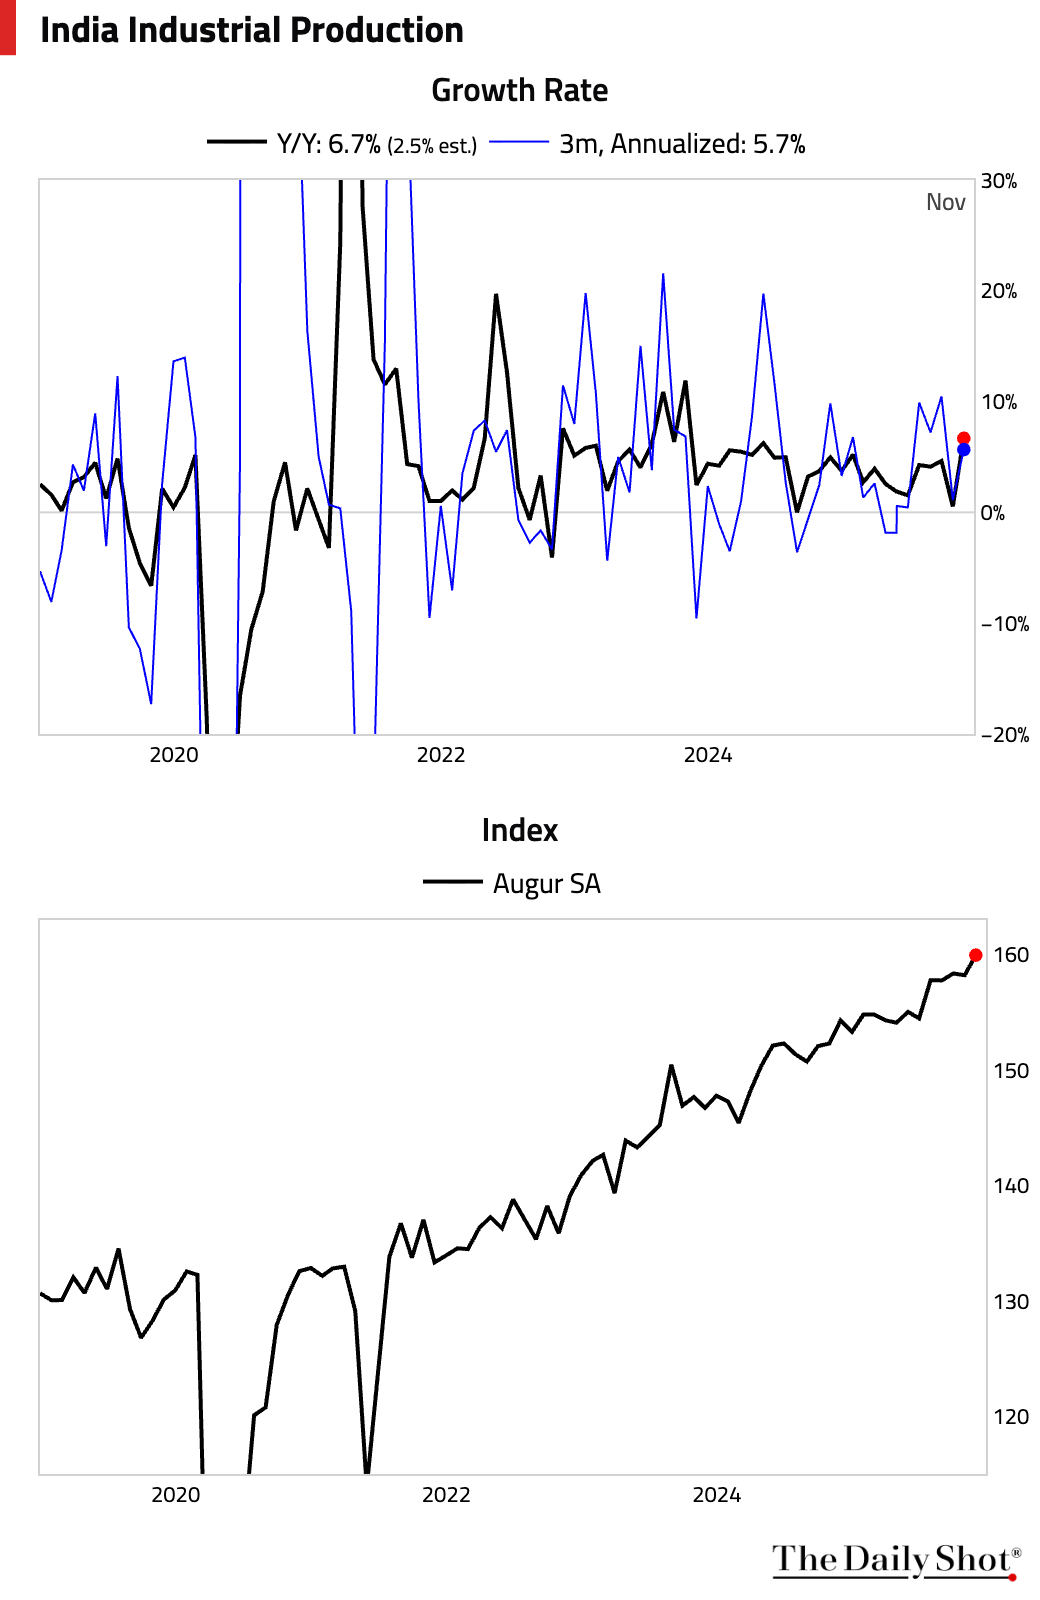
Back to Index
Emerging Markets
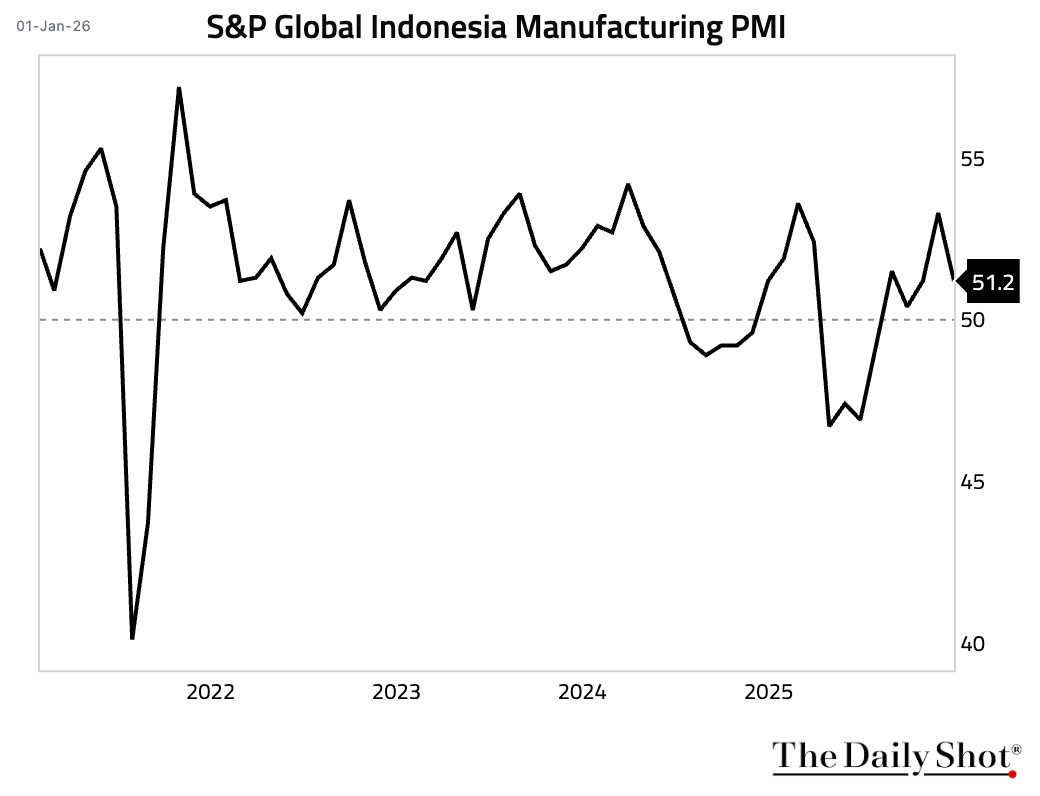
1 Here is a look at some EM Asia manufacturing PMI trends.
• Indonesia (softer expansion):
 Source: S&P Global PMI
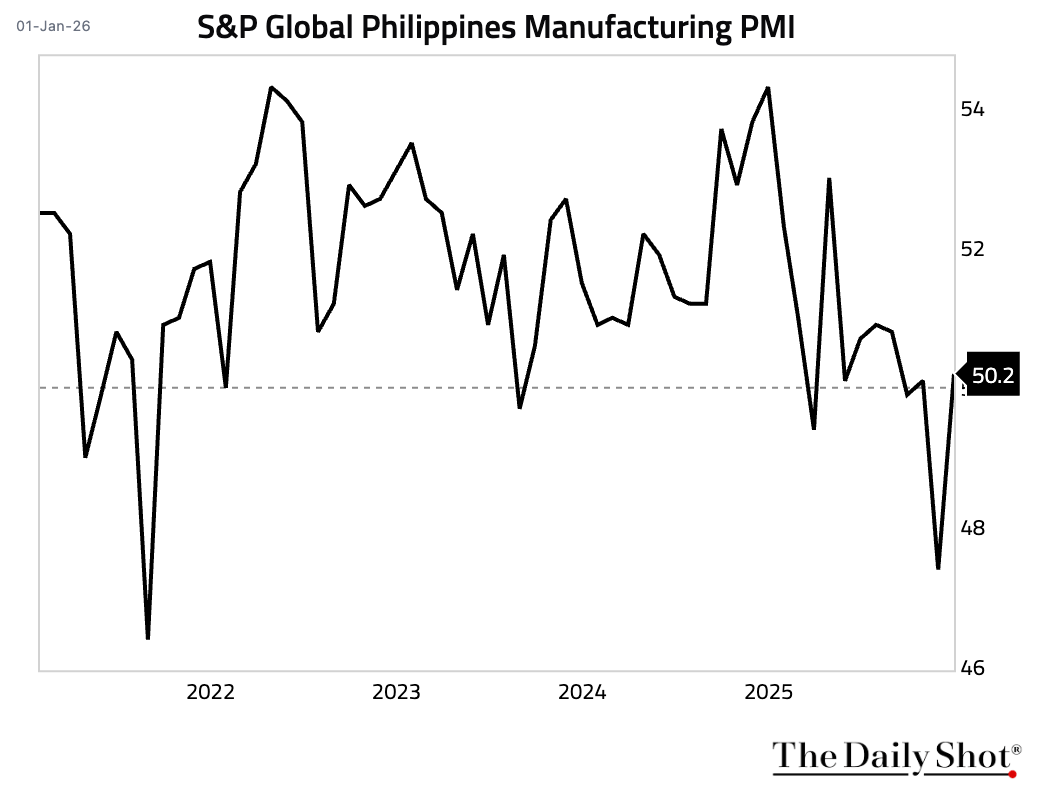
• The Philippines (returned to expansion):
 Source: S&P Global PMI
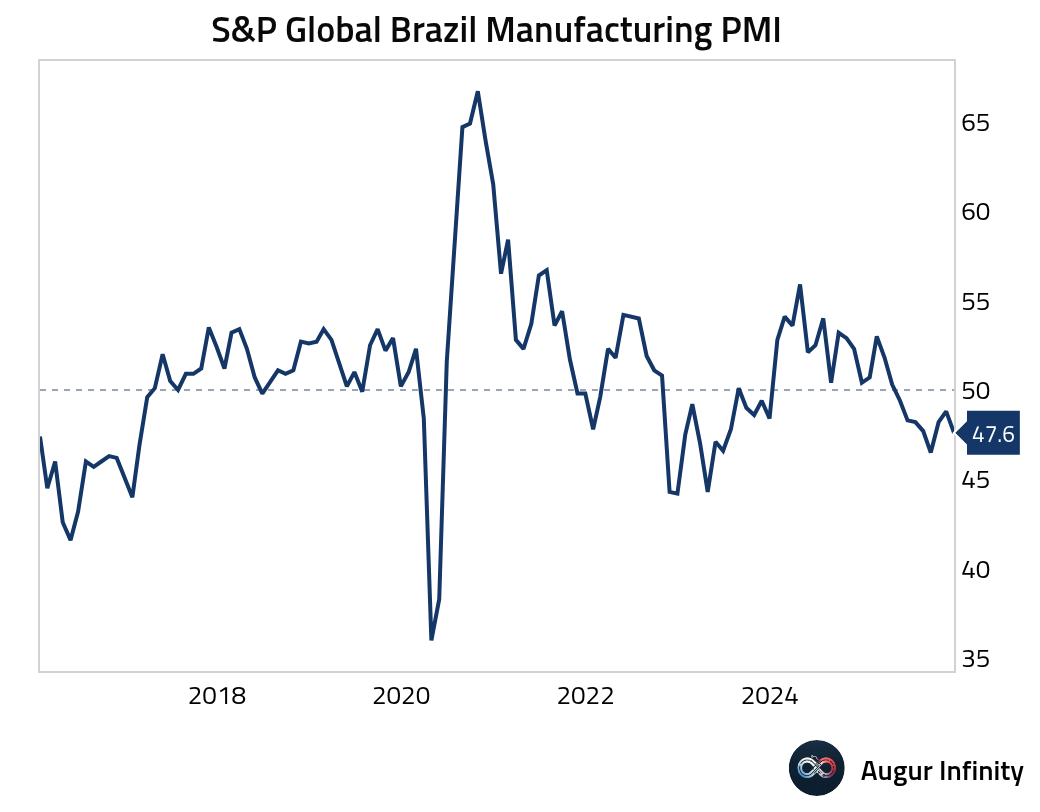
2 Brazil’s manufacturing sector contracted at a faster pace in December.
 Source: S&P Global PMI
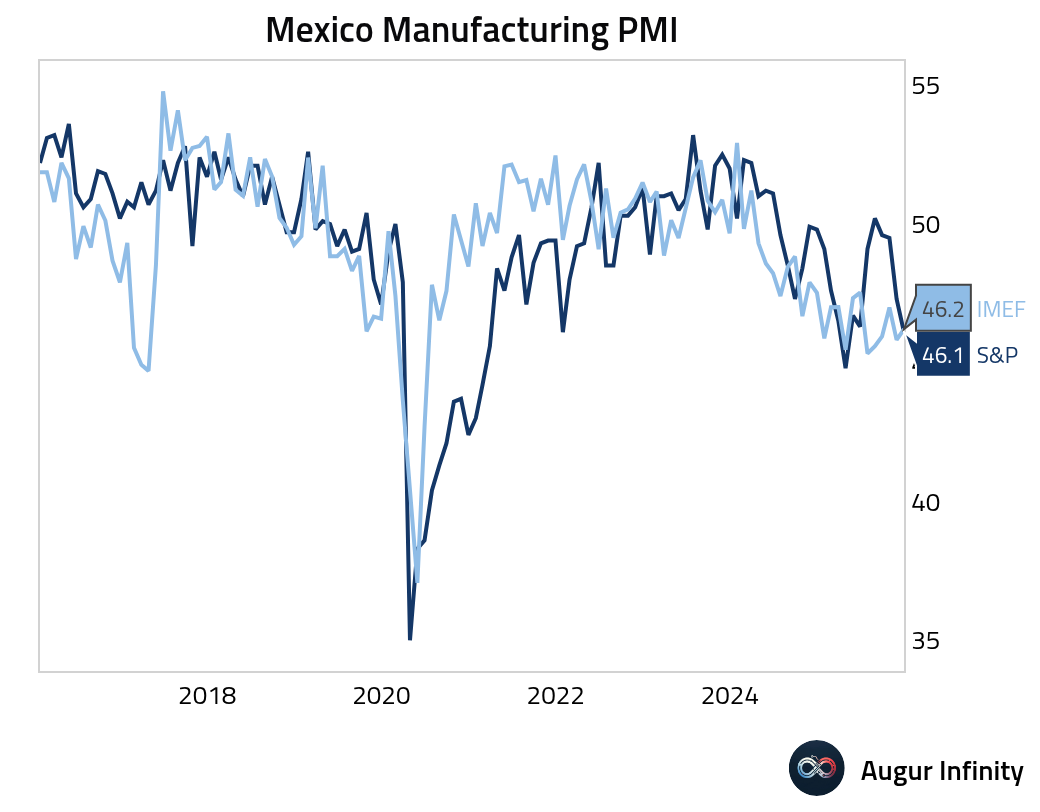
3 Business confidence in Mexico saw a marginal improvement in December.
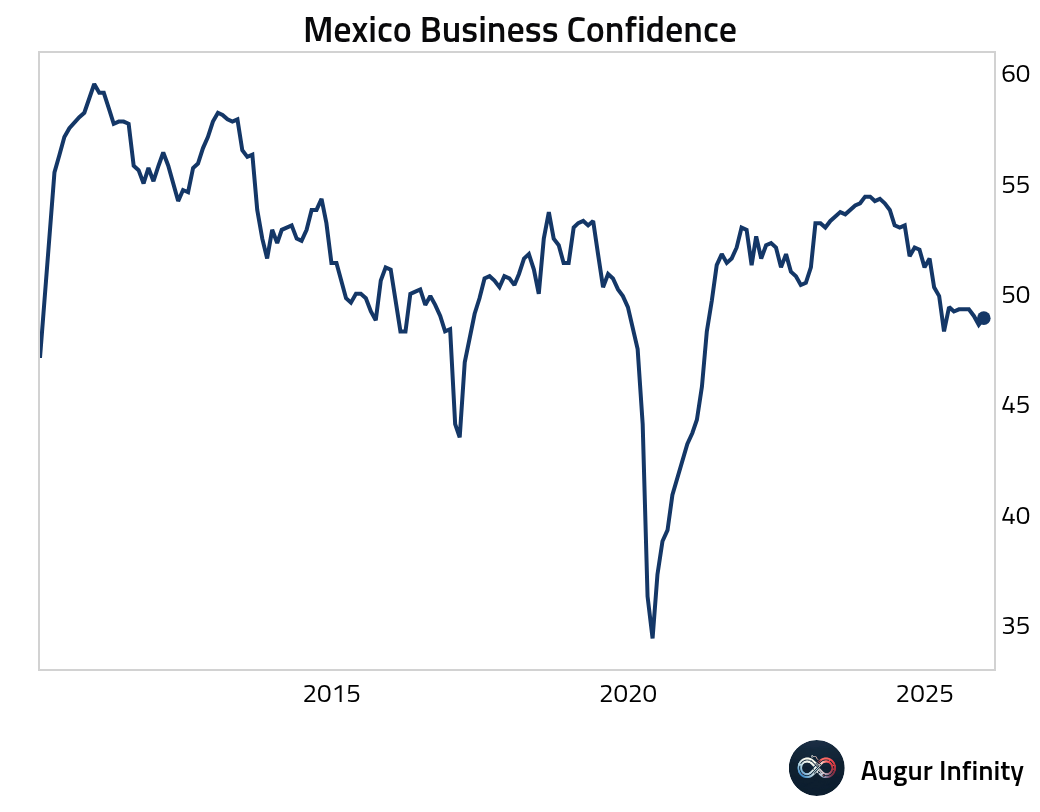
• Mexico’s manufacturing PMI indicated a faster rate of contraction.
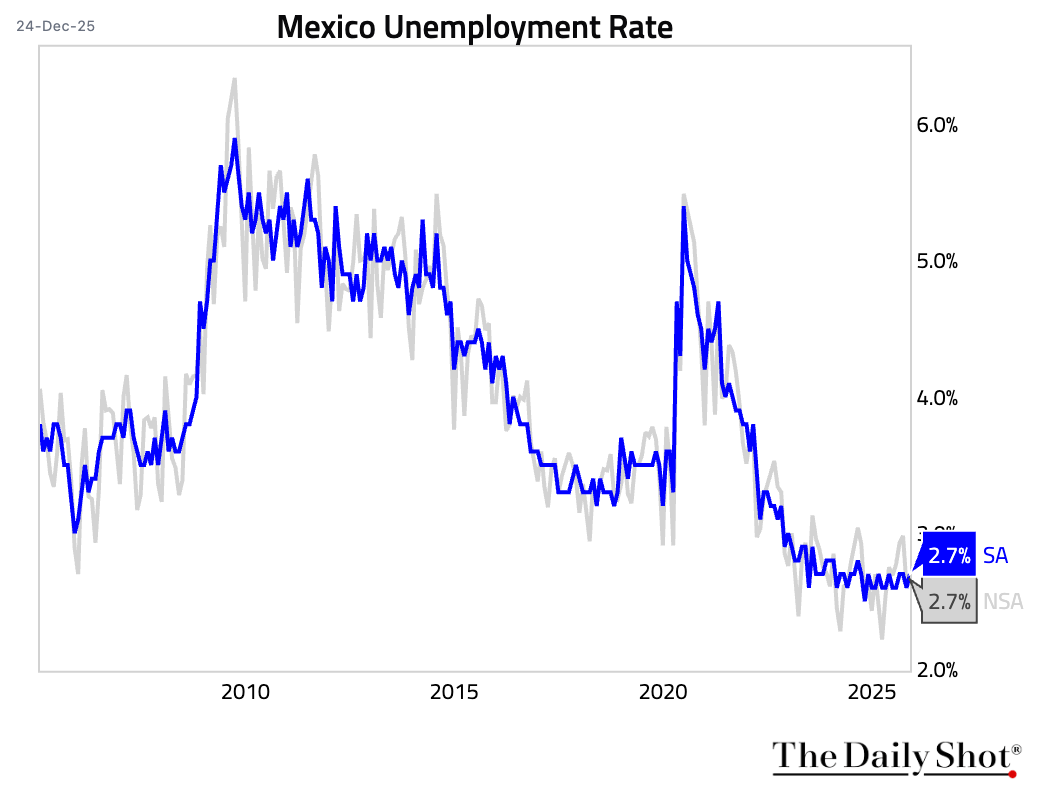
• Mexico’s unemployment rate remained stable.
Back to Index
Equities
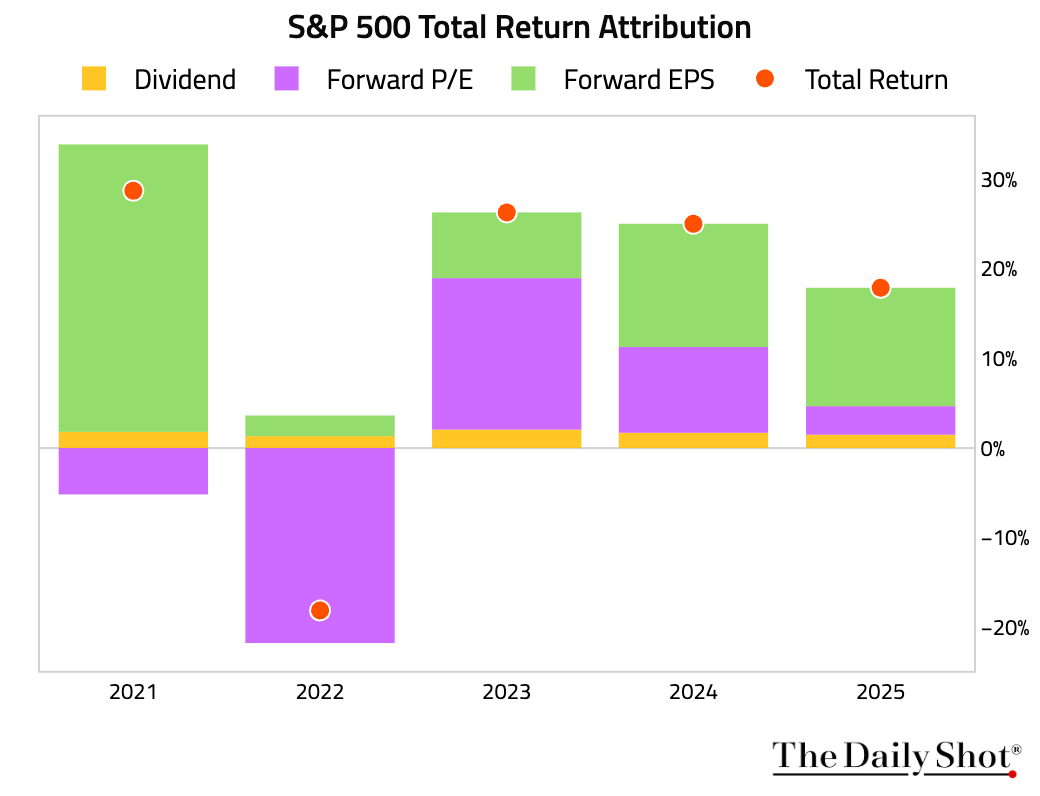
1 Here is a look at the performance attribution of the S&P 500.
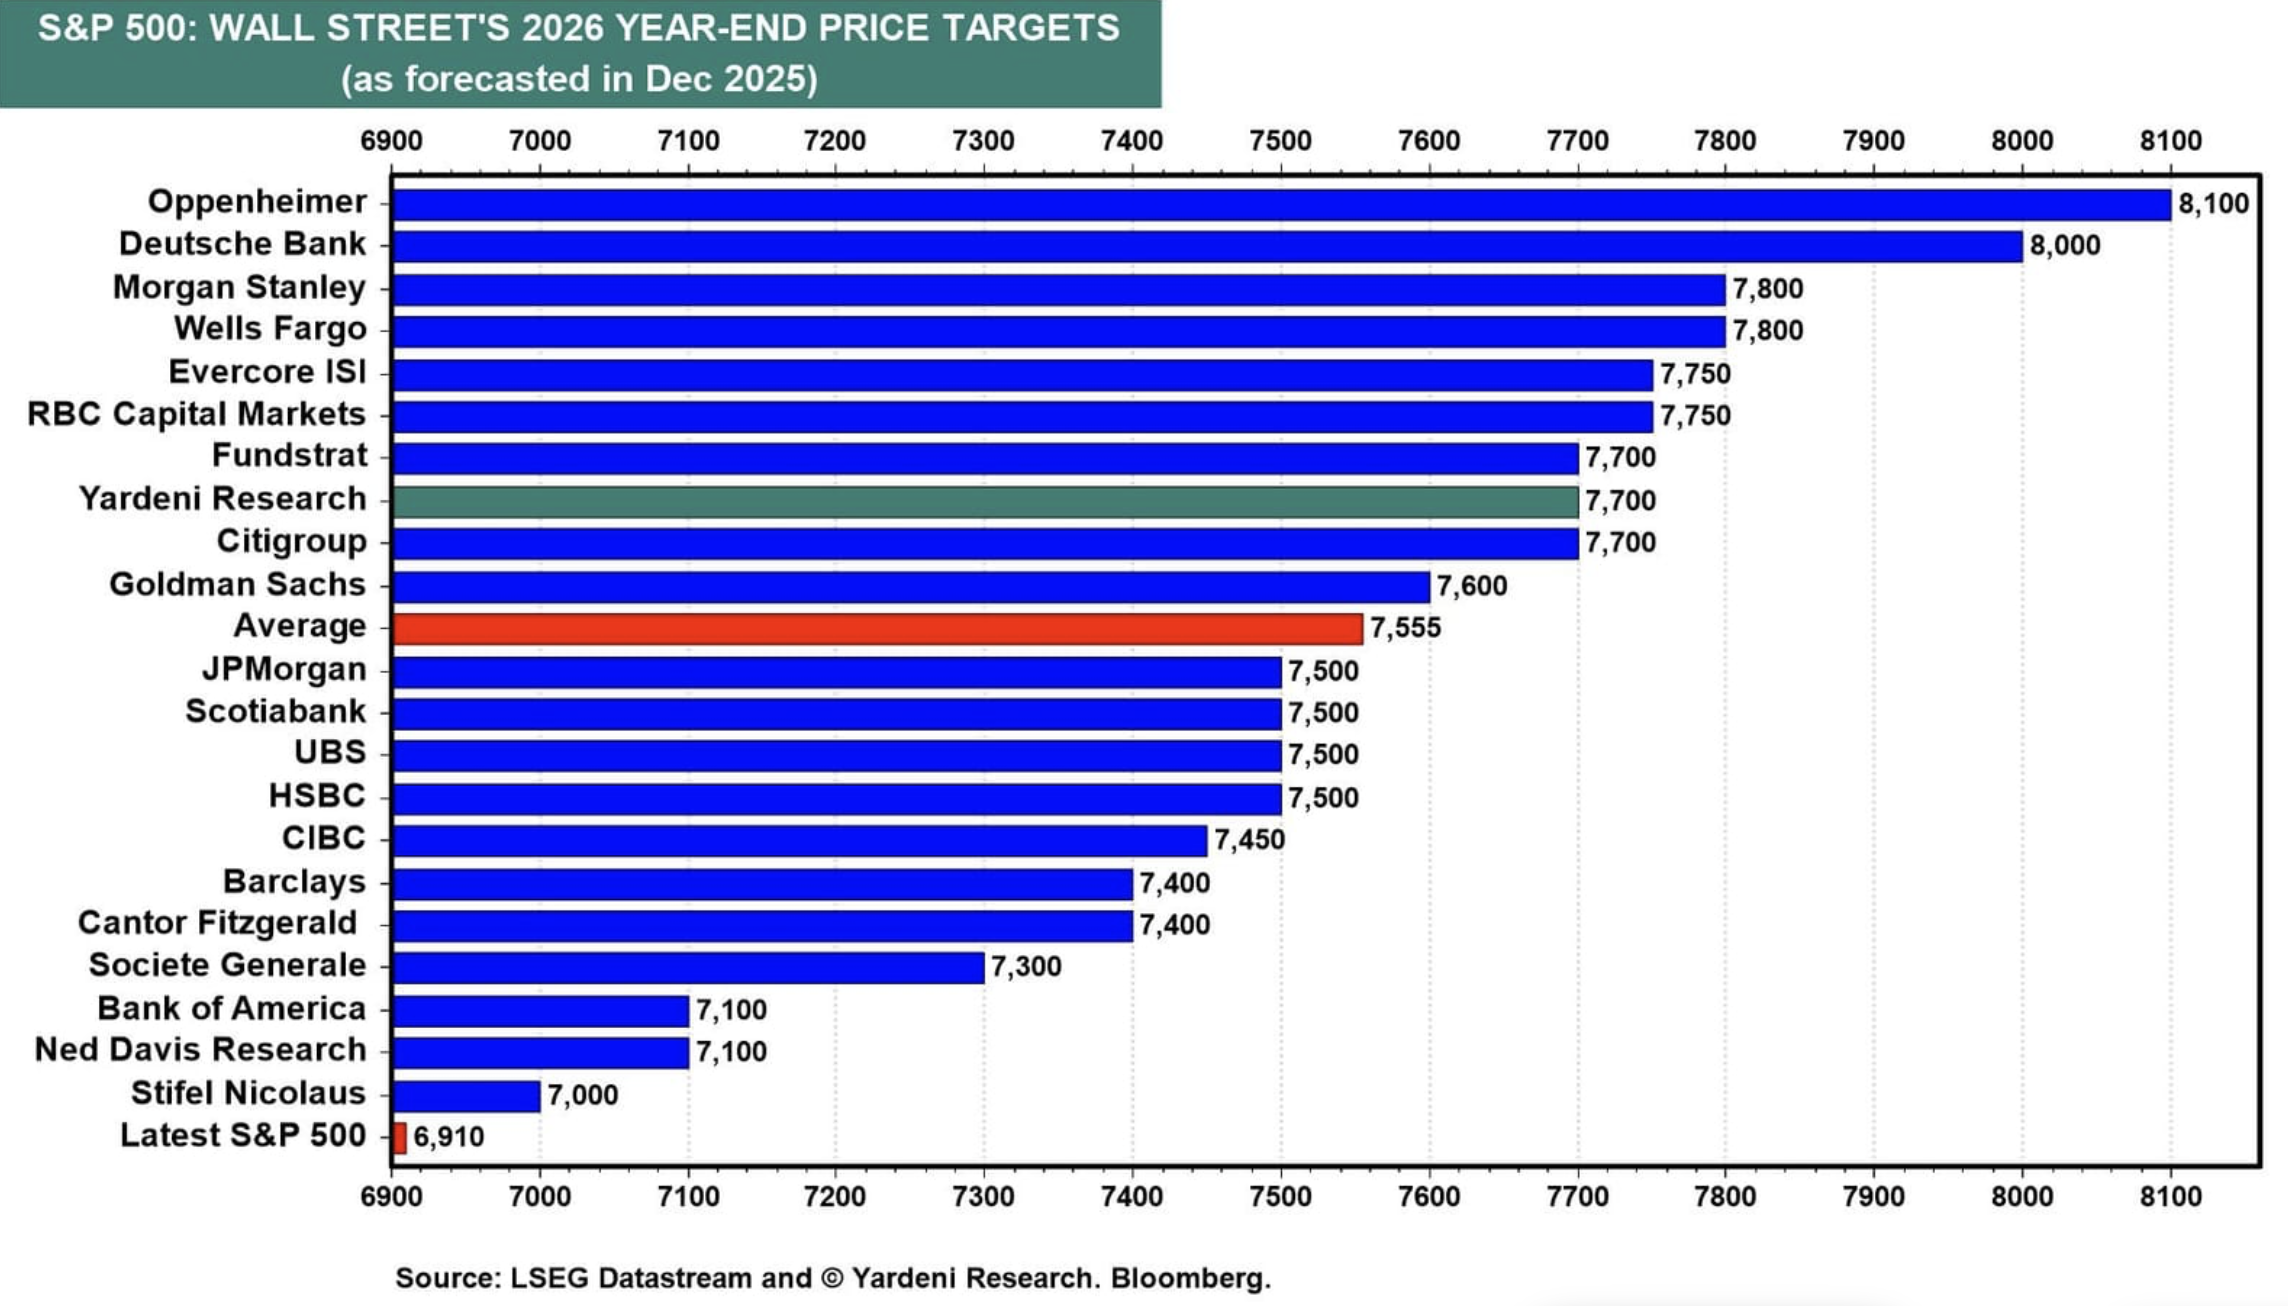
2 Here are Wall Street’s 2026 year-end price targets for the S&P 500 index.
 Source: Yardeni Research
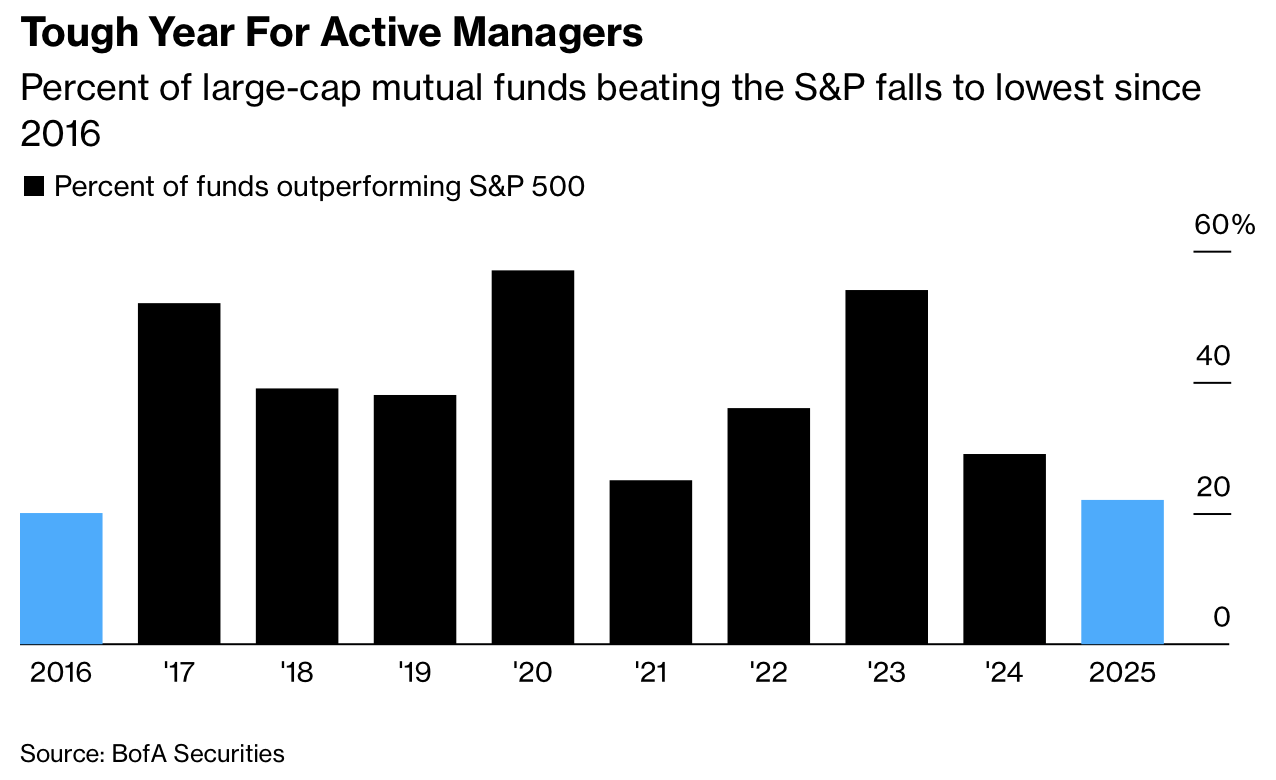
3 Only 22% of actively managed large-cap funds outperformed the S&P 500 in 2025, the lowest proportion since 2016.
 Source: @markets Read full article
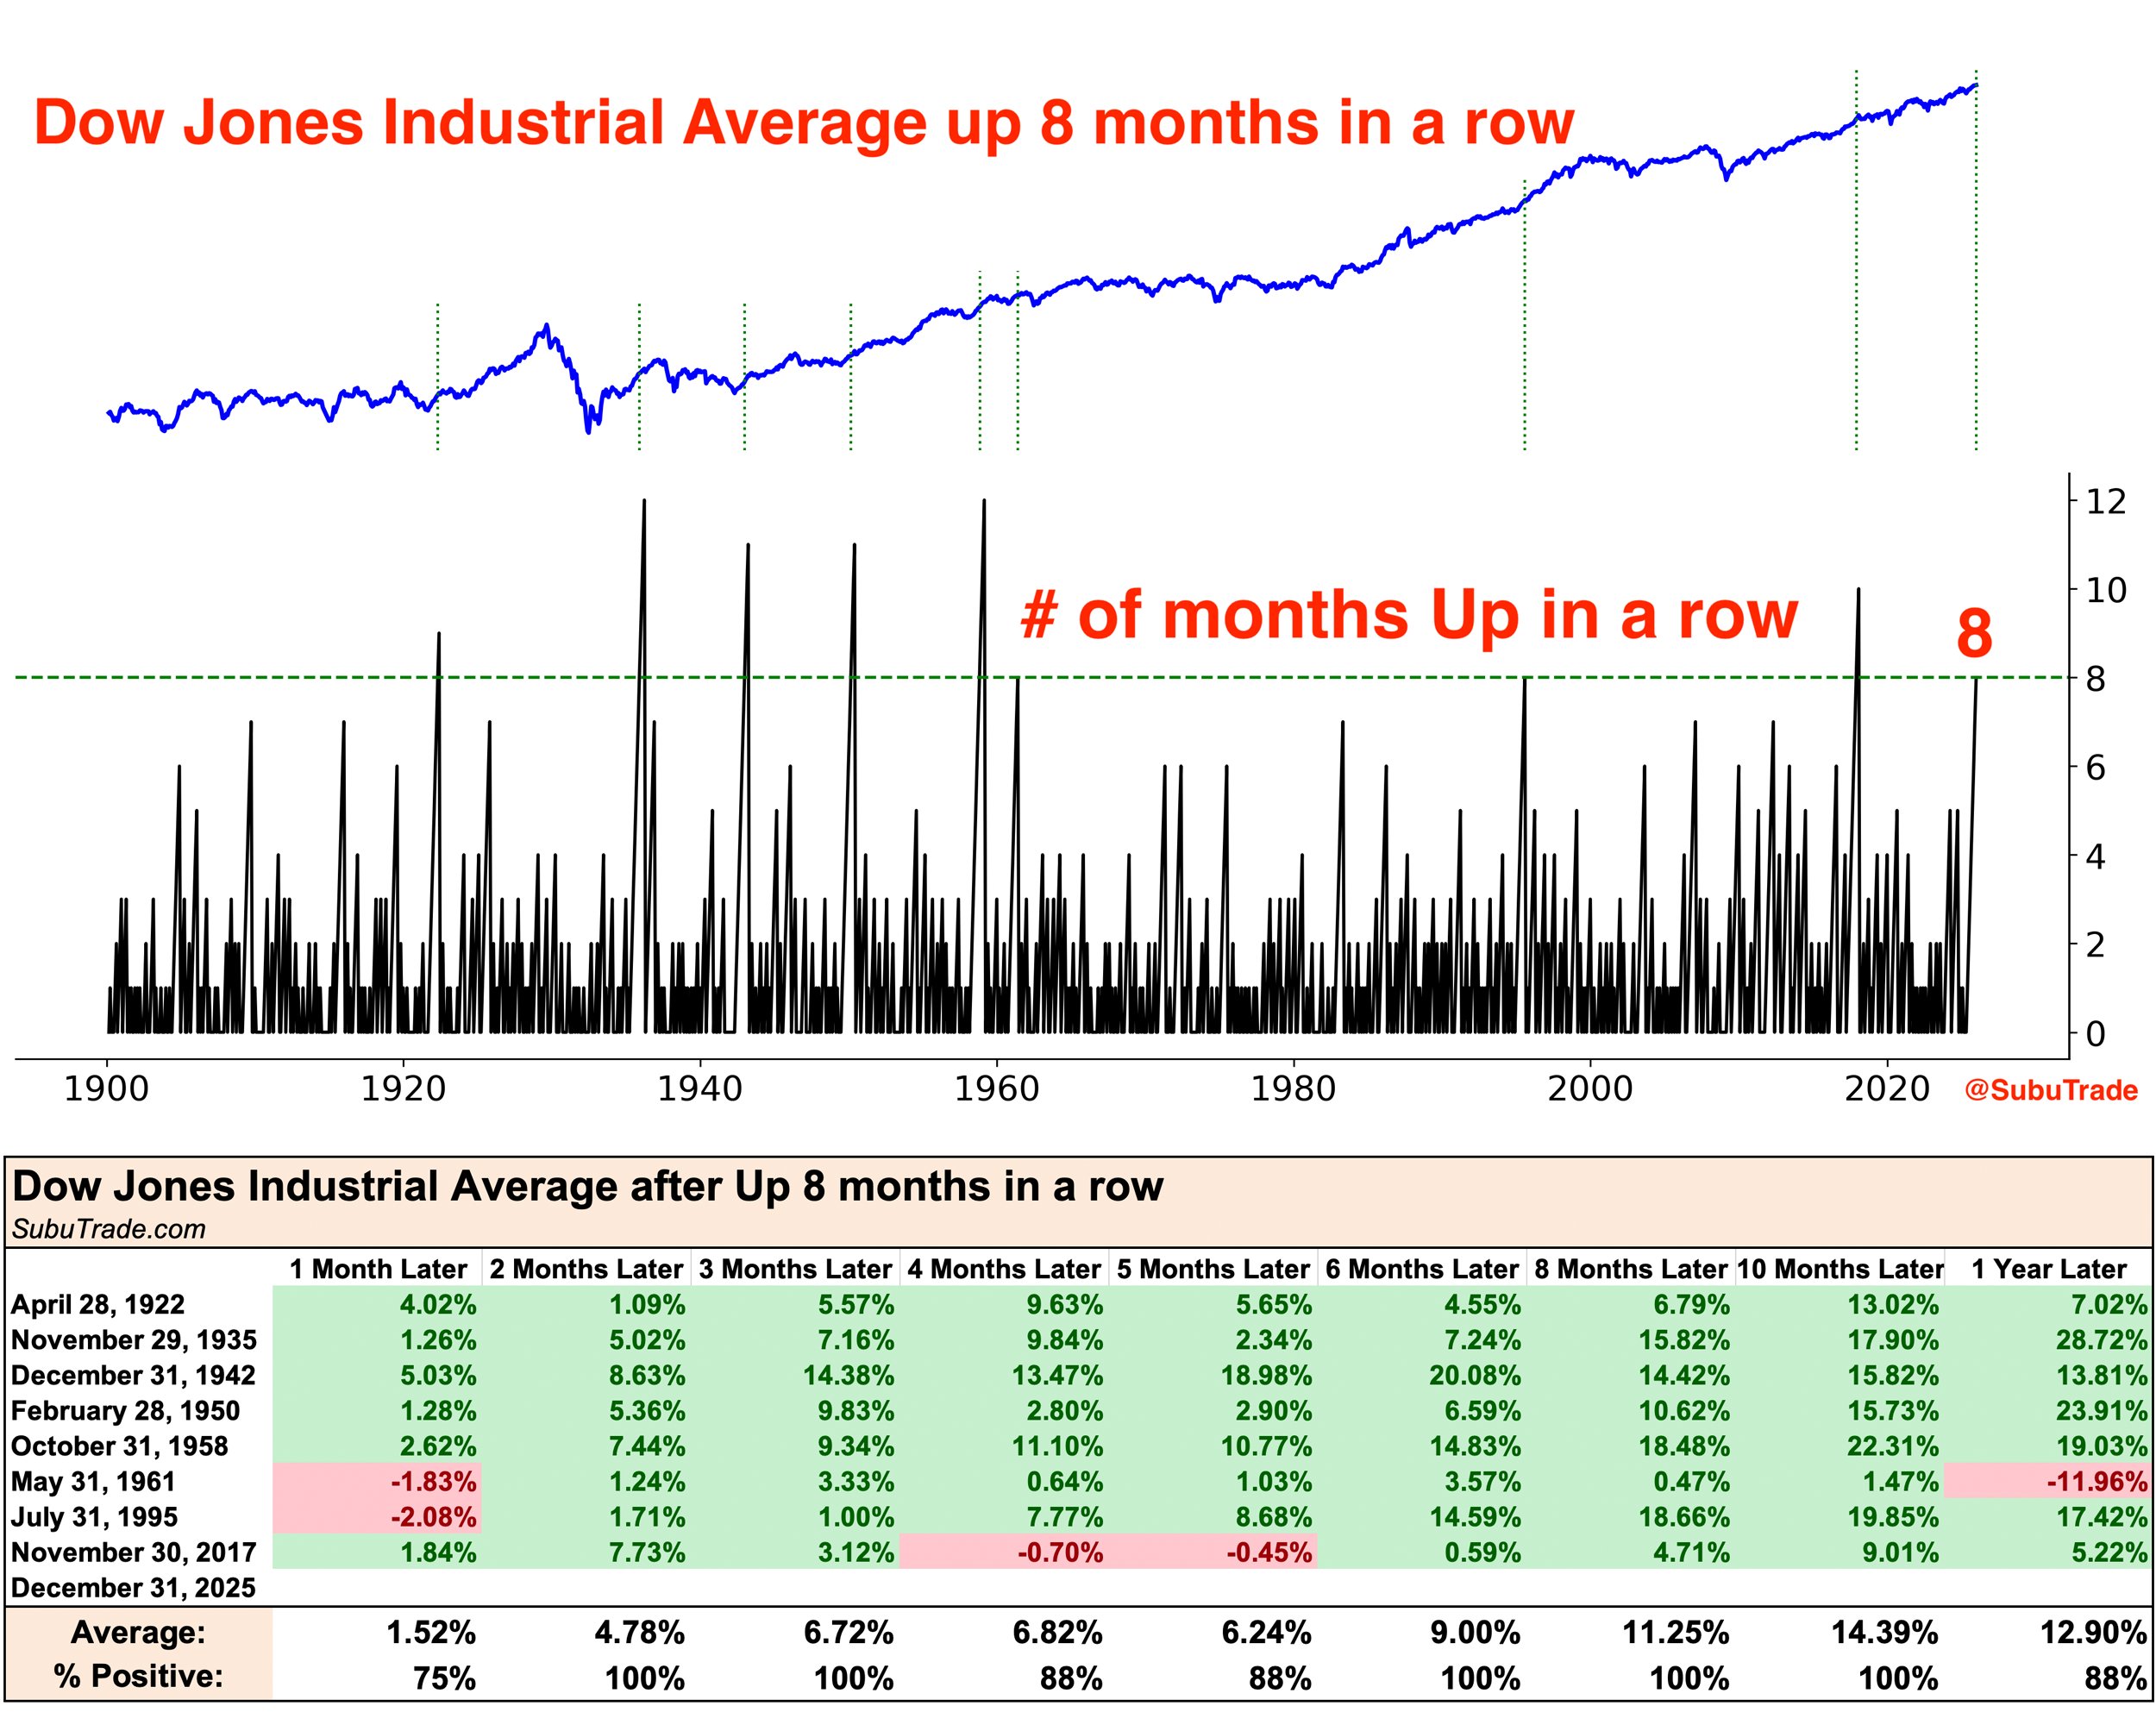
4 The Dow Jones Industrial Average rose for eight consecutive months, a streak that is typically a bullish signal.
 Source: @SubuTrade
Back to Index
Rates
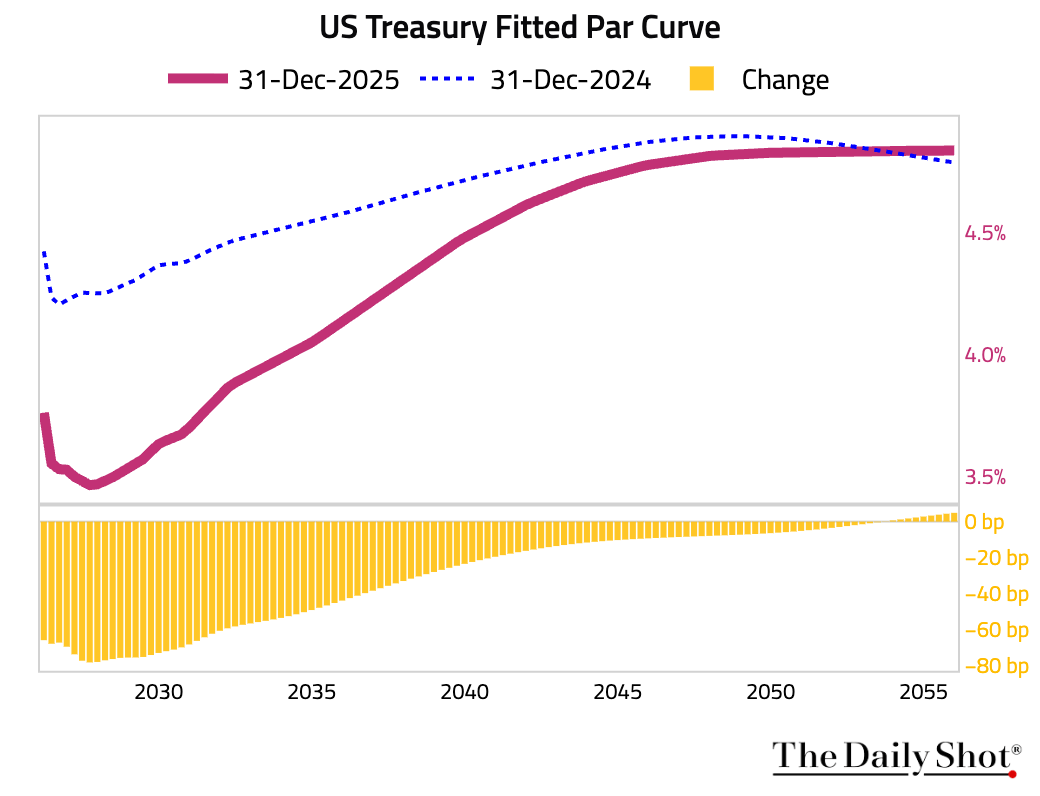
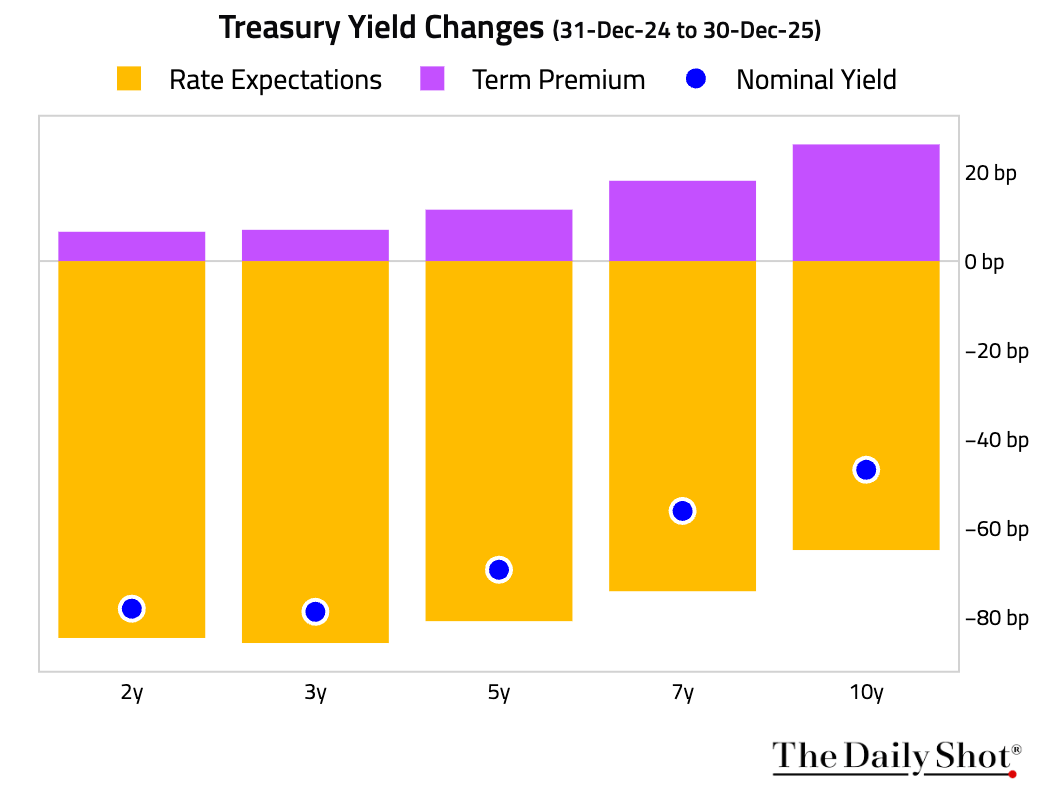
1 The US Treasury yield curve steepened in 2025, with front-end yields declining significantly, while 30-year yields edged up slightly.
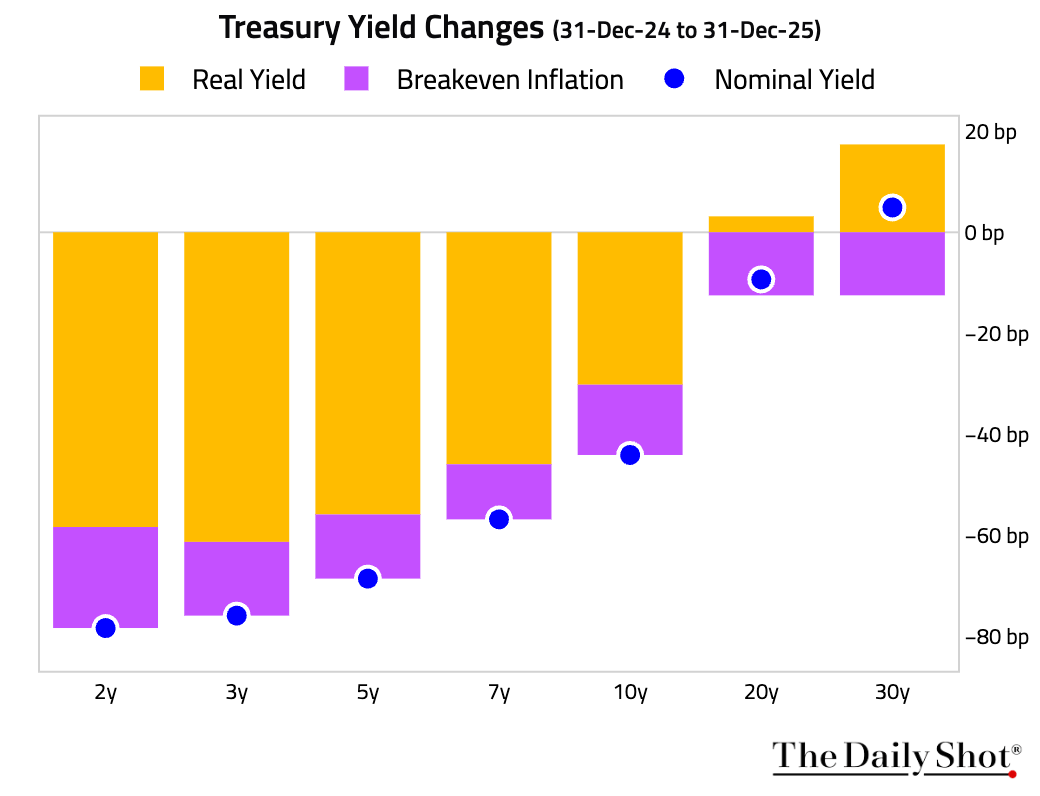
2 The next two charts show the attribution of changes in Treasury yields last year.
• Breakdown by real yield and breakeven inflation:
• Breakdown by rate expectations and term premium:
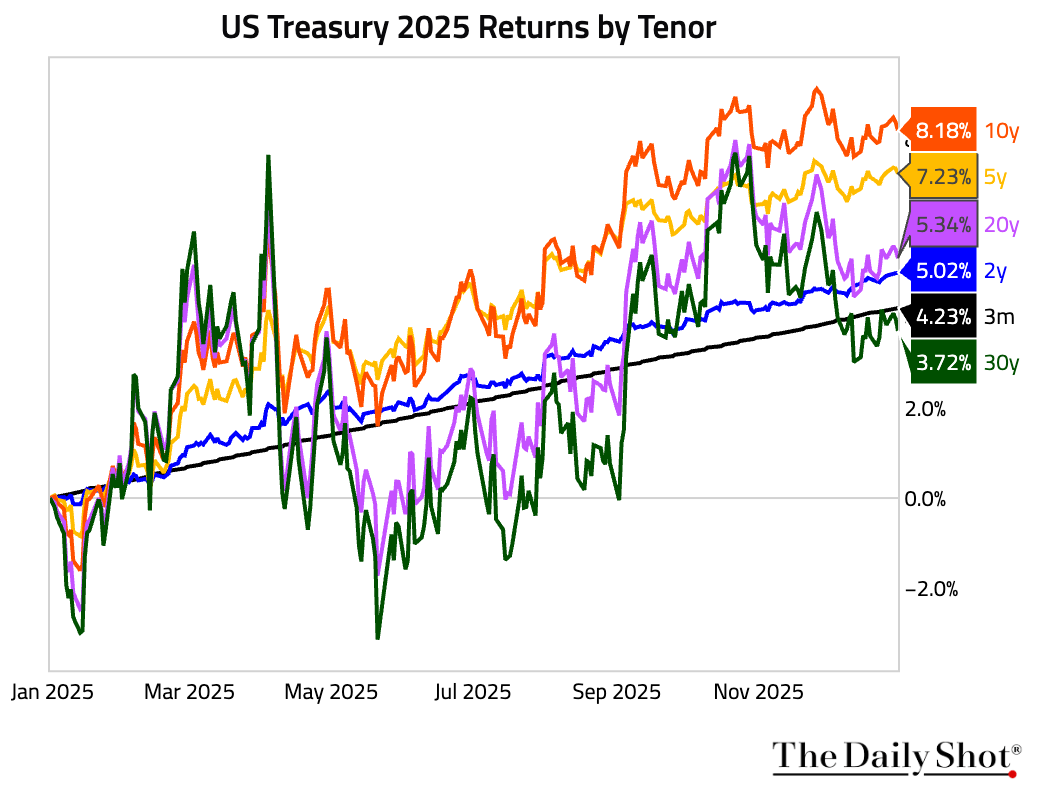
3 Among key benchmark maturities, the 10-year point delivered the best return in 2025.
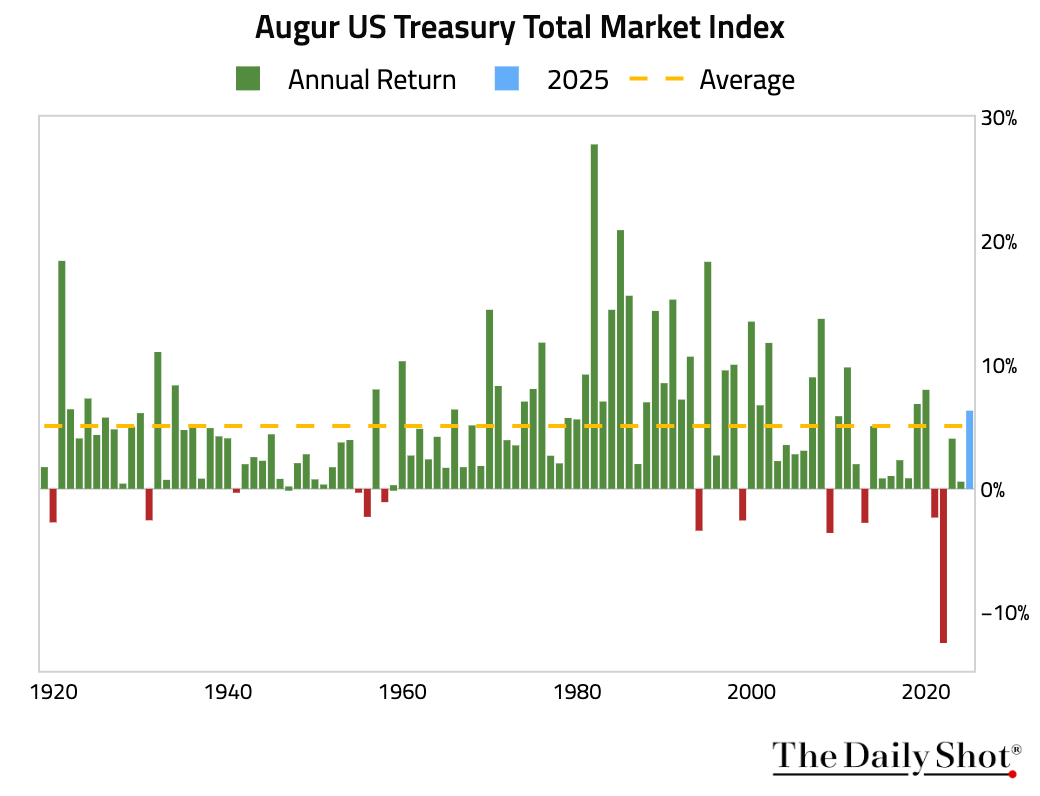
4 The total return of all outstanding US Treasuries last year was the highest in five years.
Back to Index
Energy
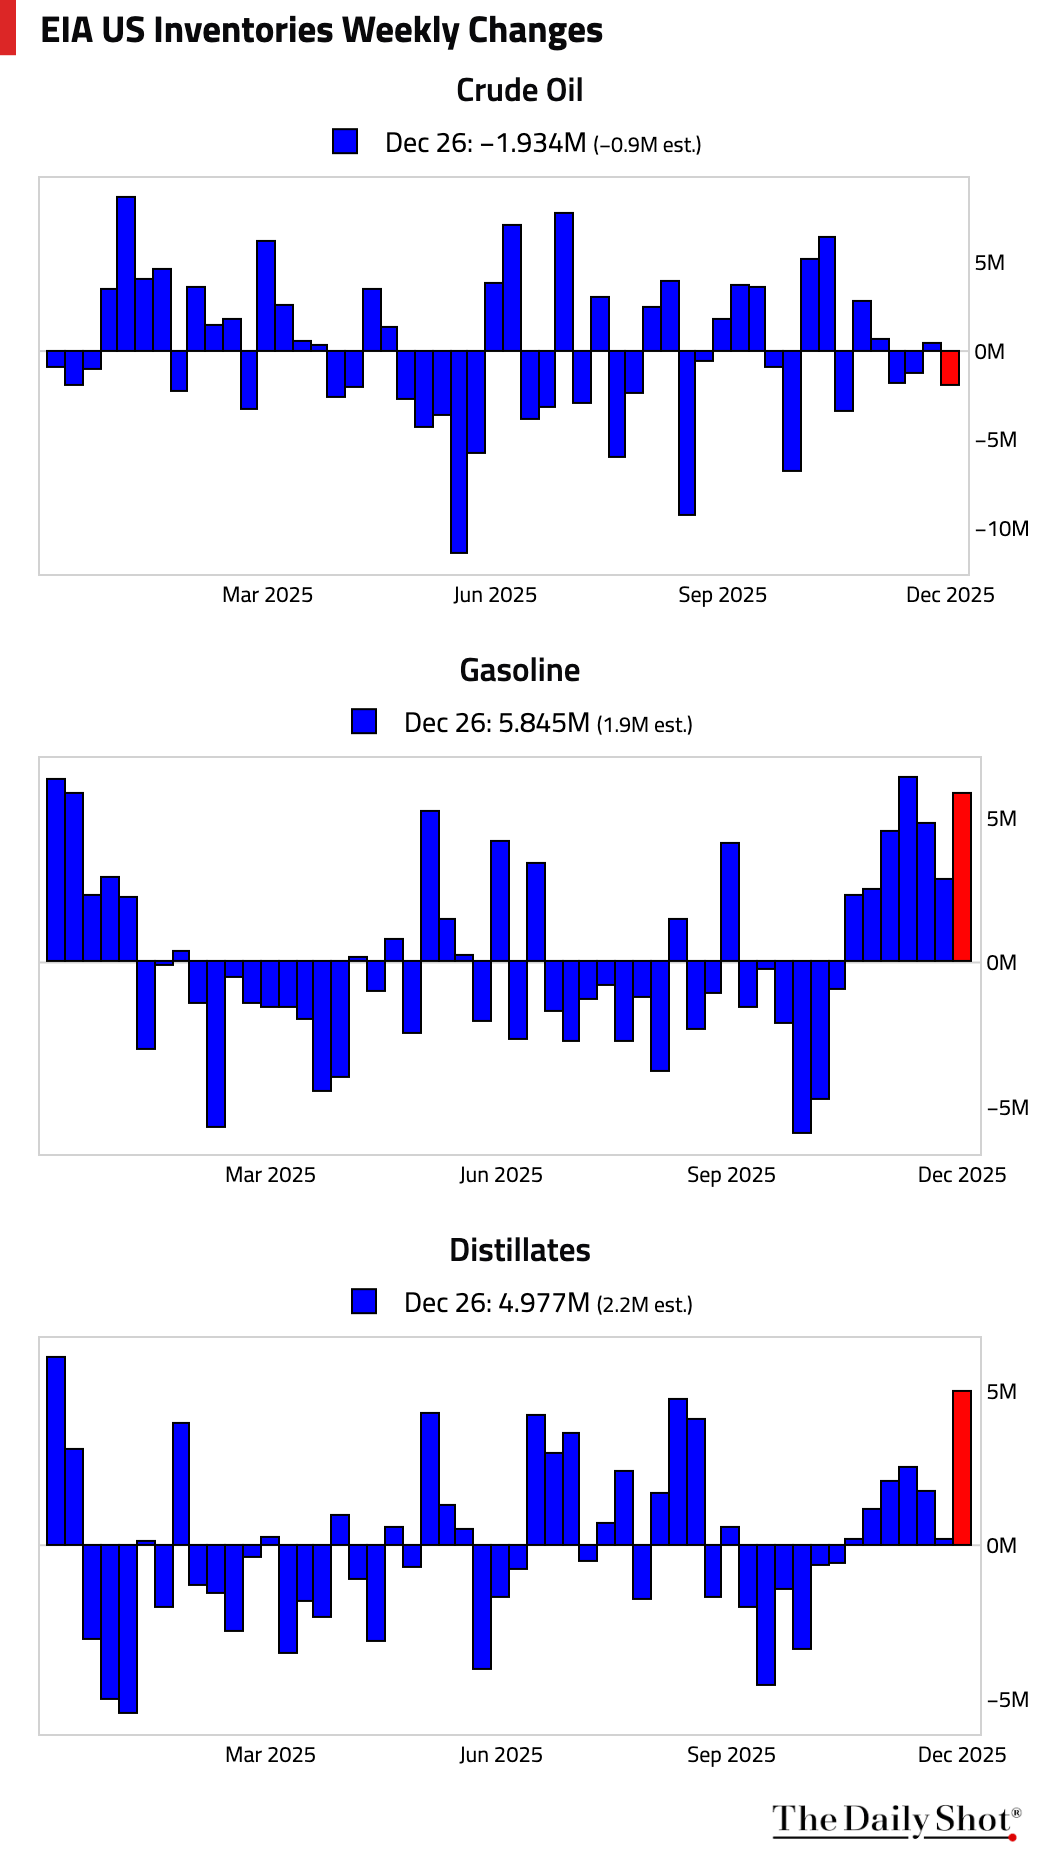
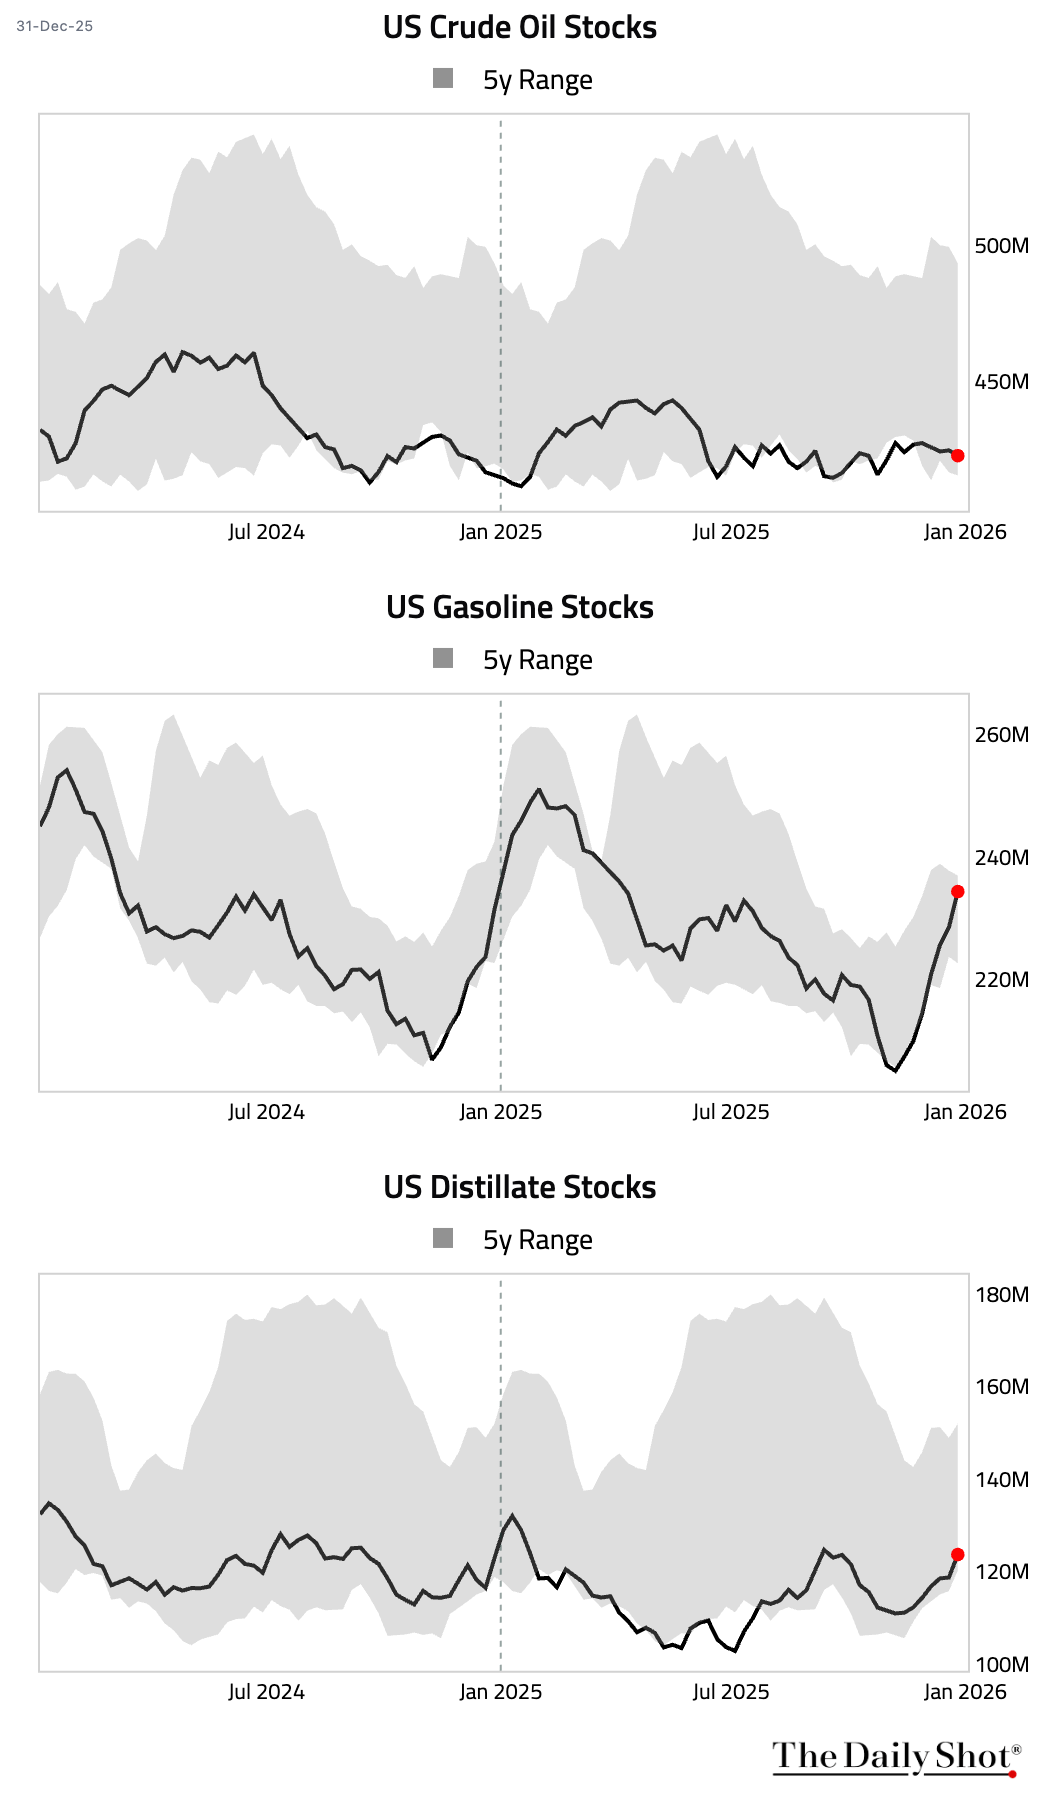
1 US commercial crude oil inventories drew down more than expected. In contrast, both gasoline and distillate inventories posted larger-than-expected builds.
– Weekly changes:
– Levels:
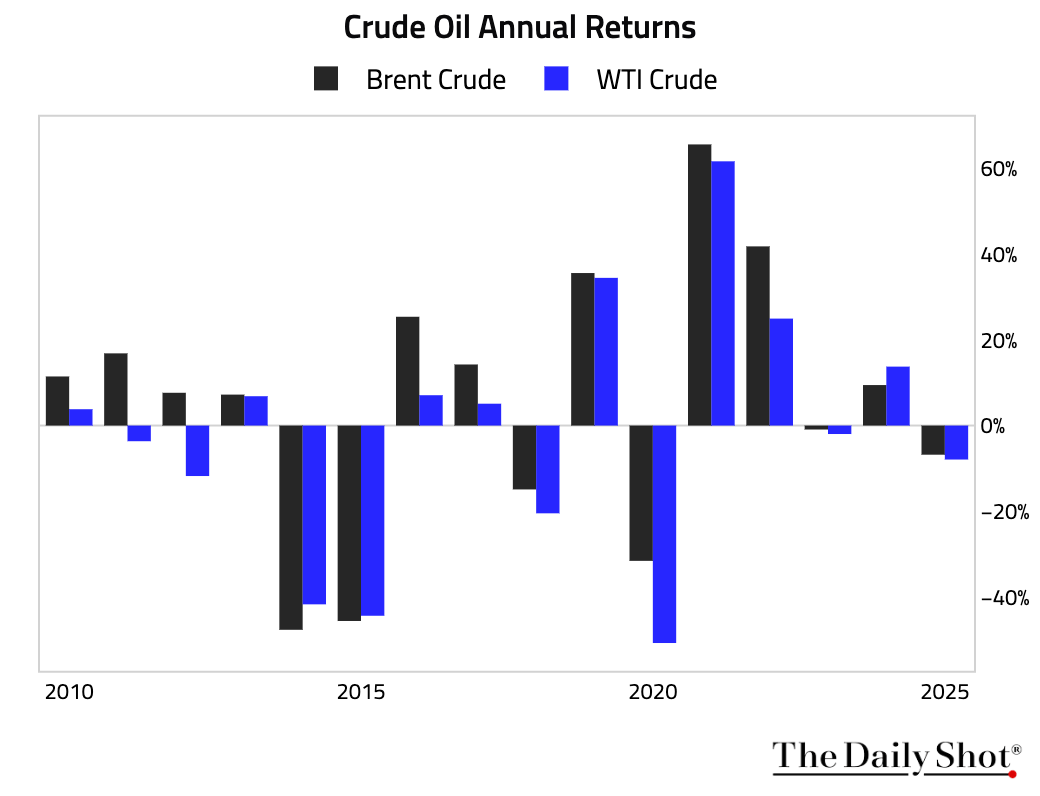
2 Oil prices had their steepest annual decline last year since 2020, driven by a growing global supply surplus.
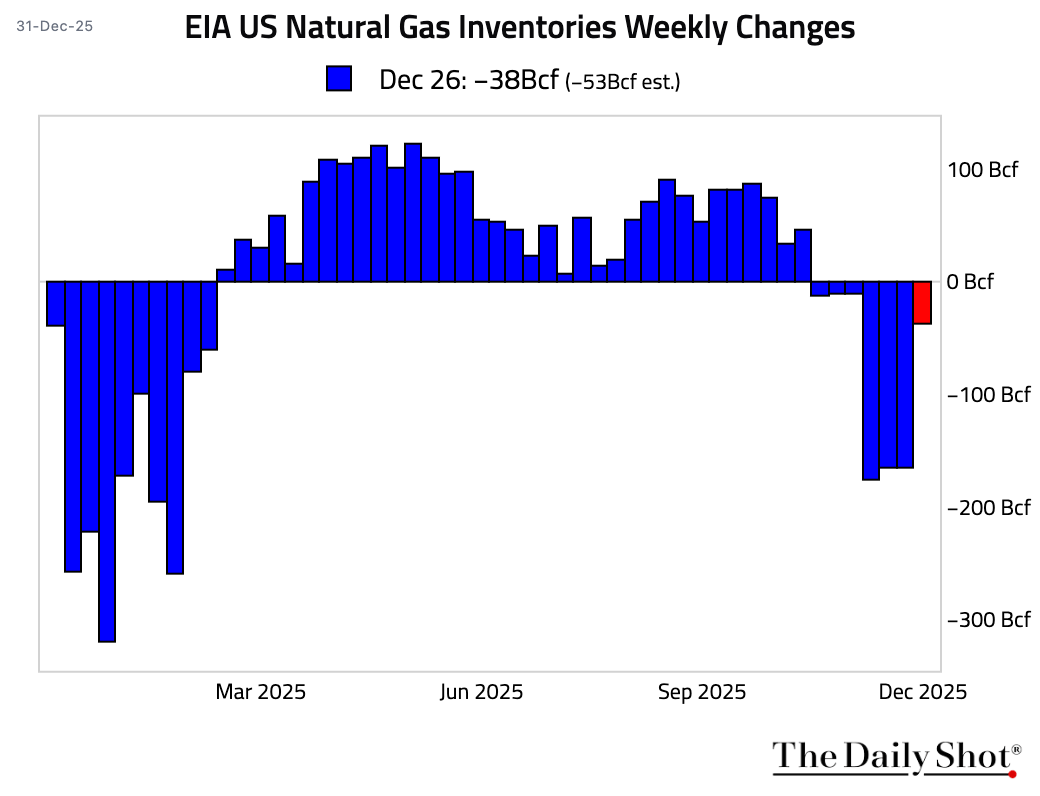
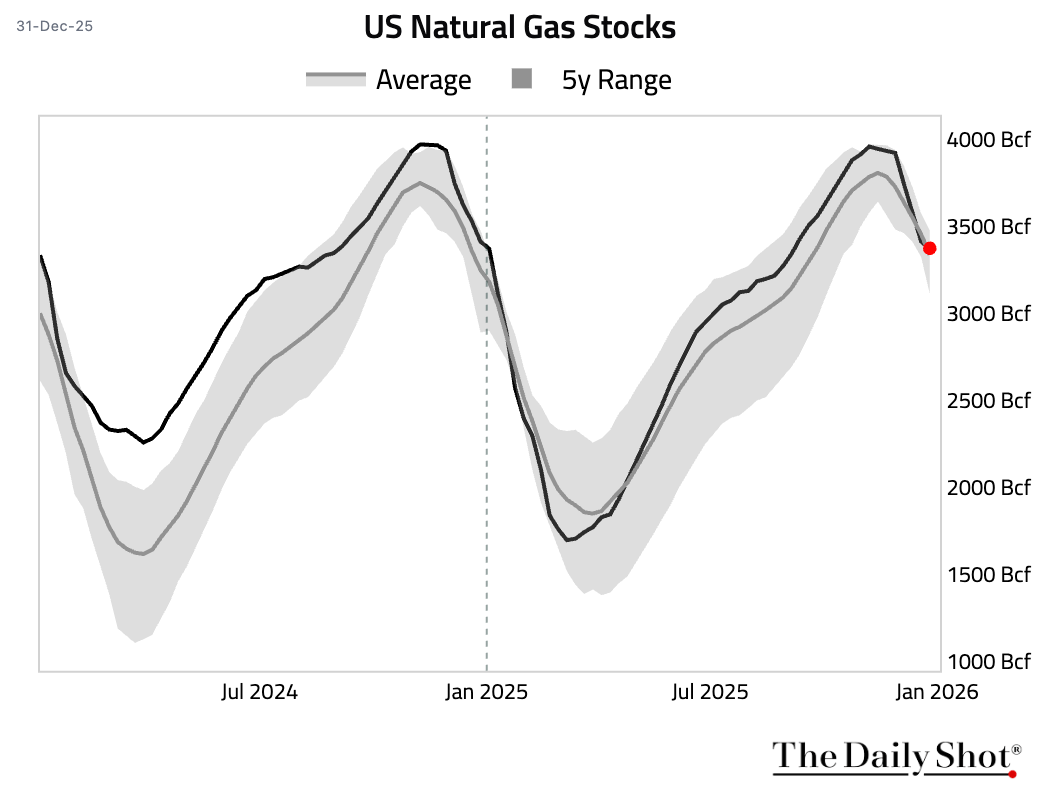
3 Natural gas inventories drew down by less than expected last week.
Back to Index
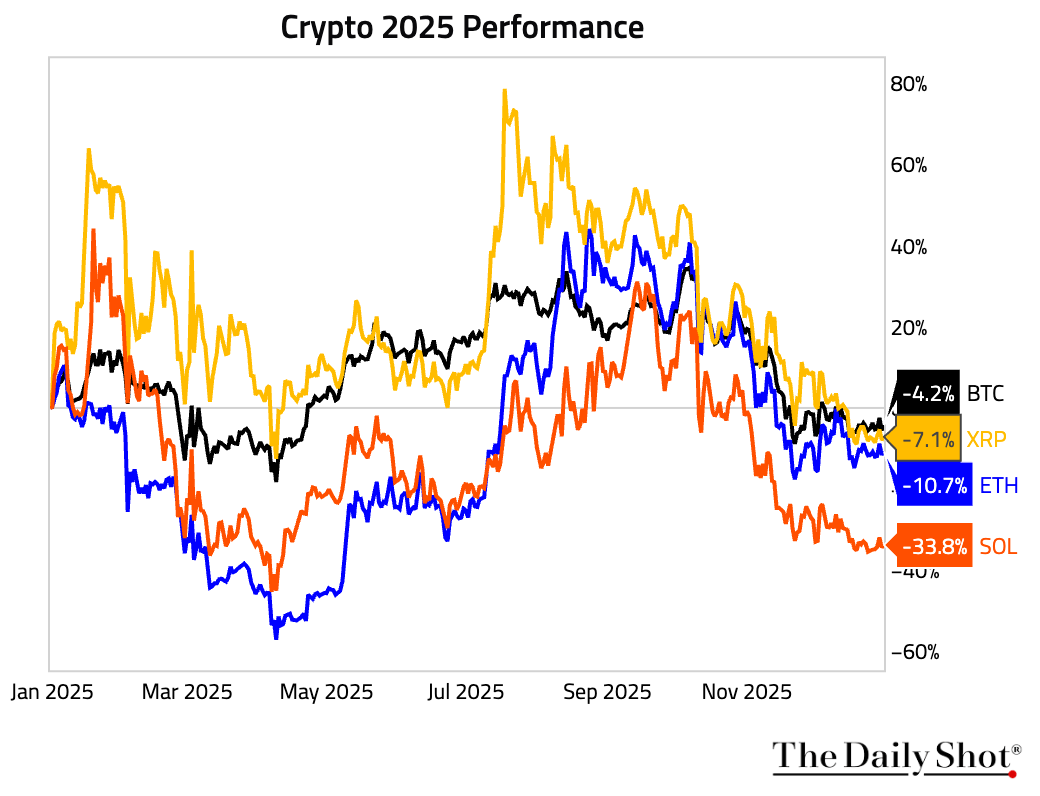
Cryptocurrency
1 Crypto had a challenging year.
Back to Index
Disclaimer
Augur Digest is an automatically generated newsletter edited by humans. It may contain inaccuracies and is not investment advice. Augur Labs LLC will not accept liability for any loss or damage as a result of your reliance on the information contained in the newsletter.