- Administrative Update
- United States
- Canada
- United Kingdom
- The Eurozone
- Europe
- Japan
- Asia-Pacific
- India
- Emerging Markets
- Equities
- Rates
- Energy
- Commodities
Administrative Update
Starting February 2, Augur Digest will transition to require a paid subscription. As a thank you to our loyal readers, we will send out a special link with discounted pricing later this month.Back to Index
United States
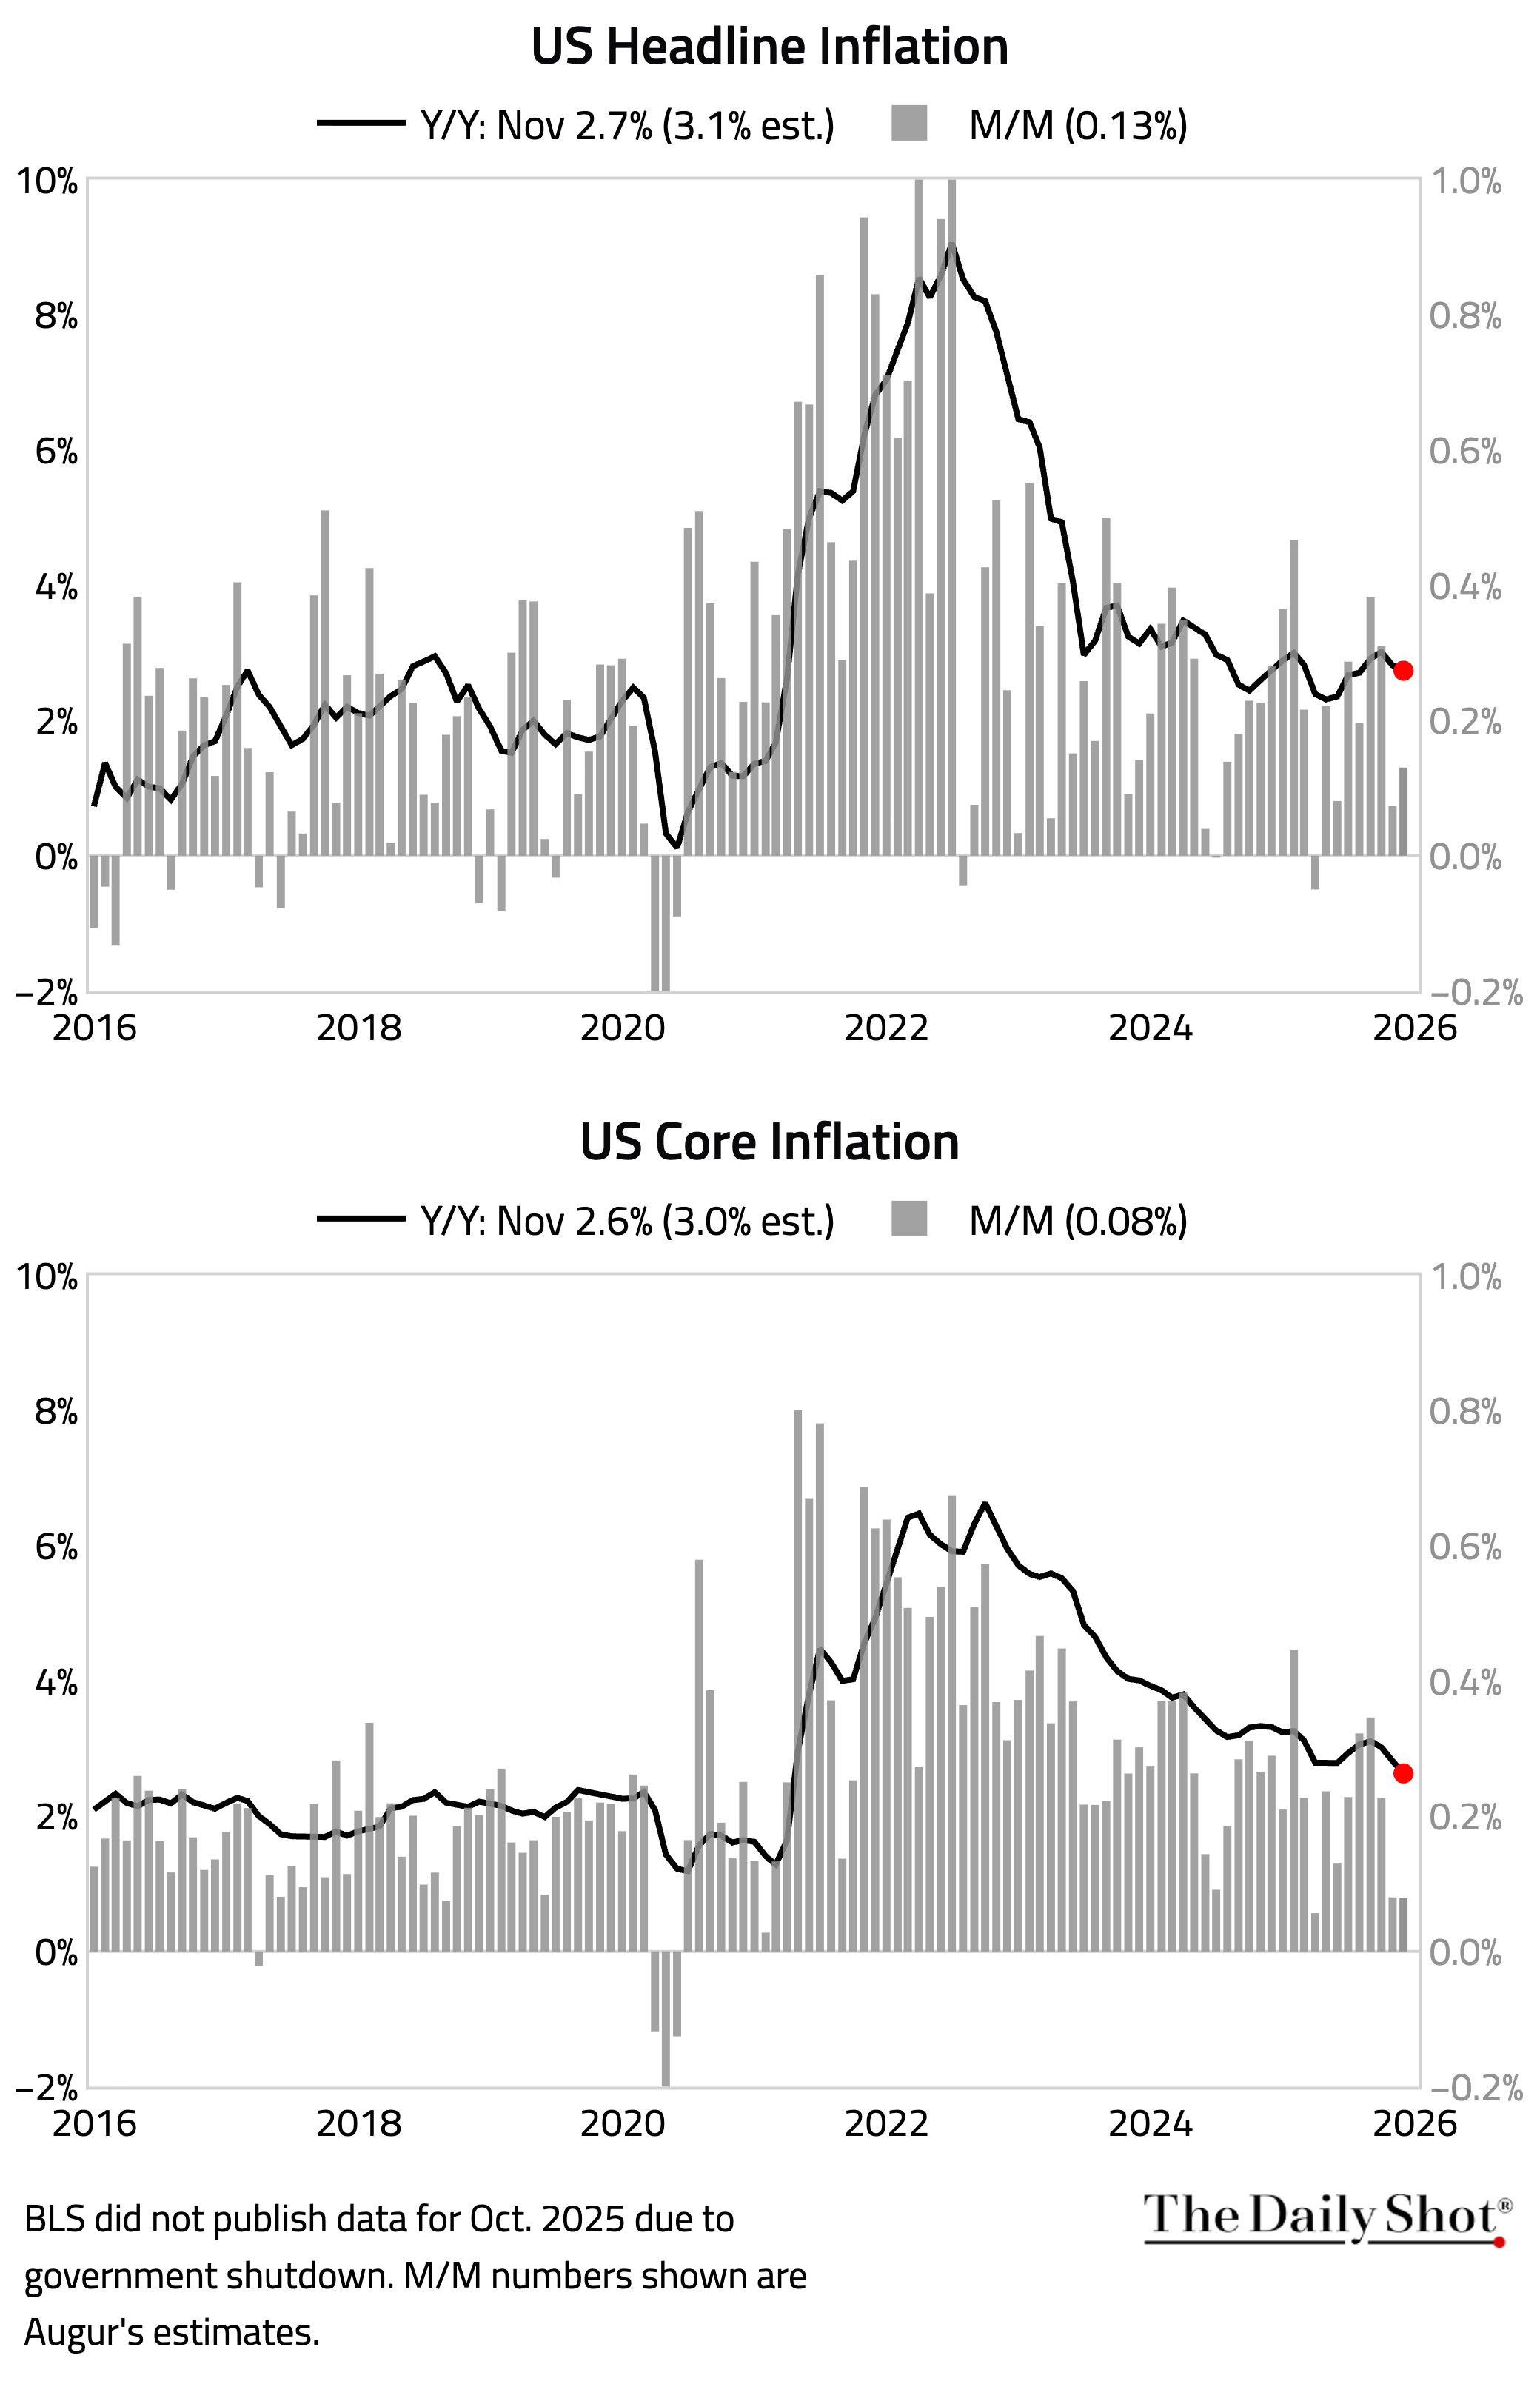
1 Headline inflation for December was in line with consensus, while core inflation was a touch lower than expected.
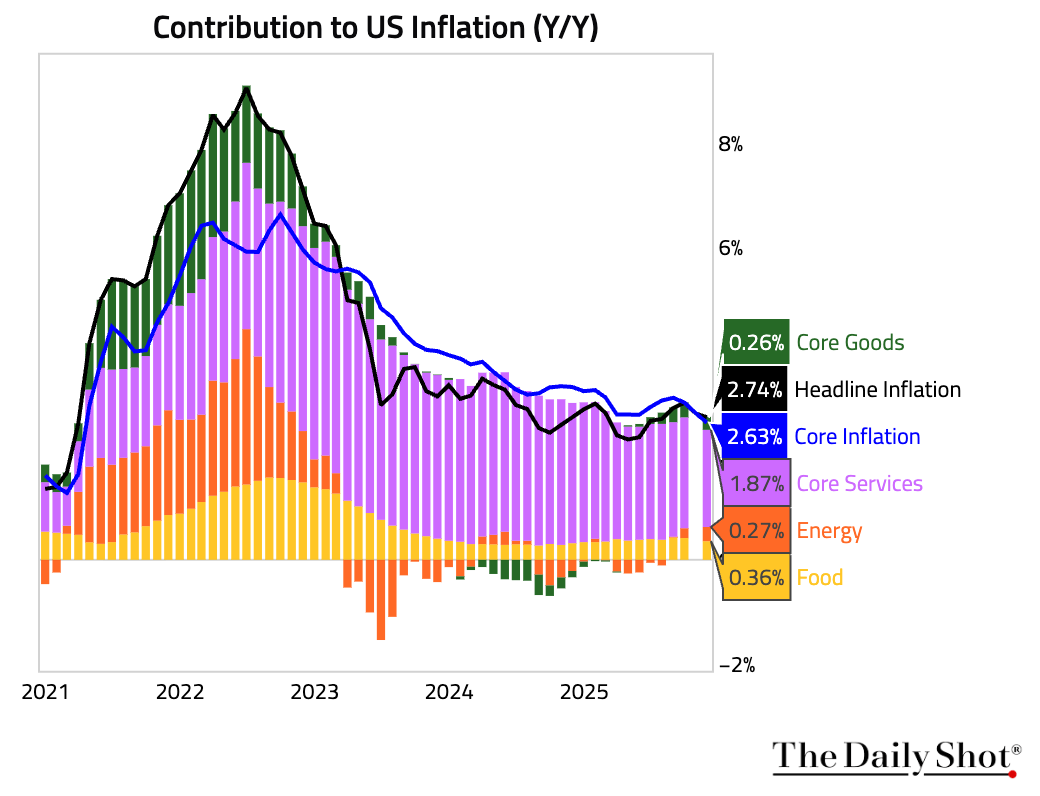
• Here is a breakdown of year-over-year inflation by component.
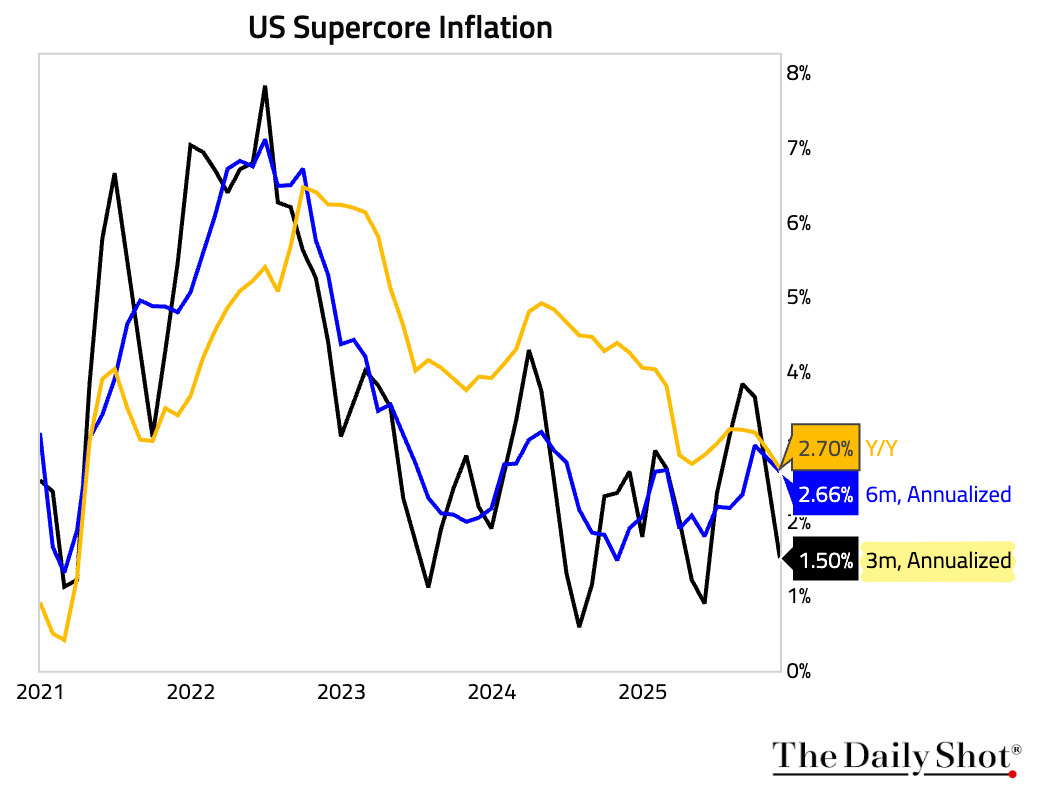
• Supercore inflation declined sharply on a trailing 3-month basis.
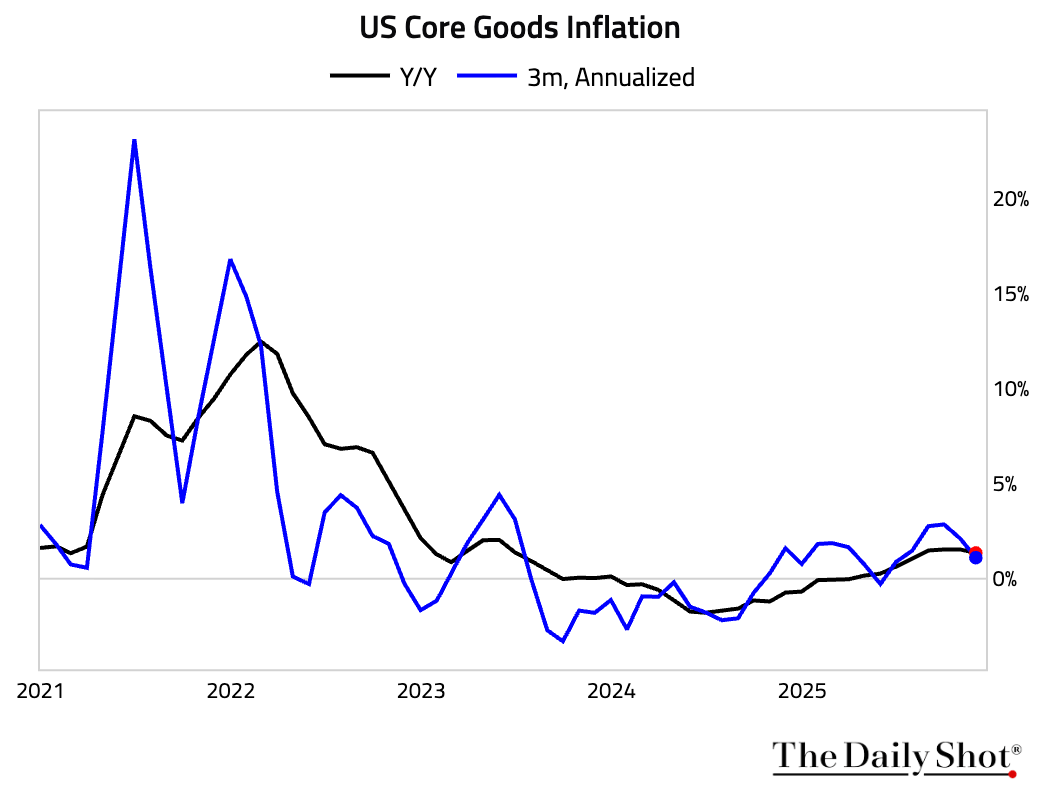
• Some payback was expected from November's surprisingly soft print, which was likely suppressed by the BLS sampling prices only during the second half of the month when holiday discounting ramps up. Yet core goods prices were flat month over month in December.
– Core services inflation rose, …
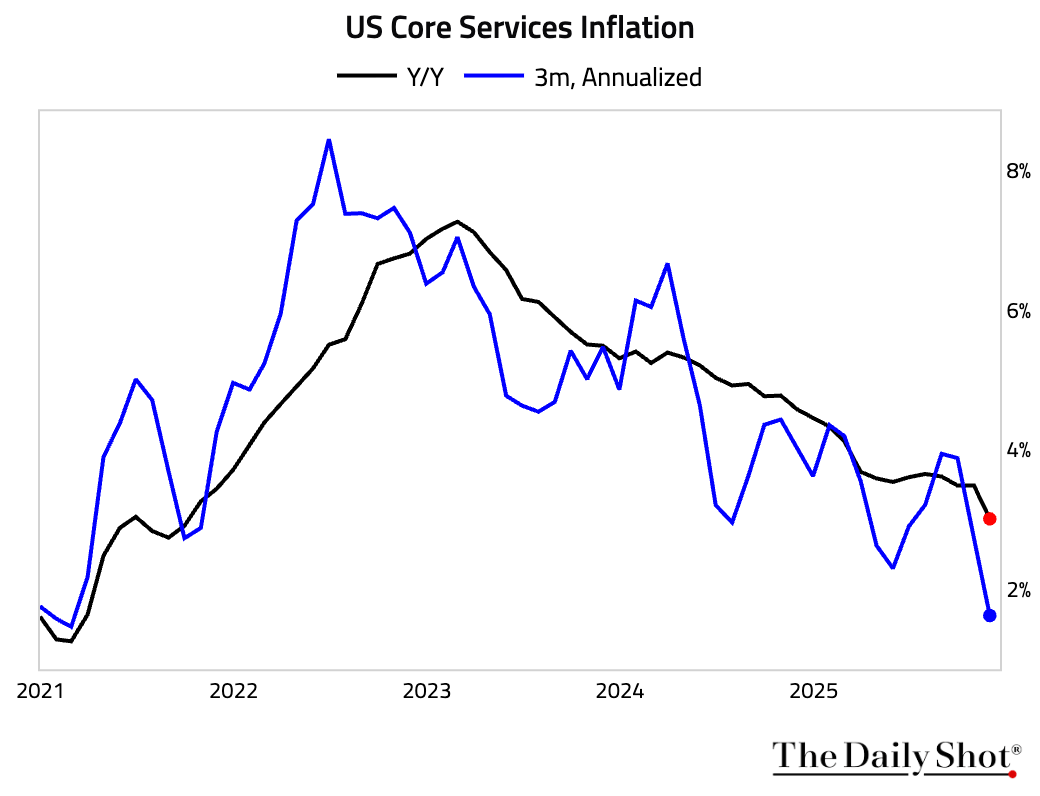 … in part because shutdown-related disruption to flights that weighed on air travel and hotel bookings unwound.
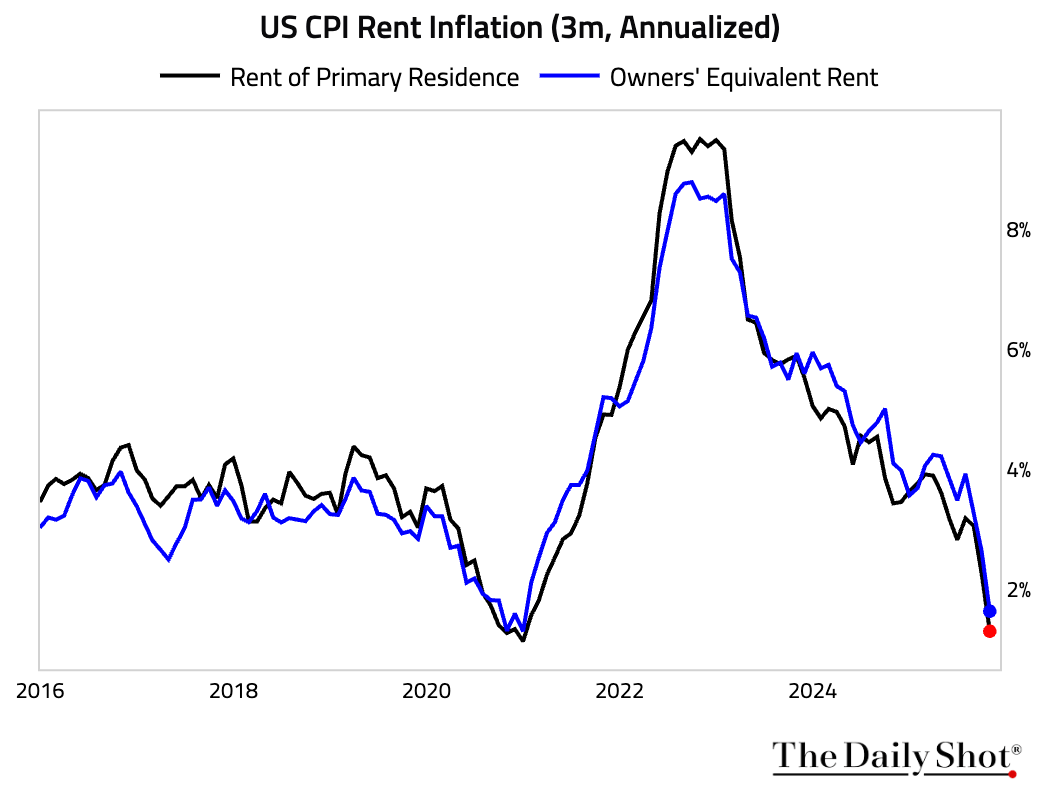
– Shelter inflation rose, likely noise around a trend that is continuing to slow.
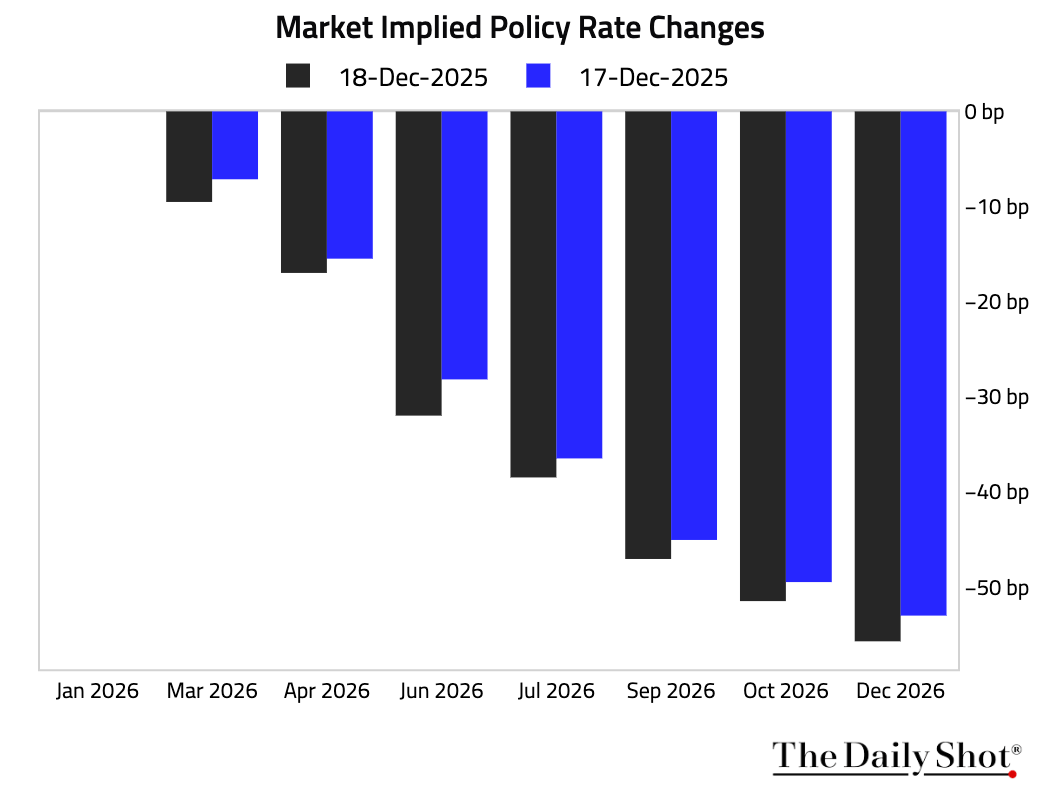
• Markets reacted dovishly to the report.
– The amount of rate cuts priced in for 2026 rose slightly.
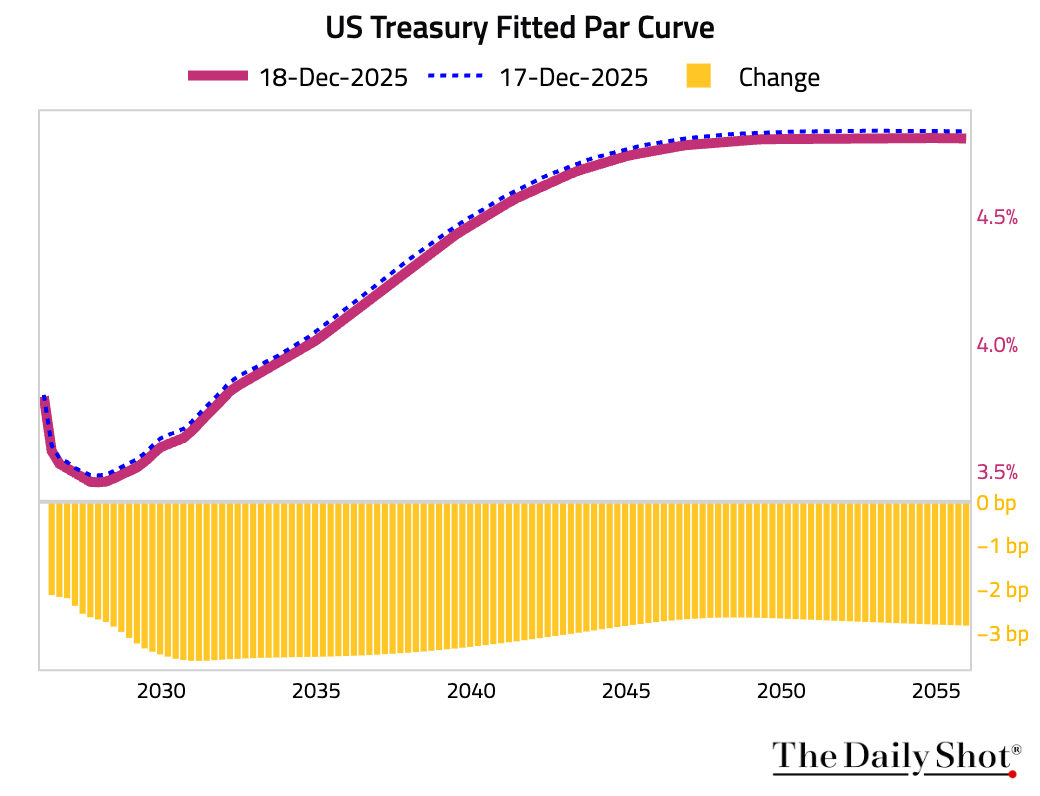
– Treasuries rallied across the curve.
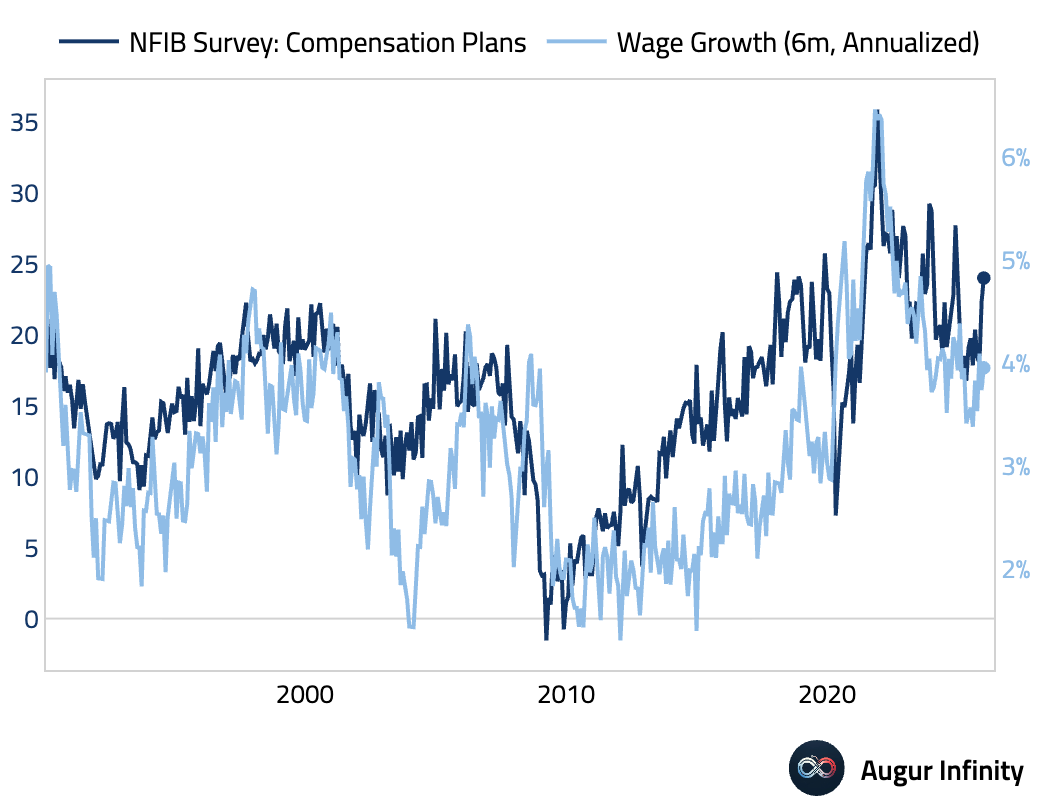
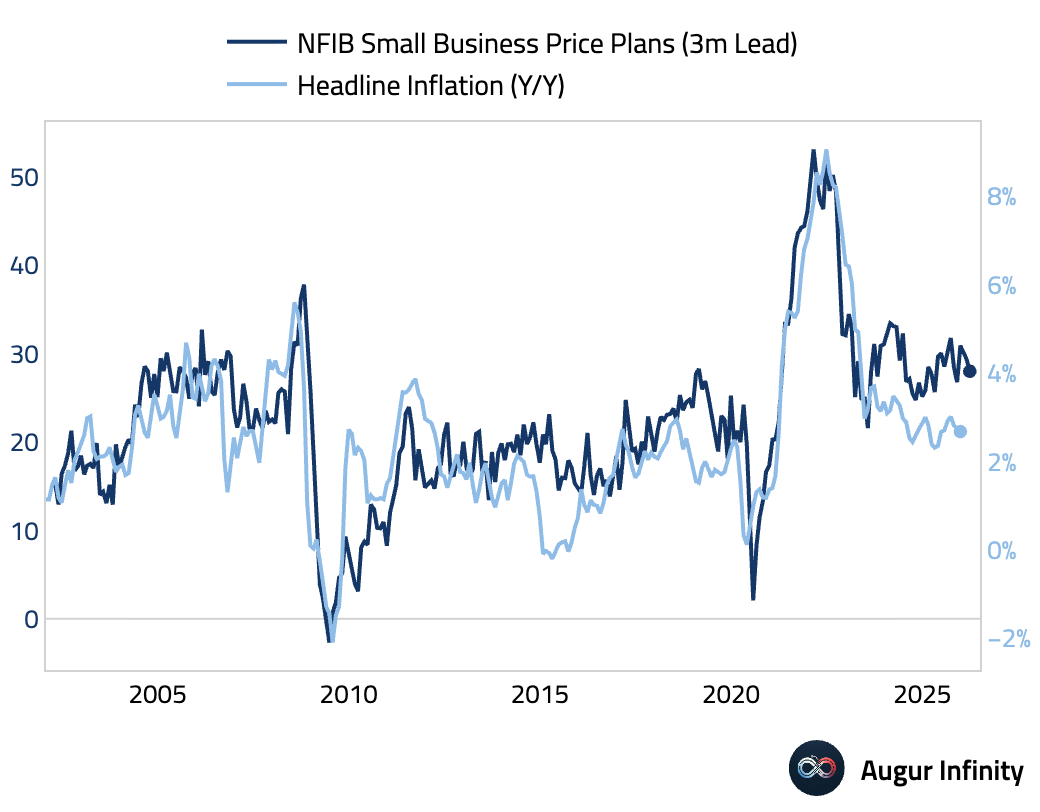
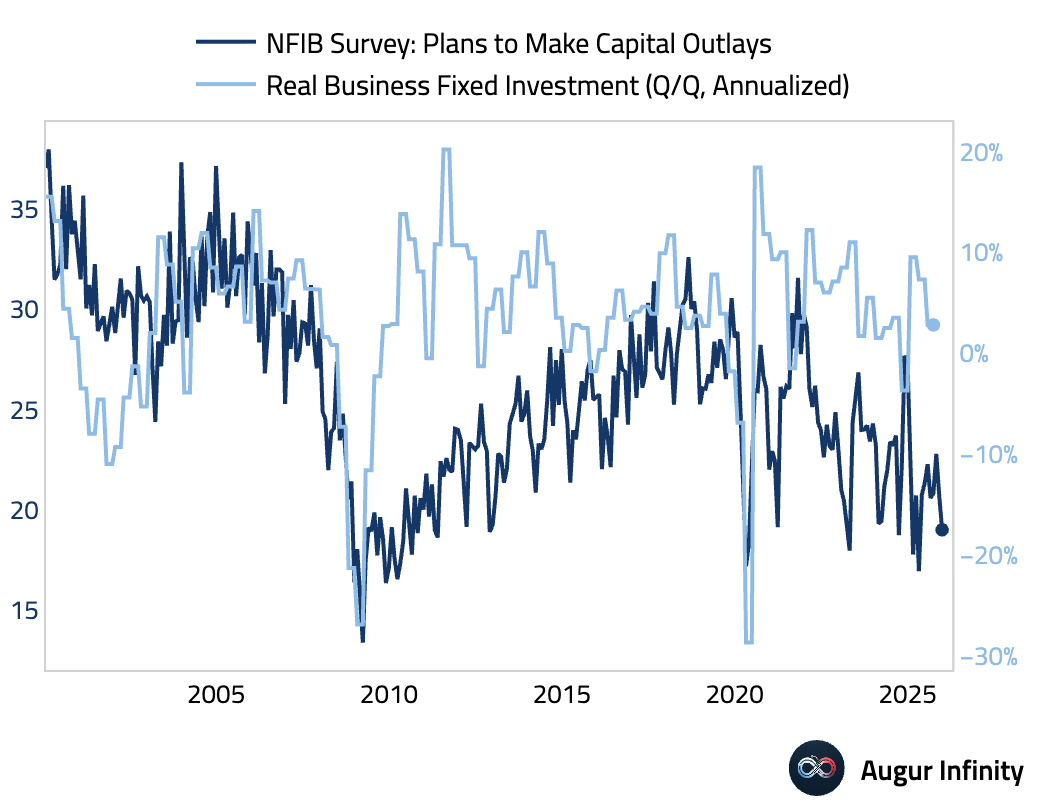
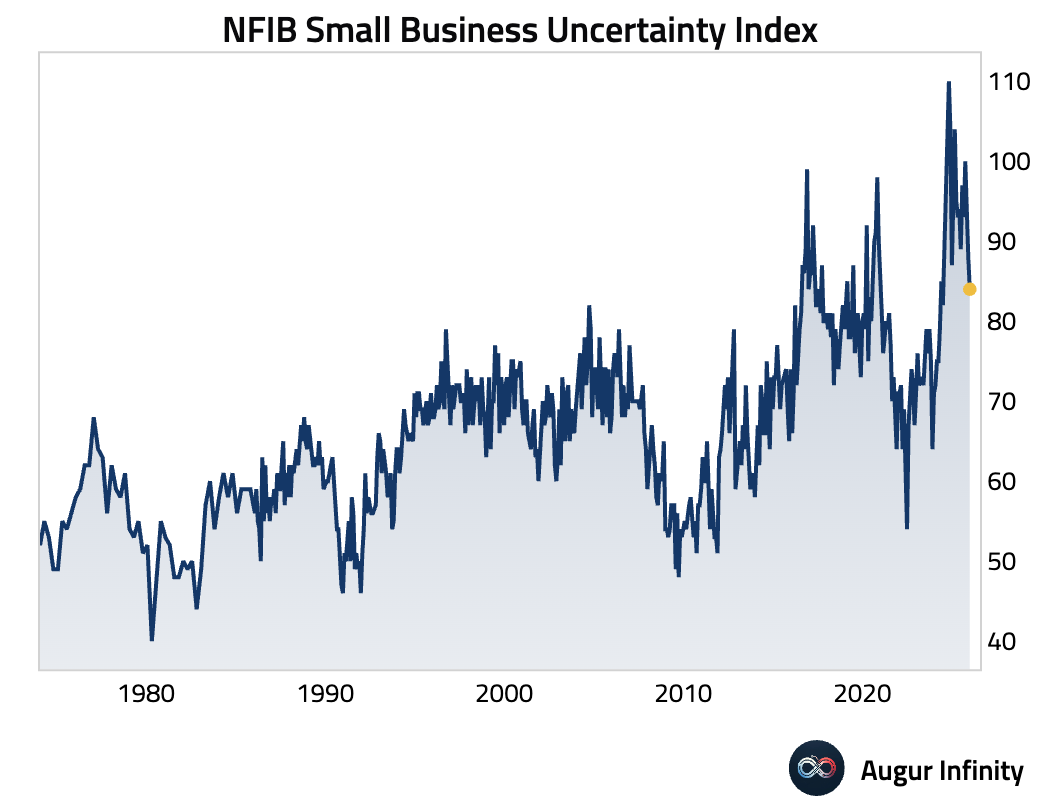
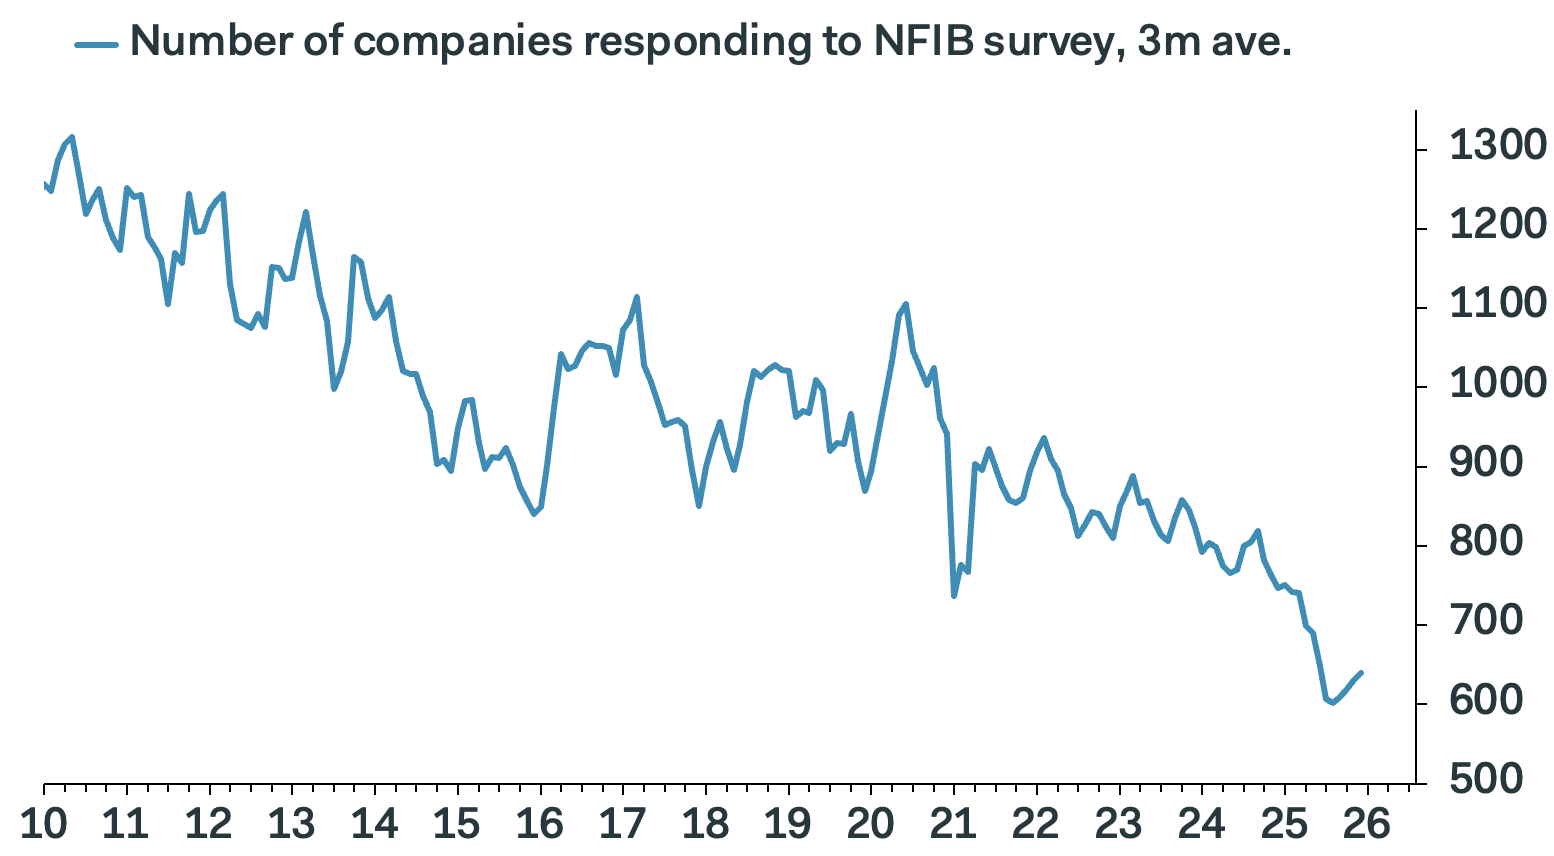
2 The NFIB Small Business Optimism Index edged up.
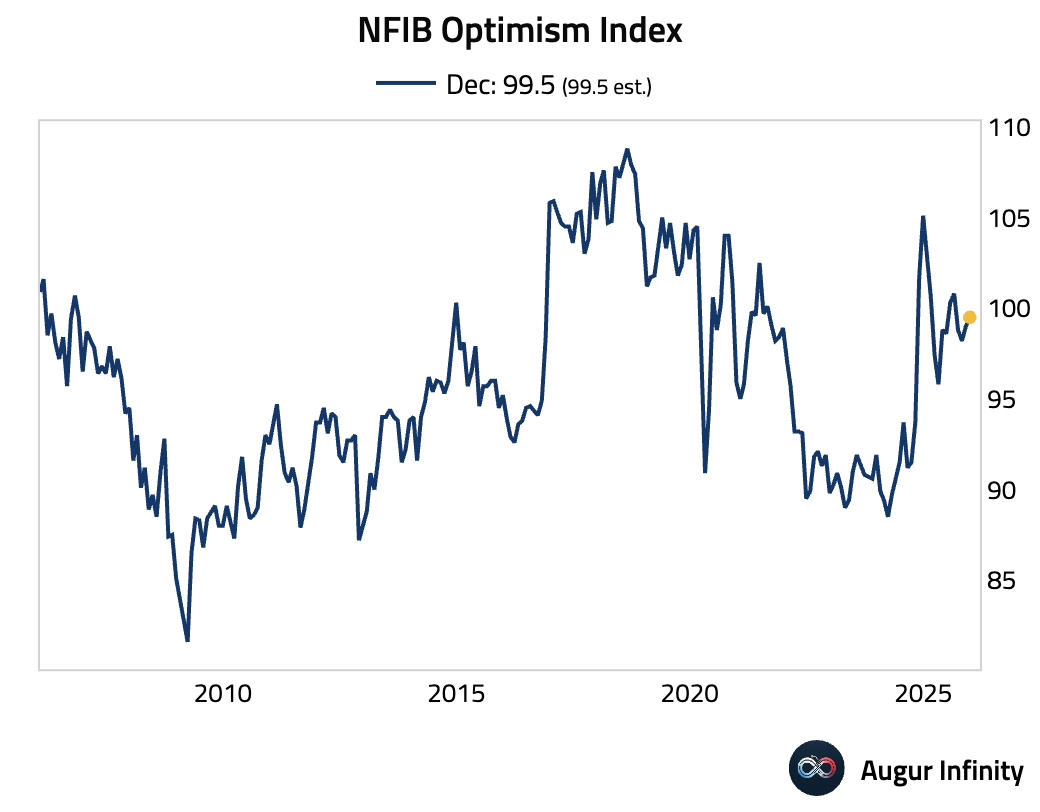
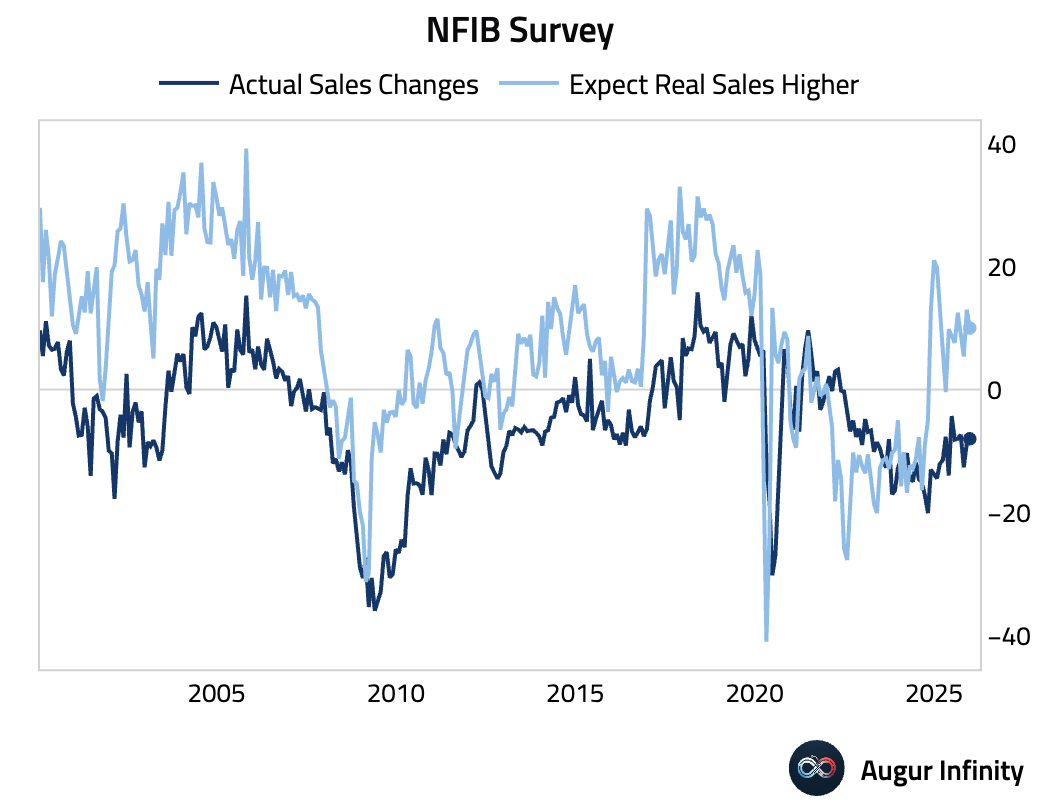
• Sales (picked up further, but expected sales softened):
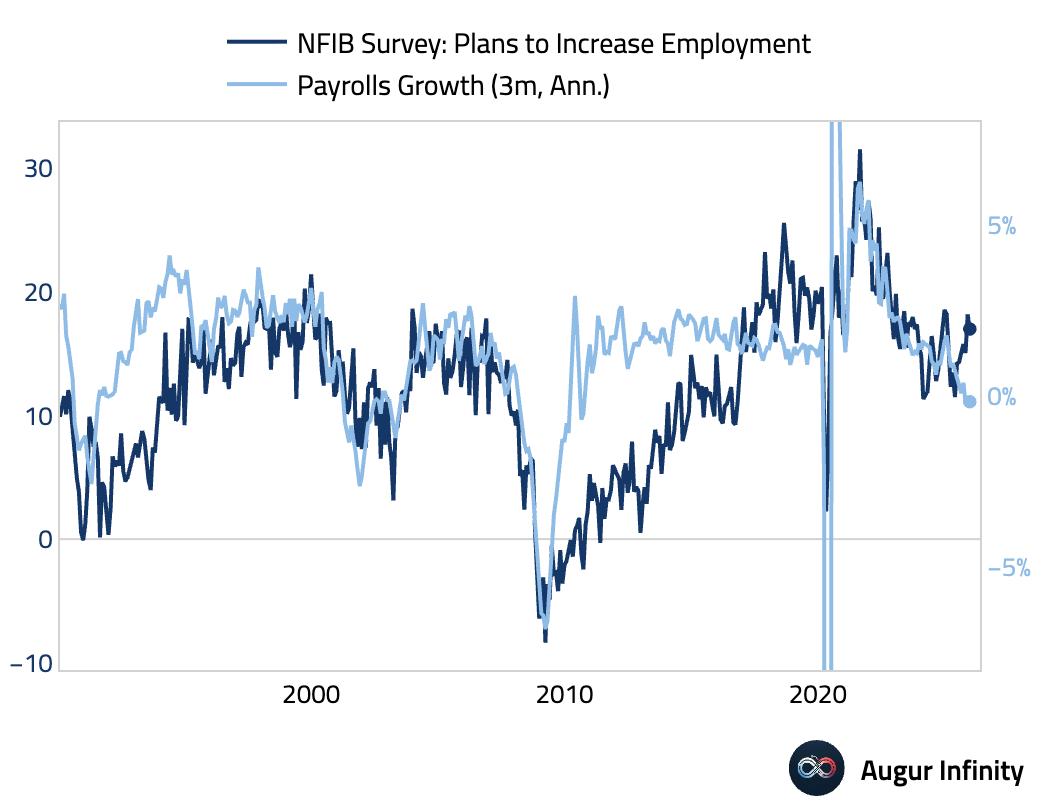
• Hiring intentions (eased):
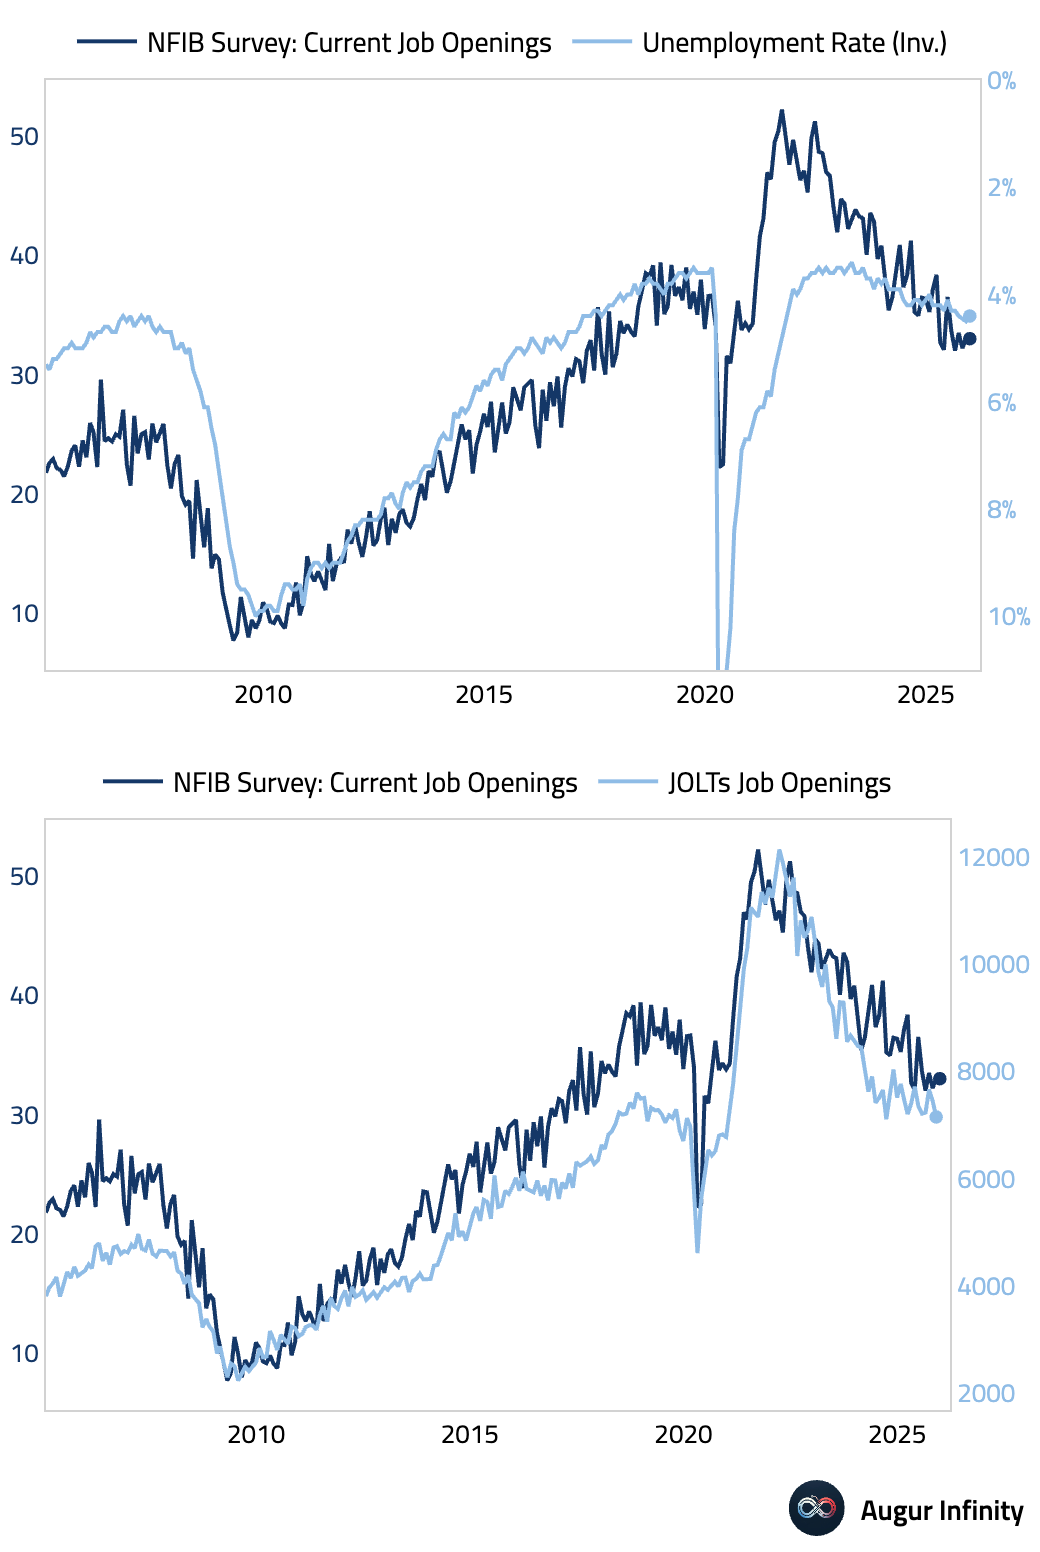
• Job openings (stable):
• Wage plans (sharply higher):
• Price plans (edged down but remained elevated):
• Capex intentions (worsened further and depressed relative to history):
• Uncertainty (declined):
• A near-record-low number of companies responded to the survey (8.6%), leaving scope for non-response bias.
 Source: Pantheon Macroeconomics
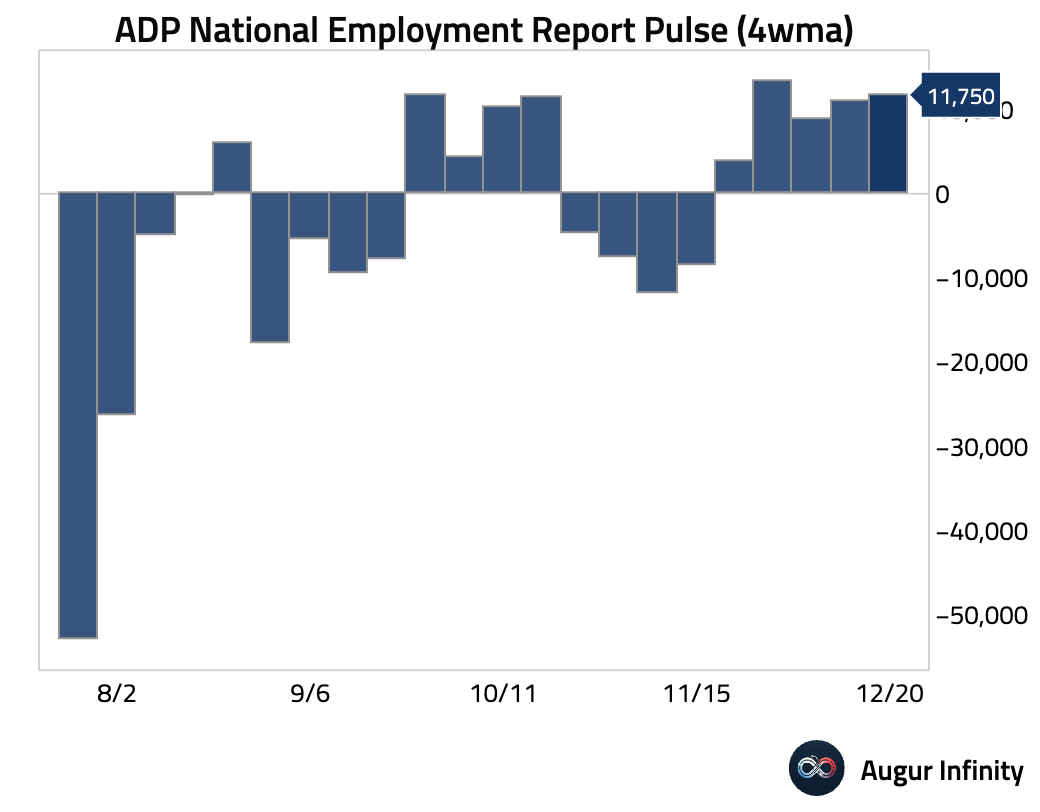
3 The weekly ADP employment report indicated a further pickup in private payroll growth.
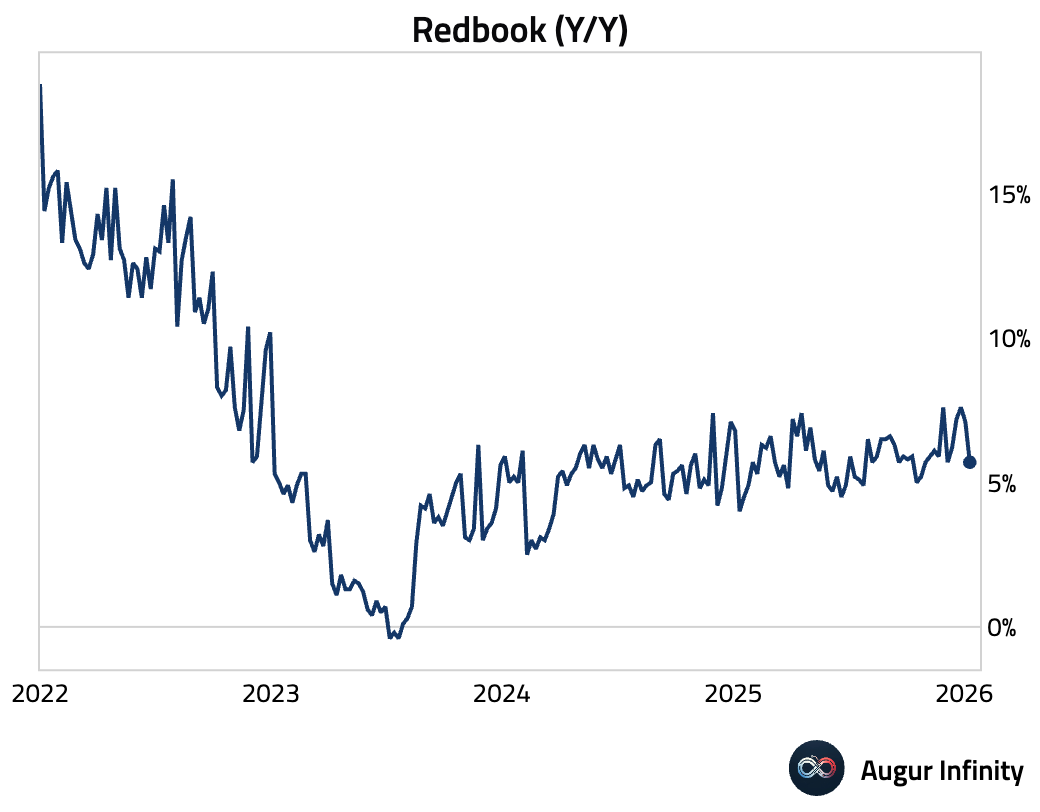
4 Same-store sales growth decelerated further on a year-over-year basis, according to the Redbook Index.
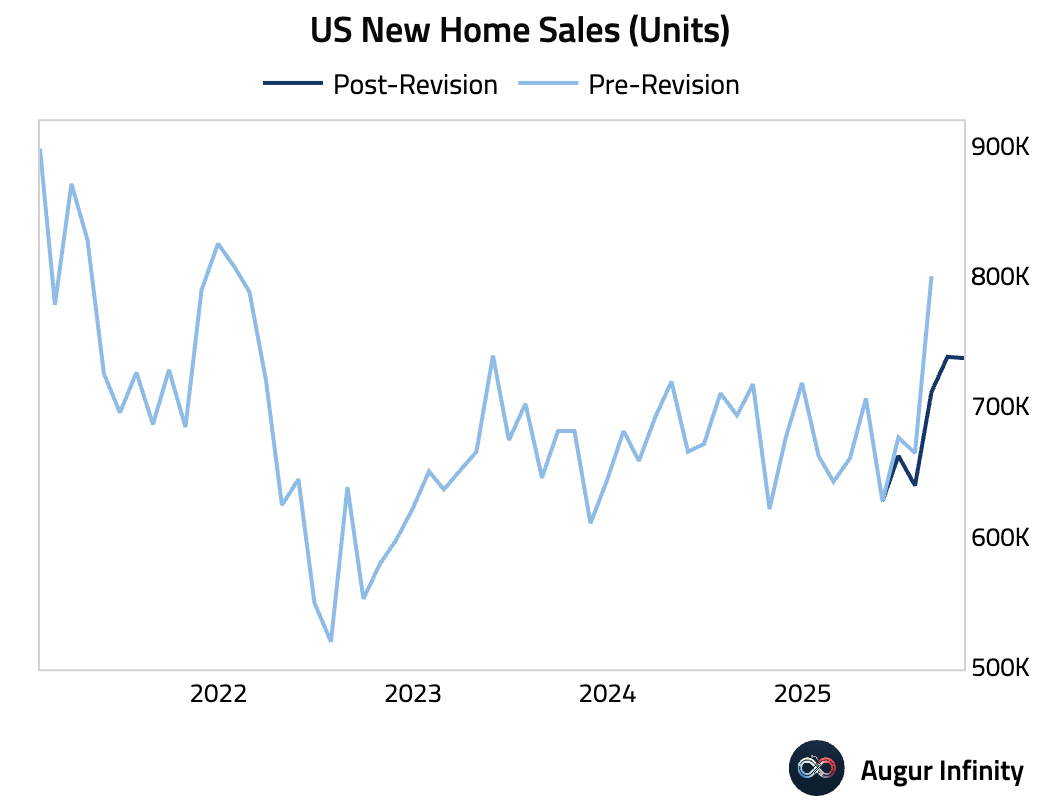
5 New home sales picked up in September and were roughly flat in October, supported by slightly lower mortgage rates and rising builder incentives.
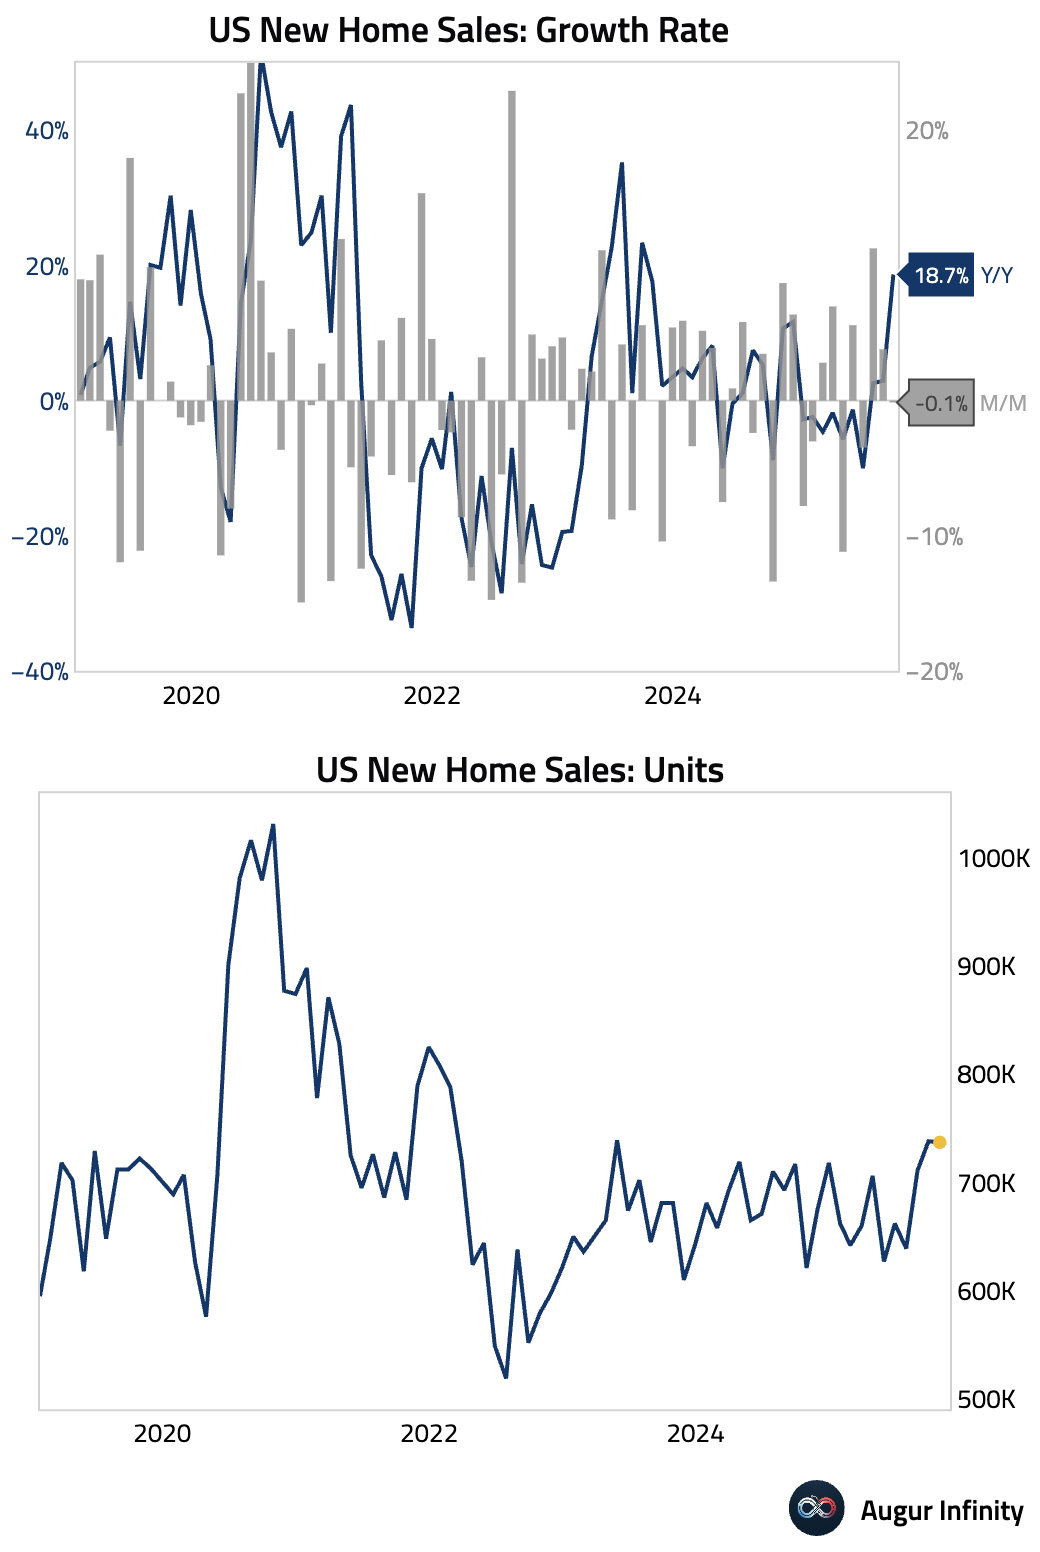
• Data for prior months were revised down drastically.
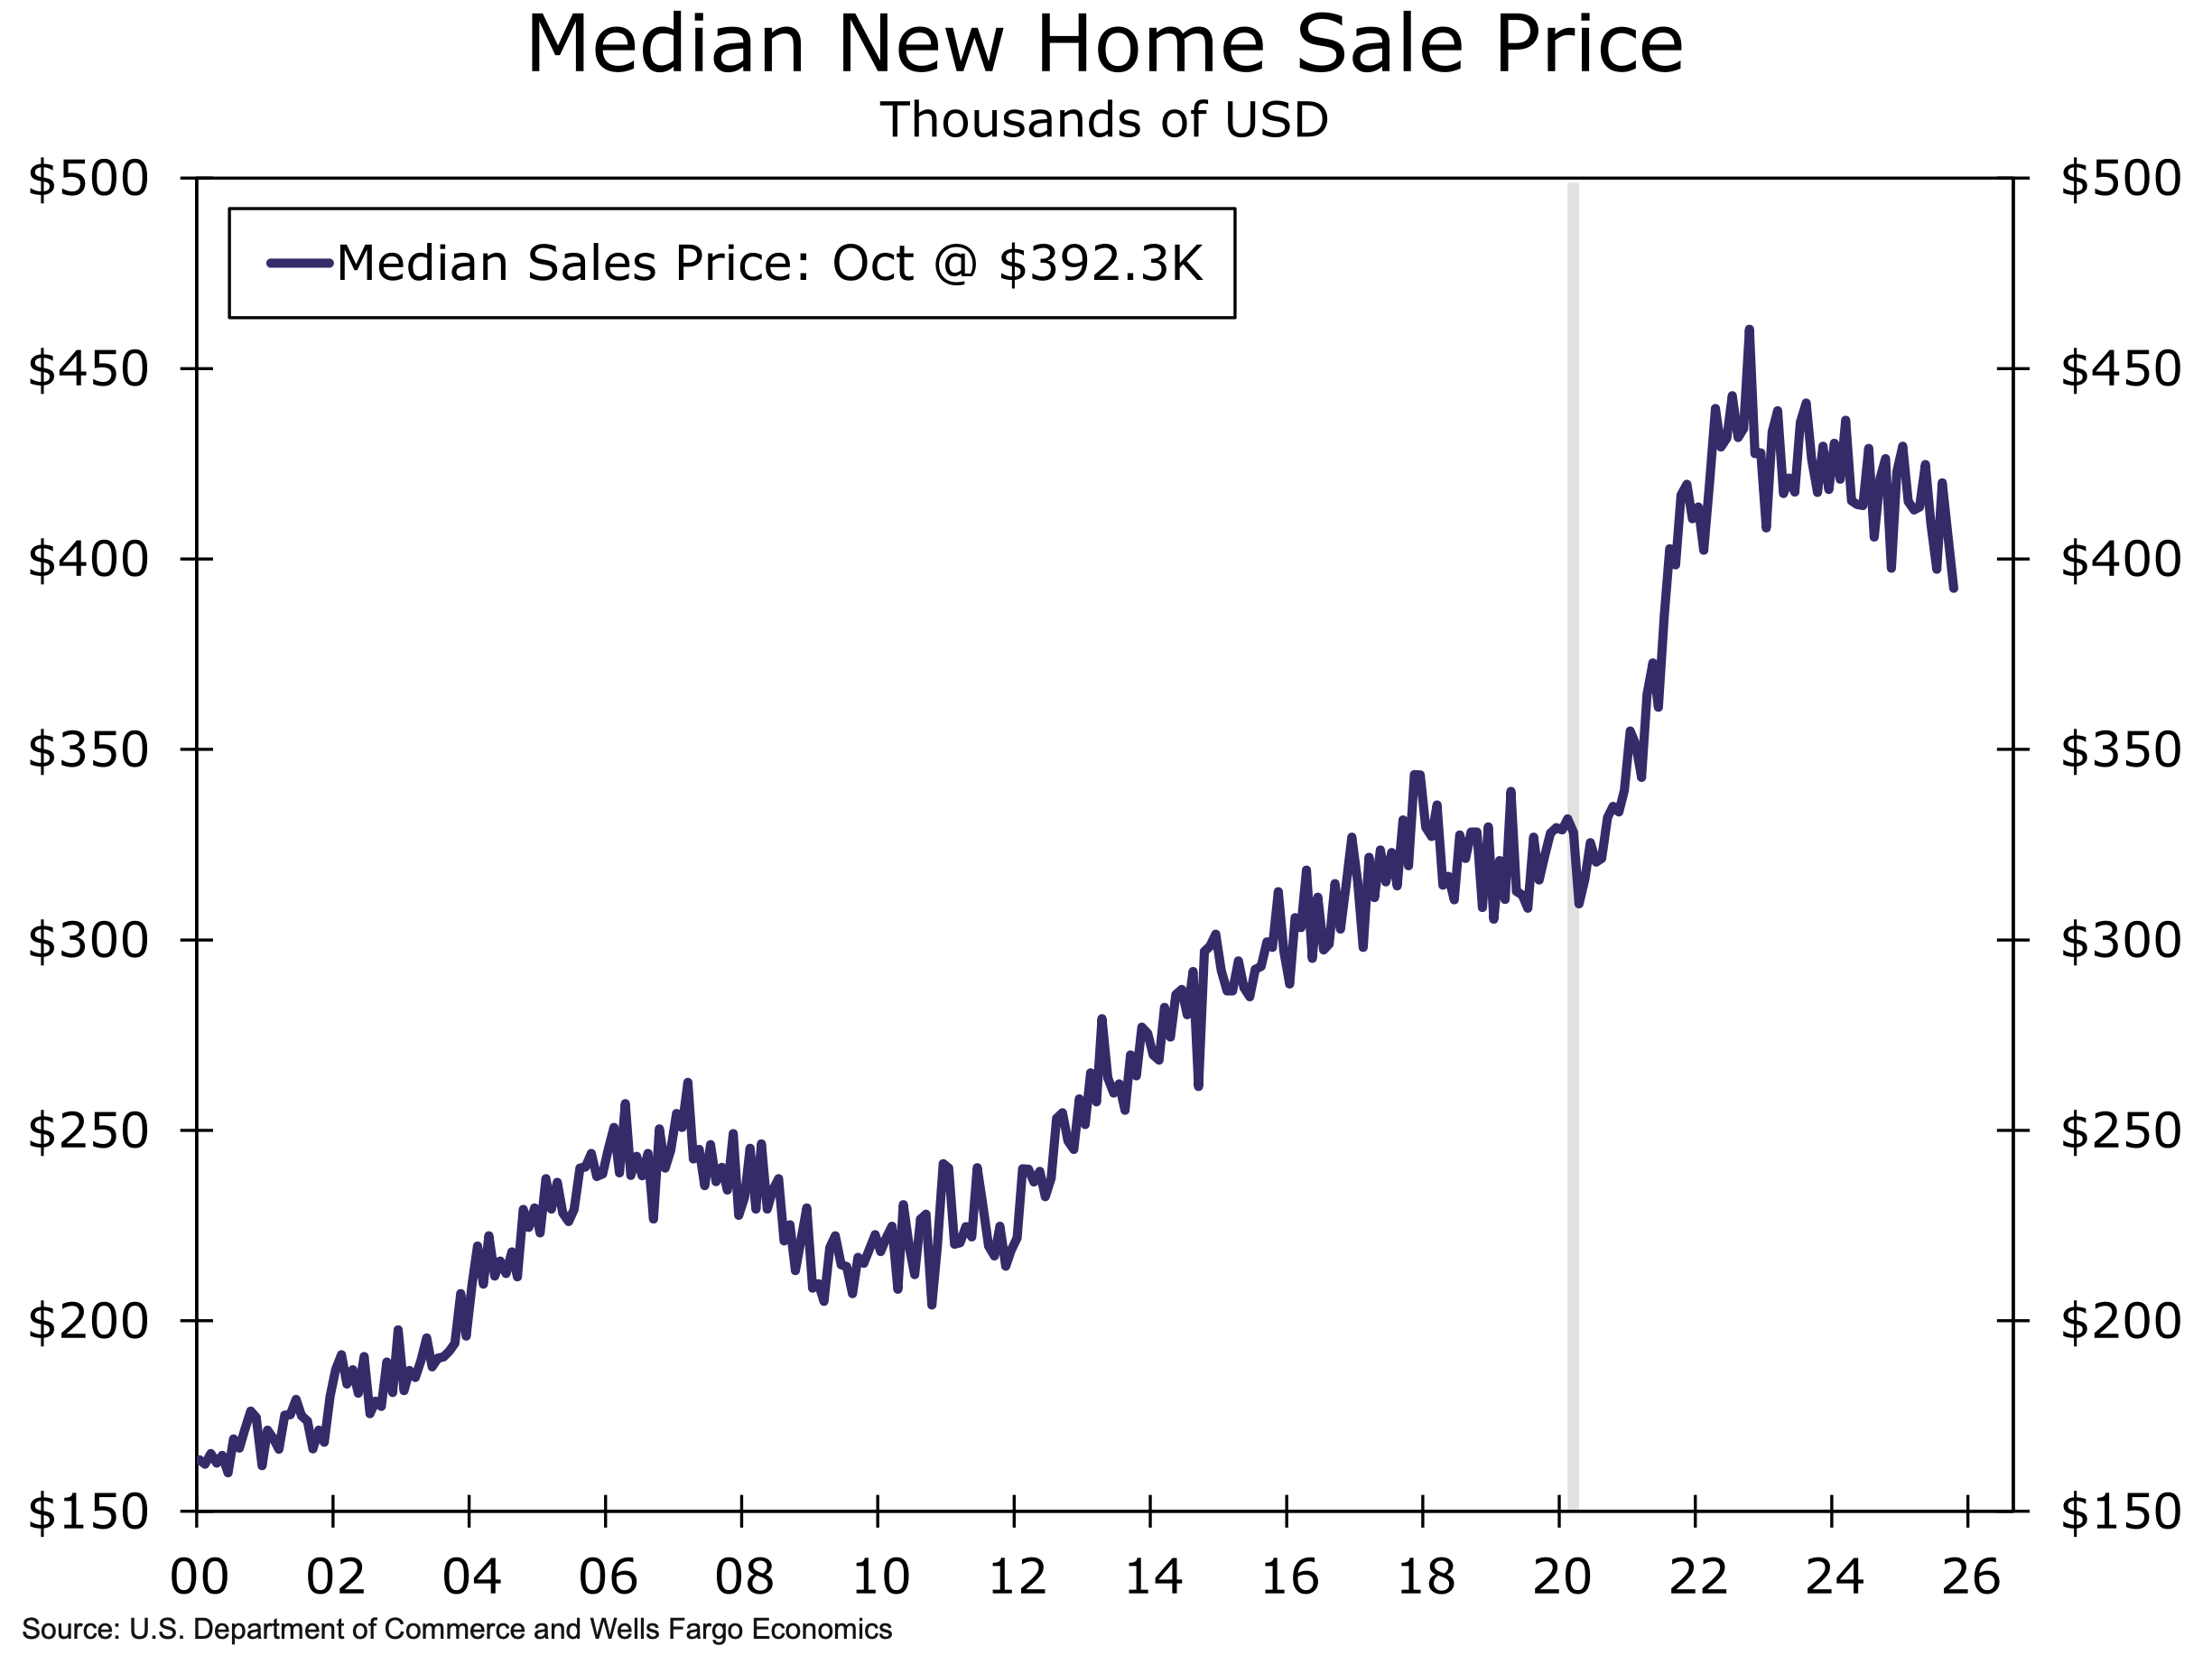
• Median new home price fell 8% year over year in October, reaching the lowest level since July 2021.
 Source: Wells Fargo
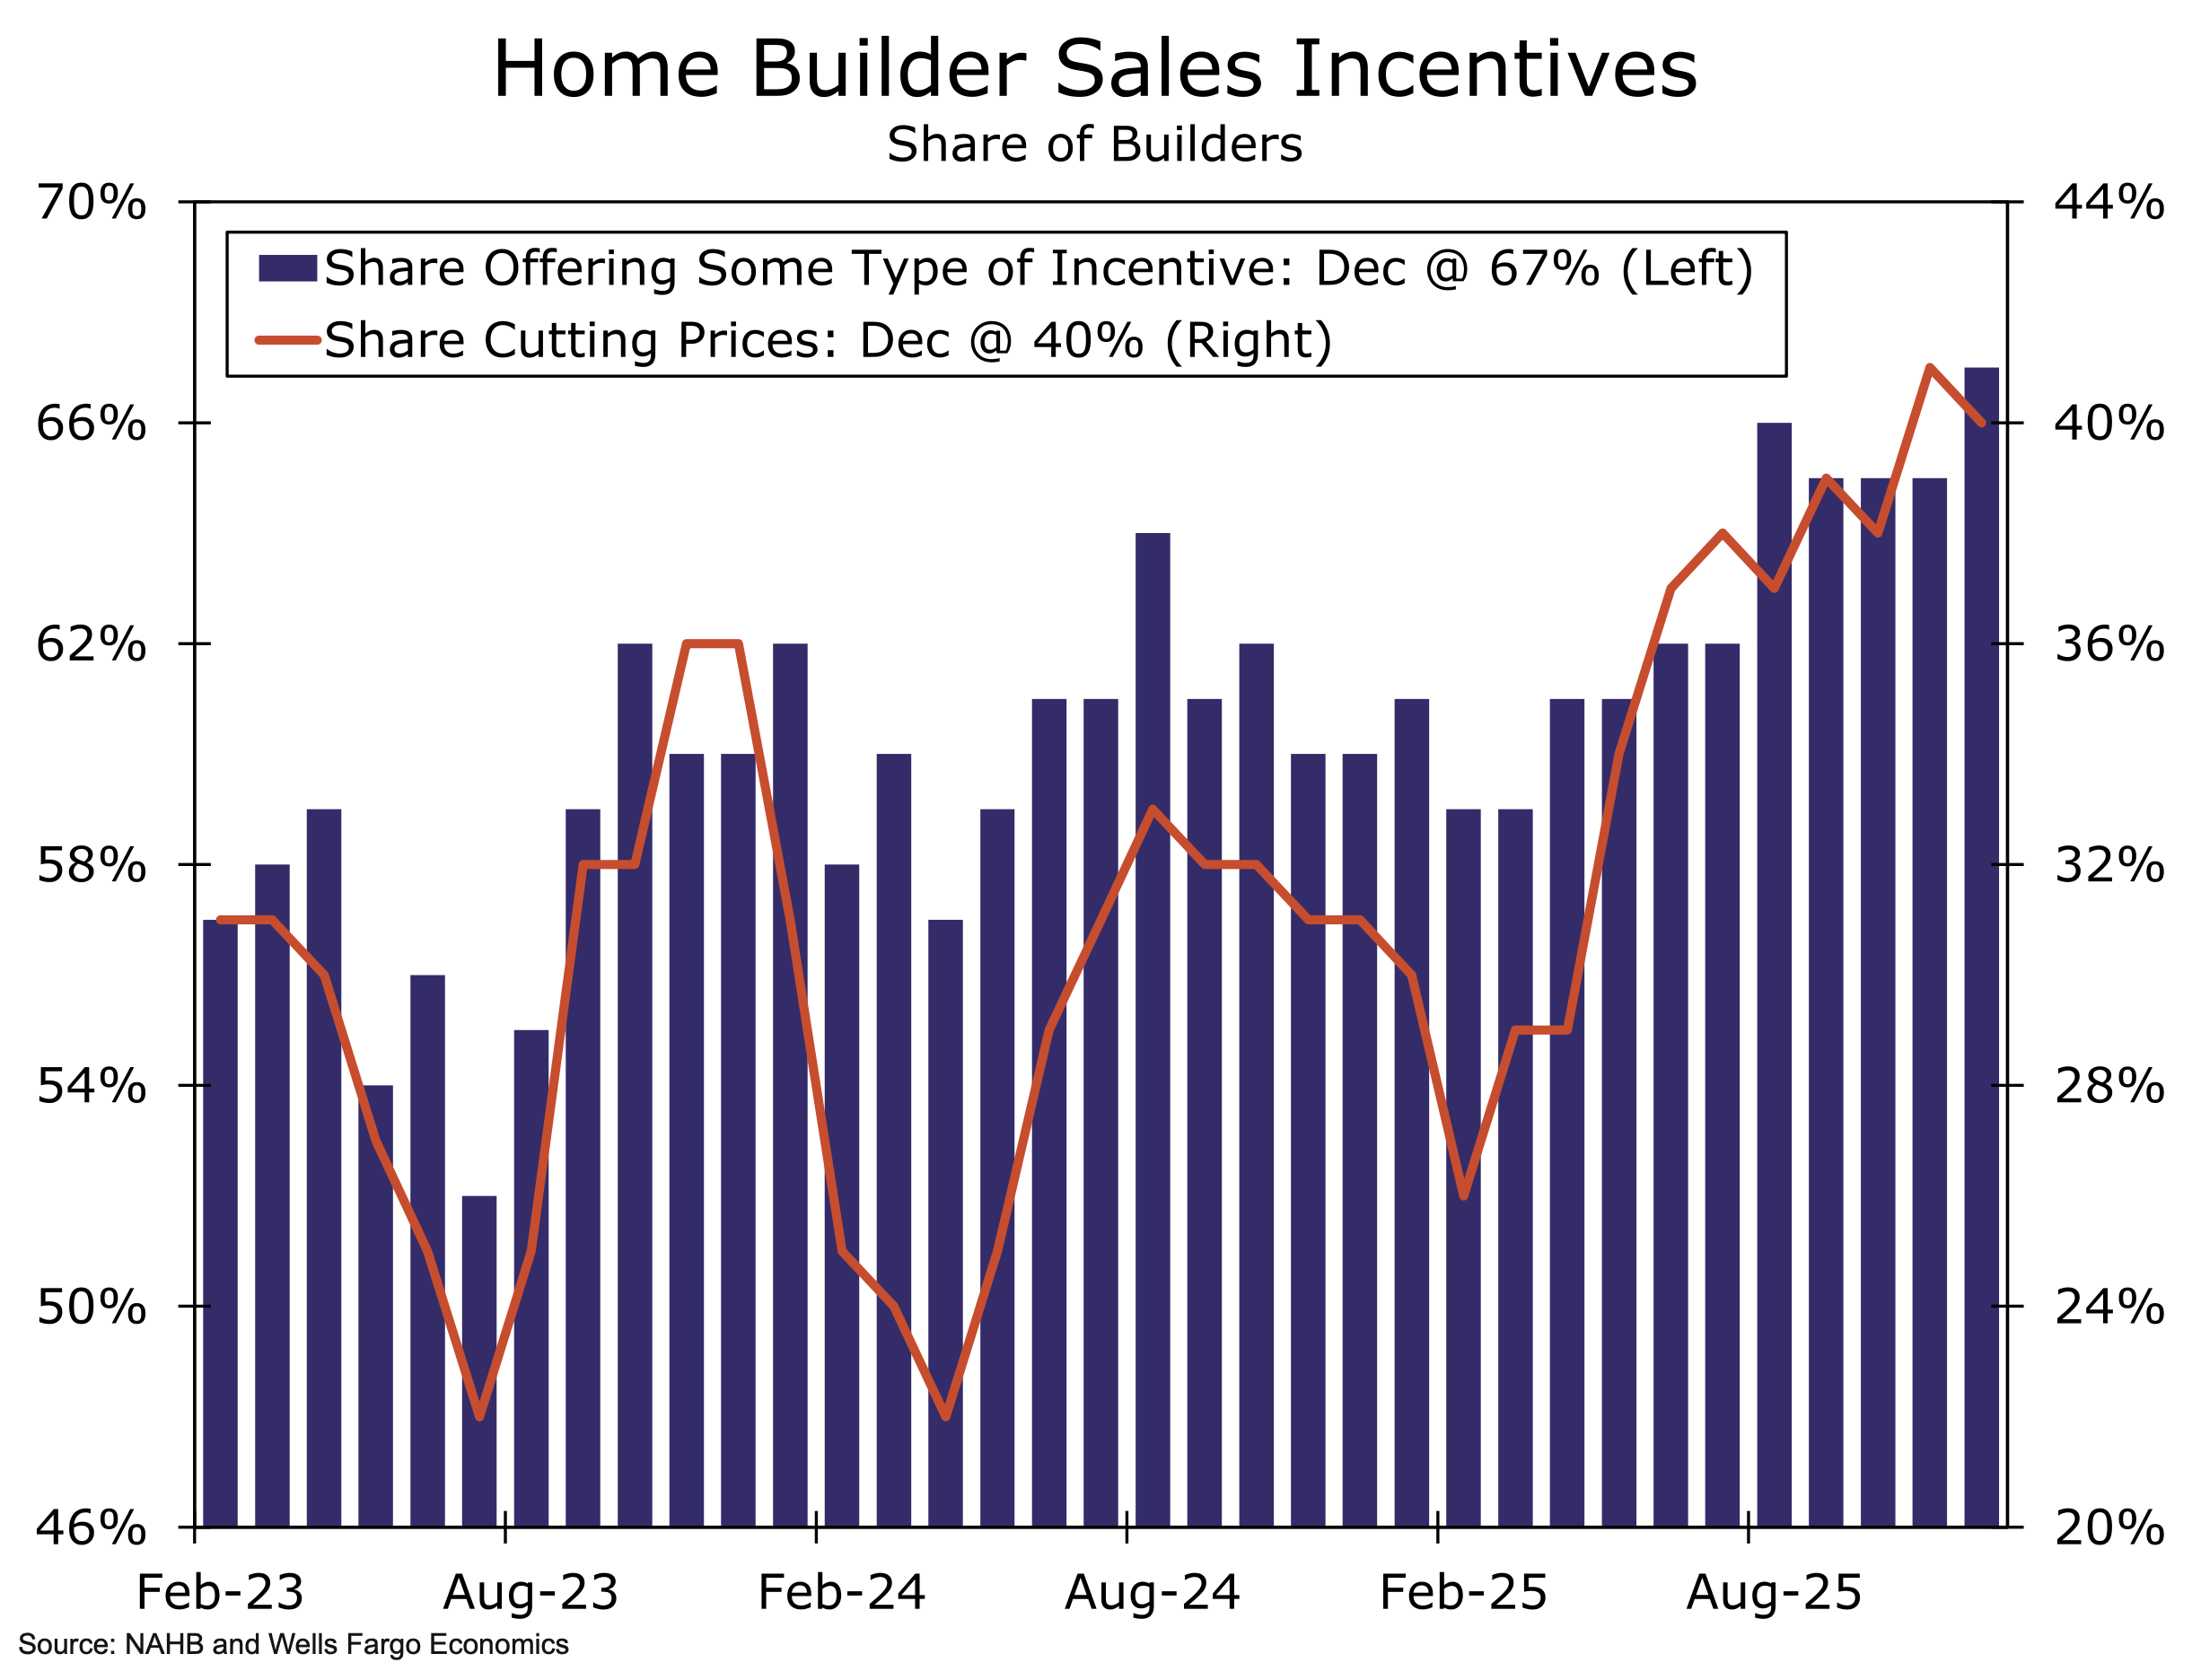
• The share of home builder sales offering some type of incentive reached the highest level in the post-pandemic period.
 Source: Wells Fargo
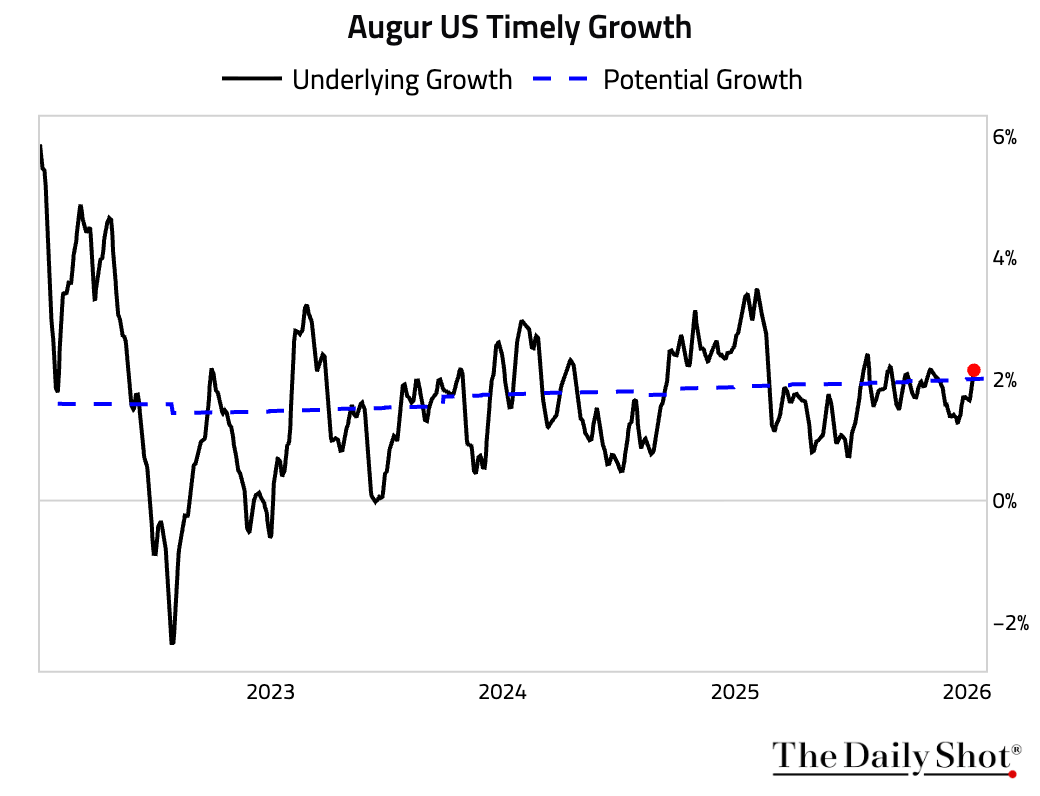
6 Our daily underlying growth estimate continues to hold up and currently sits just above potential growth.
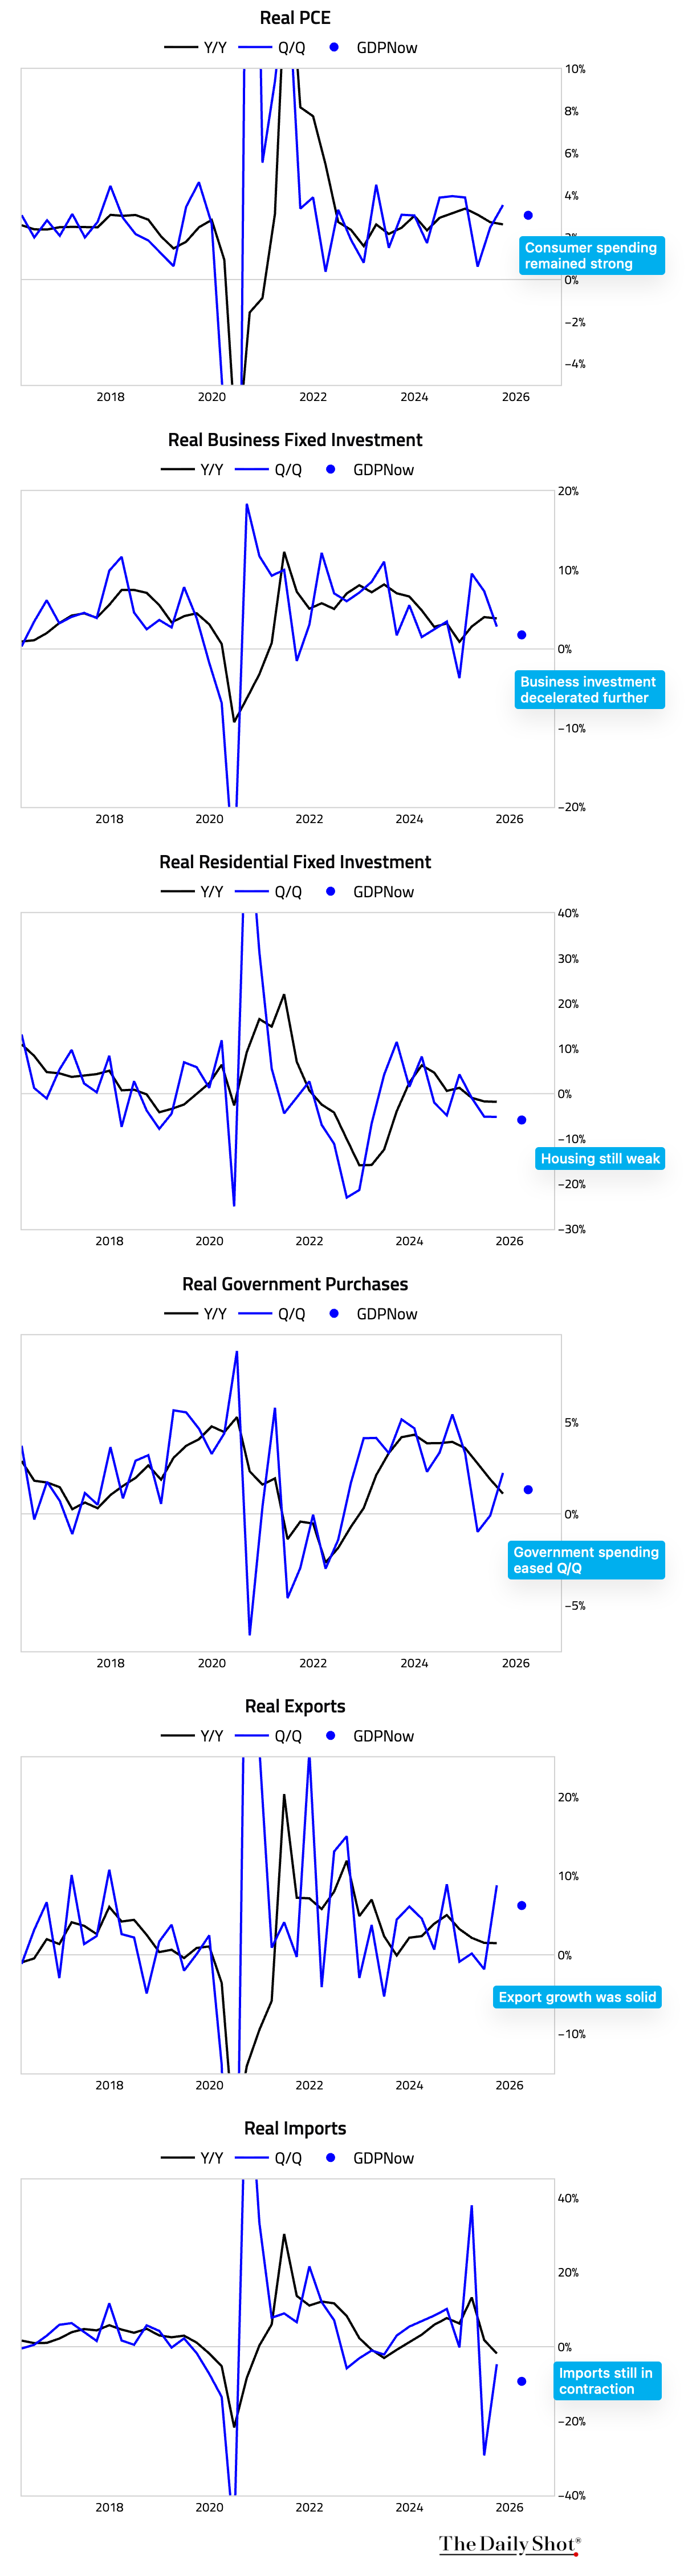
7 Here’s what the Atlanta Fed’s GDPNow model is saying about each component of GDP in Q4 2025.
8 Bank of America’s internal data show total credit and debit card spending per household rose in December.
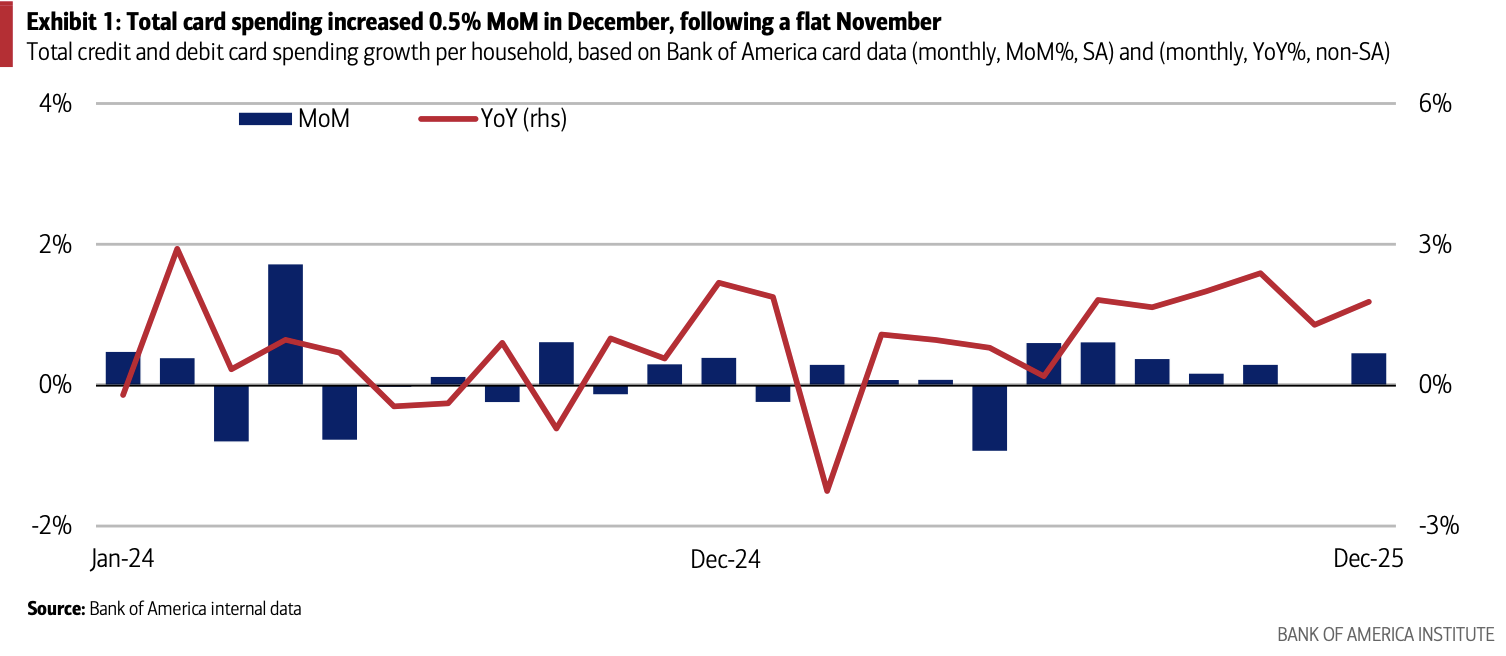 Source: Bank of America Institute
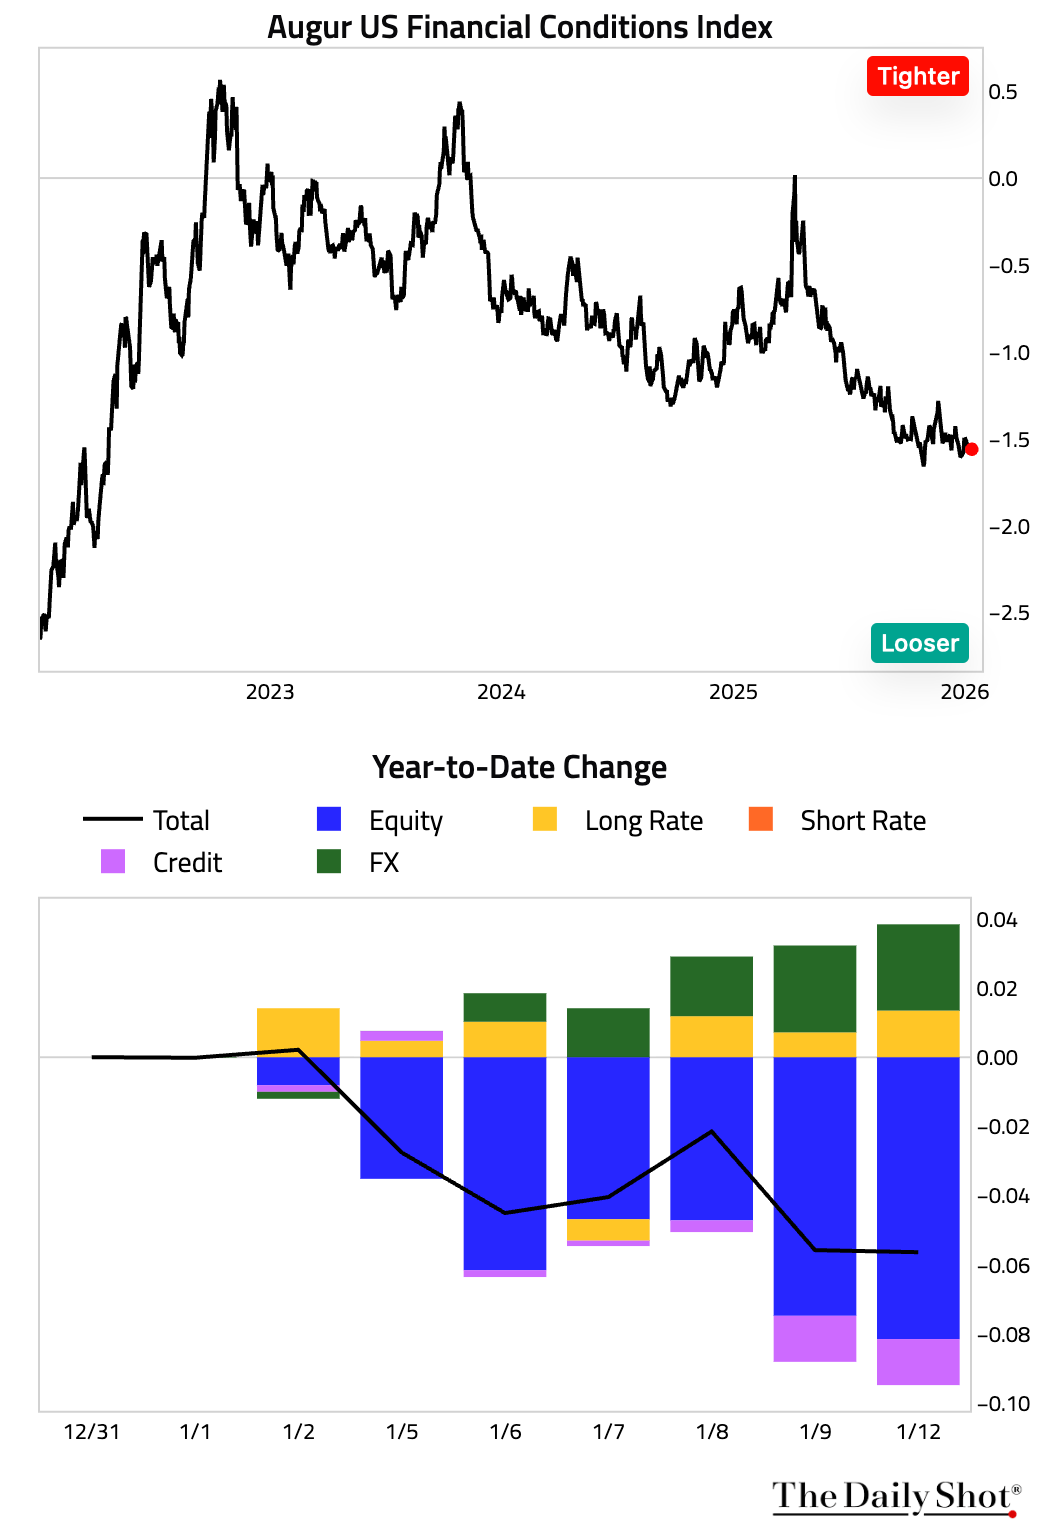
9 Financial conditions remain very easy, which should be supportive of growth.
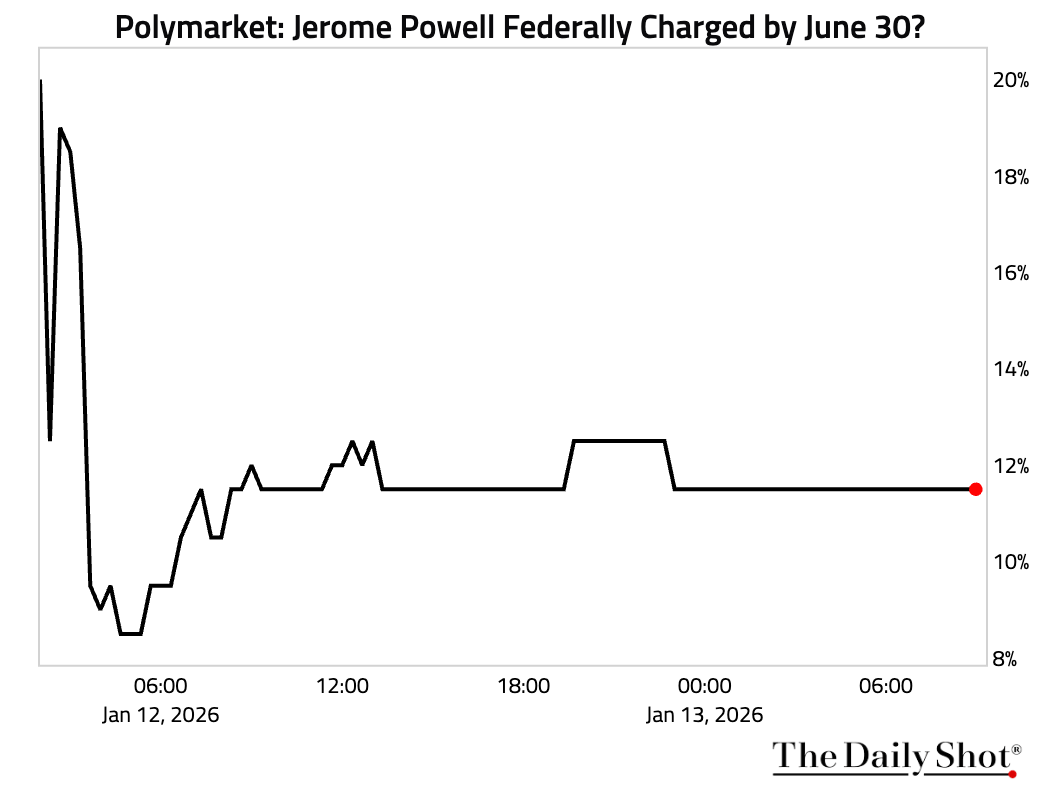
10 Betting markets are assigning a low probability to Chair Powell being federally charged.
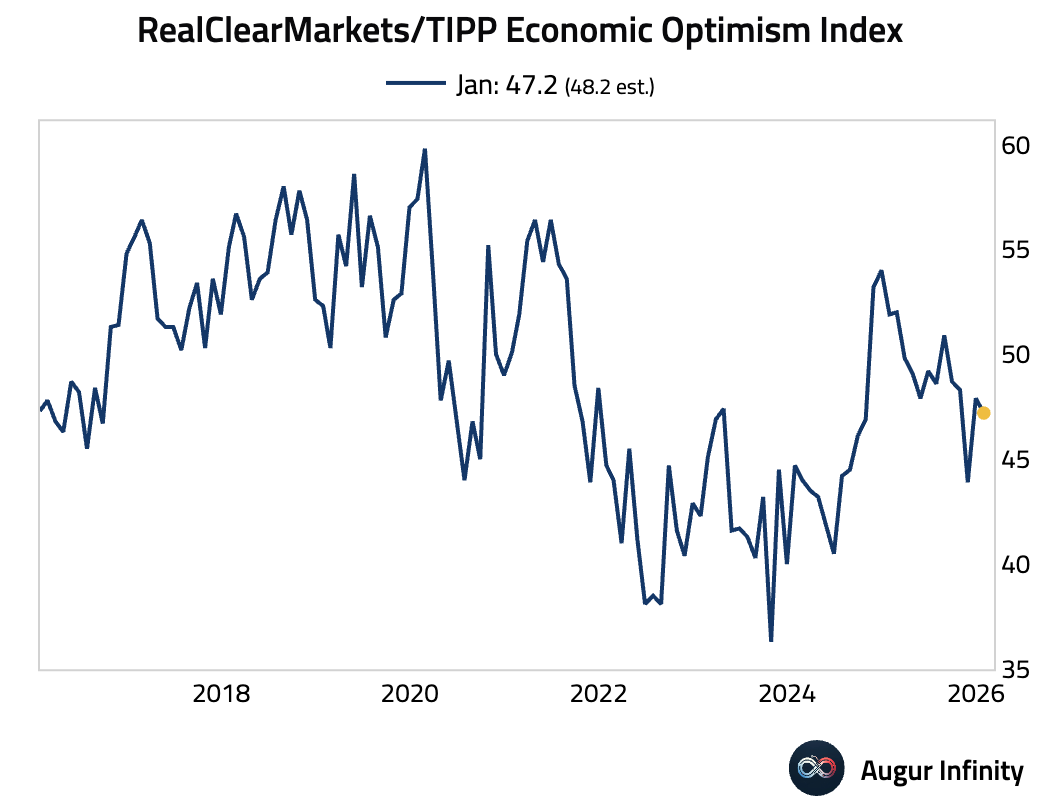
11 The RCM/TIPP Economic Optimism Index ticked down slightly, defying expectations for a further improvement.
Back to Index
Canada
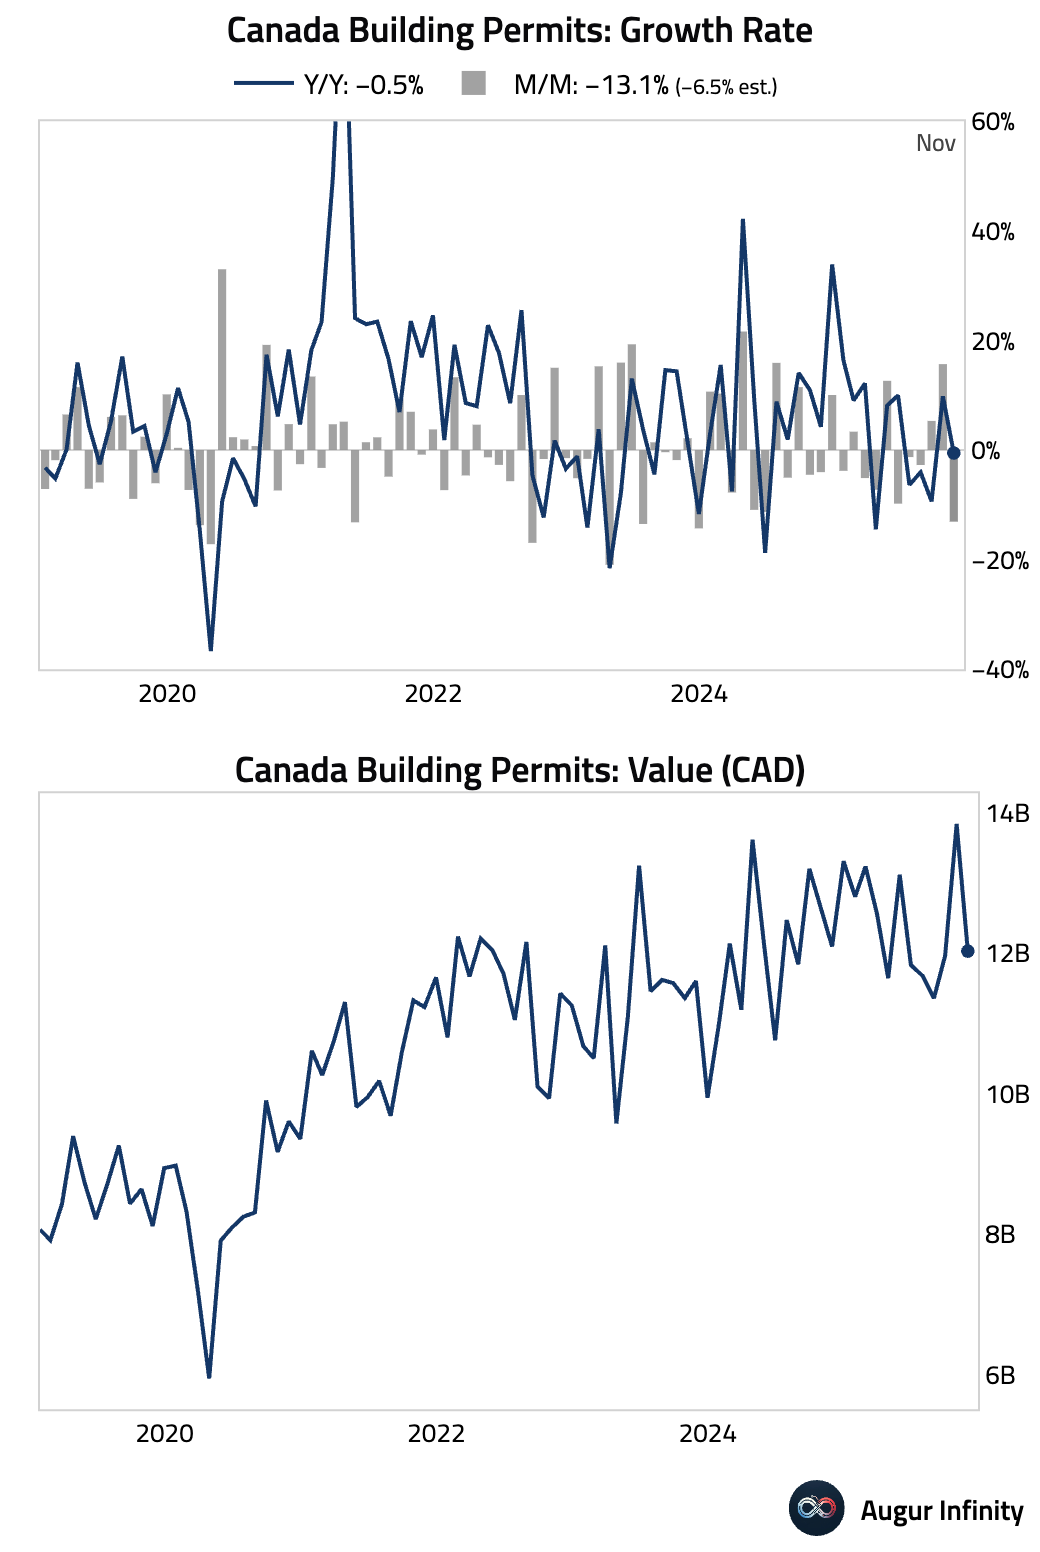
1 Building permits plunged more than expected. This is the largest decline in over two years, suggesting a sharp cooling in the construction sector.
Back to Index
United Kingdom
Retail sales growth slowed in December.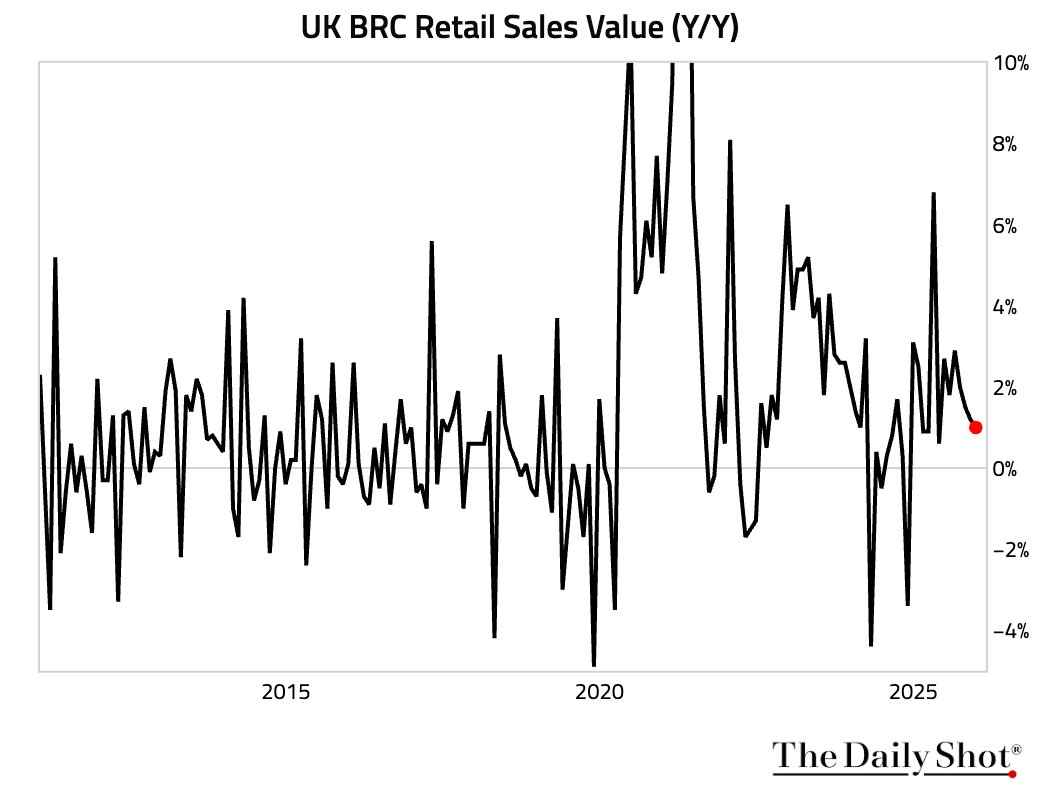 Source: British Retail Consortium
Back to Index
The Eurozone
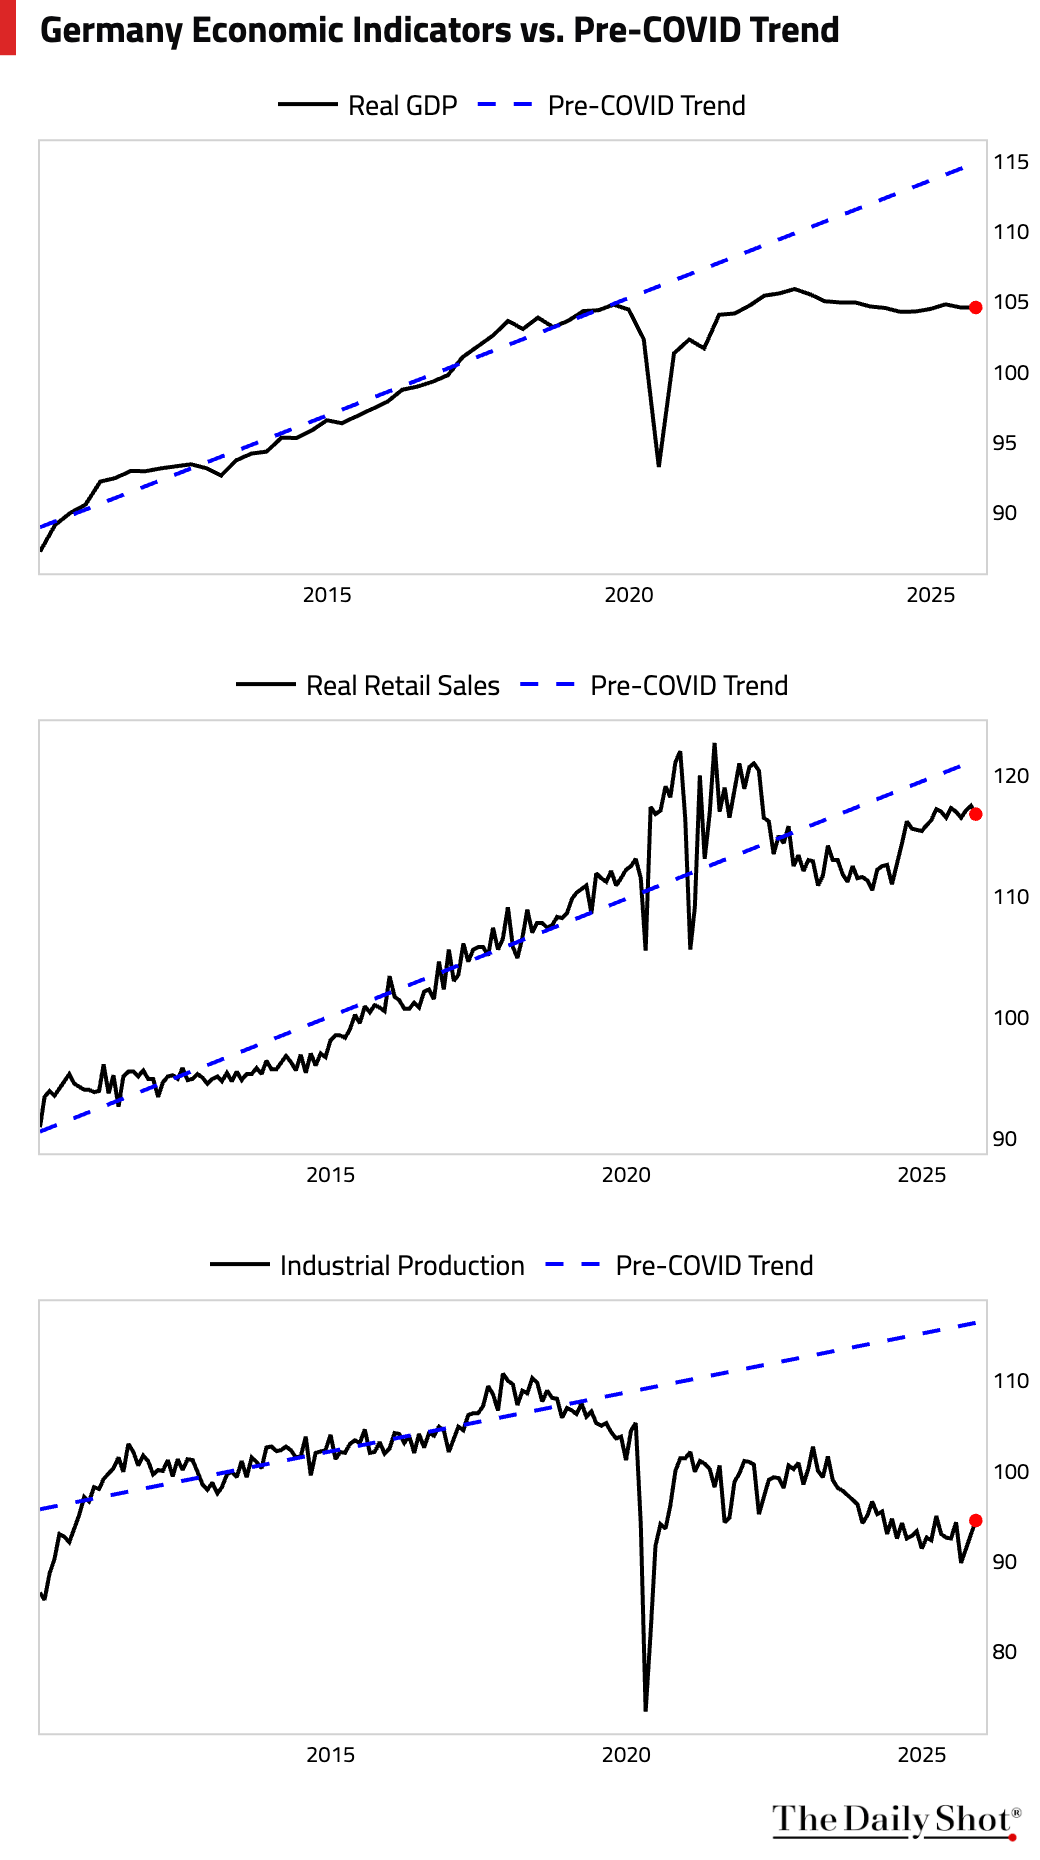
1 Germany’s weekly activity index edged up above zero.
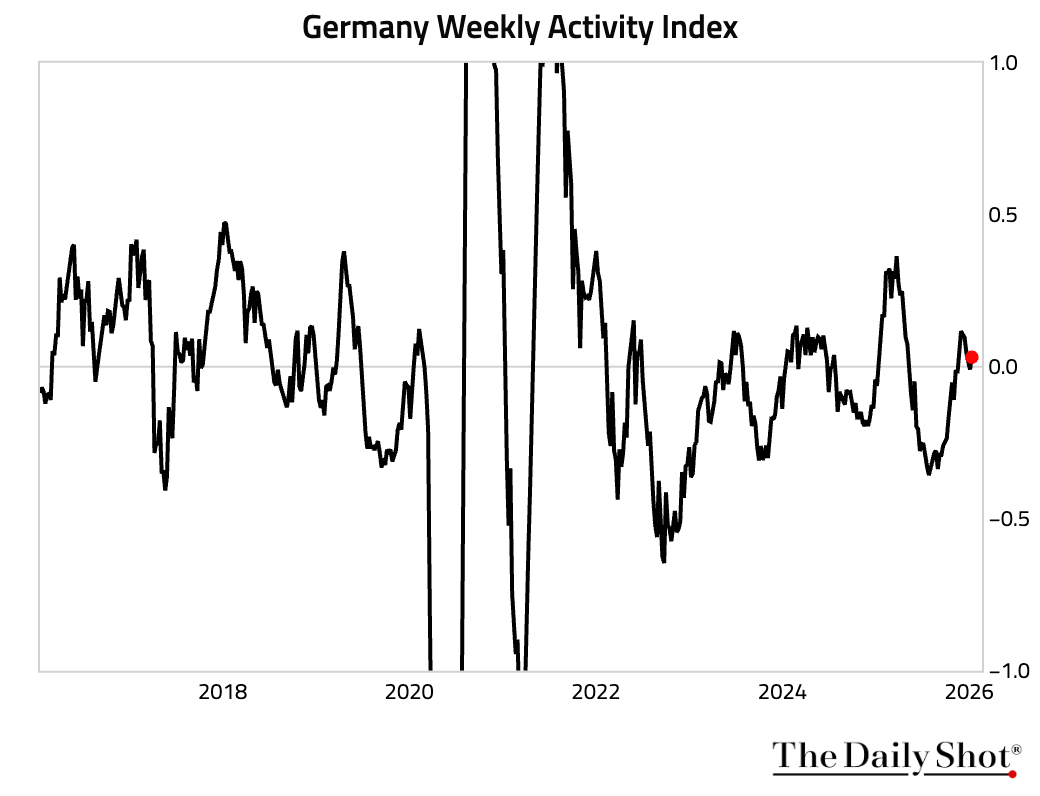
• However, its economic indicators remain well below pre-pandemic trends in level terms.
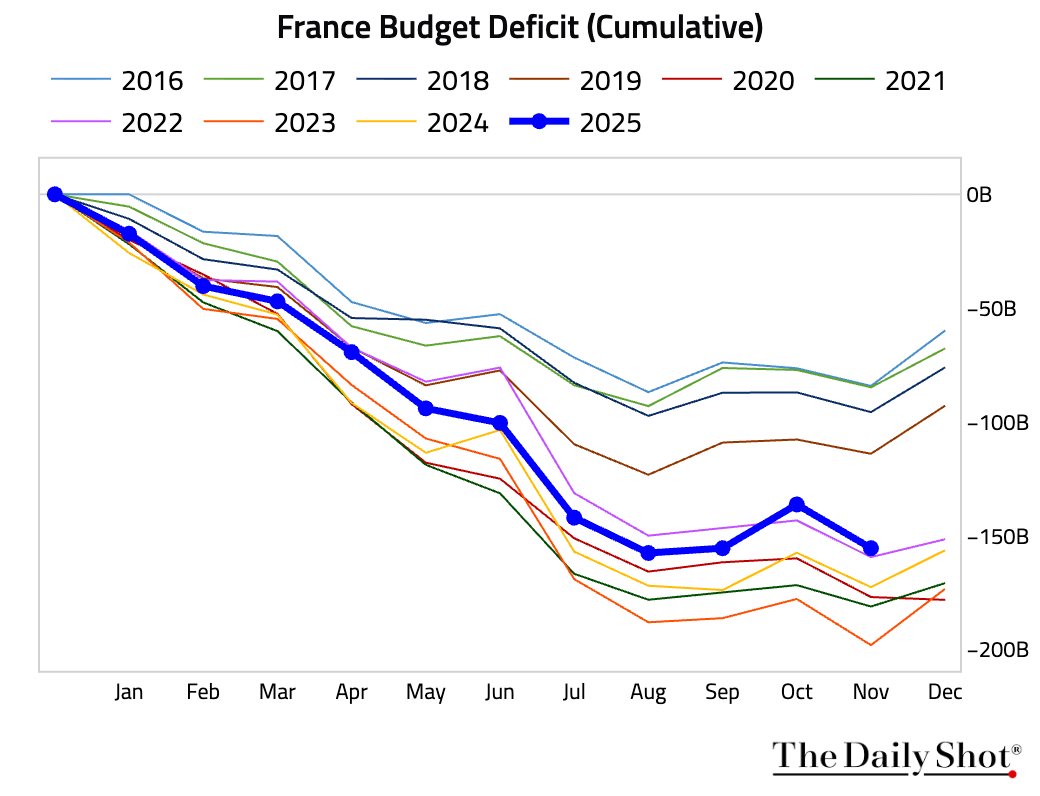
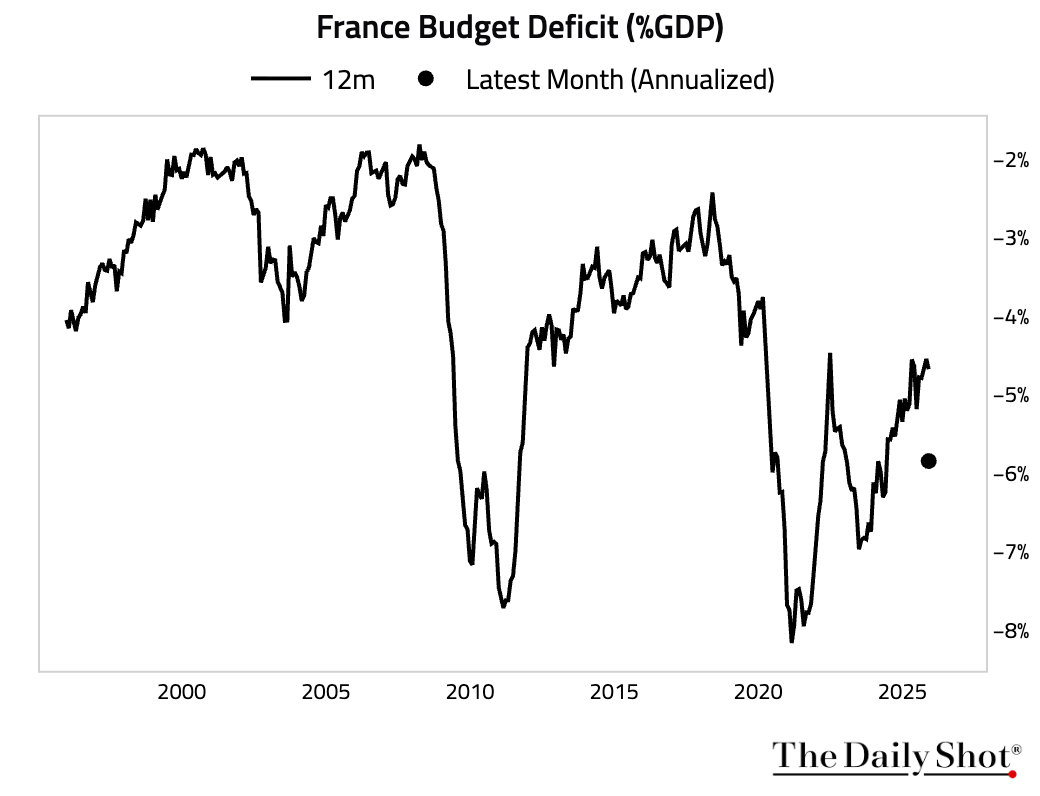
2 France’s budget deficit remained wide.
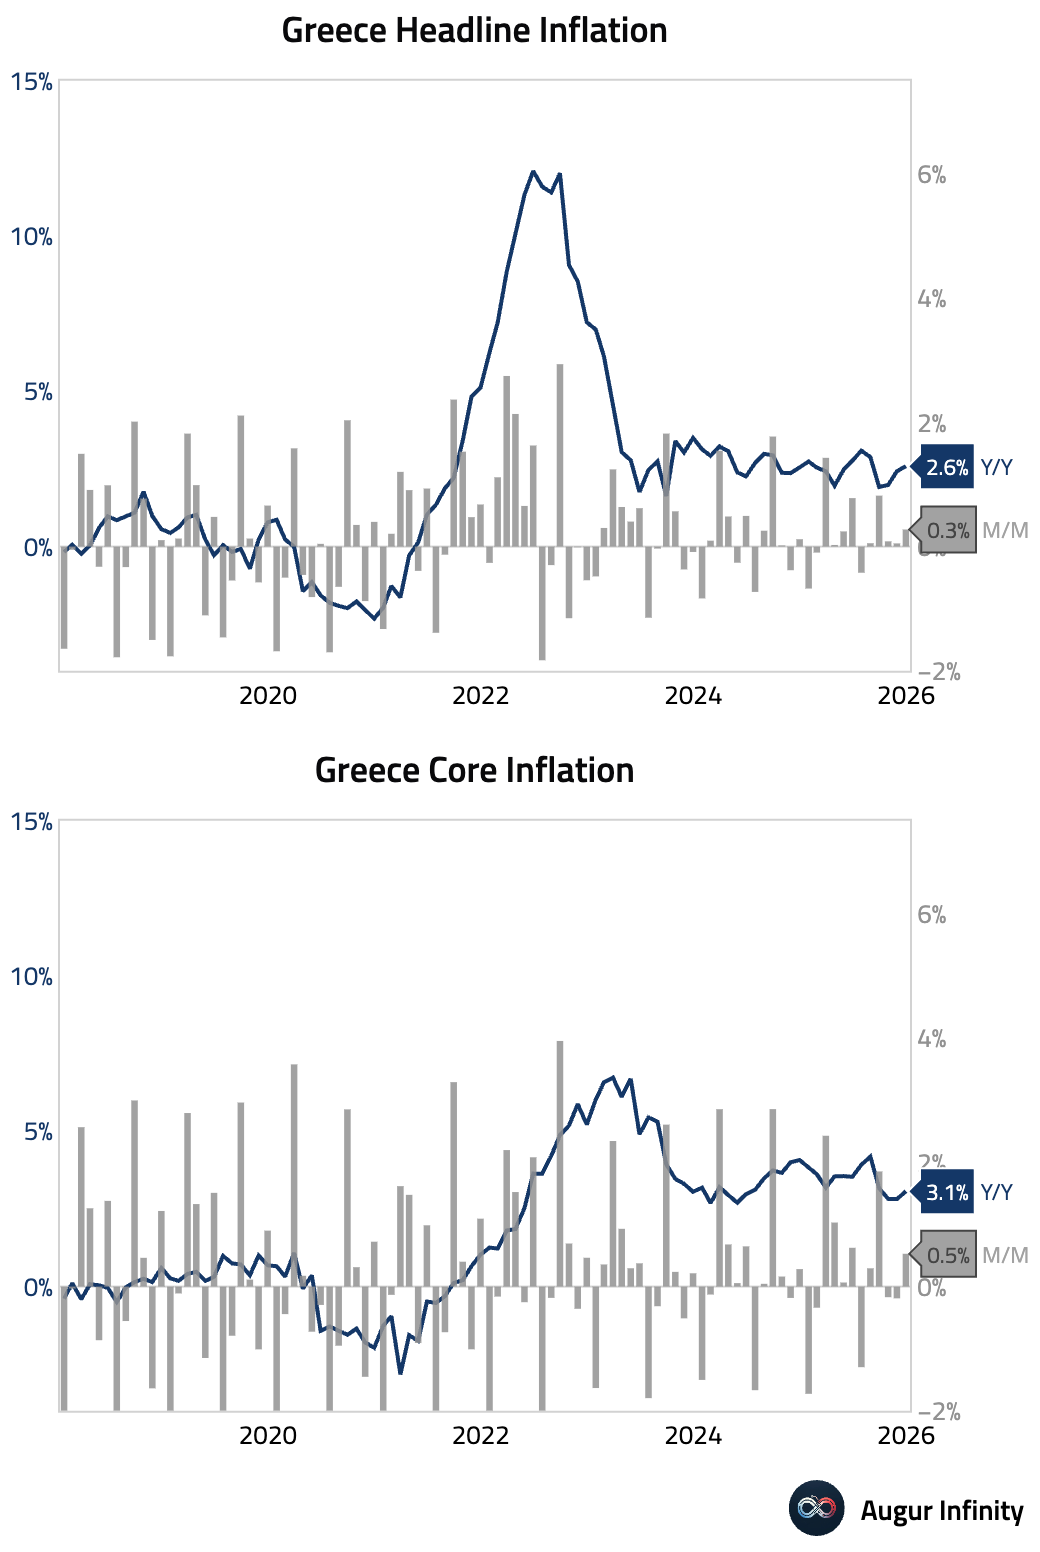
3 Greek inflation accelerated in December.
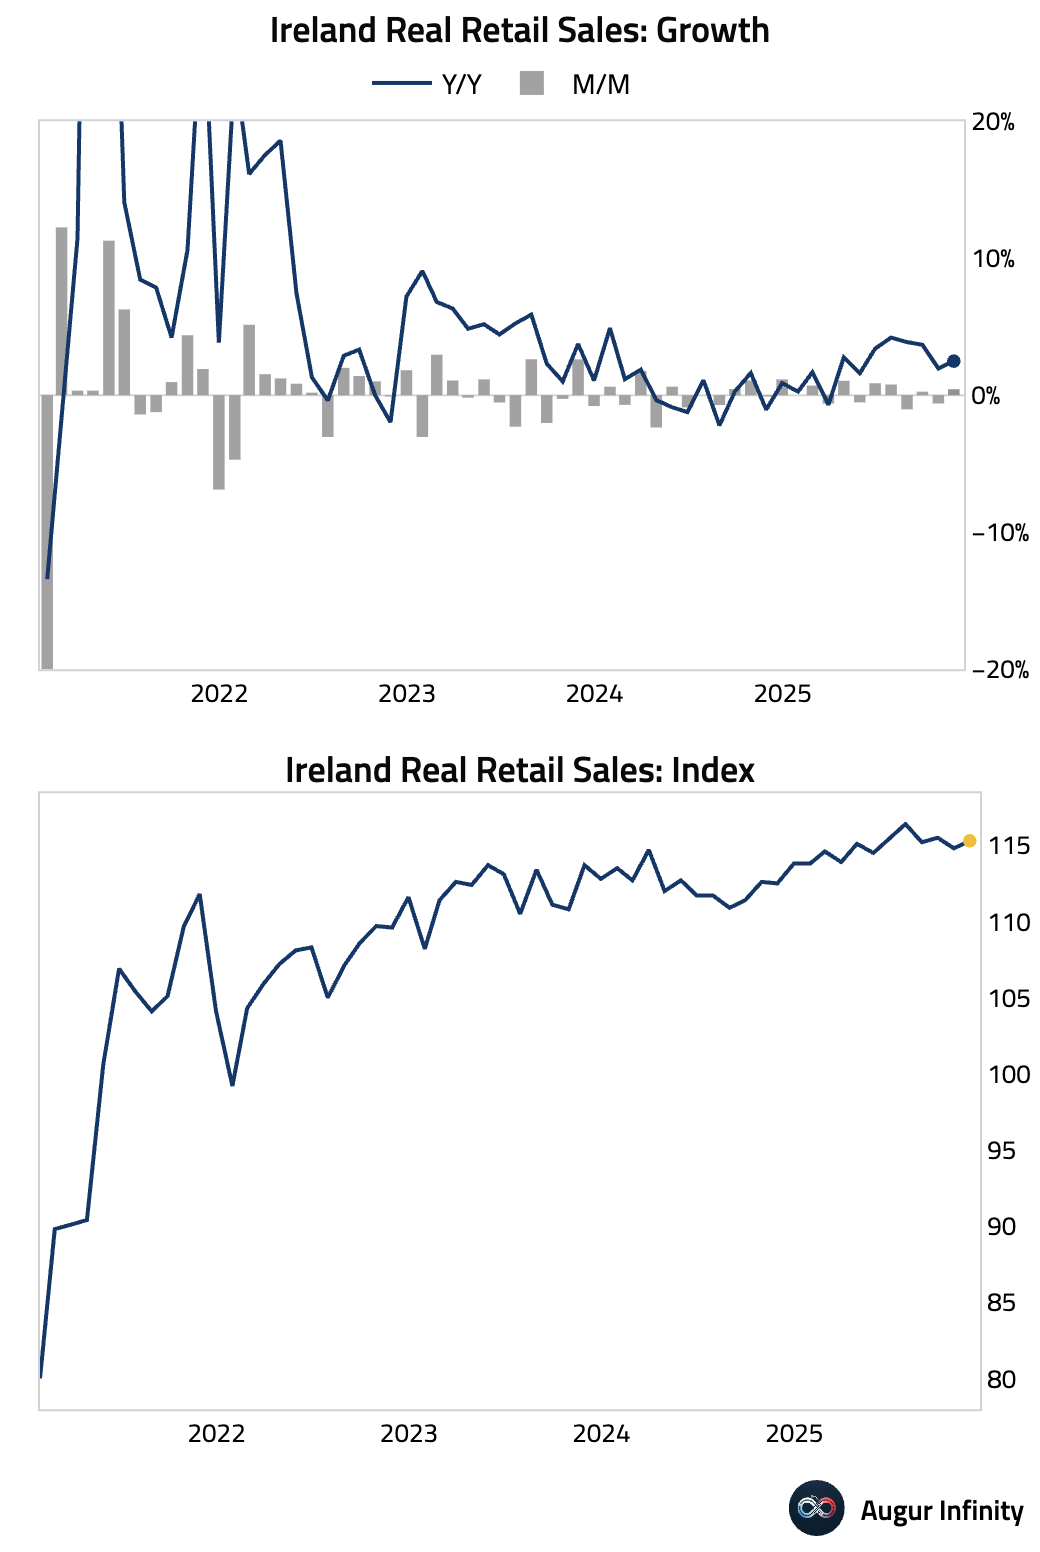
4 Irish retail sales rebounded.
Back to Index
Europe
Hungarian inflation cooled further in December.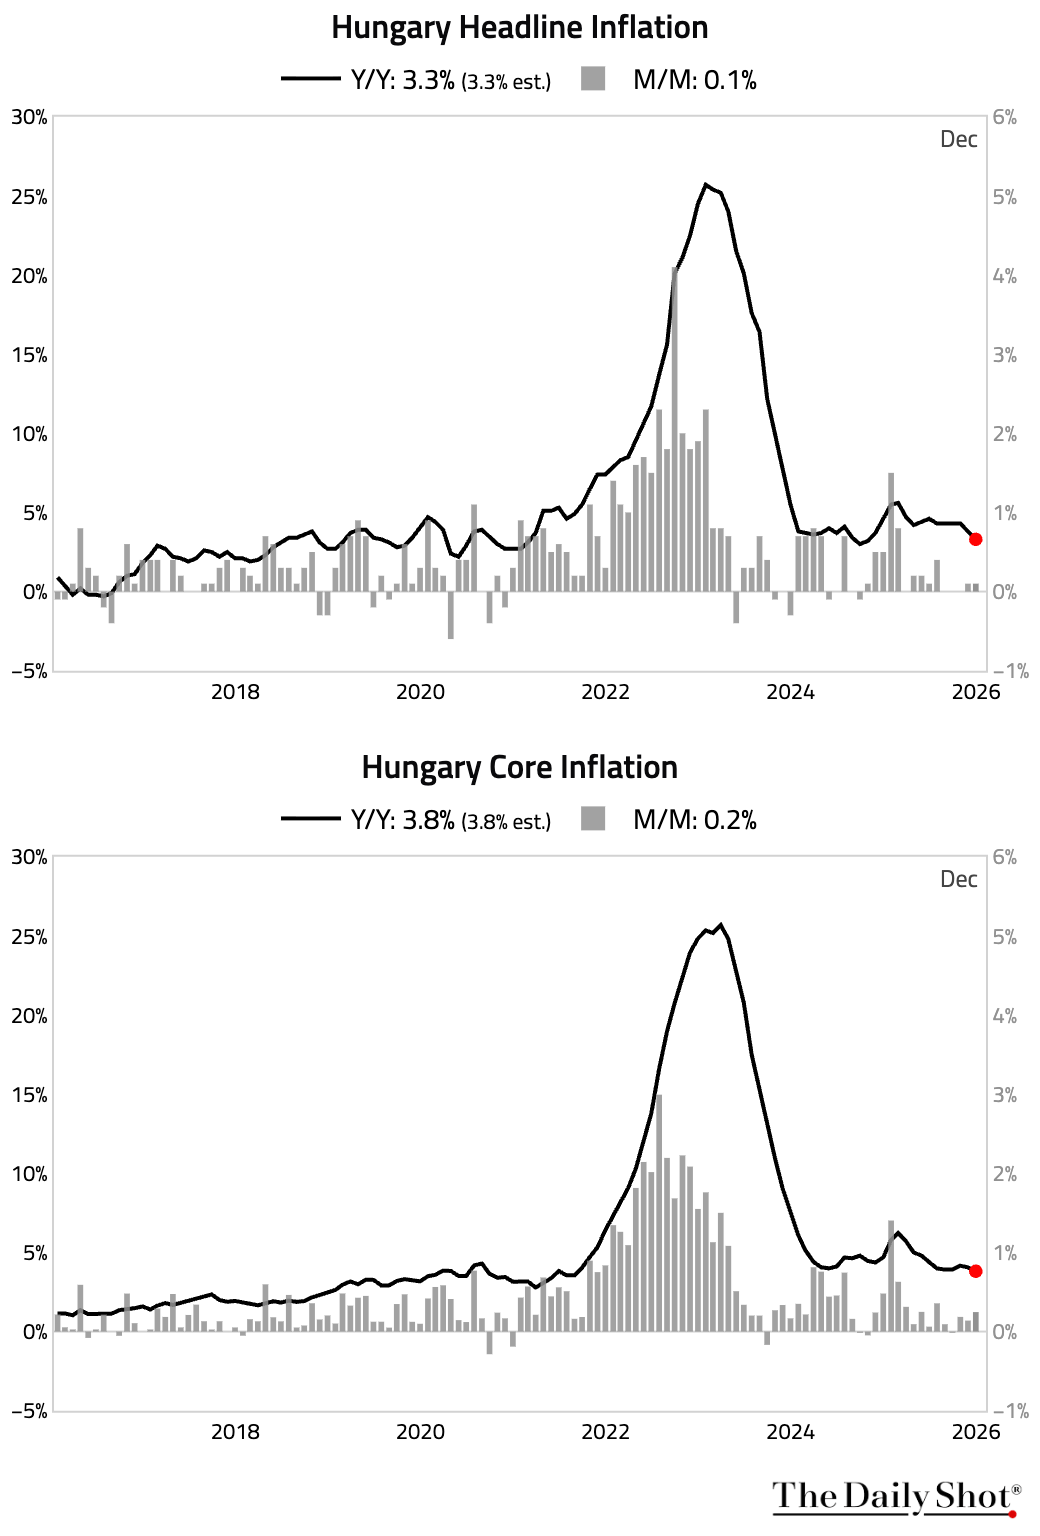
Back to Index
Japan
1 Japanese government bonds sold off as renewed political risks—speculation that Prime Minister Sanae Takaichi may dissolve the Lower House with a possible snap election—fueled concerns over looser fiscal policy.
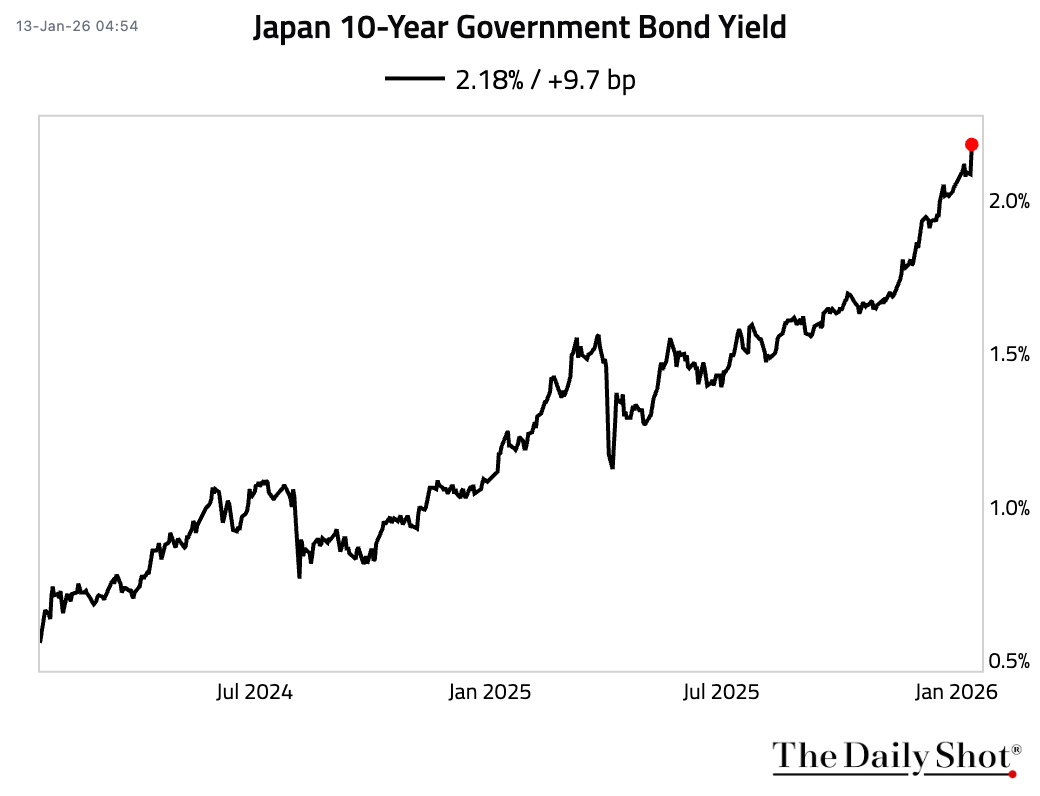
 Source: Bloomberg Read full article
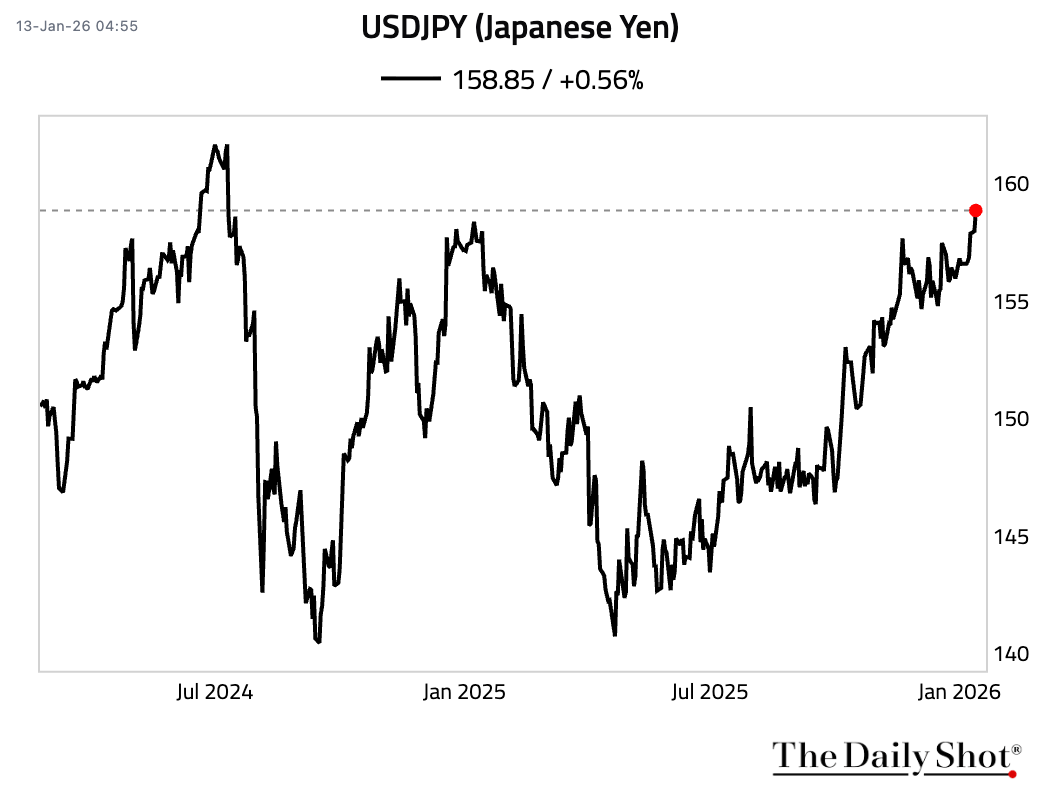
• The yen slid to its weakest level since July 2024.
• The TOPIX Index, on the other hand, surged to another record high.
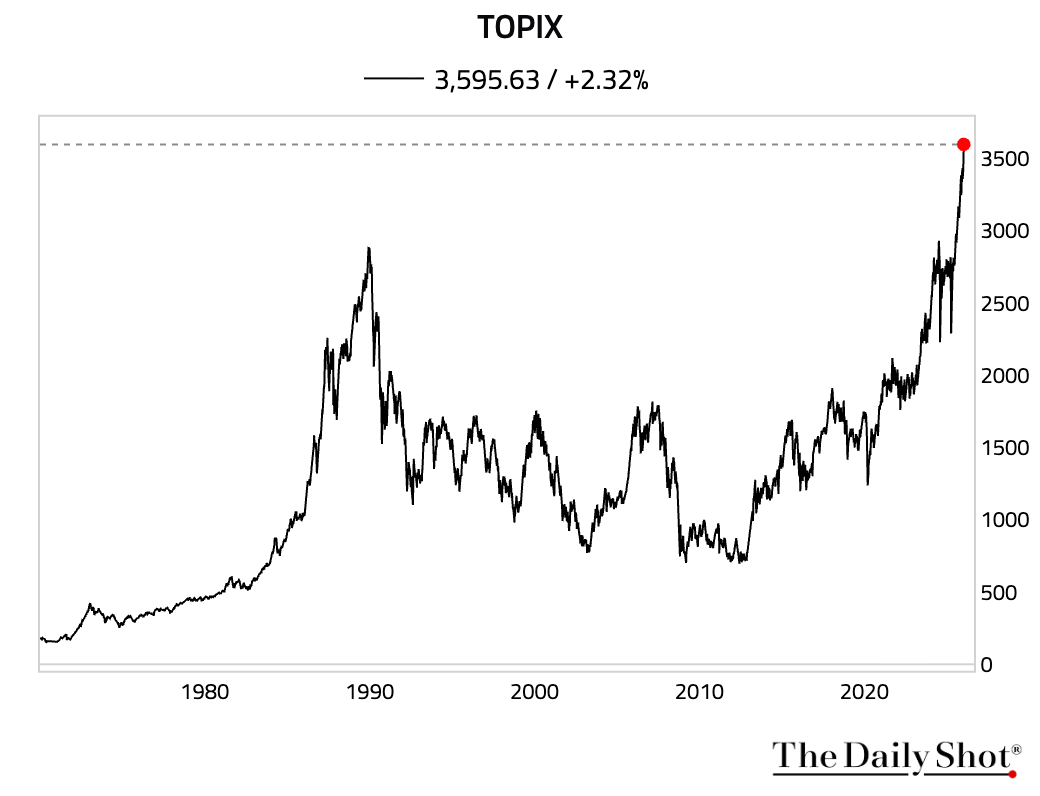
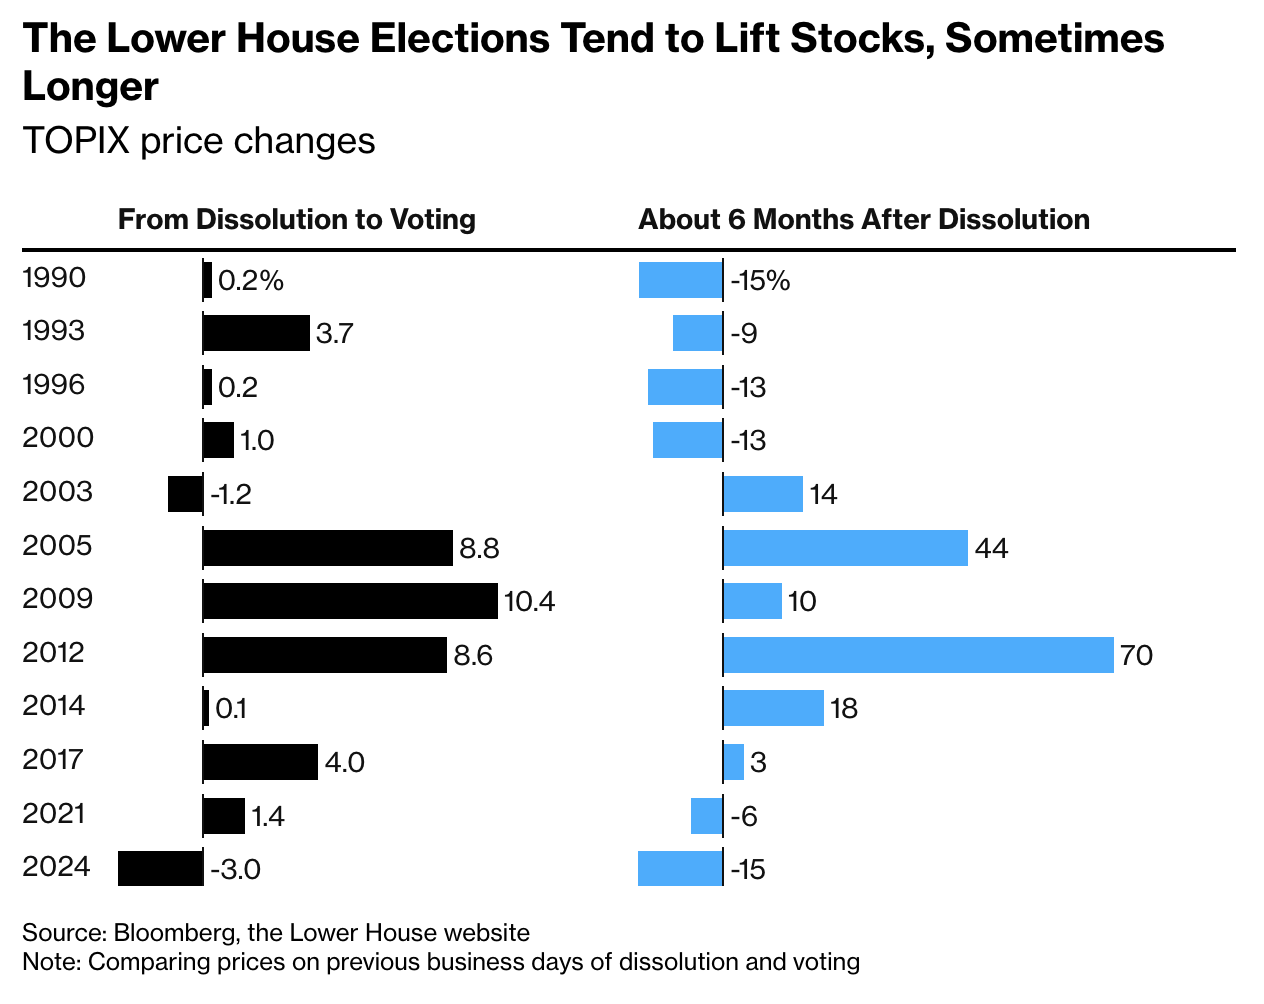
• Historically, TOPIX rose in the near term in ten of the past 12 Lower House election periods since 1990.
 Source: @markets Read full article
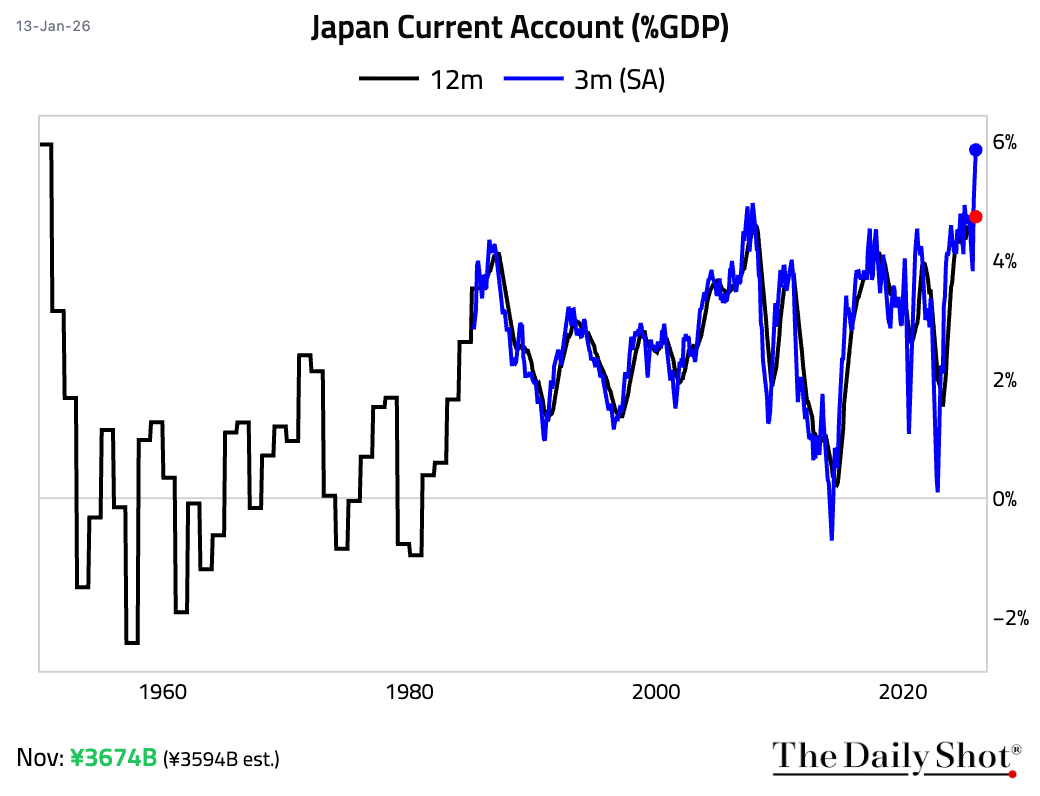
2 The current account surplus widened more than expected in November, driven by a larger trade surplus. The seasonally adjusted 3-month surplus, as a percentage of GDP, was the highest on record.
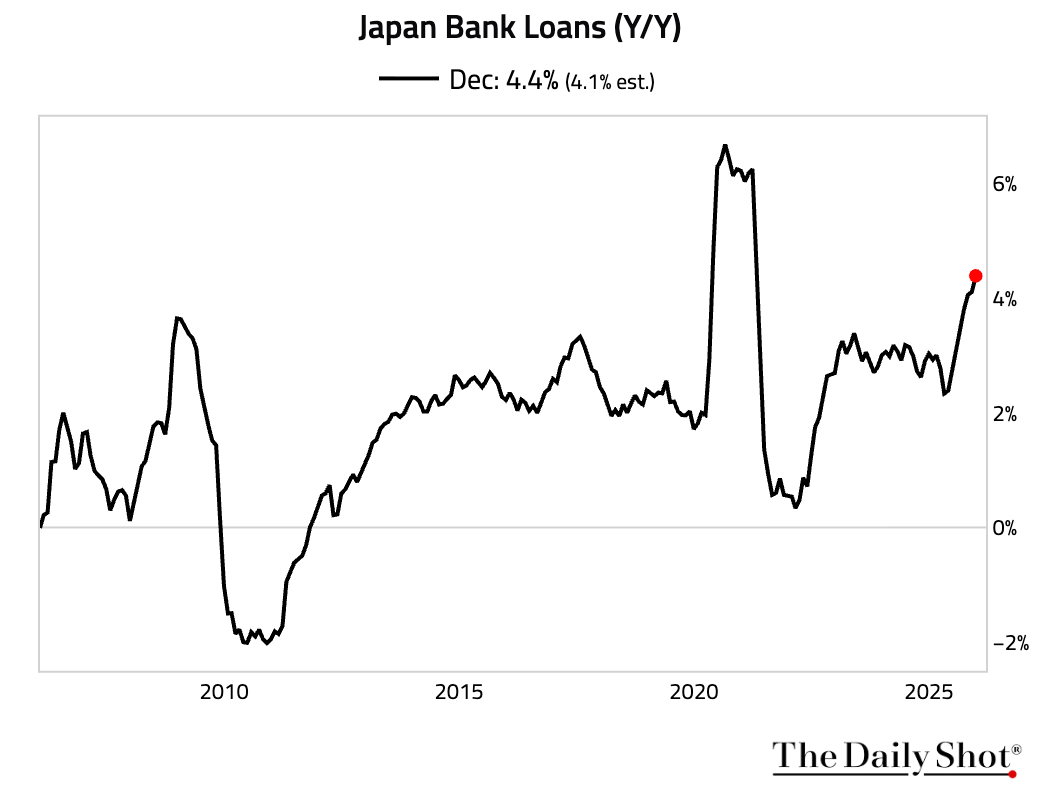
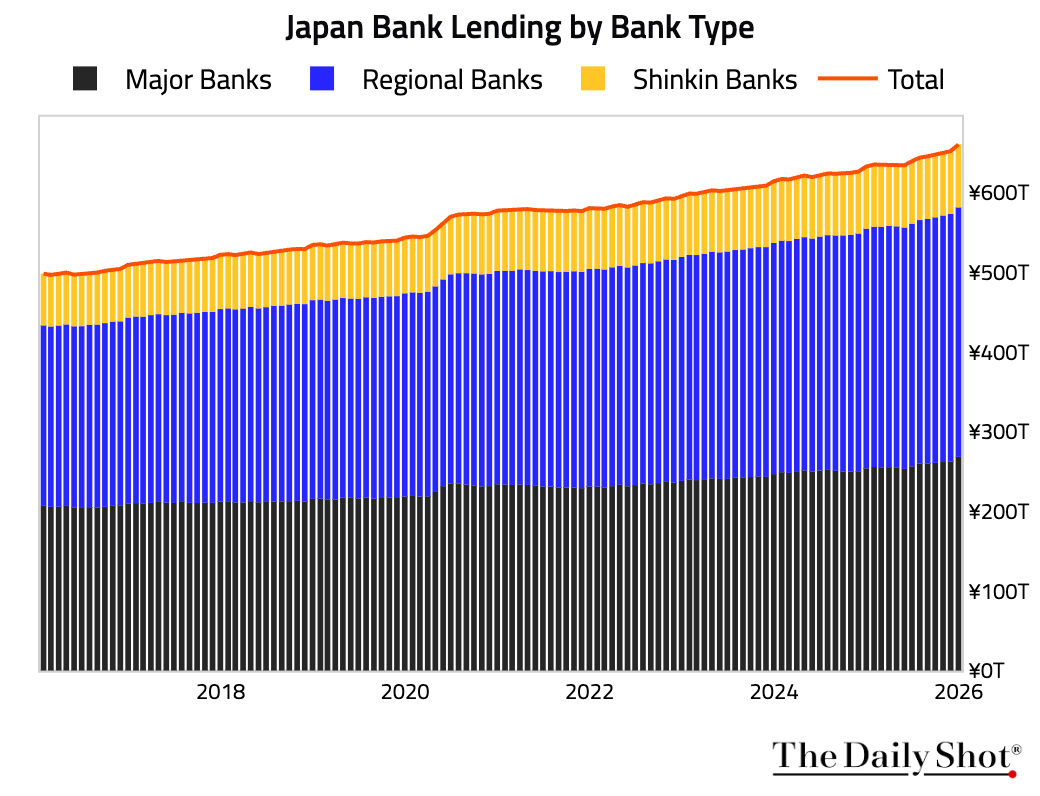
3 Bank lending in Japan accelerated, topping expectations.
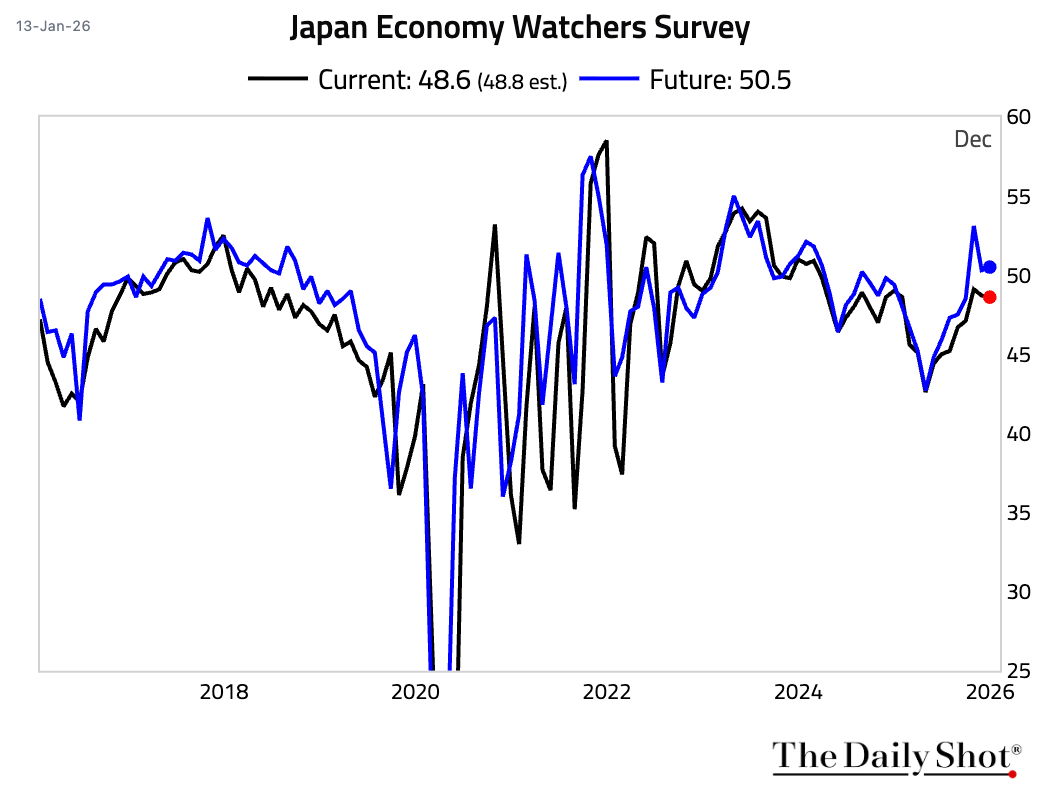
4 The current sentiment component of the Economy Watchers Survey dipped for a second consecutive month, driven by households becoming more selective in their consumption amid high prices. The outlook component, however, ticked up slightly.
Back to Index
Asia-Pacific
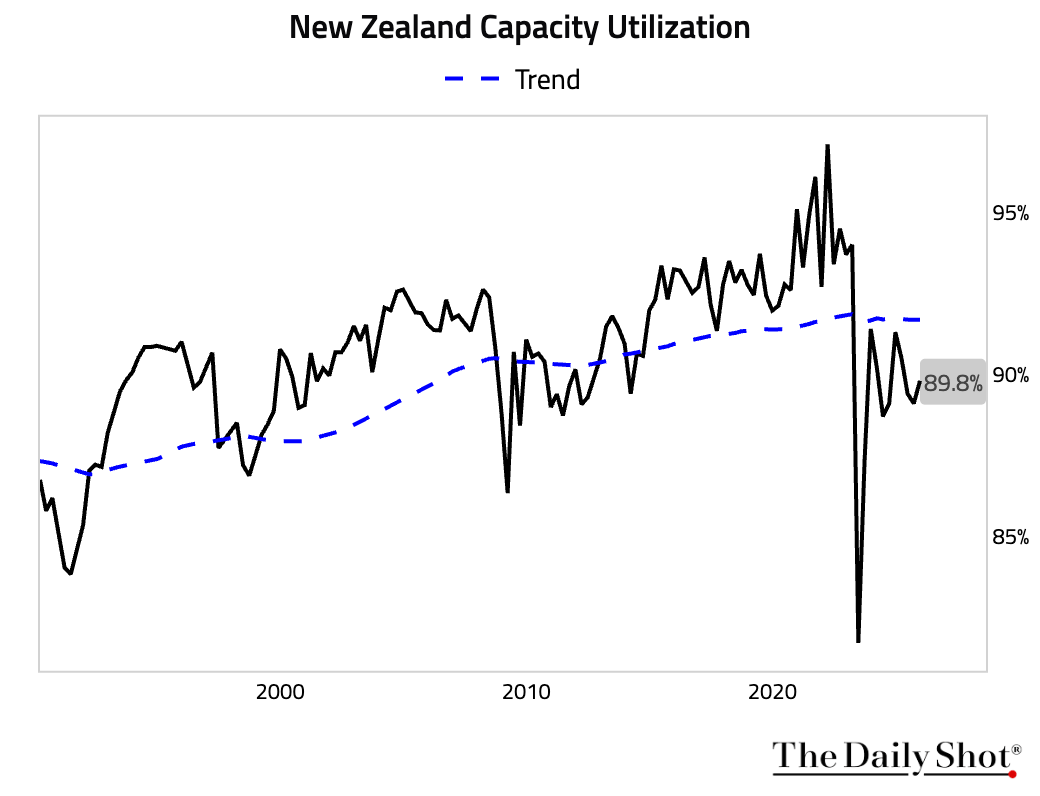
1 New Zealand’s capacity utilization rebounded in Q4.
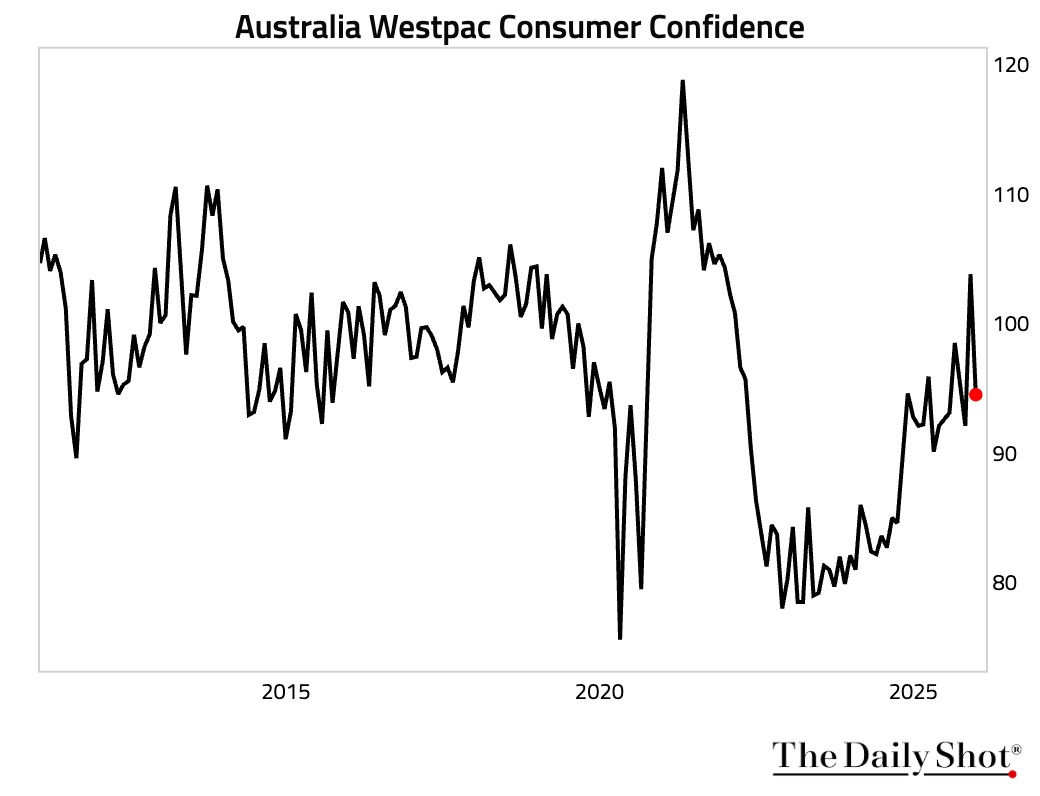
2 Australian consumer sentiment fell sharply, driven by a rise in interest rate expectations, which soured consumers’ views on future economic conditions and their own family finances.
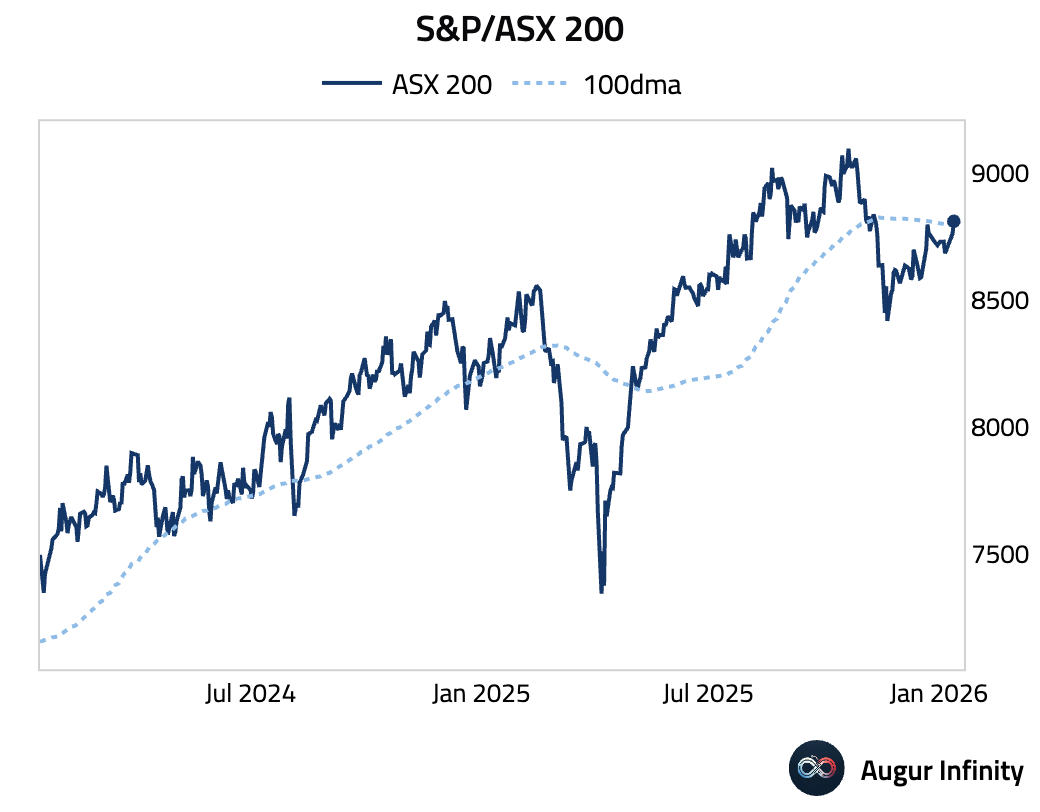
3 S&P/ASX 200 is above its 100-day moving average.
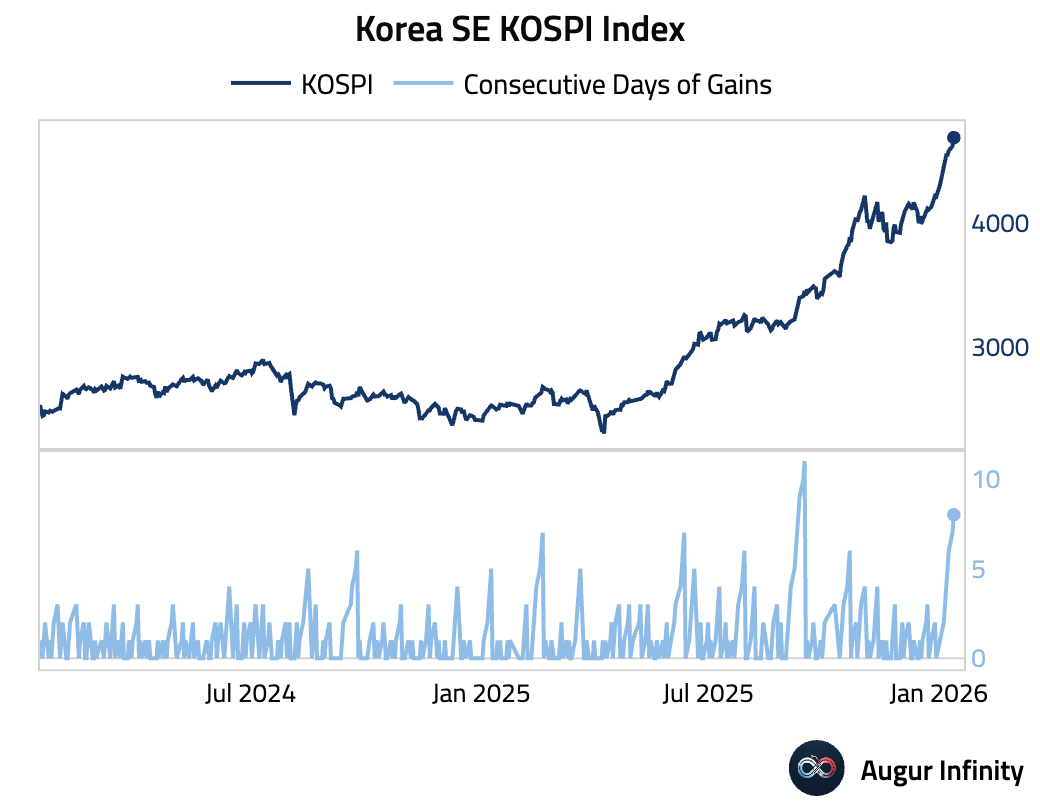
4 Korea SE KOSPI Index has gained for eight consecutive days.
Back to Index
India
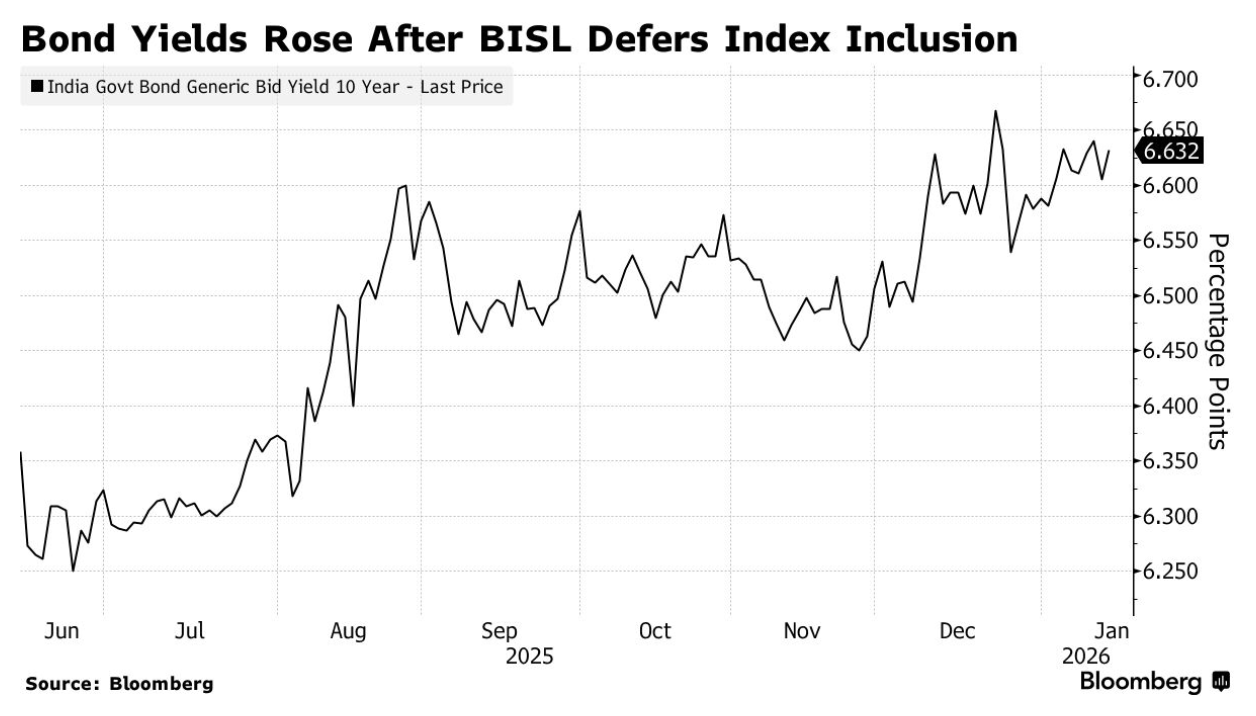
1 Indian government bonds fell after Bloomberg Index Services deferred adding India to its Global Aggregate Index, citing unresolved operational and market-infrastructure issues flagged by investors.
 Source: @markets Read full article
Back to Index
Emerging Markets
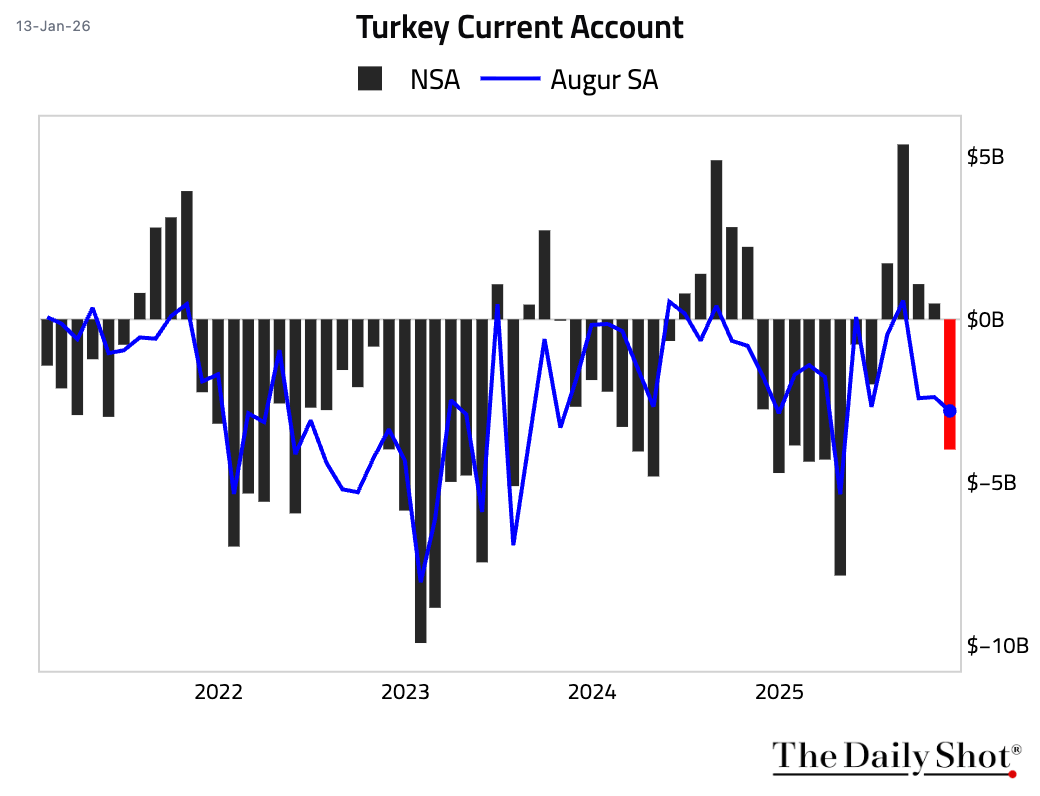
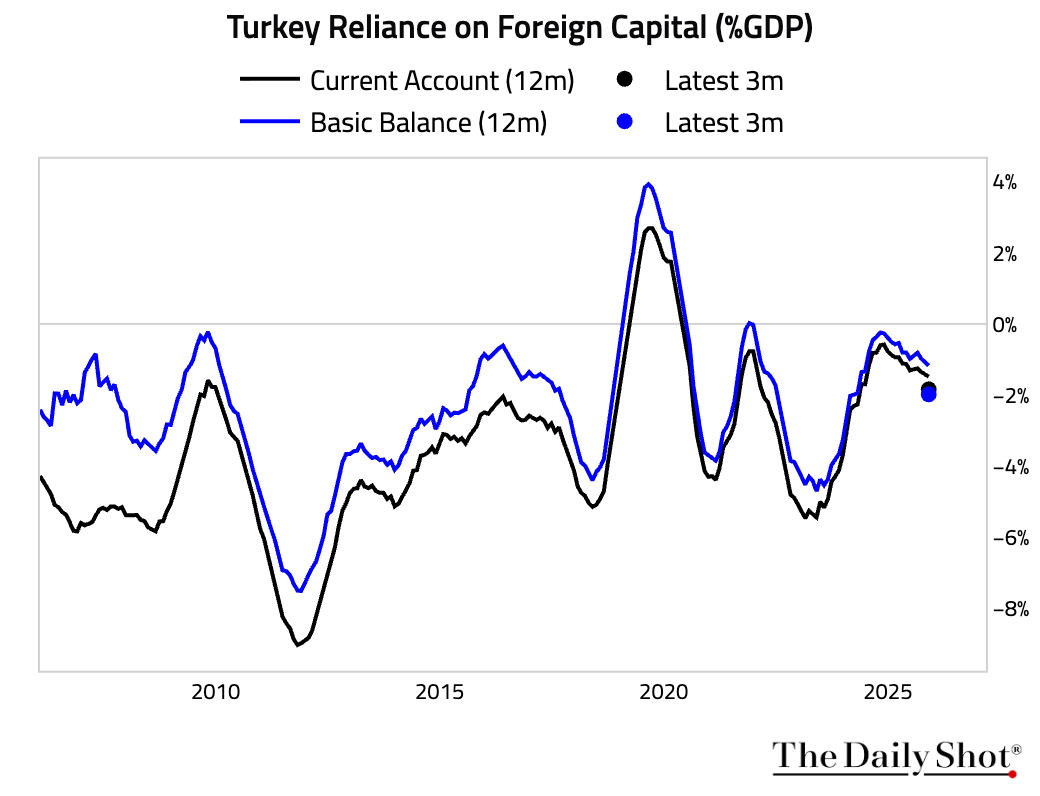
Turkish retail sales growth accelerated month over month.
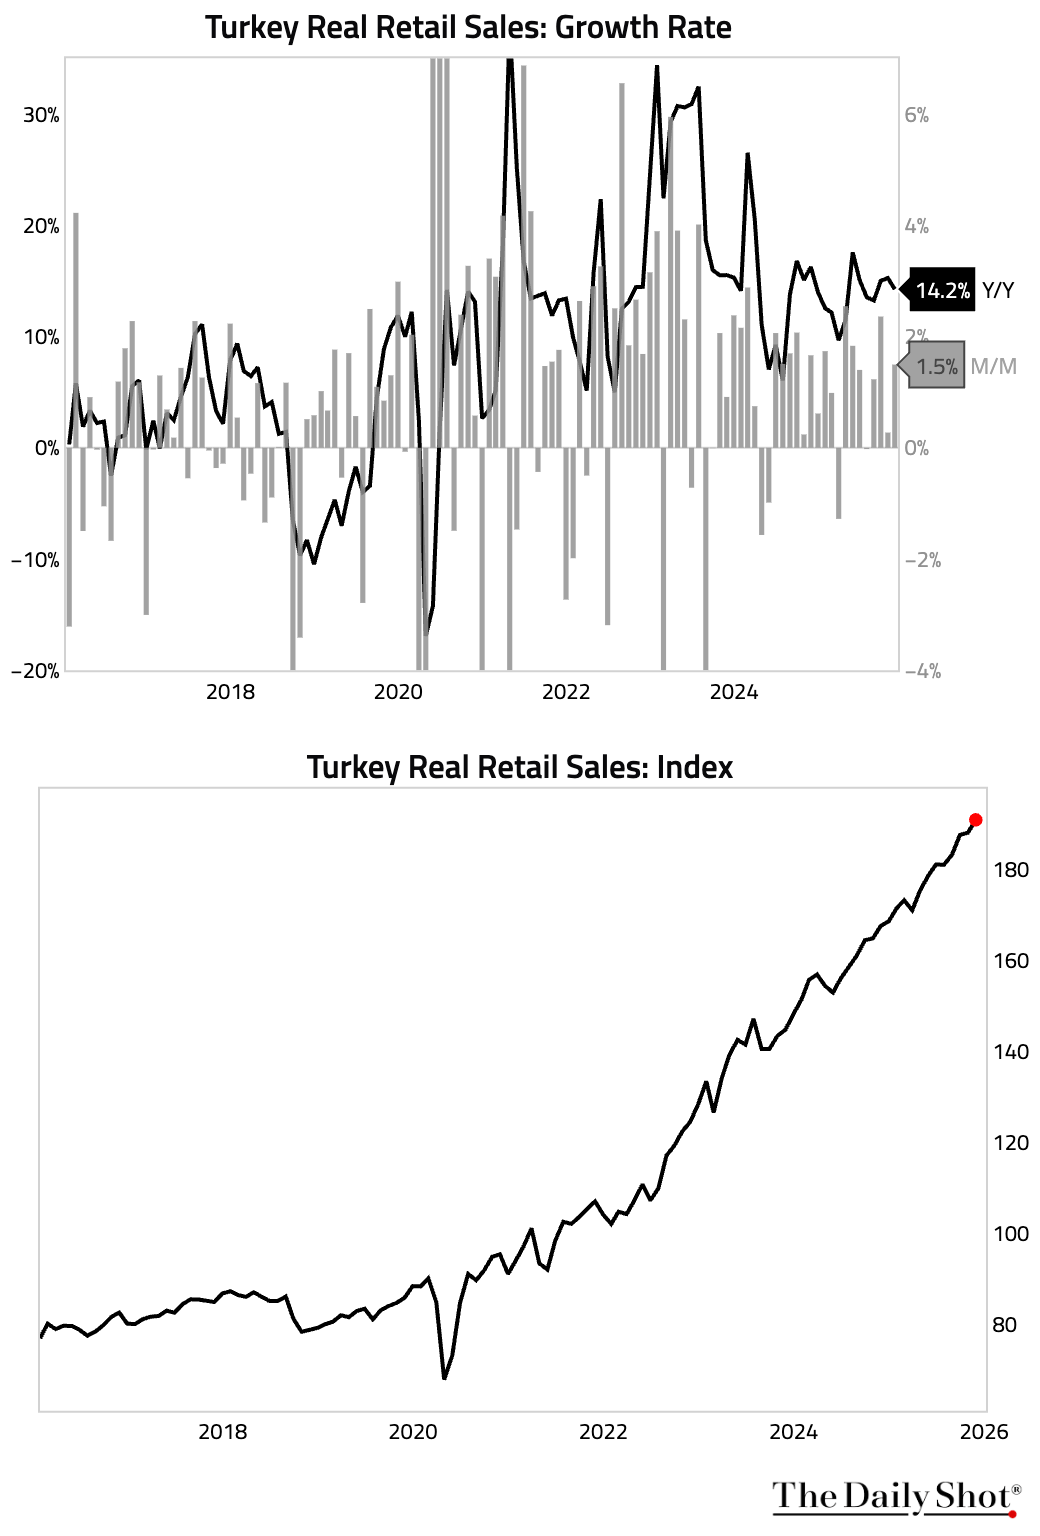
• The current account deteriorated further, underscoring the country’s reliance on foreign capital.
Back to Index
Equities
1 Despite in-line inflation this morning, earnings and international concerns led US equities lower on Tuesday, with the S&P 500 and Nasdaq Composite both declining. Most global markets followed suit, with US-etfs of South Korea (-1.1%) and China (-1.0%) seeing the largest losses. Canada was a notable exception, posting a modest gain for the fourth consecutive day.
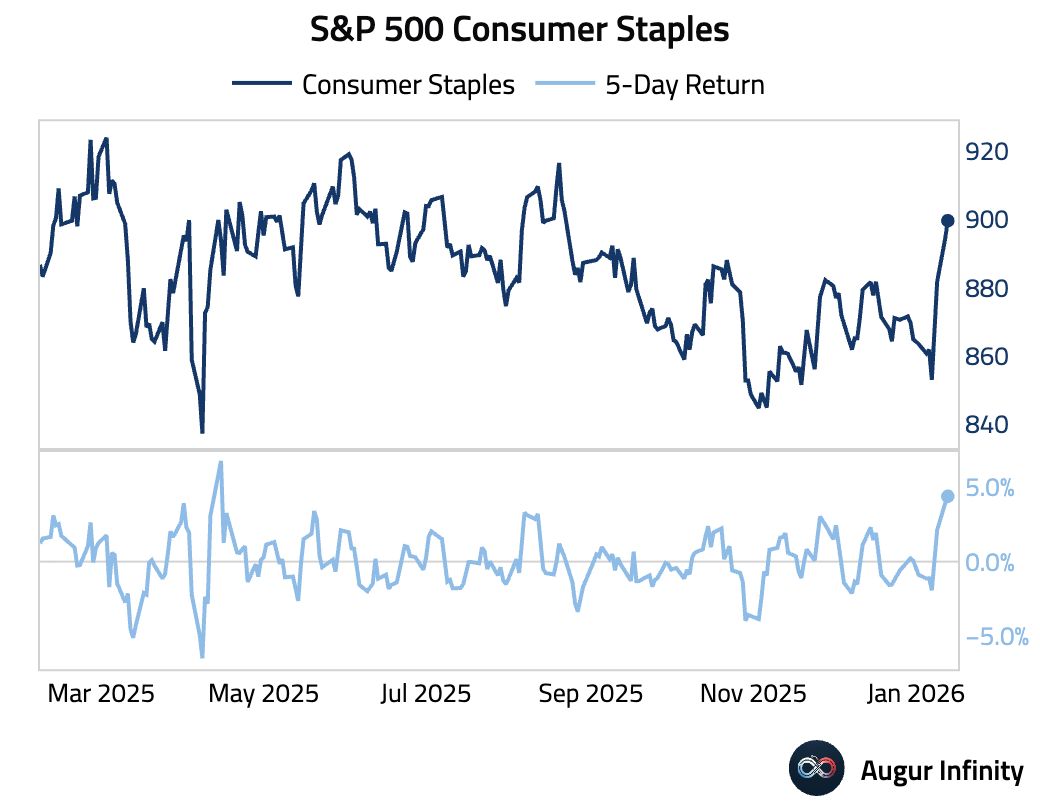
2 Let’s look at equity sectors:
• Consumer staples (best five days since April 2025):
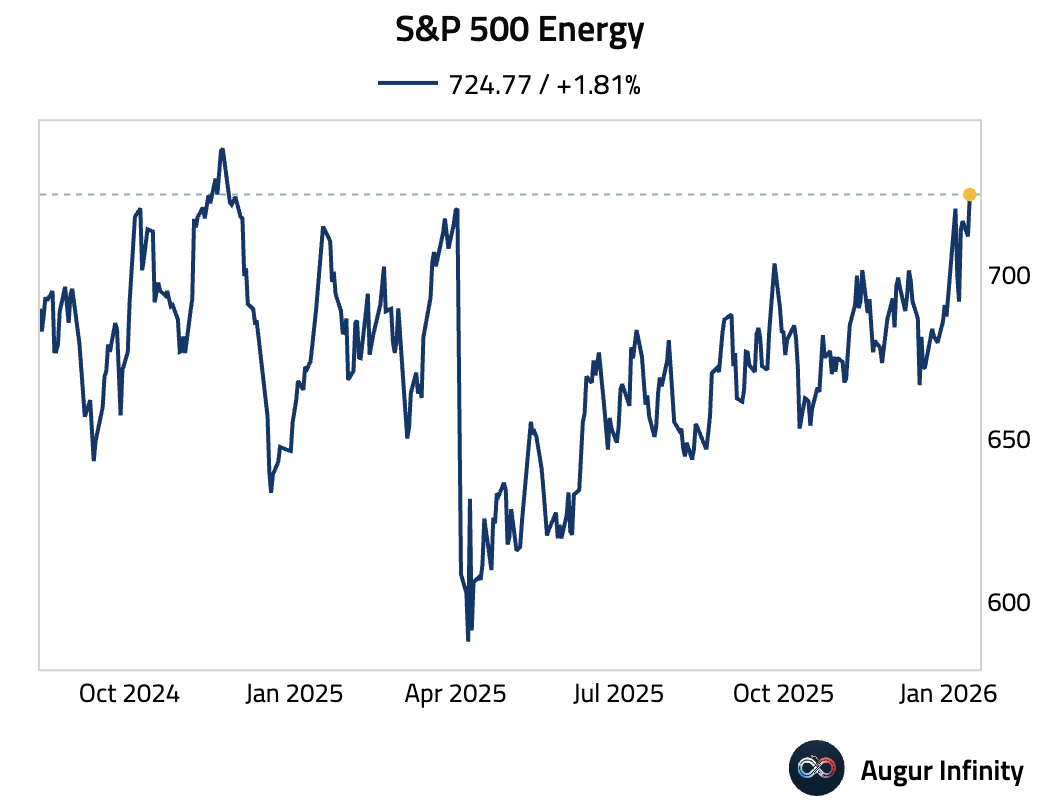
• Energy (highest since November 2024):
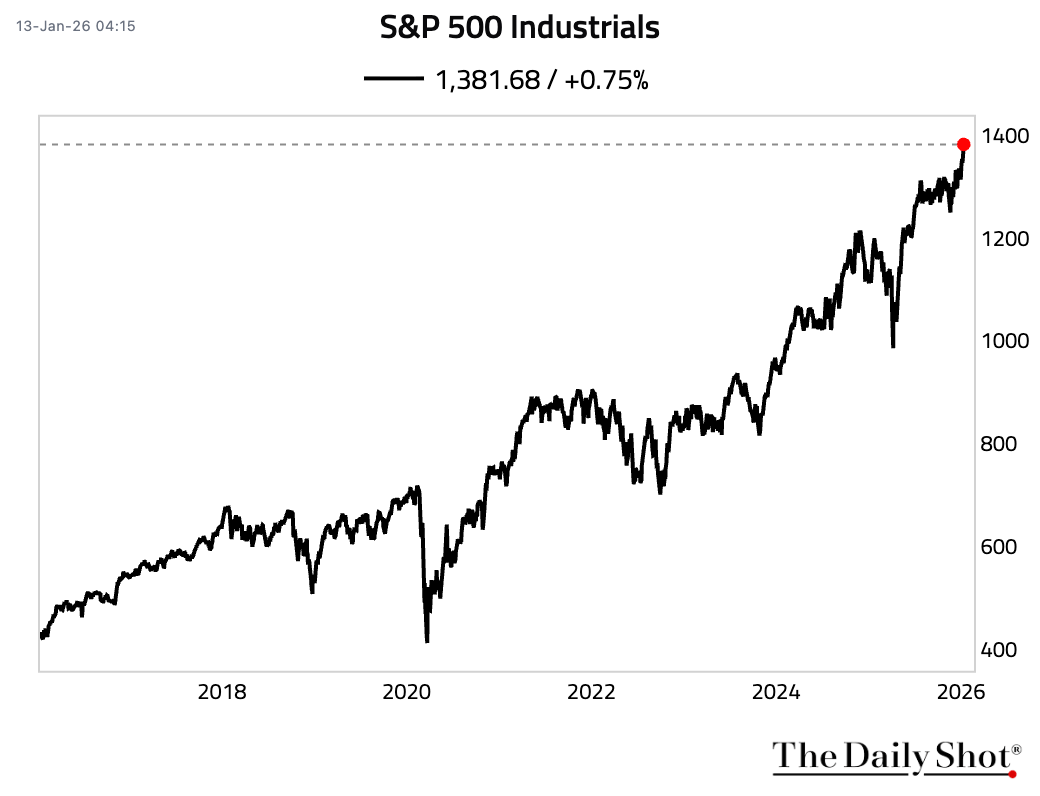
• Industrials (all-time high):
3 US Value vs. Growth Factor is above its 200-day moving average.

4 68% of S&P 500 stocks are above their 200-day moving averages, the first time in over three months. Similar breadth recoveries have been followed by a higher S&P 500 nine months later every time since 2003.
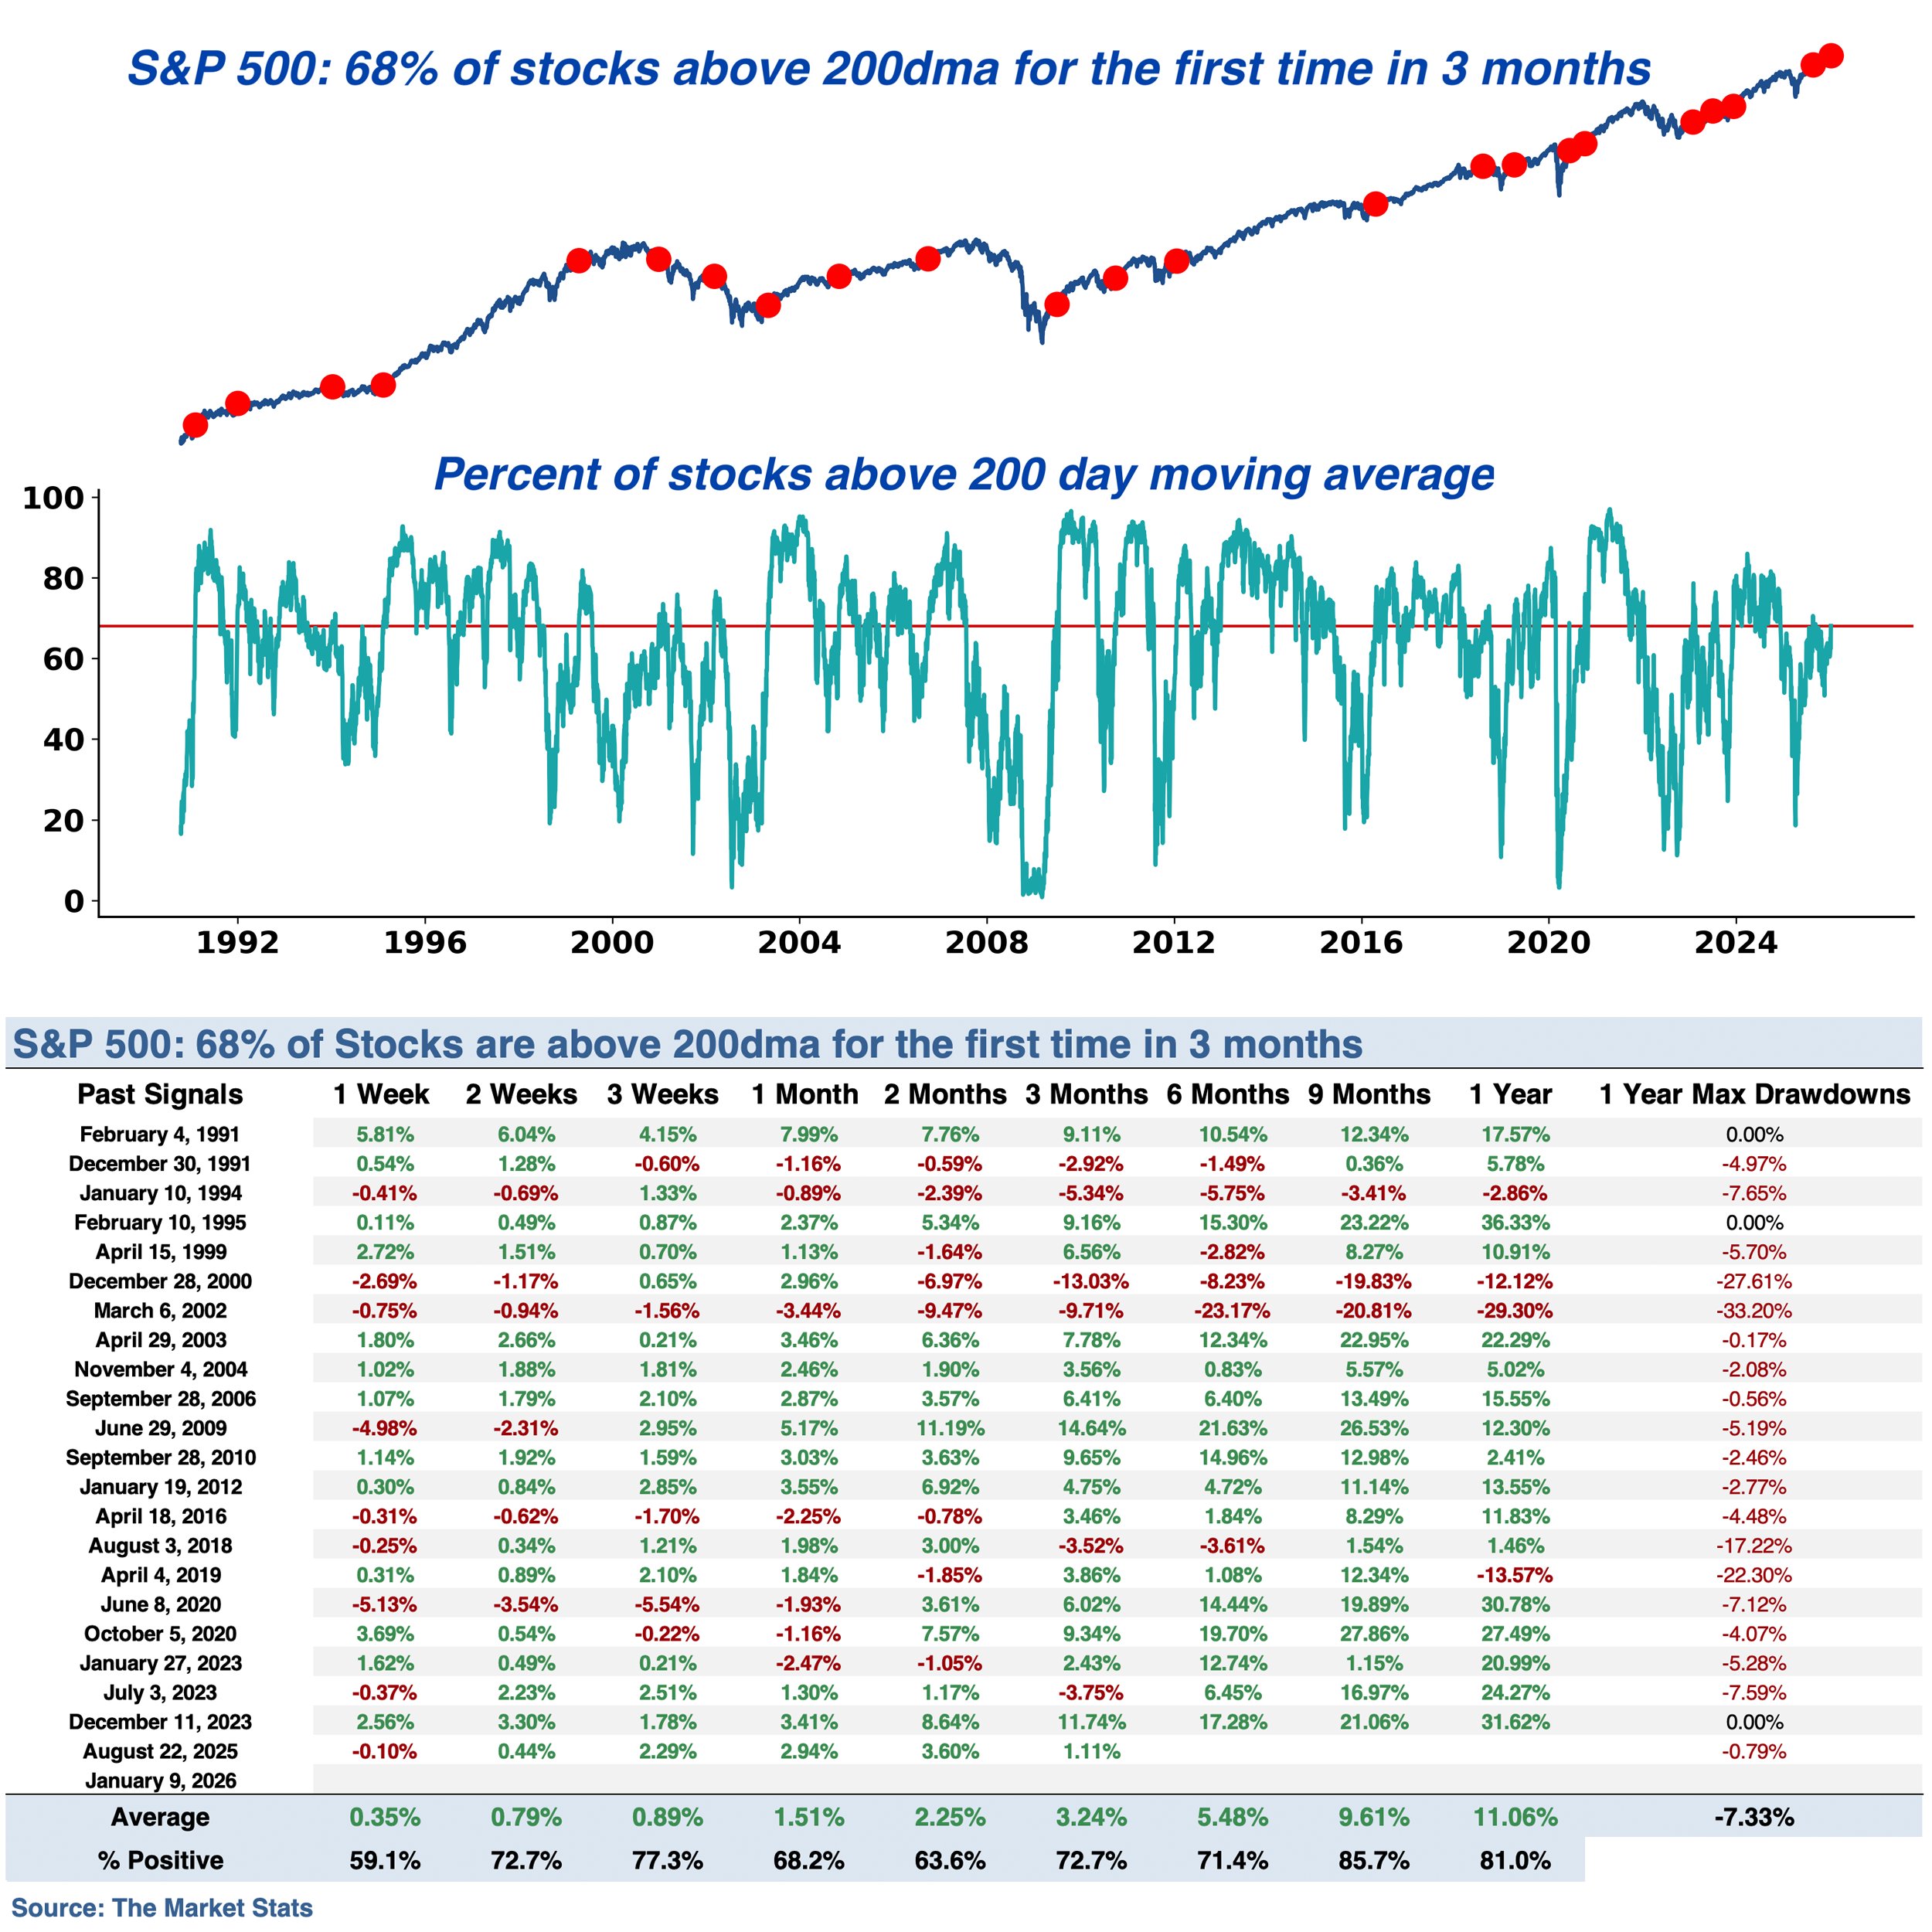 Source: The Market Stats
5 The percentage of S&P 500 members trading at high valuations (based on price-to-sales) is at an extreme.
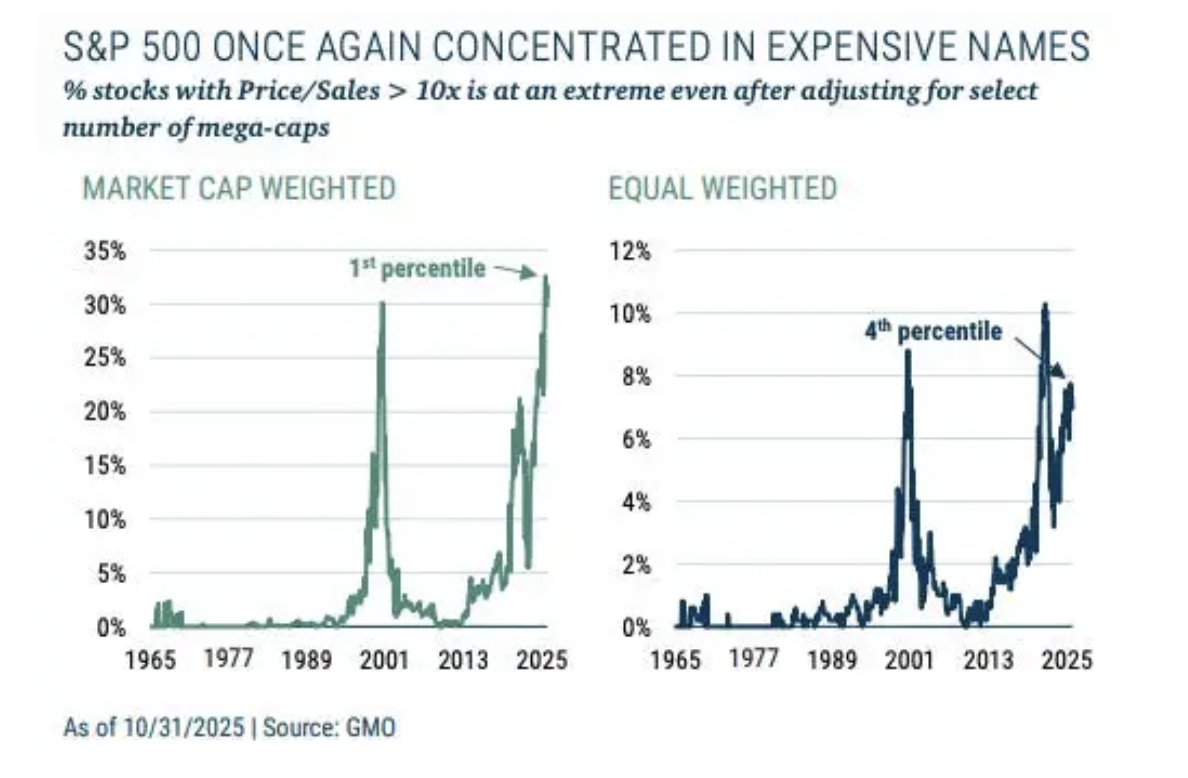 Source: GMO, h/t Snippet Finance
6 Deutsche Bank’s measure of equity positioning has trended sideways over the past two weeks and remains moderately overweight.
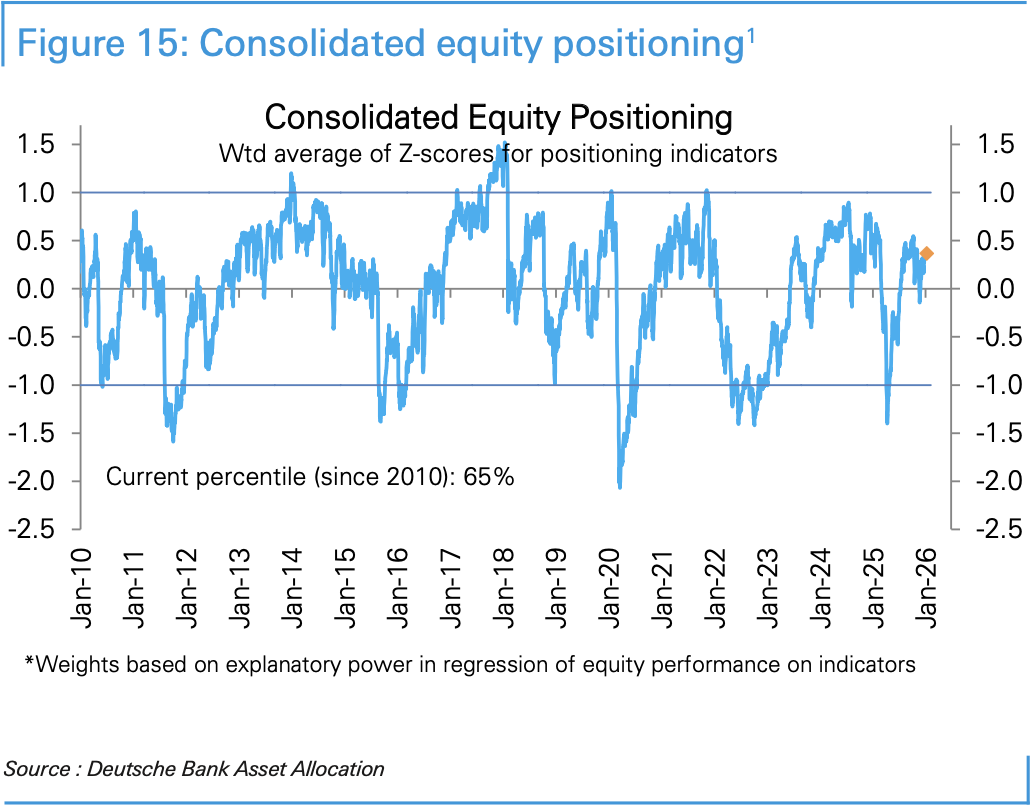 Source: Deutsche Bank Research
• Here is the positioning index by sector.
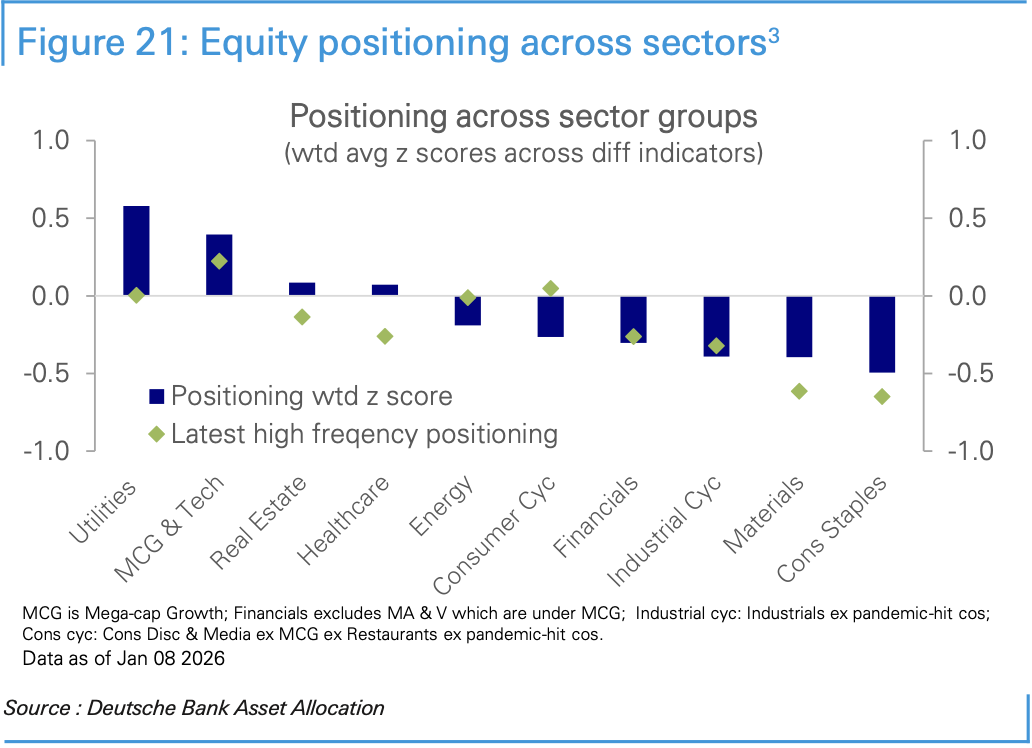 Source: Deutsche Bank Research
Back to Index
Rates
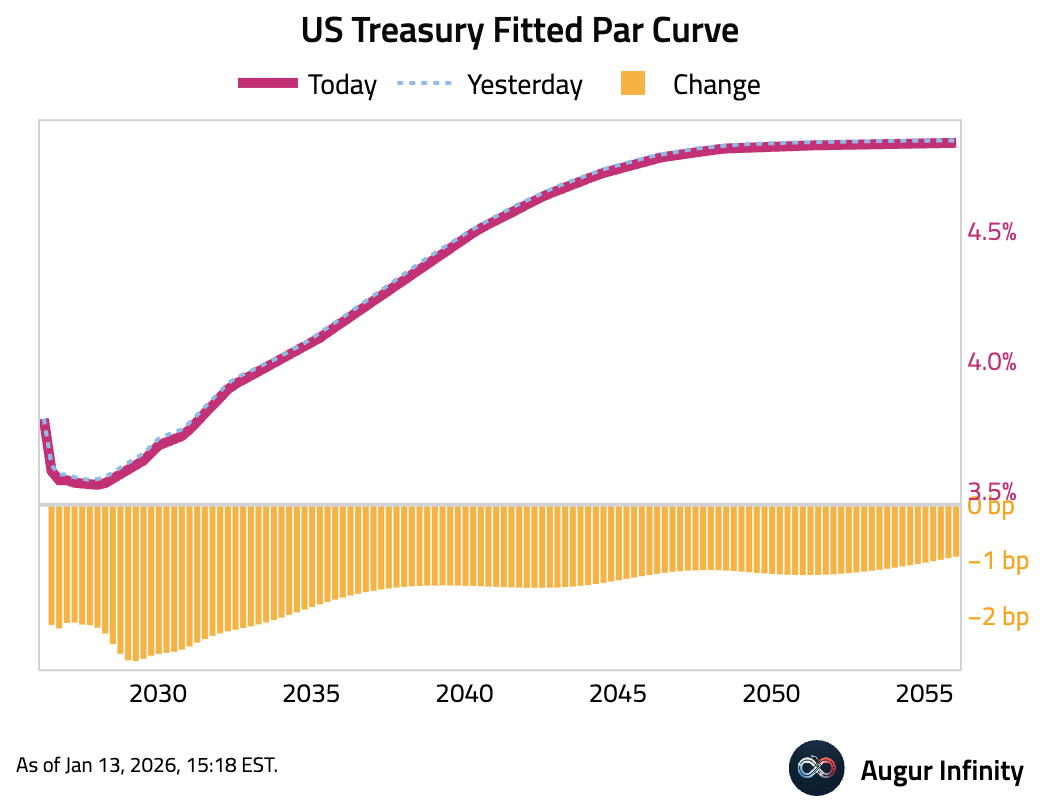
1 US Treasury yields decreased across the curve, led by a 2.2 bps drop in the 5-year yield.
Back to Index
Energy
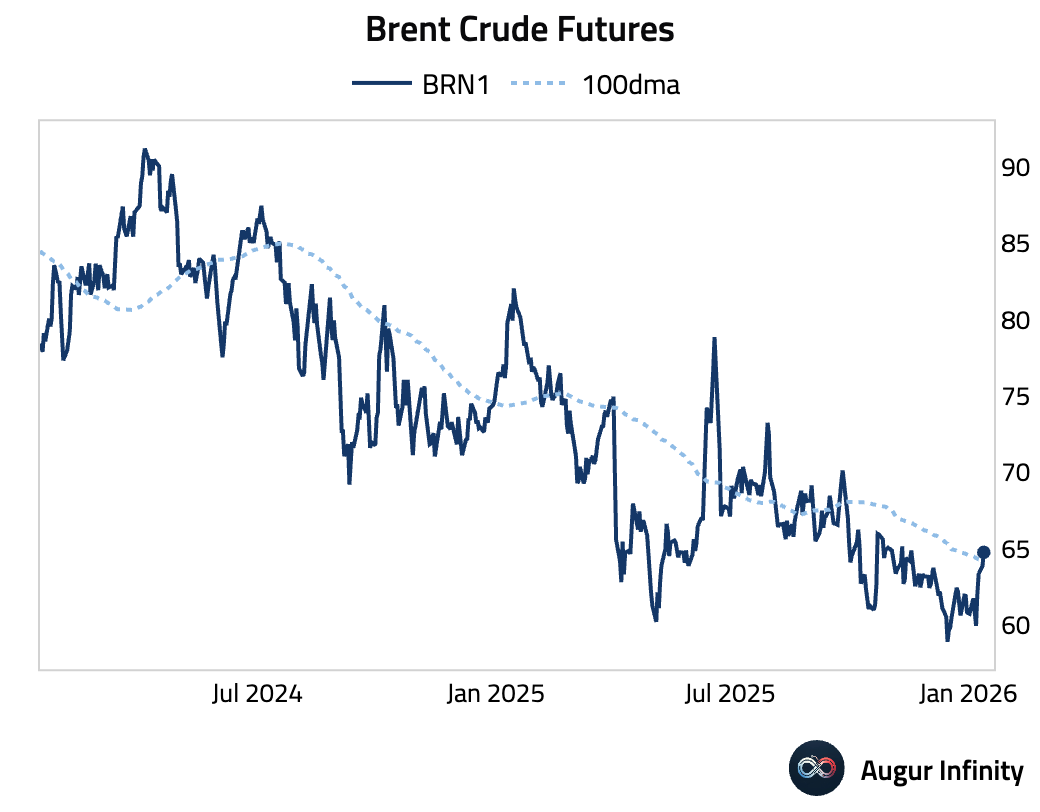
1 Brent crude futures are above their 100-day moving average. Oil prices rose across the board after President Trump canceled meetings with Iran and told protesters help is on the way.
Back to Index
Commodities
1 CME Group will shift precious-metals futures margins (gold, silver, platinum, palladium) to a percentage-of-notional model from a fixed dollar amount, effective after Tuesday’s close.
 Source: @markets Read full article
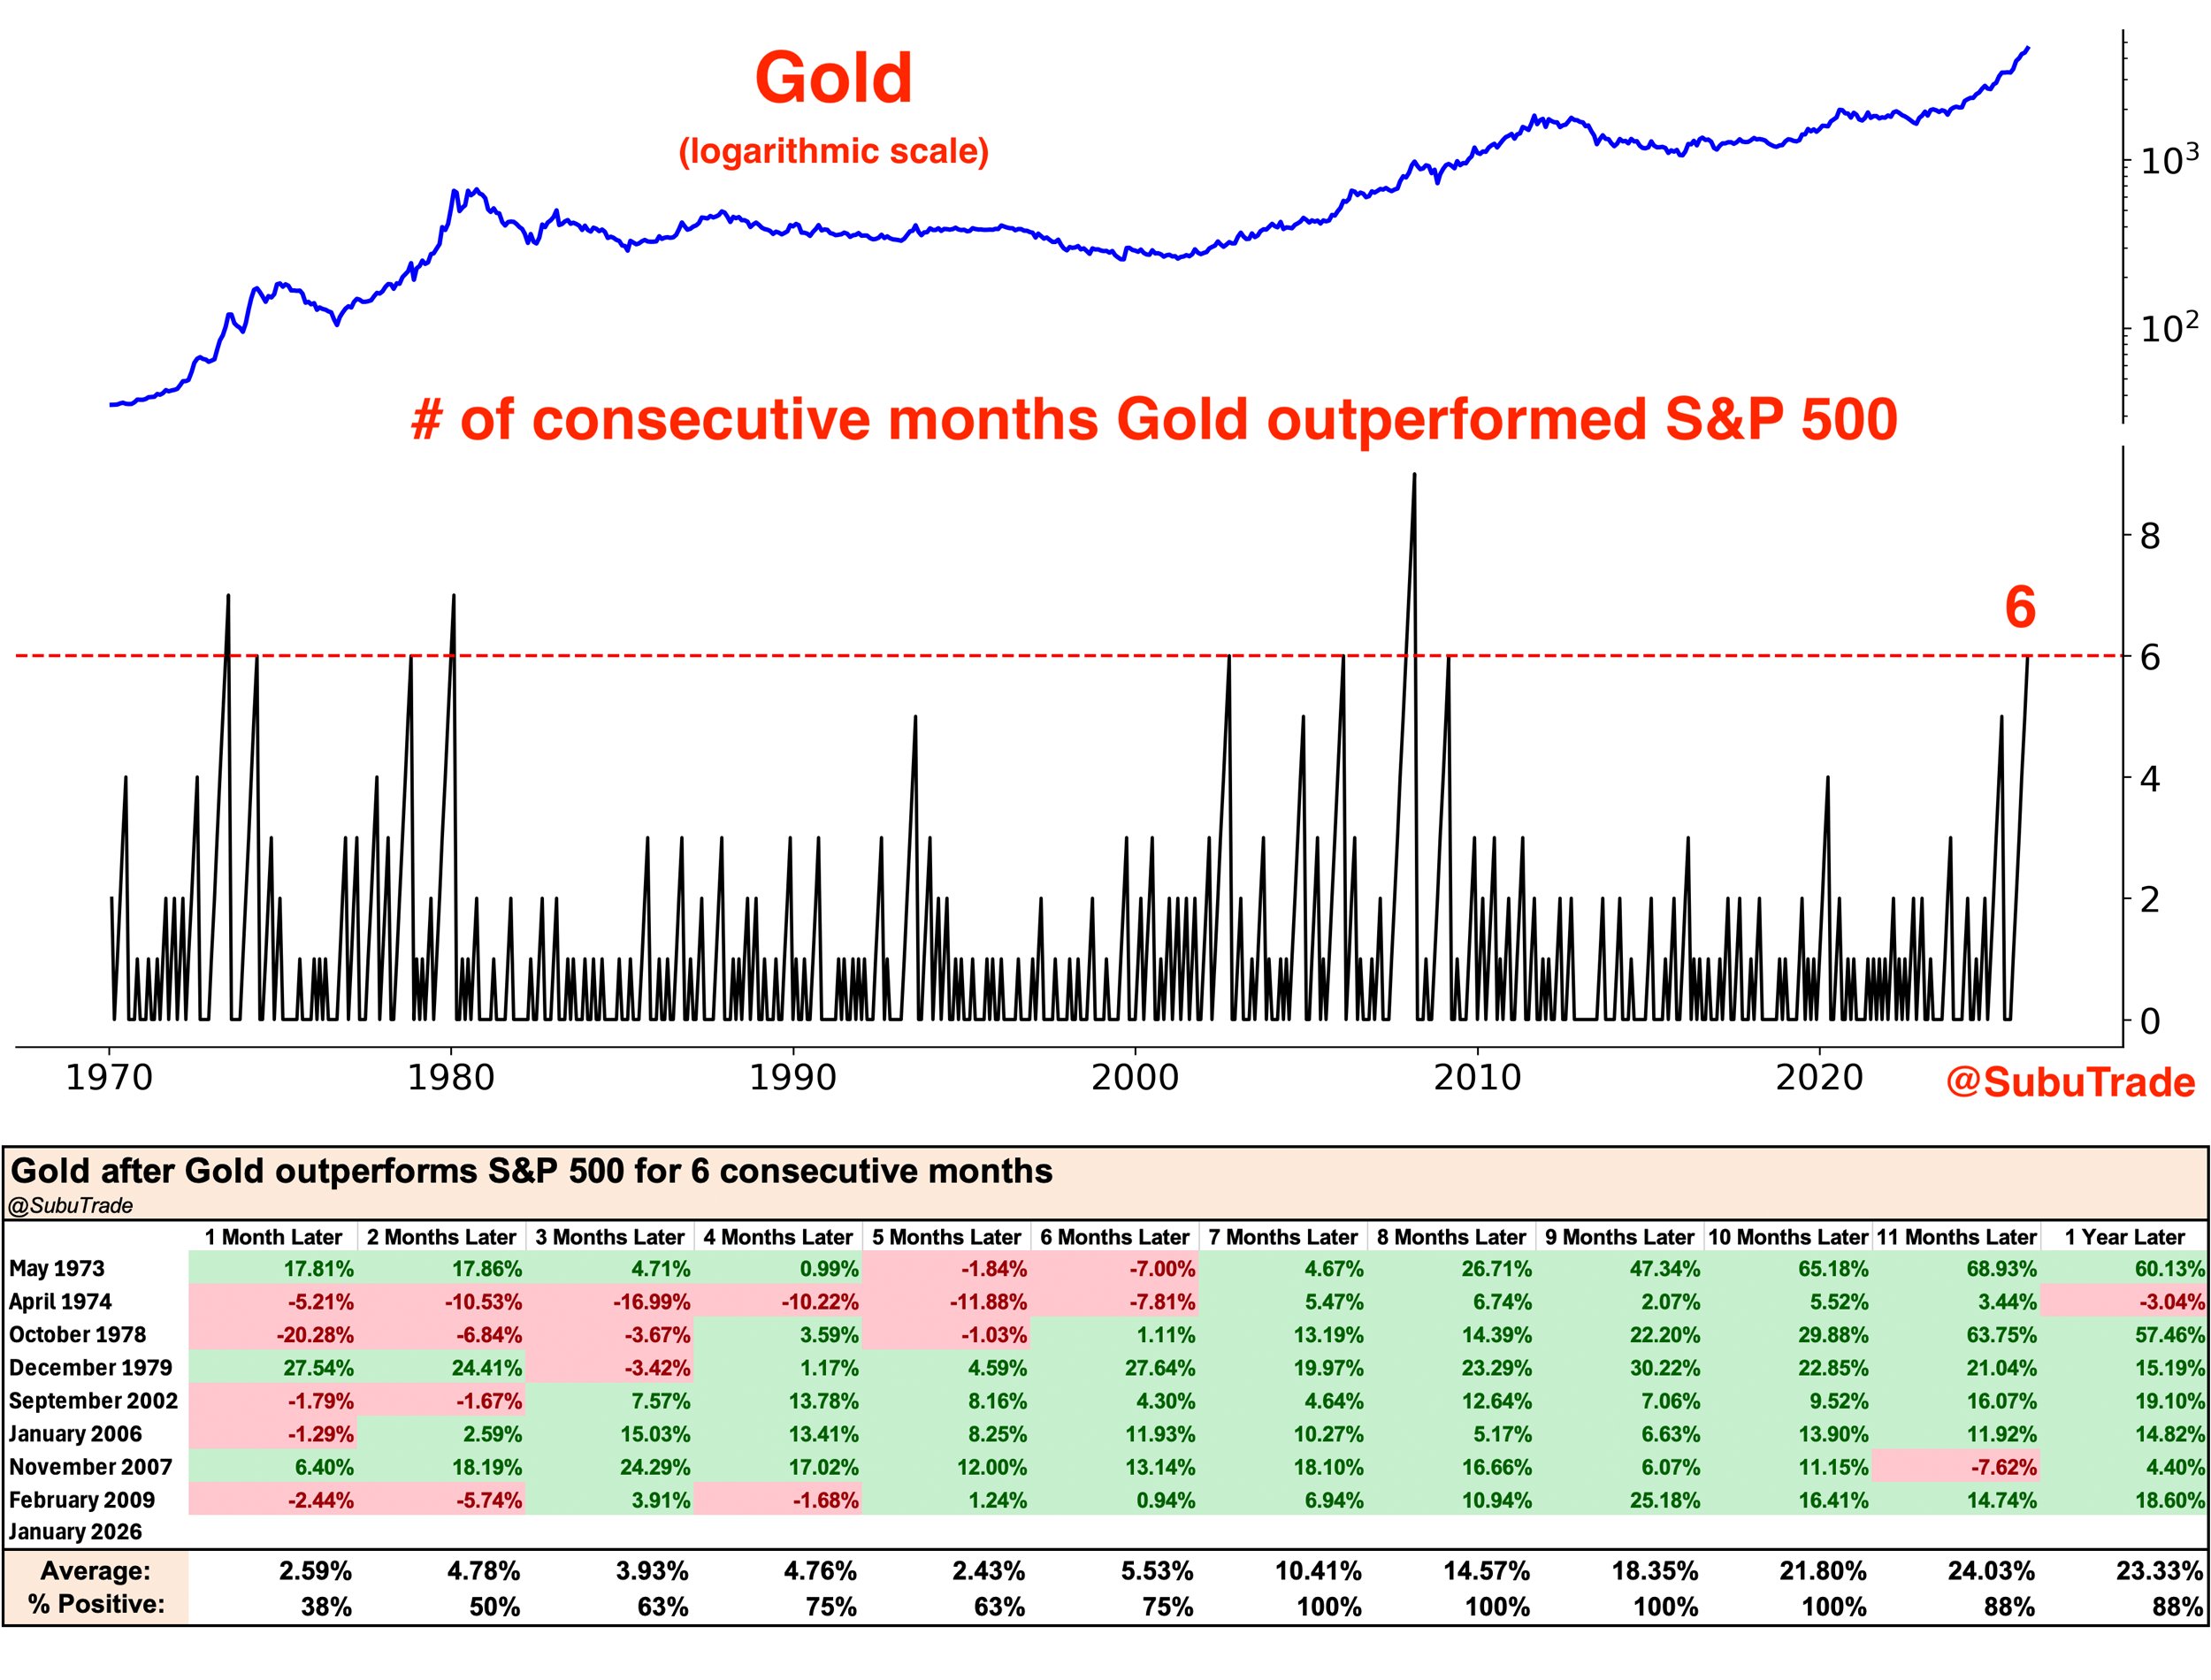
2 Gold has outperformed the S&P 500 for six straight months. Similar historical streaks of outperformance were followed by higher gold prices 7–10 months later every single time.
 Source: Subu Trade
Back to Index