Global Developments
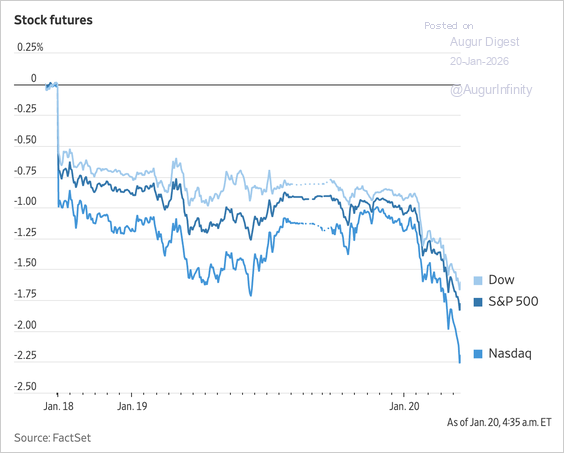
1. President Trump announced plans to impose a 10% tariff on imports from eight European countries starting February 1—potentially rising to 25% by June—pending a Greenland-related deal. The escalating tension, exacerbated by Japan’s bond market rout, sent global stock and US equity futures sharply lower.

Source: @WSJ Read full article
Source: @WSJ
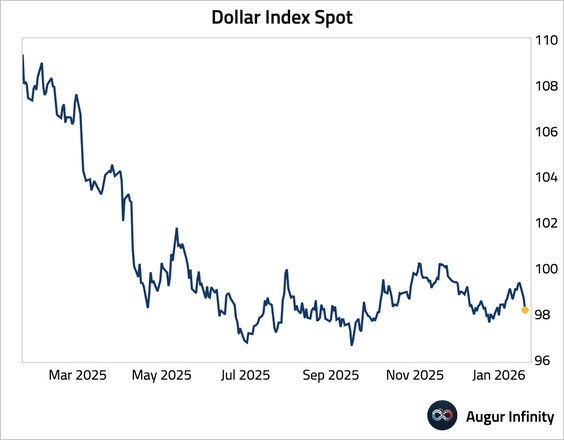
2. The US dollar weakened.
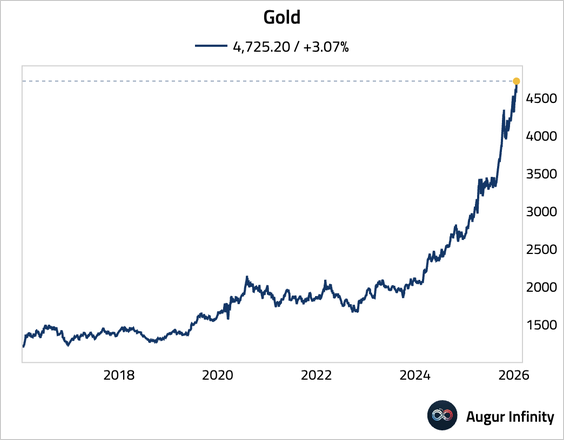
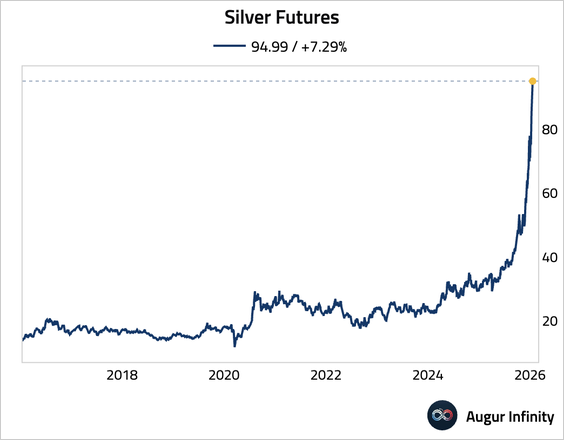
3. Precious metals jumped to record highs.
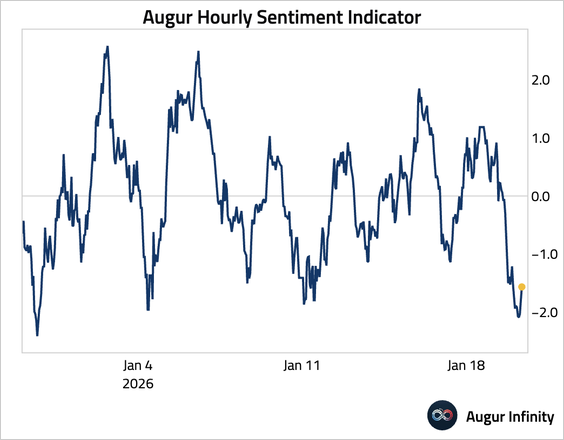
4. Our news-based sentiment indicator highlights rising angst across financial markets.
The United States
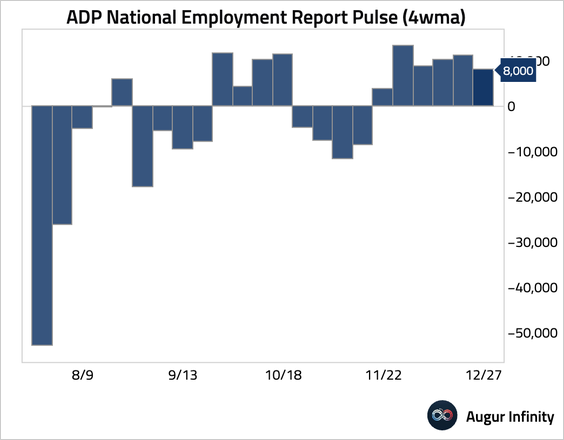
1. The ADP’s weekly measure of employment slowed to 8K.
2. The number of states with at least a 20% year-over-year rise in initial claims has declined, confirming a “no fire, no hire” environment.
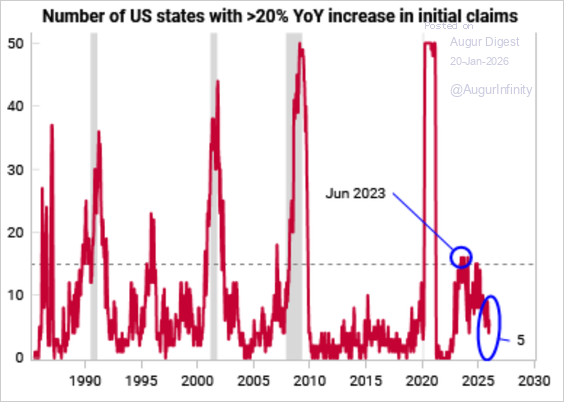
Source: Variant Perception
3. Consumer spending continues to hold up, with the Bloomberg card-based spending index surging in December.
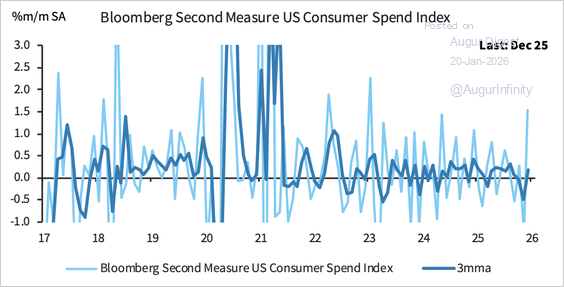
Source: Barclays Research
4. Economists now assign a 27% probability of a US recession over the next 12 months—down from a peak of 50% last year.
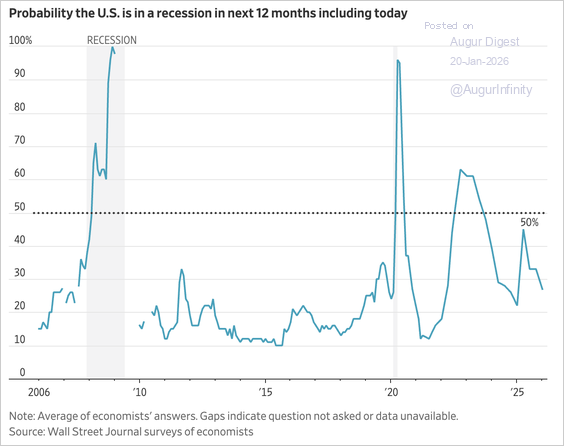
Source: @WSJ Read full article
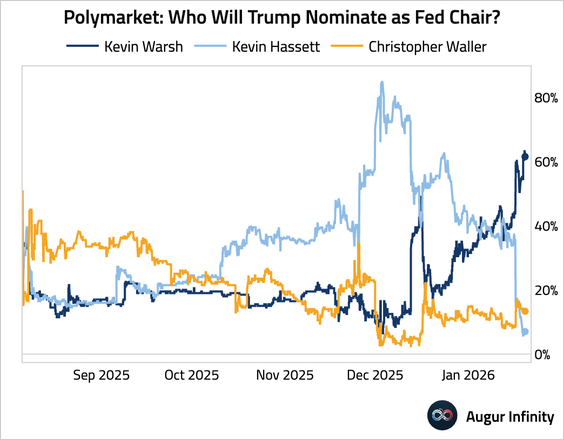
5. Trump signaled he is unlikely to nominate Kevin Hassett as the next Fed chair.

Source: @financialtimes Read full article
• This boosted the odds of Kevin Warsh’s appointment.
6. Freight volumes fell sharply in December, reaching a new cycle low as winter storms disrupted transportation and retailers continued to destock. Spending held up despite weaker volumes, implying higher rates amid weather-related capacity constraints.
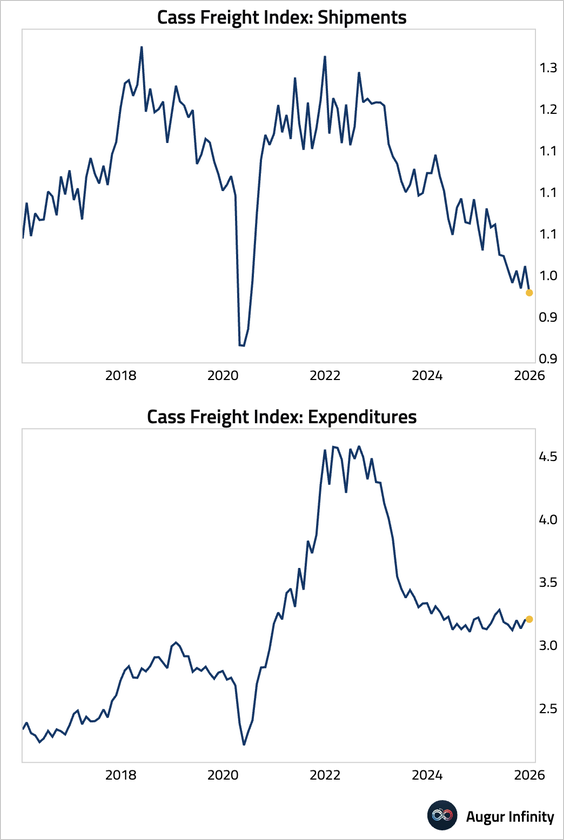
• High-frequency inbound shipping volume data has also moved sharply lower.
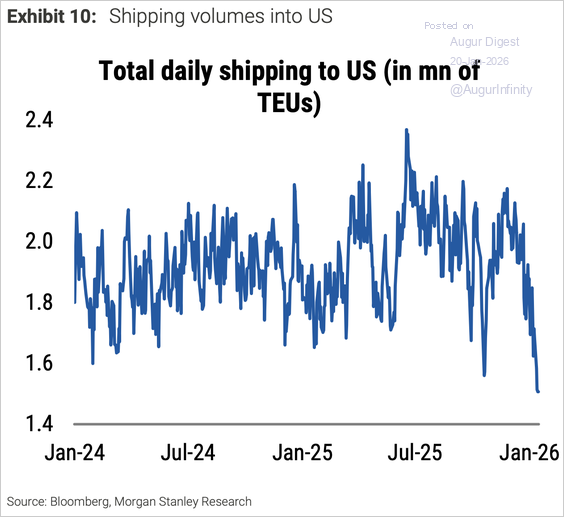
Source: Morgan Stanley Research
7. The Penta–CivicScience Economic Sentiment Index posted its largest gain since July 2022.
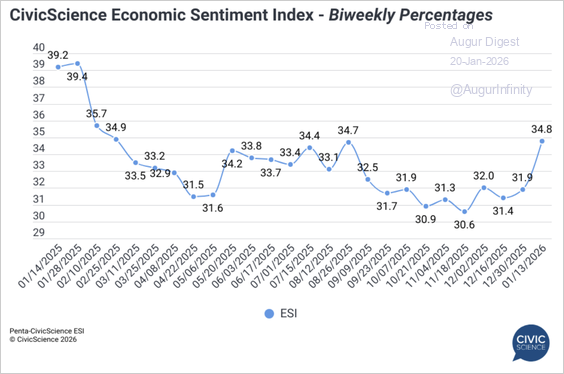
Source: CivicScience Read full article
Canada
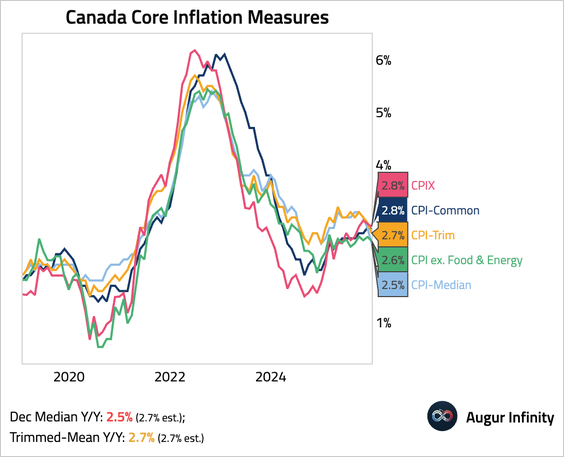
1. Headline inflation accelerated by more than expected, largely due to base effects from the expiry of a 2024 tax holiday.
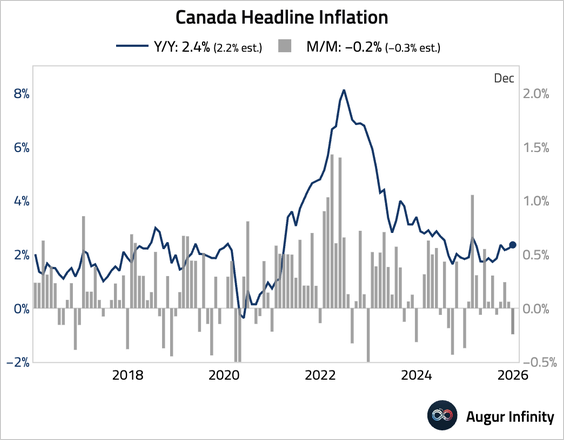
• Core inflation measures broadly eased.
The United Kingdom
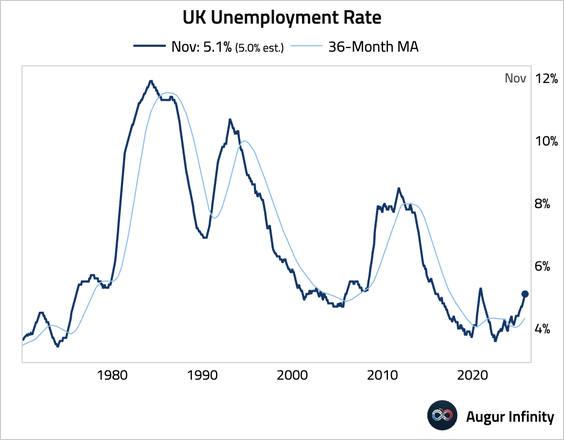
1. The unemployment rate held steady at a five-year high of 5.1%.
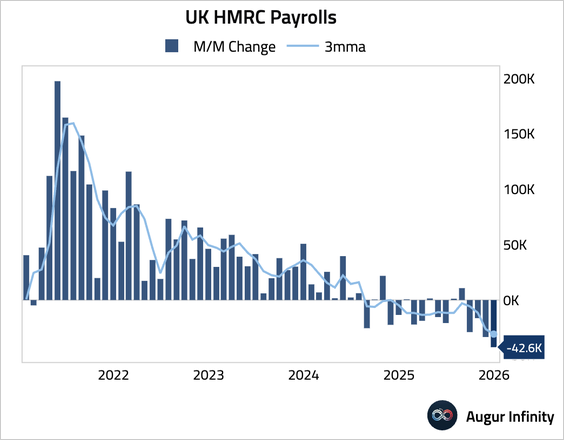
• The HMRC payrolls continued to contract.
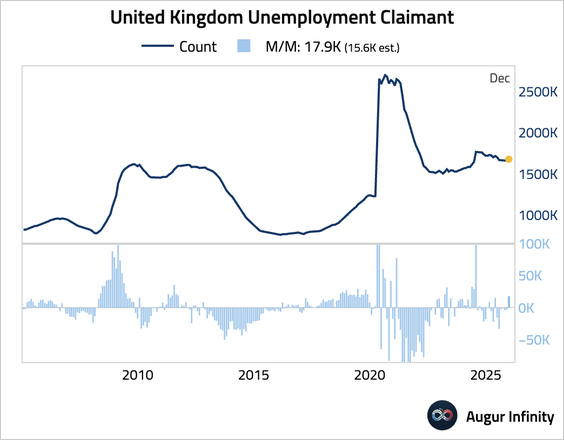
• The claimant count rose more than anticipated.
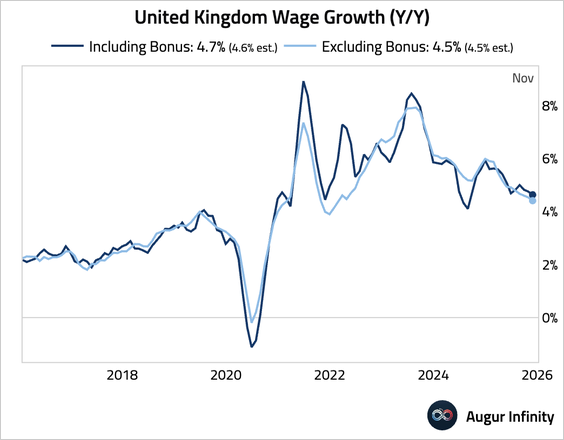
2. Wage growth moderated further.
The Eurozone
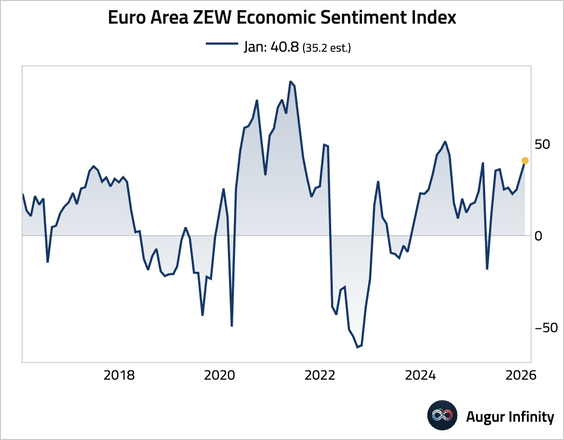
1. The ZEW Economic Sentiment Index for the euro area rose more than expected in January, suggesting growing optimism about the bloc’s economic outlook.
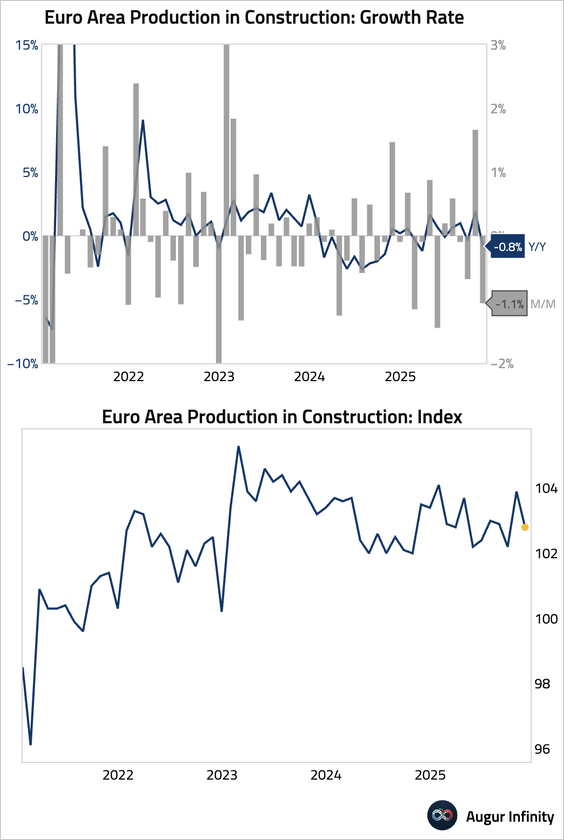
2. Construction output in the euro area contracted in November.
Europe
1. Goldman Sachs estimates the newly announced 10% tariff from the US would cut real GDP in affected countries by 0.1%–0.2%.

Source: Goldman Sachs
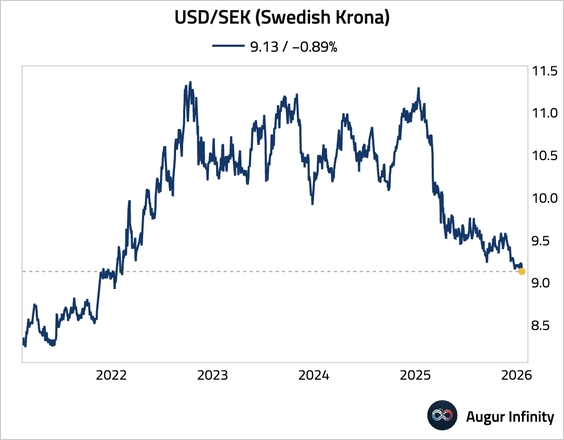
2. The Swedish krona has strengthened to the best level against USD since February 2022.
Japan
1. Prime Minister Sanae Takaichi called a snap election for February 8 to seek a mandate for sweeping policy changes, including a proposed two-year suspension of the 8% food sales tax.
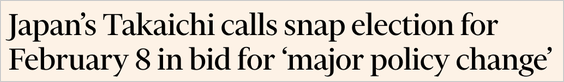
Source: @financialtimes Read full article
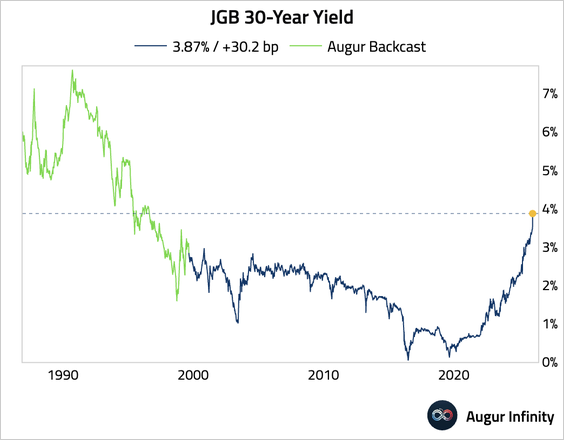
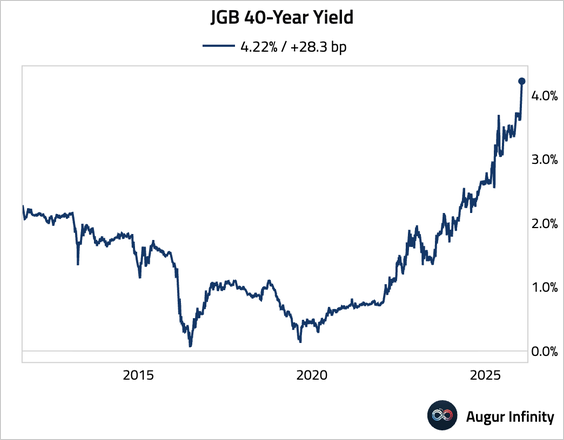
• The resulting fiscal worries sent the JGB market into meltdown.

Source: @markets Read full article
– 10-year yield (highest since February 1999):
– 30-year yield (surged by over 30 bps):
– 40-year yield (above 4% for the first time ever):
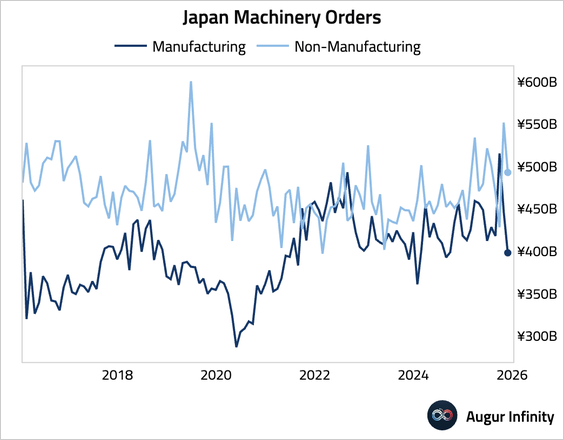
2. Machinery orders recorded the worst month-over-month contraction since April 2020, …
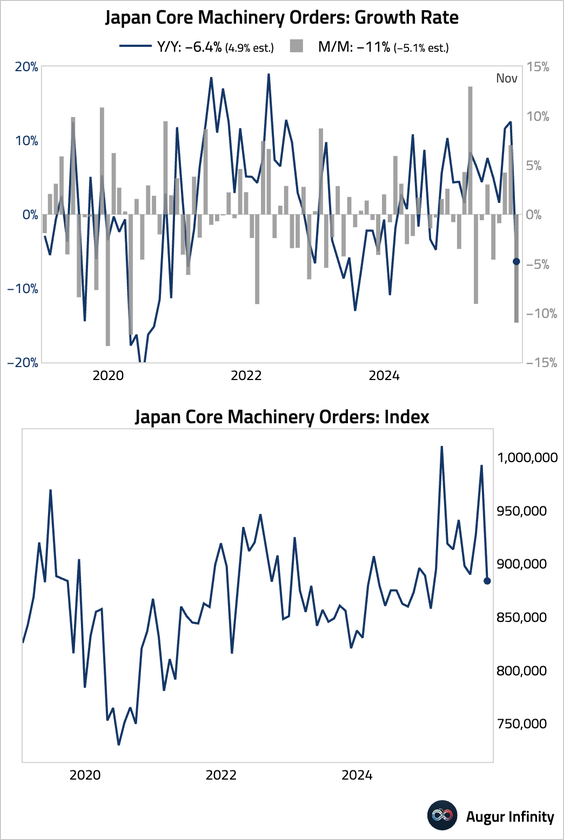
… as both manufacturing and non-manufacturing orders fell sharply.
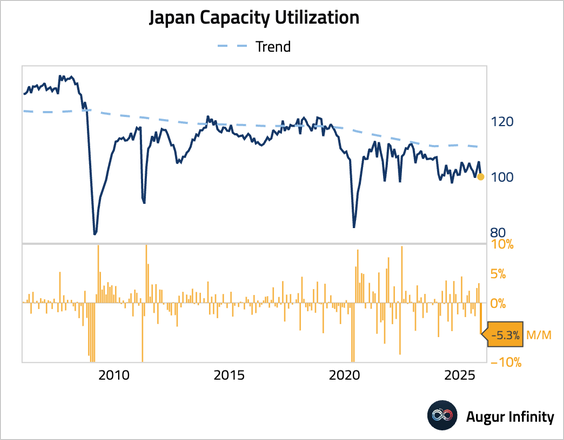
3. Capacity utilization in Japan slumped.
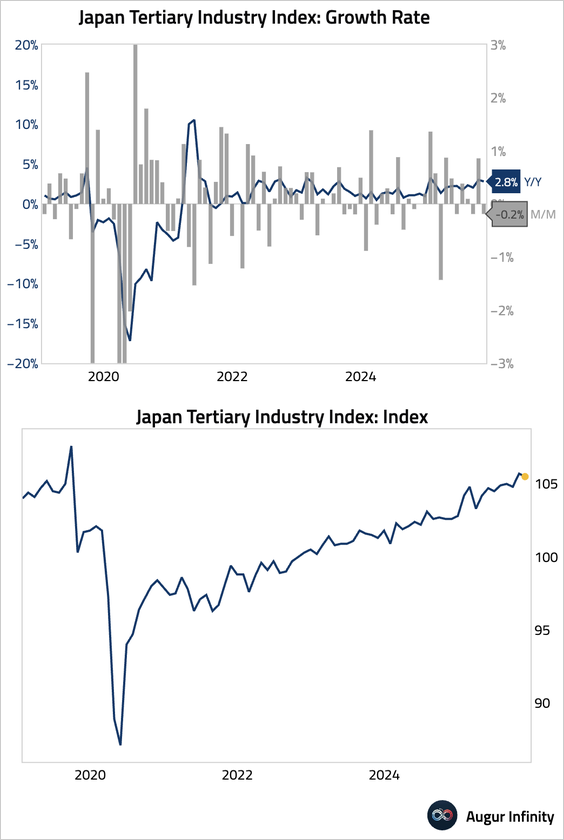
4. The tertiary industry index, a measure of services sector activity, eased.
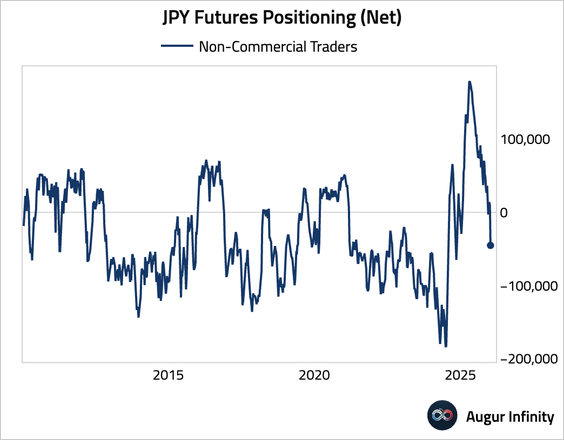
5. Non-commercial traders have turned net short in yen futures.
Asia-Pacific
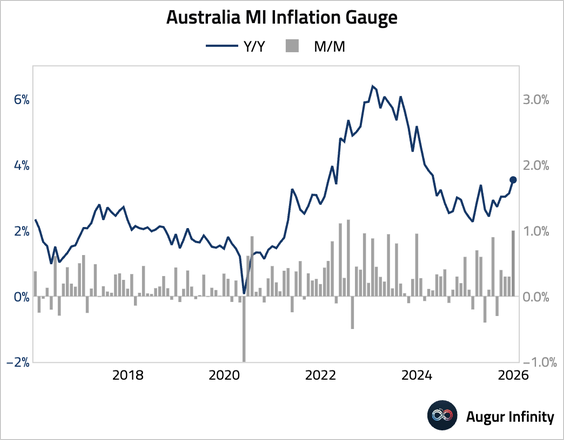
1. The Melbourne Institute’s inflation gauge for Australia accelerated.
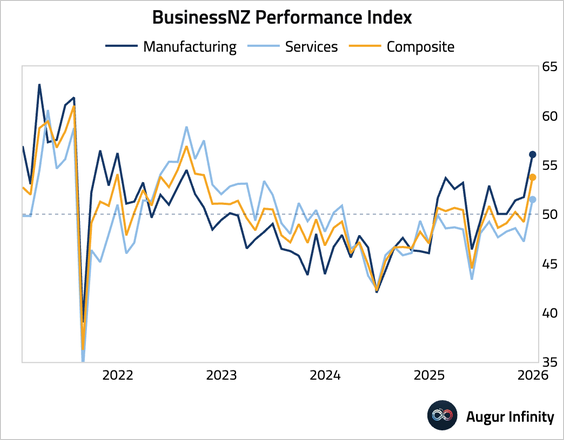
2. New Zealand’s services sector activity rebounded into expansionary territory.
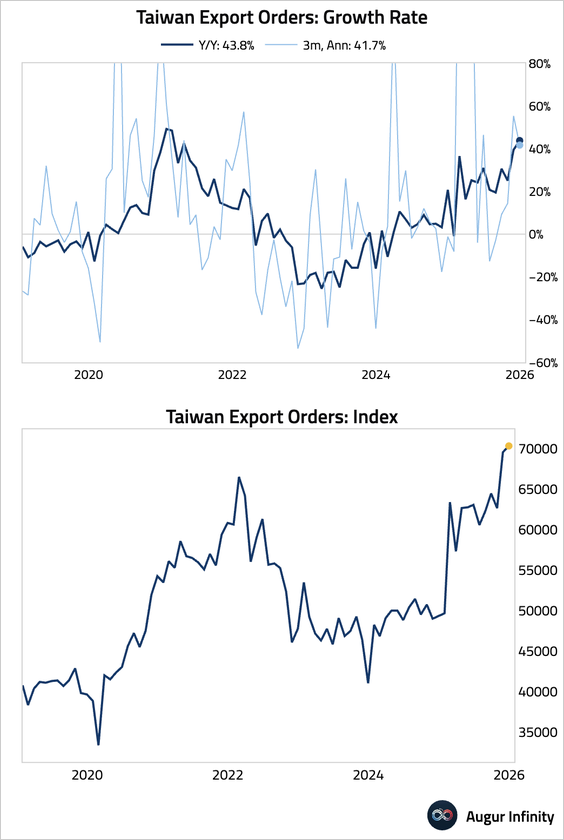
3. Taiwanese export orders continued to surge in December.
China
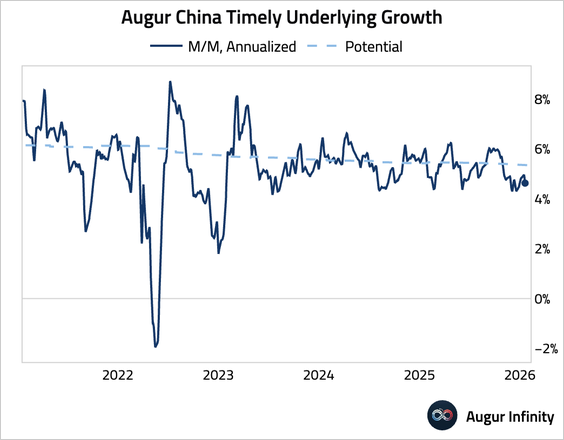
1. The latest batch of data continue to highlight a divergence between strong exports and weak domestic demand. Before delving into the details, here’s the aggregate timely growth measure, which shows overall coincident growth stuck below potential level.
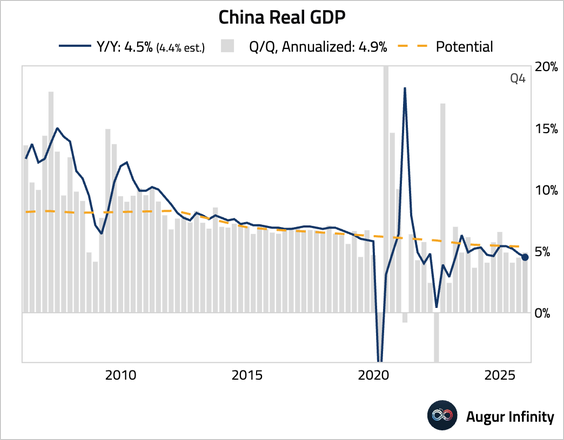
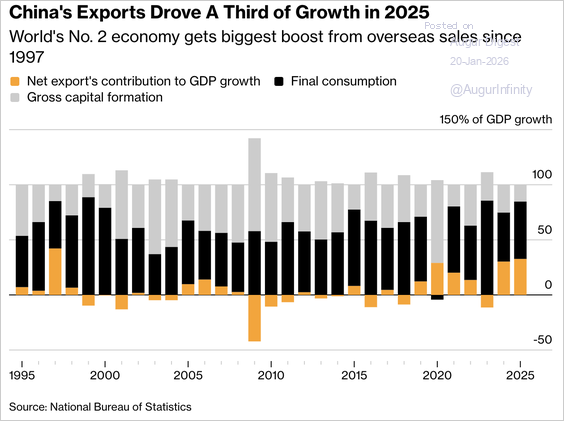
2. Q4 GDP growth moderated to 4.5% year over year, the slowest pace since early 2023, although the full-year growth met the 5% target.

Source: CNBC Read full article
• Net exports of goods and services added almost 33% to last year’s expansion, the highest share since 1997.
Source: @markets Read full article
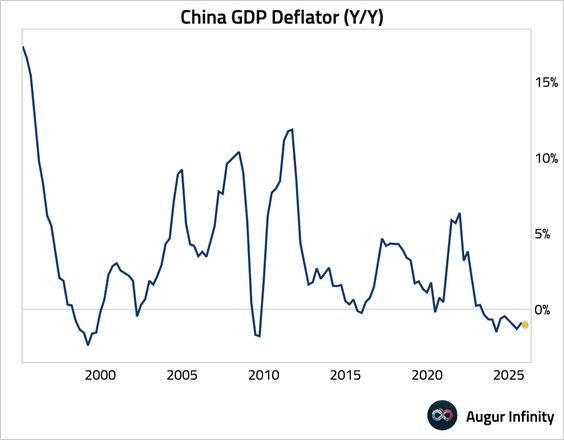
• Persistent deflationary pressures remain a key concern, as the GDP deflator has been negative for 11 consecutive quarters, the longest such stretch since the 1960s.
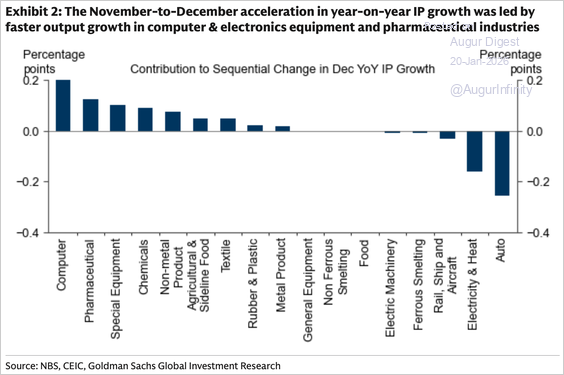
3. Industrial production accelerated and topped expectations, …
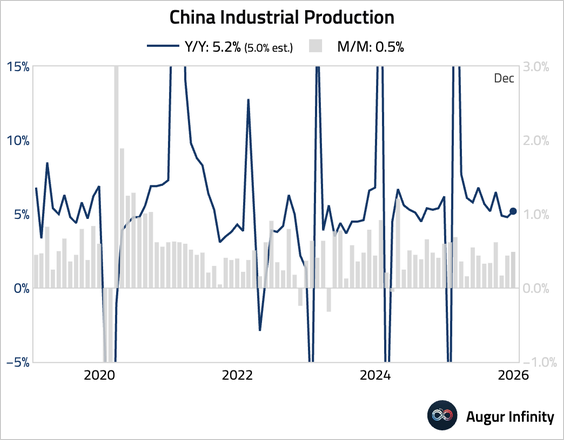
… largely driven by stronger-than-expected exports, particularly computer and electronics equipment.
Source: Goldman Sachs
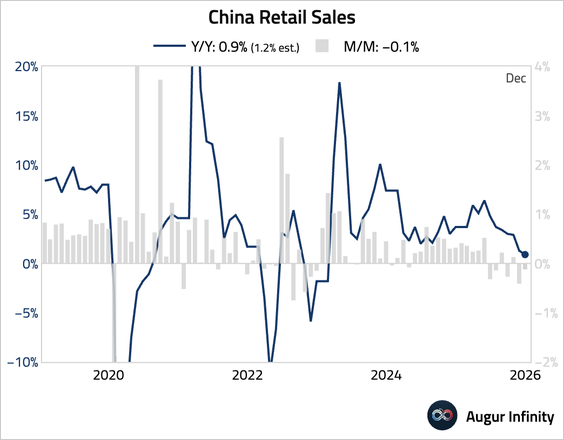
4. Retail sales growth slowed to just 0.9% year over year, missing consensus and pointing to weak domestic demand, driven by broad-based weakness in goods consumption.
5. The slump in fixed asset investment deepened, …
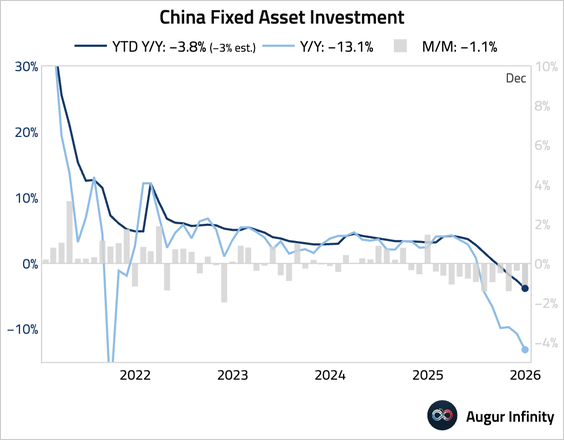
… with broad-based weakness.
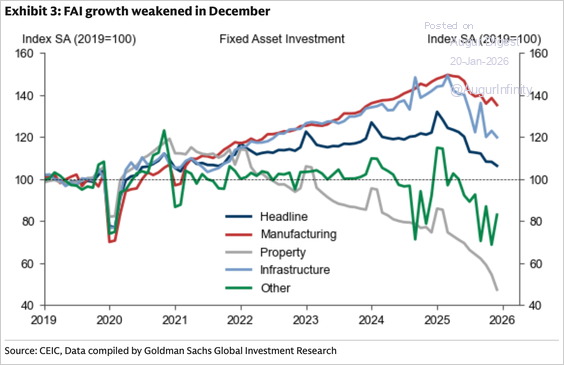
Source: Goldman Sachs
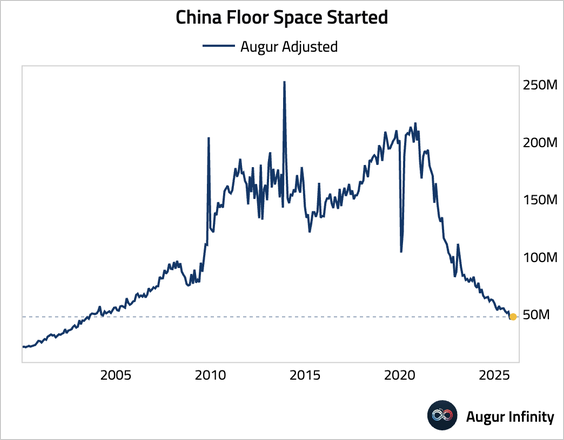
6. Floor space starts inched up but remained near the lowest level since mid-2003.
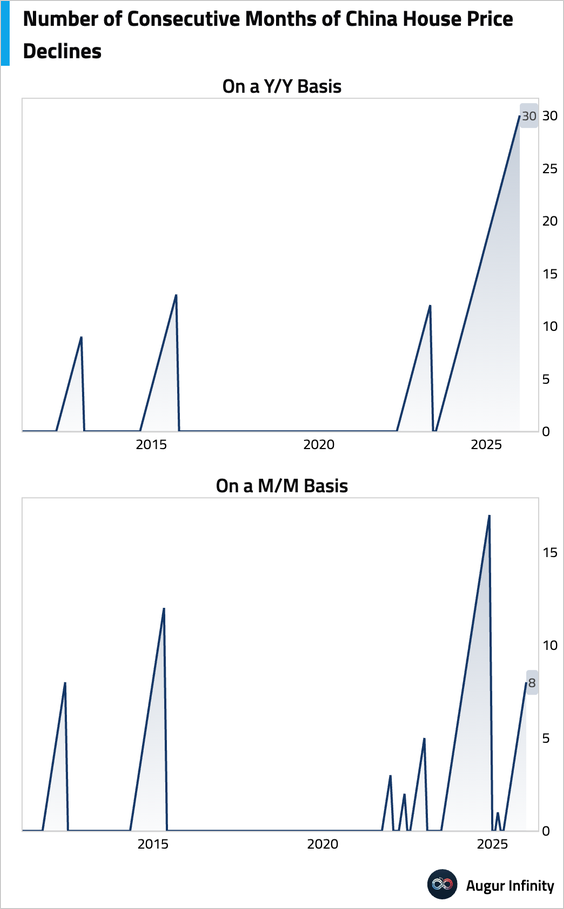
7. The decline in new home prices worsened to -2.7% year over year, driven by weakness in Tier-2 and Tier-3 cities facing significant oversupply.
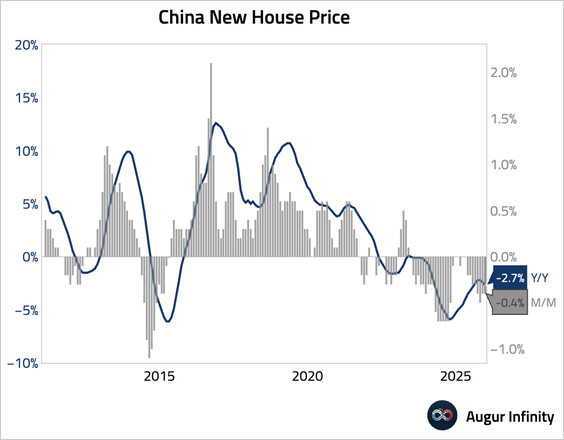
• On a year-over-year basis, house prices have fallen for 30 consecutive months.
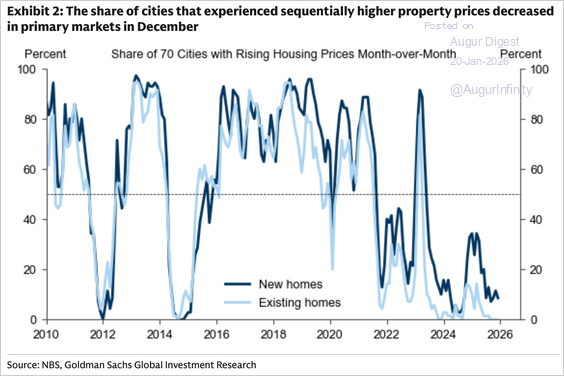
• The share of cities with higher property prices fell.
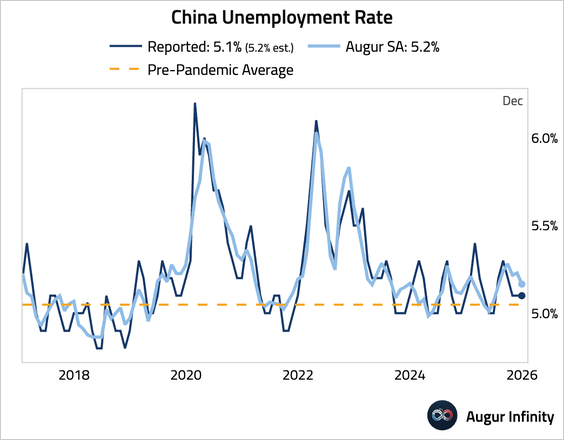
8. The surveyed unemployment rate remained steady, and our seasonally-adjusted measure edged down.
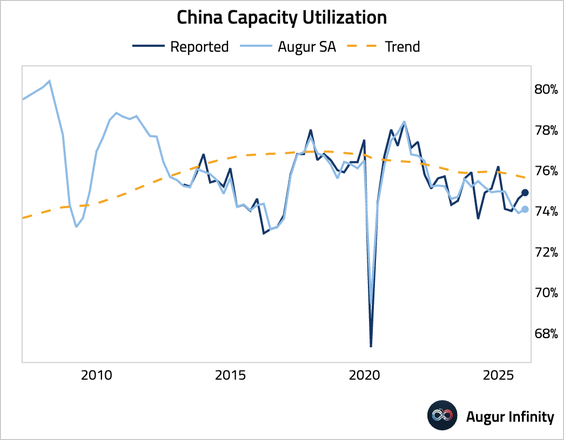
9. Capacity utilization edged up but remained below trend.
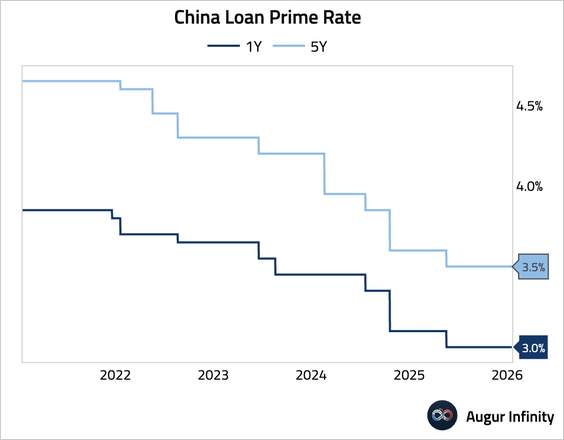
10. The PBoC held its one-year and five-year loan prime rates unchanged for the eighth consecutive month.
11. China’s birthrate fell to 5.6 per 1,000 people in 2025, the lowest since 1949.
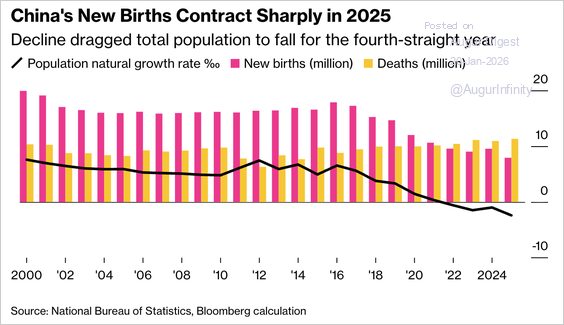
Source: Bloomberg Read full article
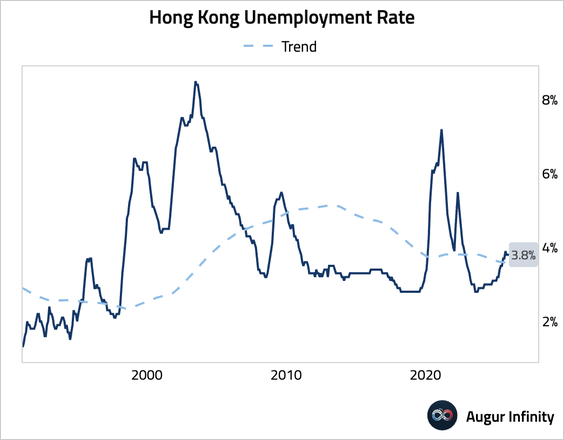
12. Hong Kong’s unemployment rate was unchanged.
13. Renminbi’s share of global trade finance has risen significantly over the past four years.
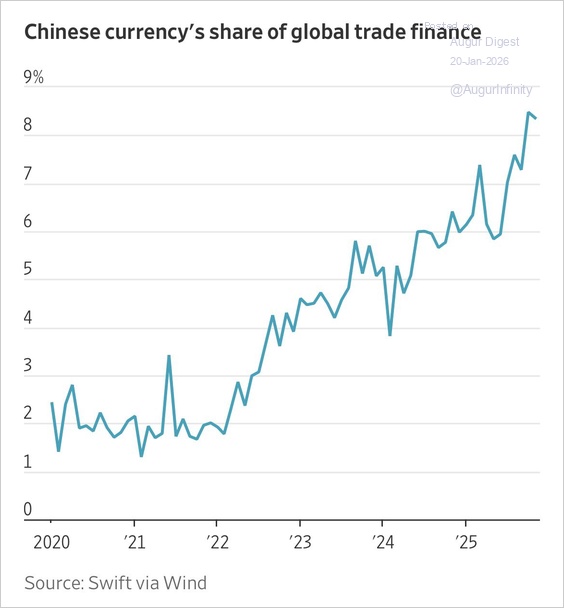
Source: @philippilk
India
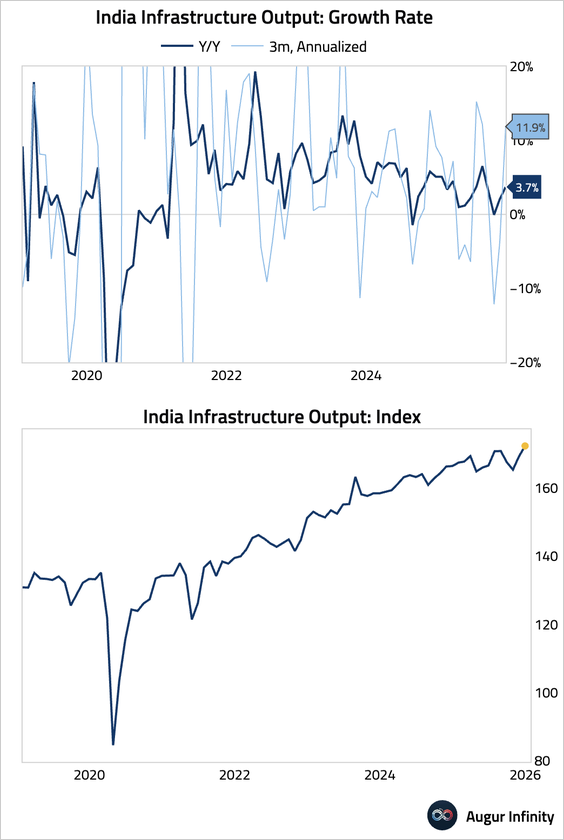
1. Infrastructure output growth accelerated in December.
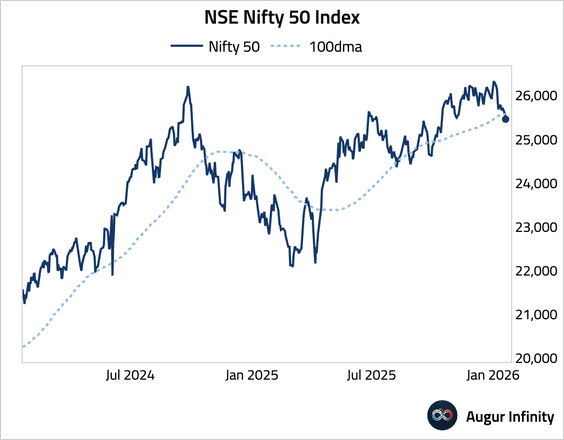
2. Nifty 50 fell below its 100-day moving average.
Emerging Markets
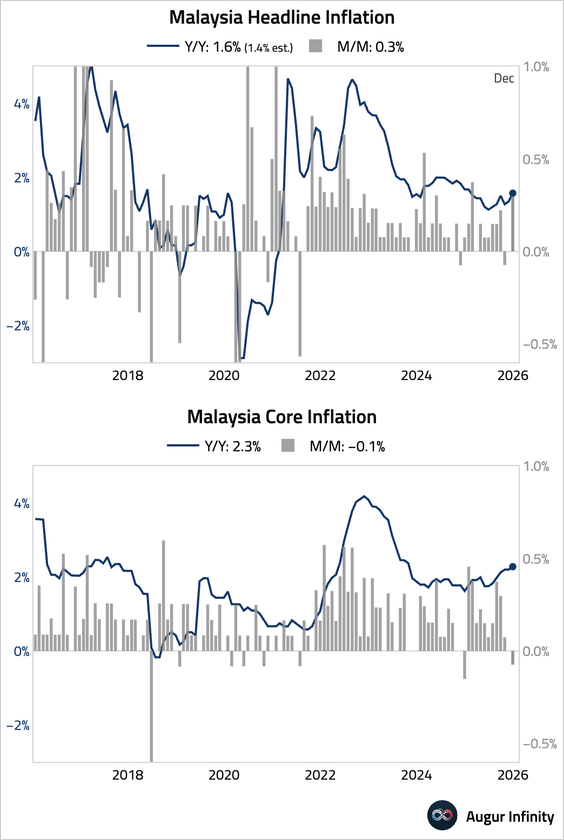
1. Malaysian headline inflation accelerated more than expected, driven by higher electricity costs and a rebound in communication prices. Core inflation also edged higher on a year-over-year basis, although the month-over-month reading was soft.
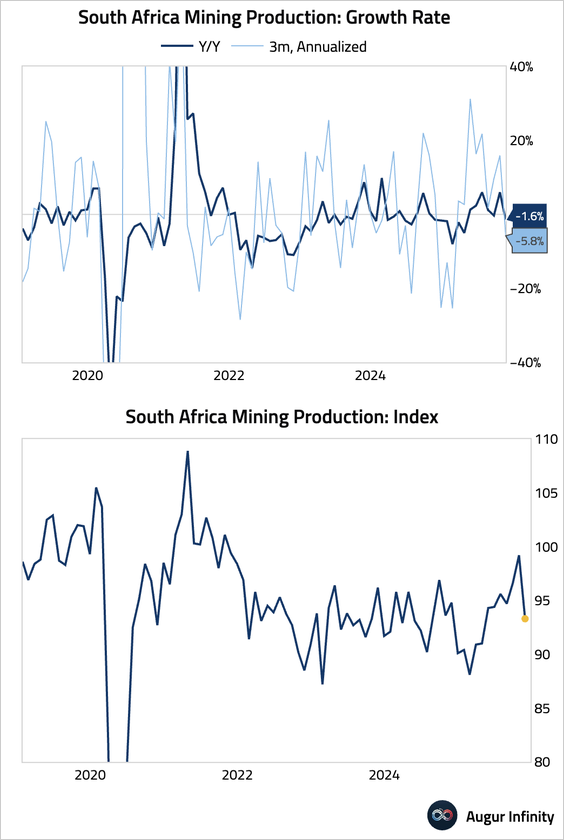
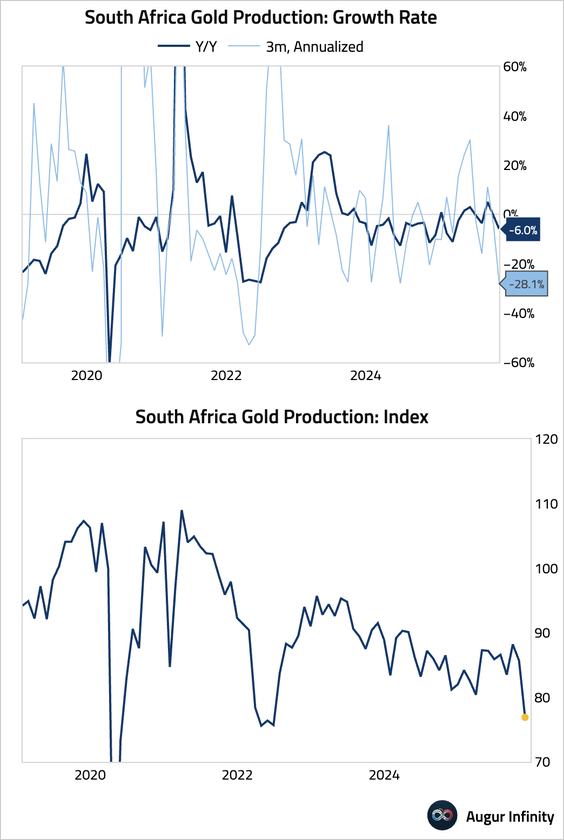
2. South African mining production fell sharply in November.
• Gold production slumped to the lowest level since mid-2022.
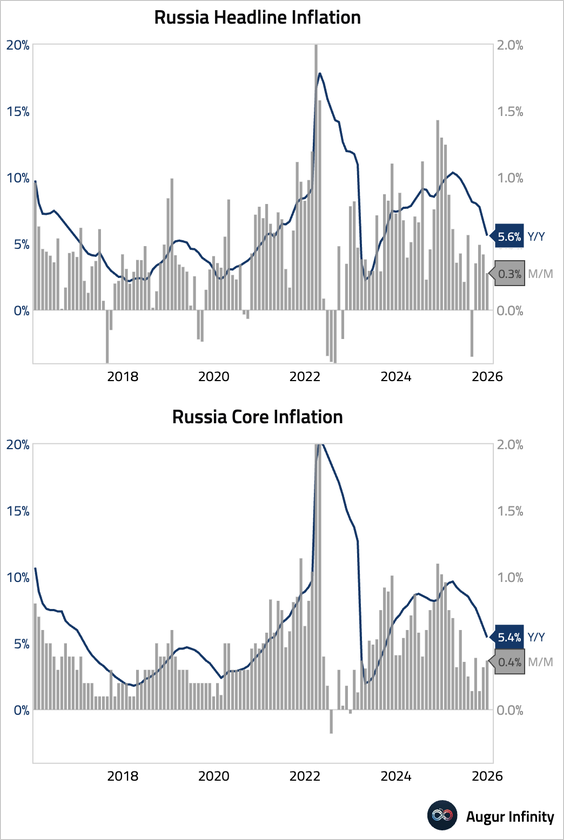
3. Inflation in Russia eased further year over year.
Equities
1. Global equities declined, led by sharp falls in the US and Europe over Greenland. US stocks fell for a second consecutive day, with the S&P 500 down 2.1% and the Nasdaq Composite losing 2.4%. French and Chinese equities extended their losing streaks to five sessions. Bucking the trend, Brazilian and Mexican markets posted modest gains.
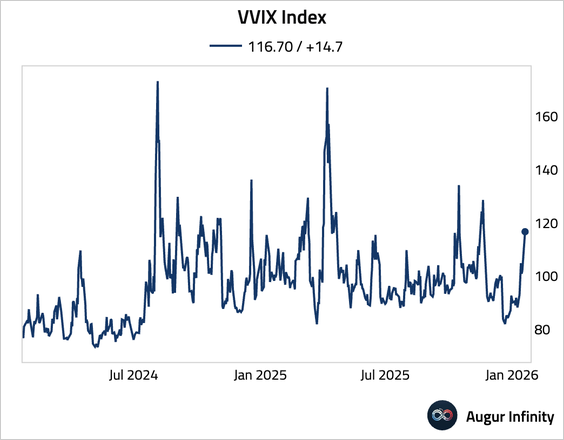
2. The VIX Index broke above its 200-day moving average.
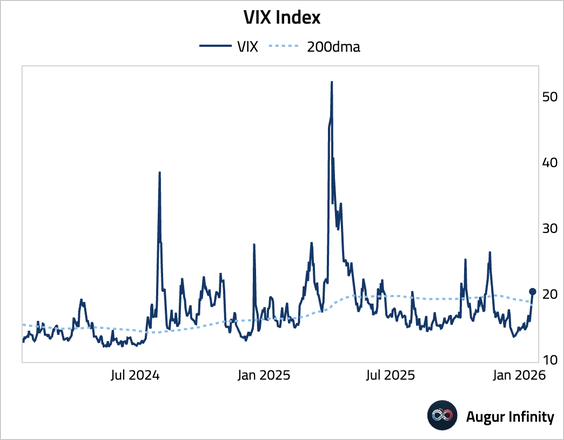
• The VVIX Index also surged.
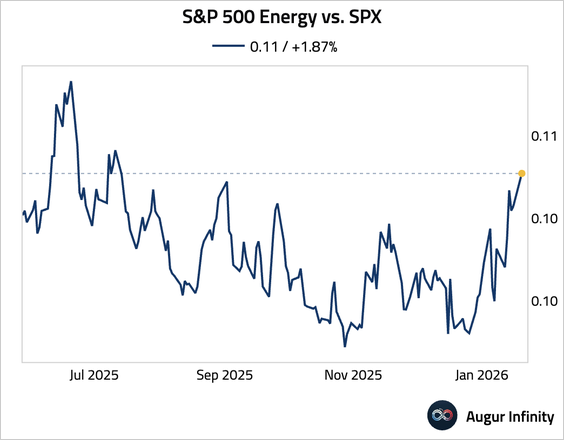
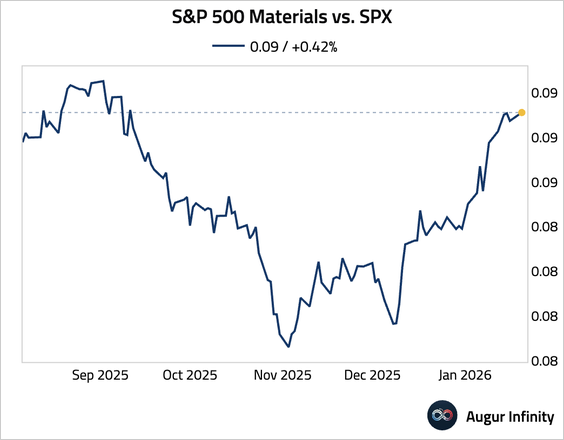
3. Let's look at some updates about US equity sectors.
4. Seven percent of S&P 500 companies have reported earnings so far, with 79% beating on earnings but with below-average surprise magnitude.
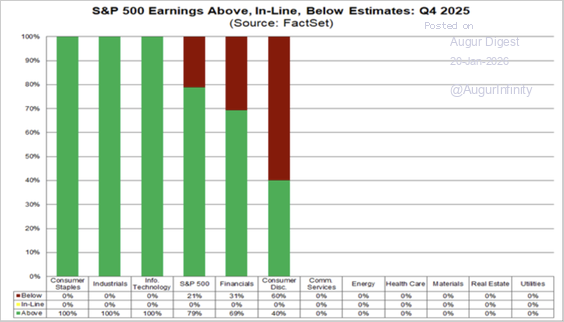
Source: FactSet
5. This chart compares the relative price action and relative forward EPS of large-cap stocks (S&P 500) and small-cap equities (Russell 2000).
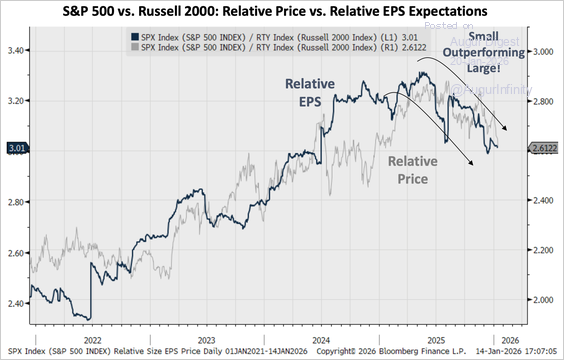
Source: Piper Sandler
6. Deutsche Bank’s measure of equity positioning inched higher and remained modestly overweight.
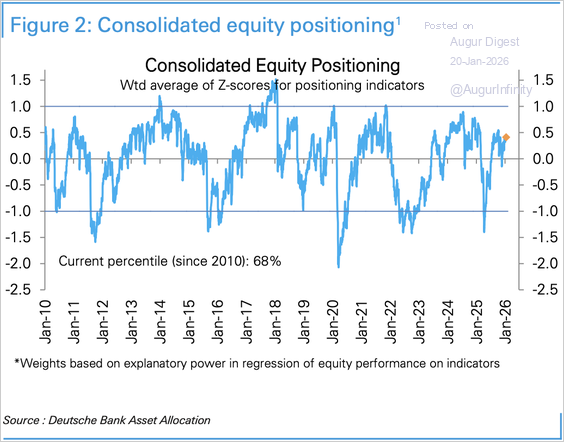
Source: Deutsche Bank Research
• Here is the positioning index by sector.
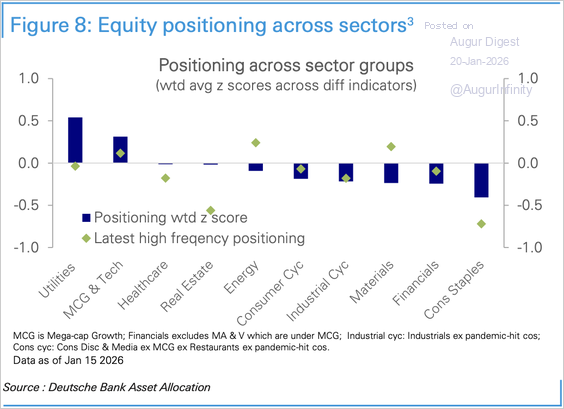
Source: Deutsche Bank Research
• Positioning in mega-cap growth and tech stocks has declined, while positioning in cyclicals has risen.
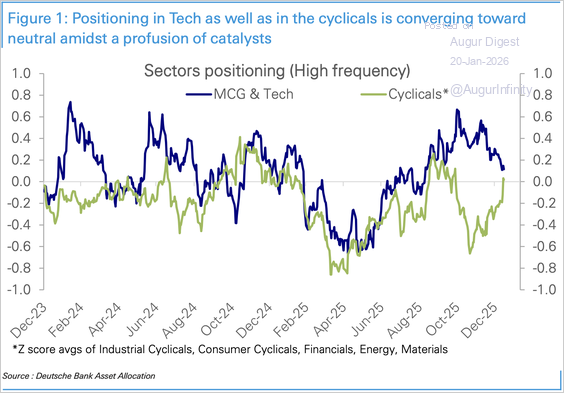
Source: Deutsche Bank Research
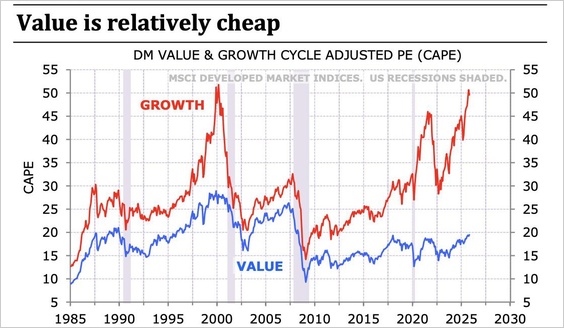
7. Developed-market value stocks are much cheaper than growth stocks based on CAPE.
8. The US value versus growth factor is trading at the highest level since May 2025.
9. US small-cap equities have outperformed large-cap equities for 12 consecutive days.
10. US Quality (QUAL) versus SPY is testing resistance at the 200-day moving average.
11. Bank of America's Global Fund Manager survey suggests global investor sentiment is the most bullish since July 2021.
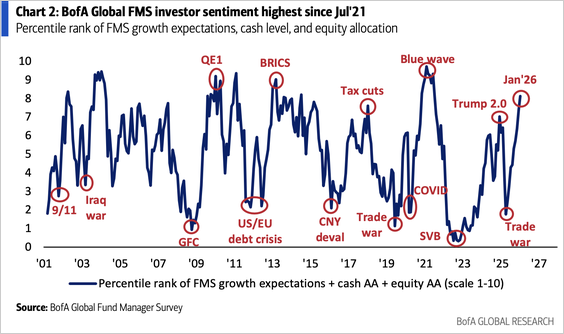
Source: BofA Global Research
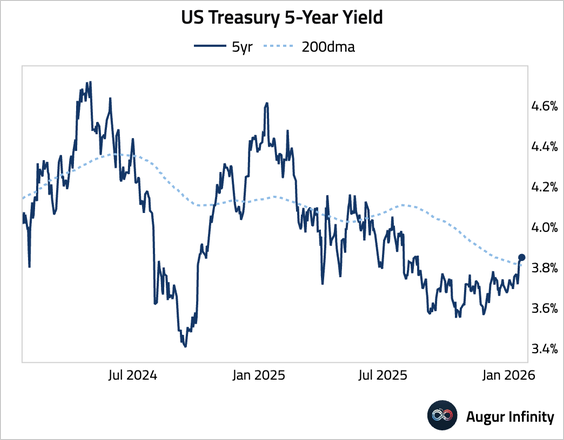
Rates
1. Treasury yields are rising. • 5-year (above 200-day moving average):
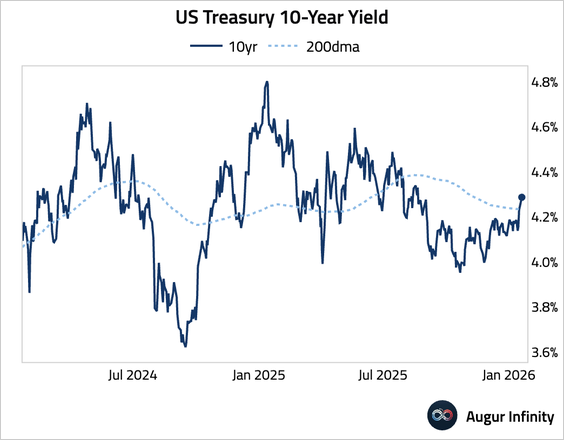
• 10-year (above 200-day moving average):
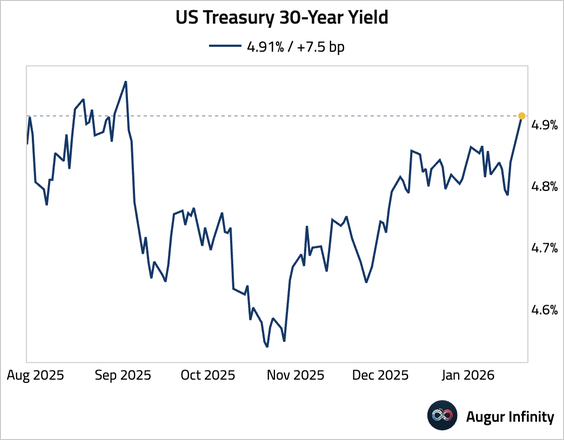
• 30-year (highest since September 2025):
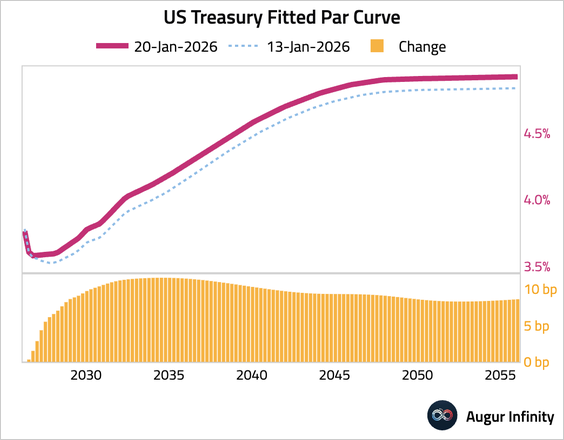
2. Here is how the yield curve reshaped over the past week.
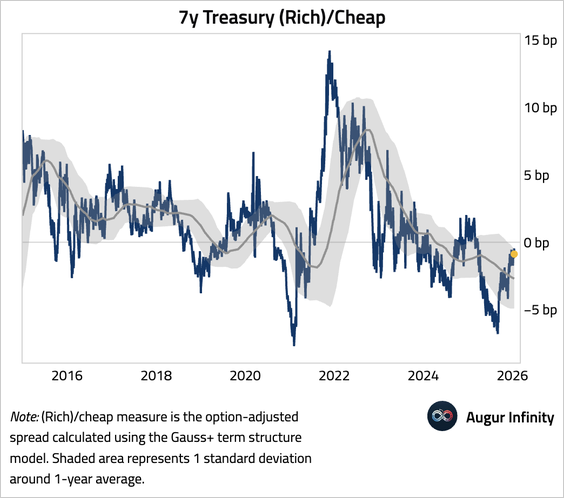
3. The 7-year sector has underperformed neighboring points, with the 5-year/7-year/10-year par yield butterfly rising to the highest level since April 2025.
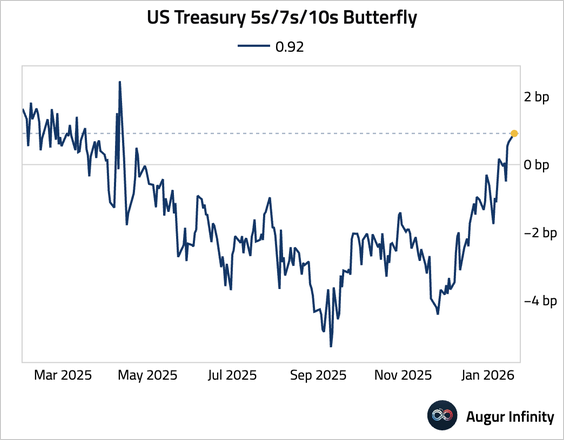
• The 7-year point has also cheapened relative to a term structure model.
4. Treasury market reactions to growth surprises have moderated and are now more in line with historical averages.
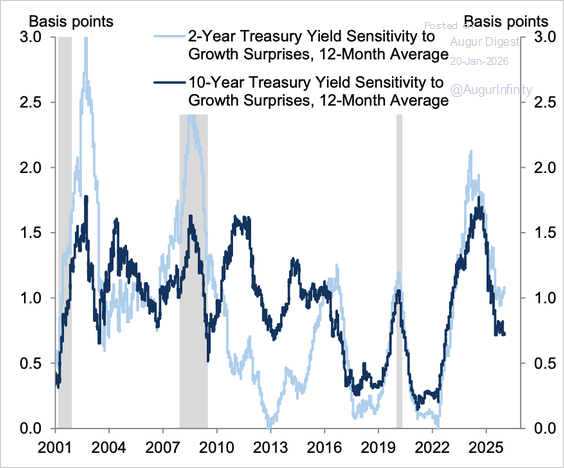
Source: Goldman Sachs
• Reactions to inflation surprises have declined as well but remain higher than the historical average.
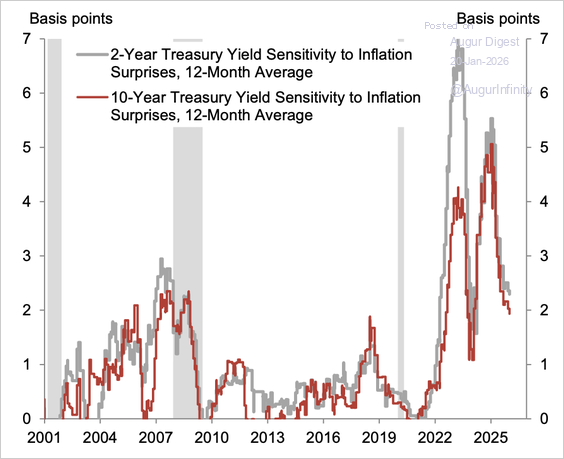
Source: Goldman Sachs
• Markets have put more weight on surprises to the unemployment rate than on nonfarm payrolls in recent years.
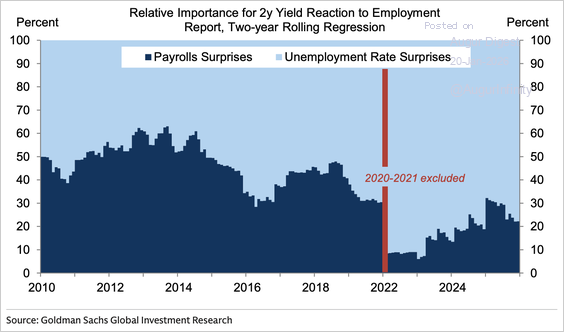
Source: Goldman Sachs
Credit
1. Bad loans at US shopping malls have surged, more than four times higher than for other retail properties, according to Moody’s.
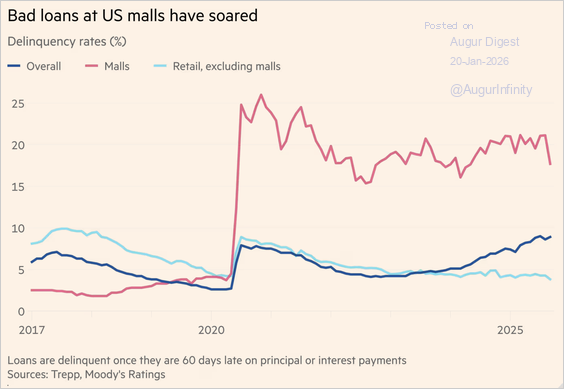
Source: @financialtimes Read full article
2. An increasing number of tech companies are turning to debt markets to finance their investment spending.
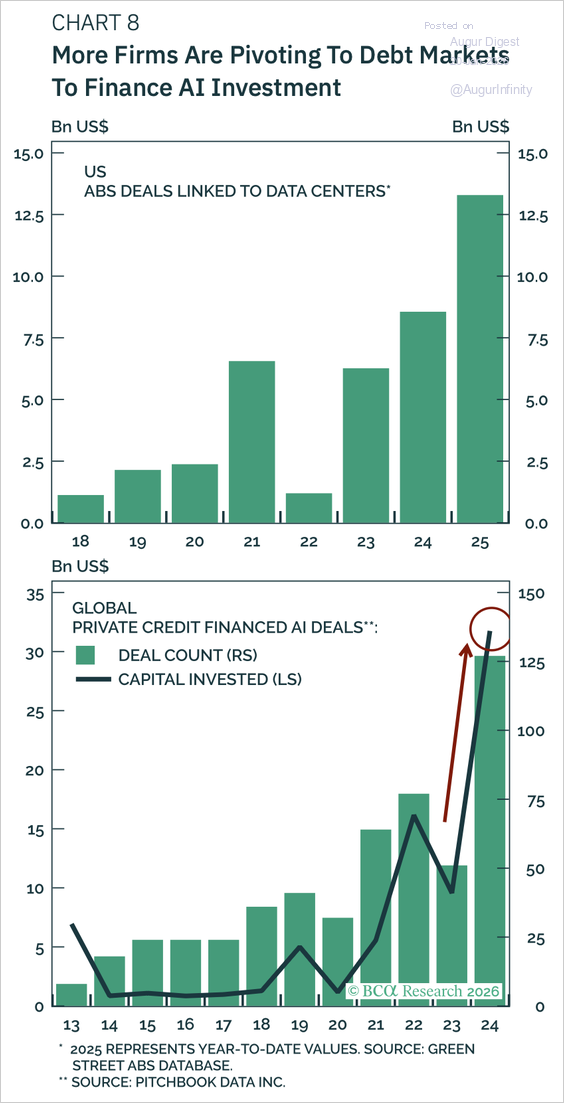
Source: BCA Research
Energy
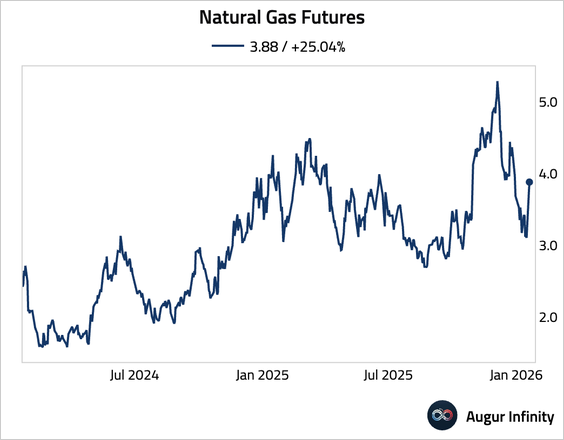
1. Natural gas surged over 25% on a higher chance of colder-than-normal weather across the East Coast and Midwest.
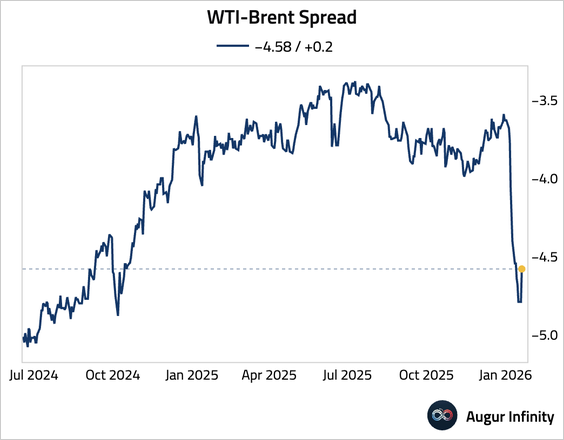
2. The WTI–Brent spread rebounded.
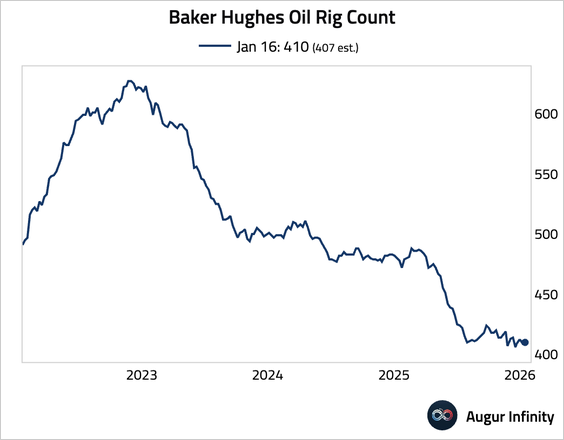
3. The Baker Hughes oil rig count inched up to 410.
4. The following chart shows forecasts from Oxford Economics for oil prices under different Iran scenarios.
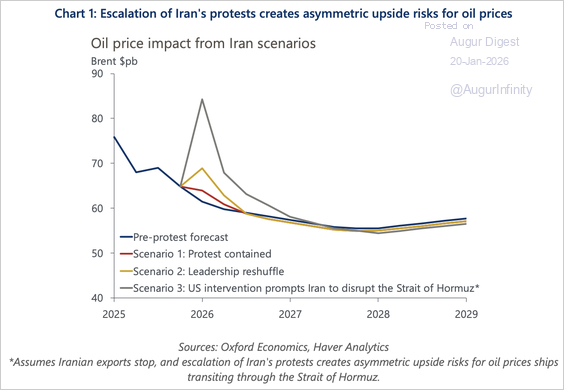
Source: Oxford Economics
5. While its clout has declined, Iran remained OPEC’s fourth-largest producer.
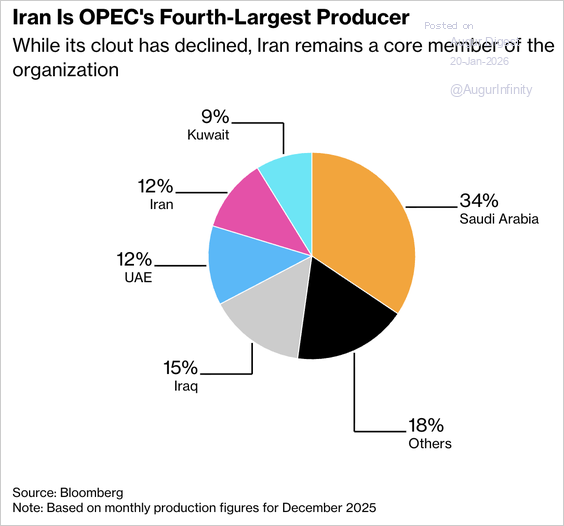
Source: Bloomberg Read full article
6. US oil production has increased dramatically over the past 15 years.
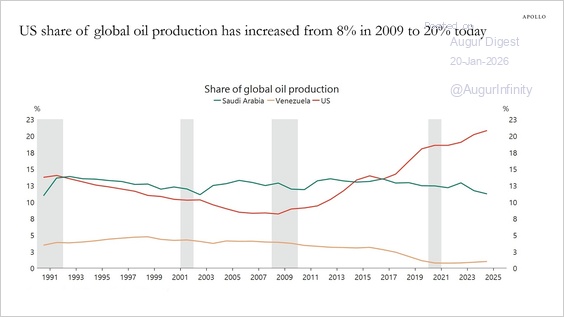
Source: Torsten Slok, Apollo
Commodities
1. Commodities as an asset class represent only a small percentage of the ETF market, totaling just shy of 3% of the $14 trillion universe ($373 billion).
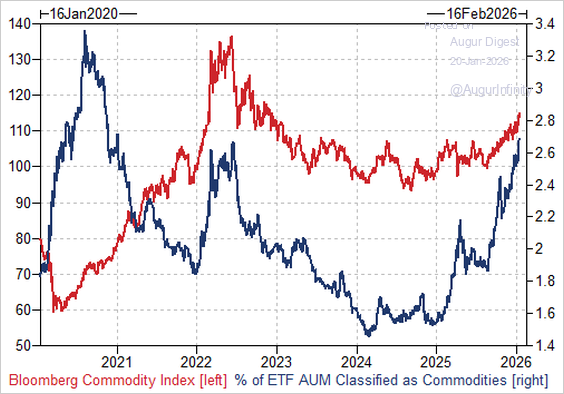
Source: Goldman Sachs
• Gold and silver account for the majority of the assets under management.
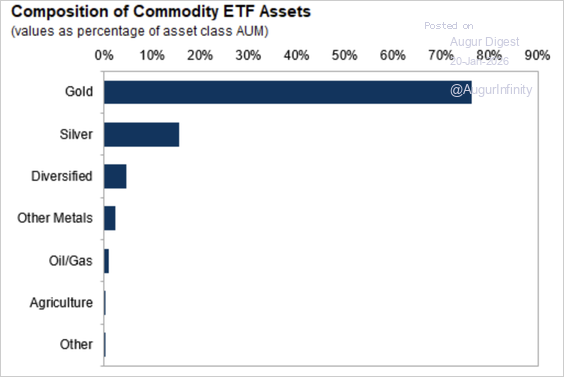
Source: Goldman Sachs
2. Soaring silver prices have driven the metal’s share of solar panel costs to 29%, intensifying margin pressure on already loss-making manufacturers. Panel makers are raising prices and accelerating substitution toward cheaper materials like copper, with silver use in the sector expected to fall this year.
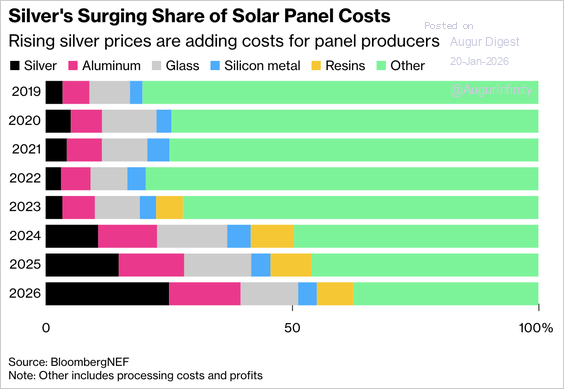
Source: @markets Read full article
3. Iron ore prices fell as China’s steel output dropped more than 4% in 2025 to the lowest level since 2018, while port inventories climbed for seven consecutive weeks to 155.4 million tons, the highest since April 2022.
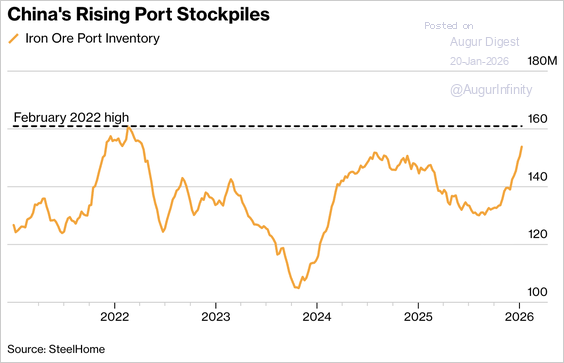
Source: @markets Read full article
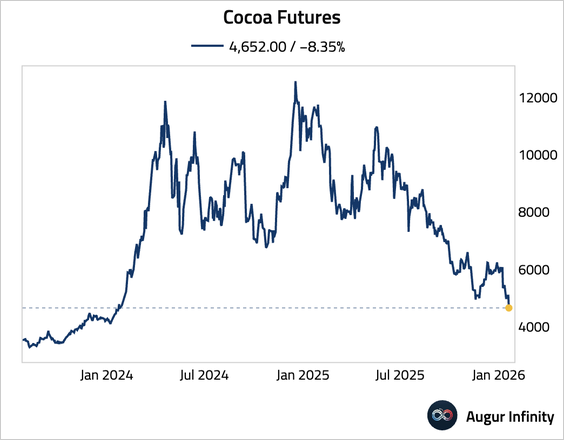
4. Cocoa slumped to the lowest level since January 2024.
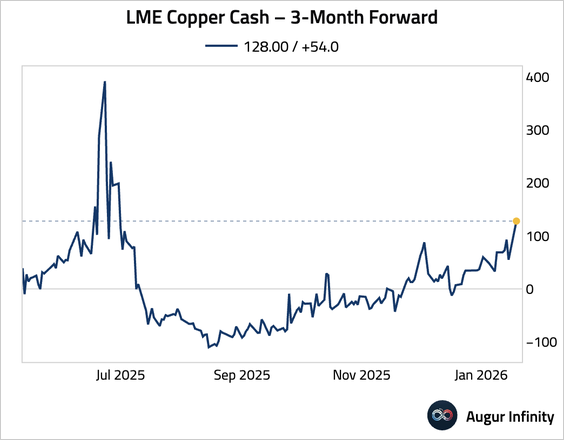
5. Copper backwardation has intensified.