Administrative Update
Starting February 2, Augur Digest will transition to require a paid subscription. As a thank you to our loyal readers, we will send out a special link with discounted pricing later this month.
The United States
1. Durable goods orders jumped by more than expected, the biggest sequential gain in six months.
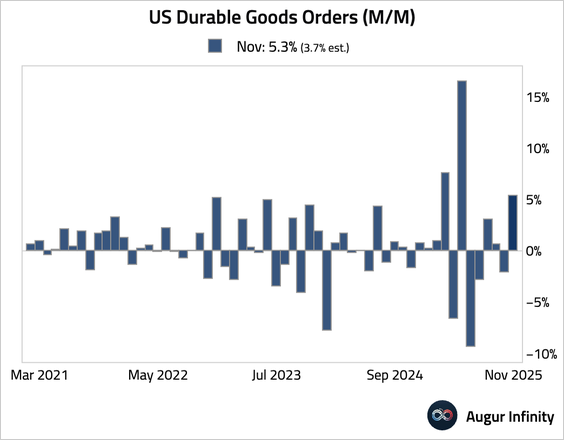
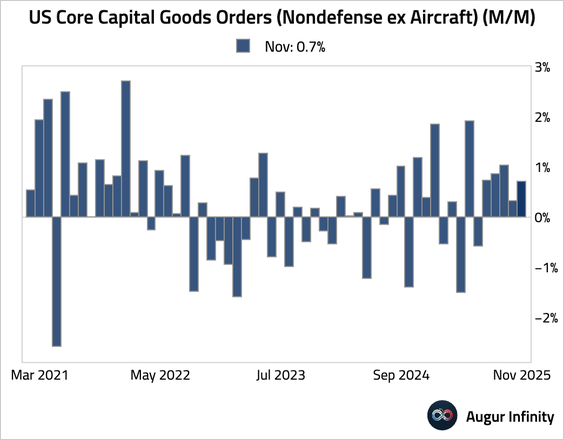
• The jump was due to a surge in volatile commercial aircraft orders. Orders excluding transportation rose a robust 0.5%, …
… and core capital goods orders (nondefense excluding aircraft) increased by a solid 0.7%, signaling that business investment has remained resilient.
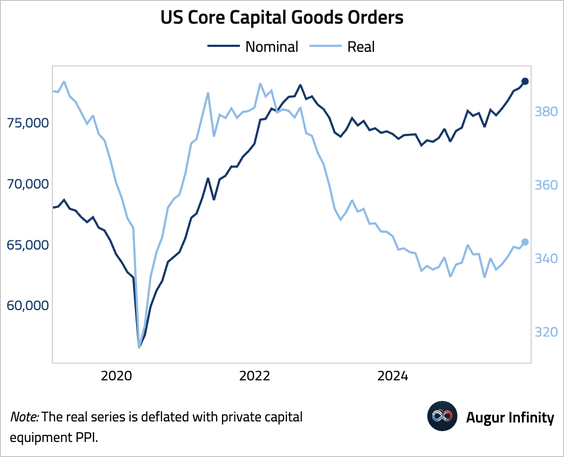
• Here is a look at nominal and real capital goods orders (levels).
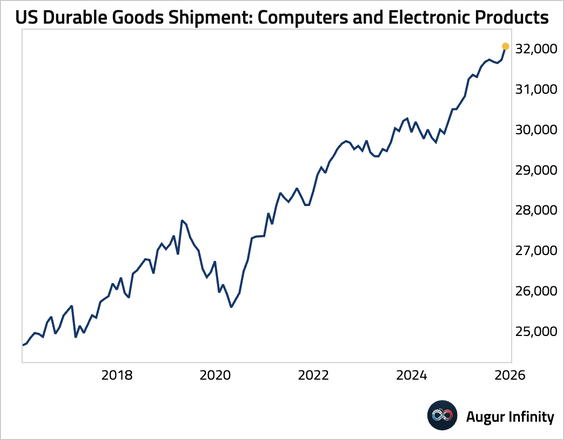
• Shipments of computers and electronic products surged.
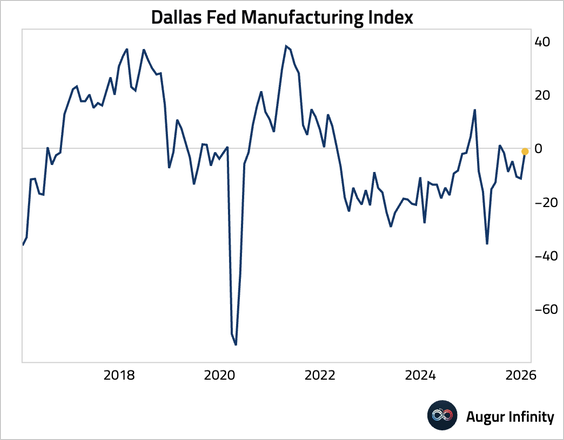
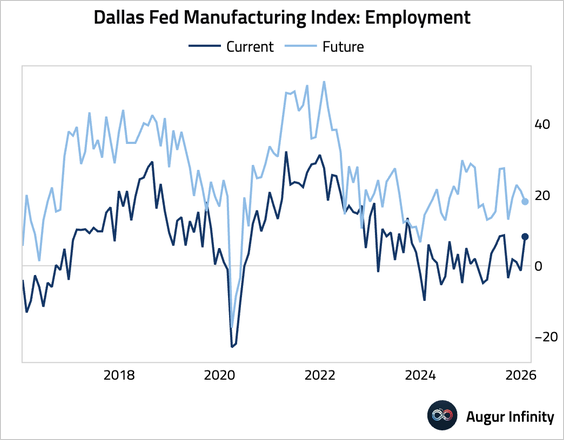
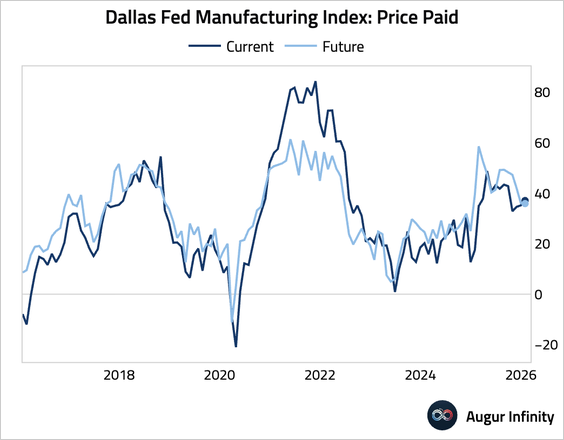
2. The Dallas Fed Manufacturing Index improved meaningfully.
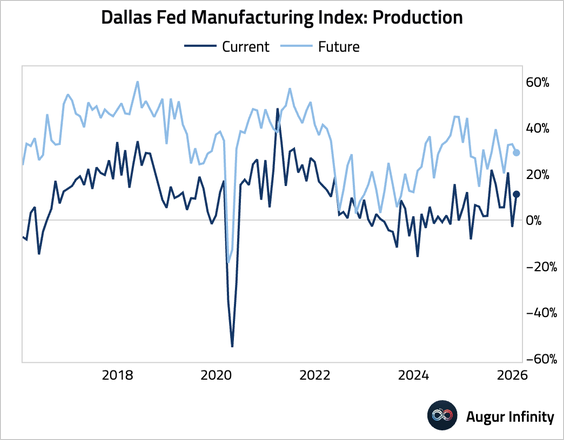
• Production (returned to expansion, but future expectations eased):
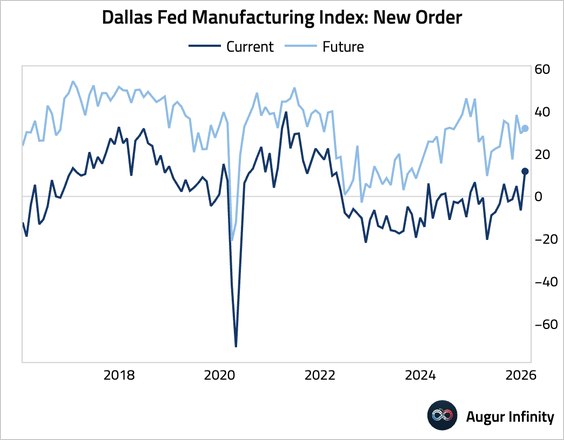
• New orders (surged back into expansionary territory):
• Employment (jumped):
• Price pressure (ticked up):
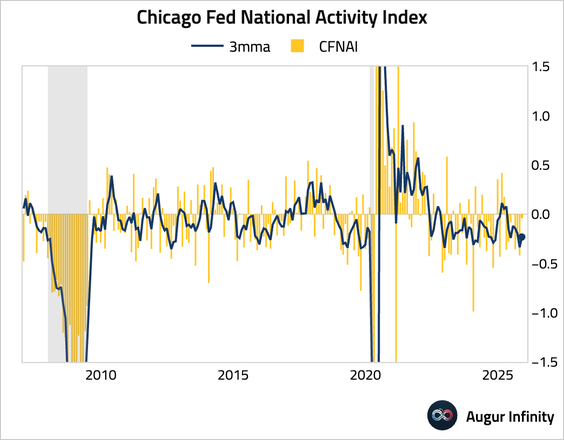
3. The three-month moving average of the Chicago Fed National Activity Index edged up.
4. The Conference Board leading index fell by more than expected in November, …
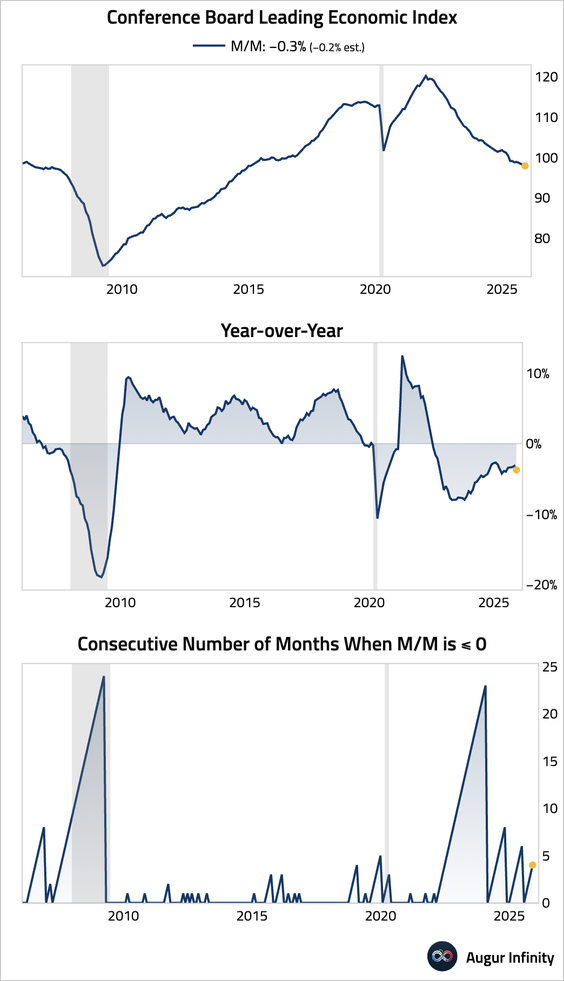
… weighed down by consumer expectations and new orders.
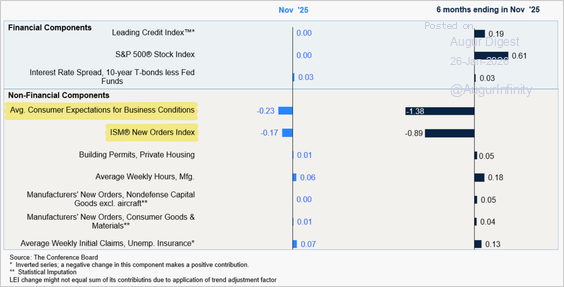
Source: Conference Board
• In contrast, Bridgewater’s leading indicator points to strong and above-consensus growth in the year ahead, led by AI investment.
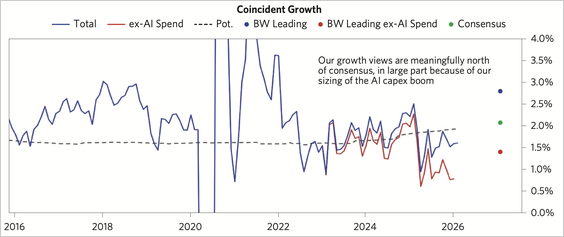
Source: Bridgewater Associates Read full article
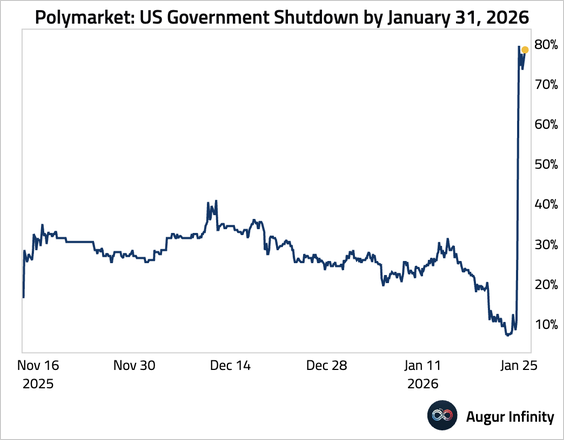
5. On betting markets, the chance of another government shutdown by January 31 has surged.
The Eurozone
1. Germany’s ifo business climate index was unchanged at 87.6 in January, as improving current conditions were offset by weakening expectations—signaling fading momentum in the recovery.
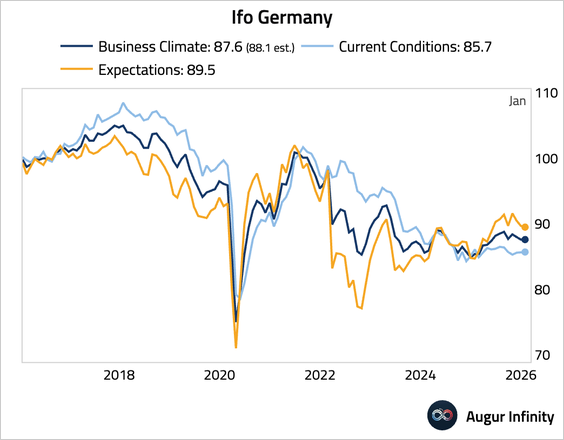
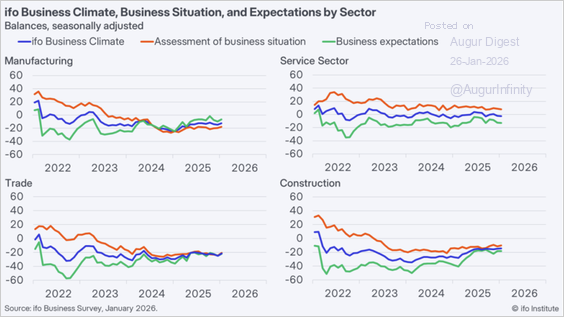
Source: ifo Institute
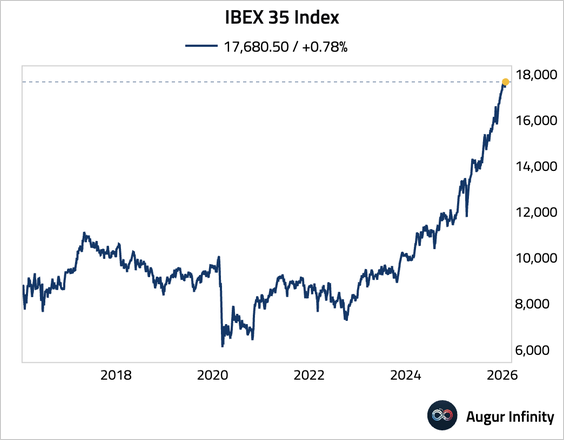
2. The IBEX 35 Index has reached an all-time high.
Europe
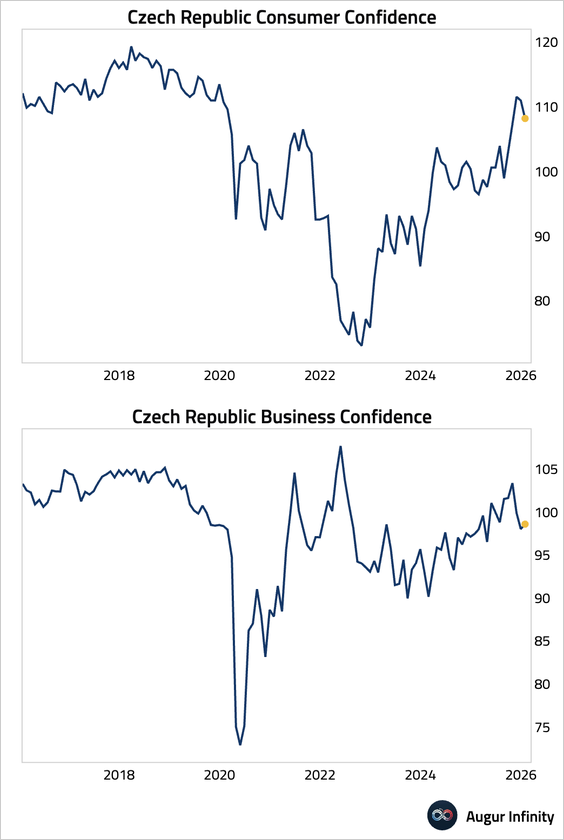
1. Czech Republic consumer confidence moderated further from high levels, while business confidence edged up.
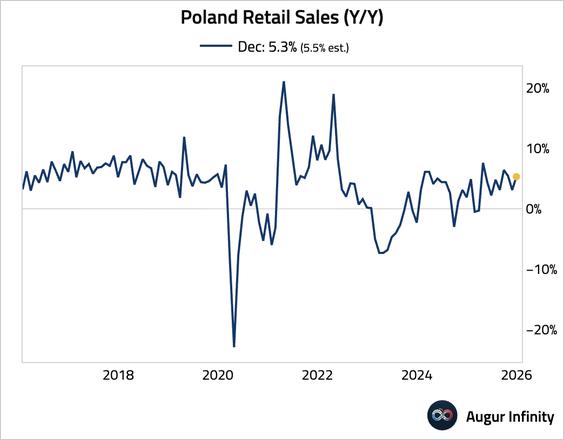
2. Poland’s retail sales growth accelerated, pointing to resilient consumer demand.
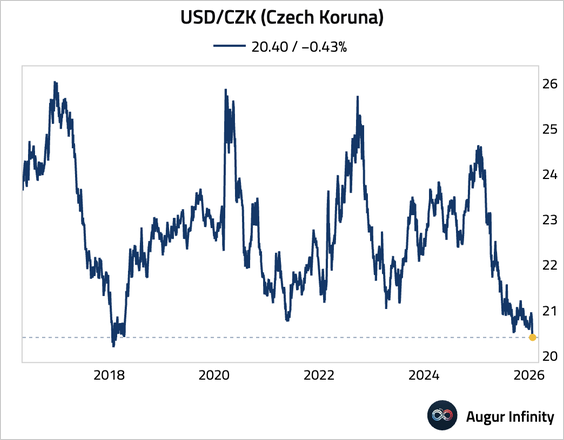
3. Here is a quick look at CEE currencies: • Czech koruna (strongest level against USD since April 2018):
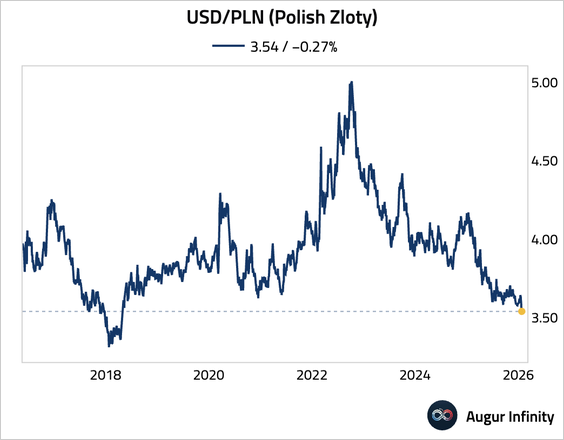
• Polish zloty (strongest level since April 2018):
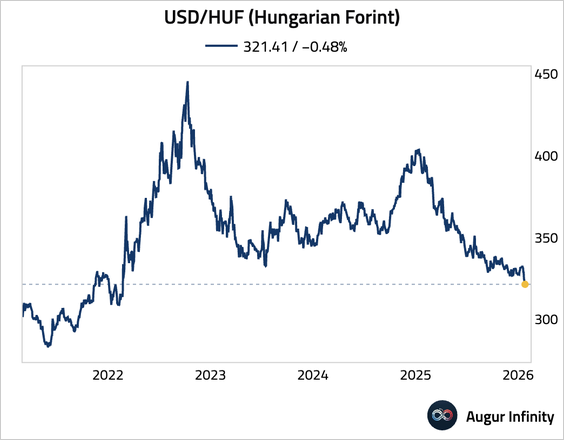
• Hungarian forint (strongest level since February 2022):
Japan
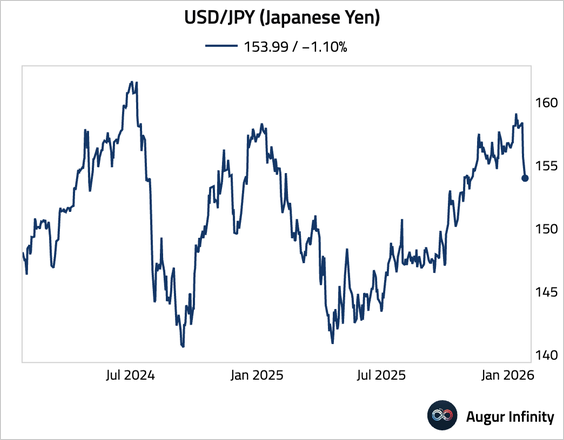
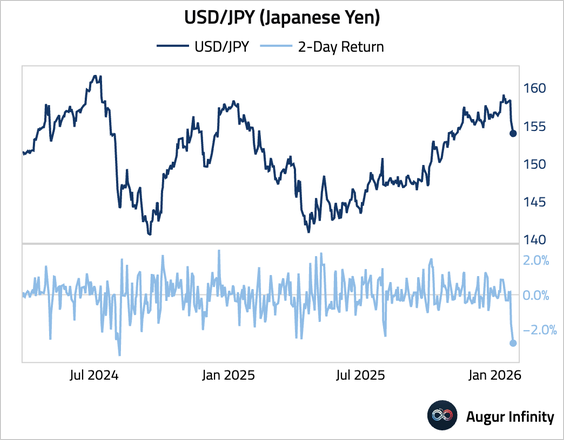
1. The yen extended Friday’s surge amid reports of a New York Fed “rate check,” which fueled speculation of coordinated intervention to counter excessive yen weakness as volatility rose in Japan’s bond market.

Source: @financialtimes Read full article
• This is the best two-day appreciation against the greenback since August 2024.
2. Japan’s abrupt bond-market selloff has raised fears of volatile global rate spillovers as higher domestic yields threaten to unwind carry trades and prompt repatriation of Japan’s vast overseas capital amid fiscal expansion and BOJ retrenchment.

Source: @markets
Asia-Pacific
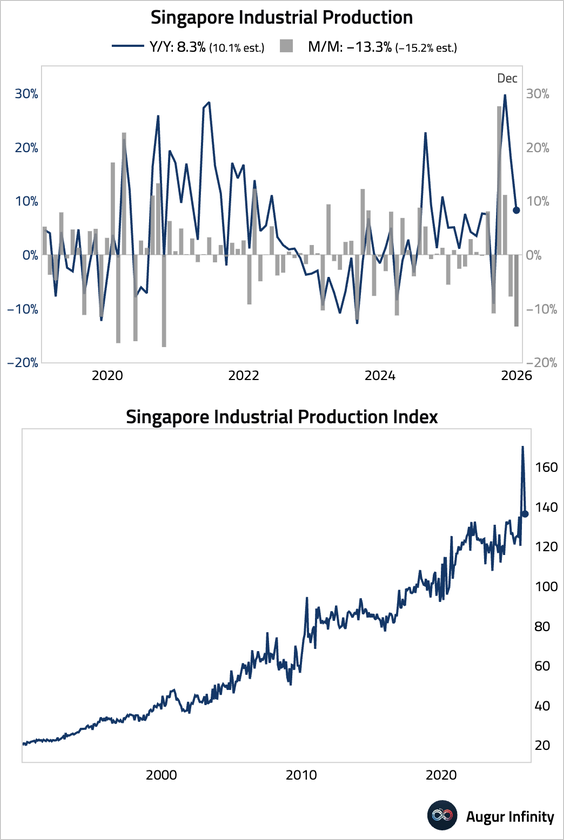
1. Singapore’s industrial production contracted for a second month, with strong electronics and transport engineering growth offsetting a sharp slump in biomedical manufacturing.
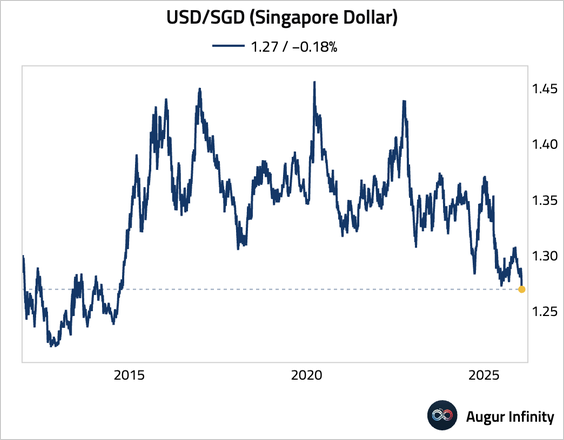
• The Singapore dollar rose to its strongest level since October 2014 against the greenback, supported by safe-haven inflows.
China
1. China ETFs saw record outflows.
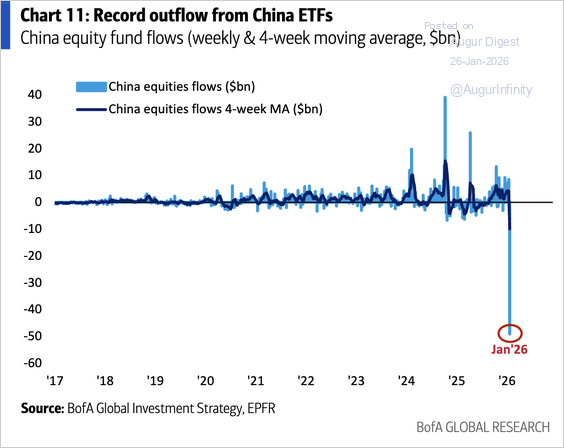
Source: BofA Global Research
Emerging Markets
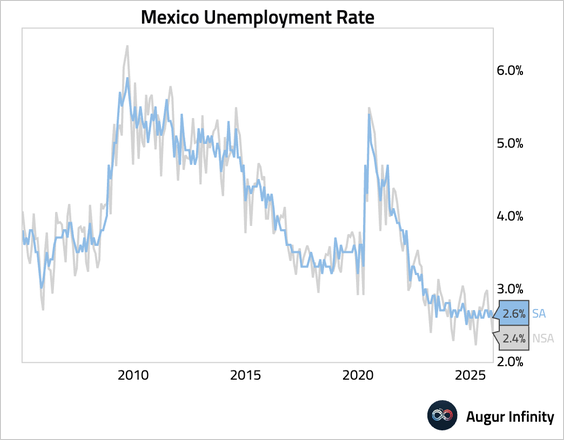
1. Mexico’s unemployment rate unexpectedly fell back to near secularly low levels.
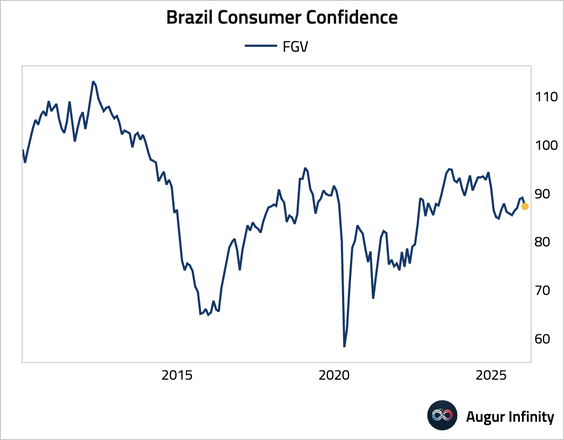
2. Brazilian consumer confidence inched down.
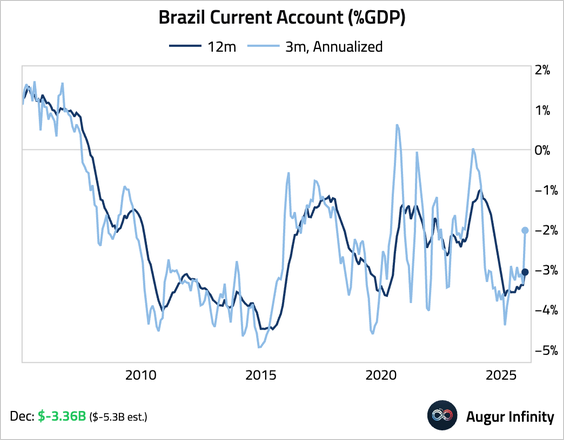
• Current account deficit narrowed more than expected in November.
Equities
1. US equities advanced for the fourth consecutive session, with the S&P 500 up 0.5% and the Nasdaq Composite rising 0.4%. Other major markets also extended their recent gains; German, French, and Australian equities all posted their fourth straight day of increases, while Mexico’s market rose for a sixth consecutive day.
2. Long/short managers’ gross leverage rose for a third week to a record high, based on Goldman’s prime brokerage data.
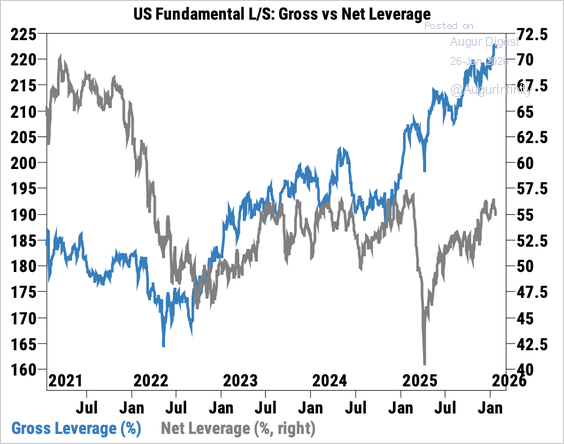
Source: Goldman Sachs
• Tech was the most net sold sector for a second straight week, driven mostly by short sales and led by software stocks.
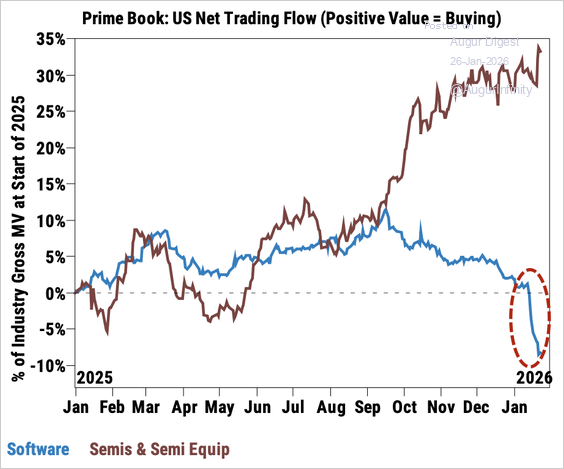
Source: Goldman Sachs
3. Global breadth, measured by the percentage of ACWI markets within 5% of a one-year high, hit a new cycle high at 92%. It is the highest reading for the indicator since 2007.
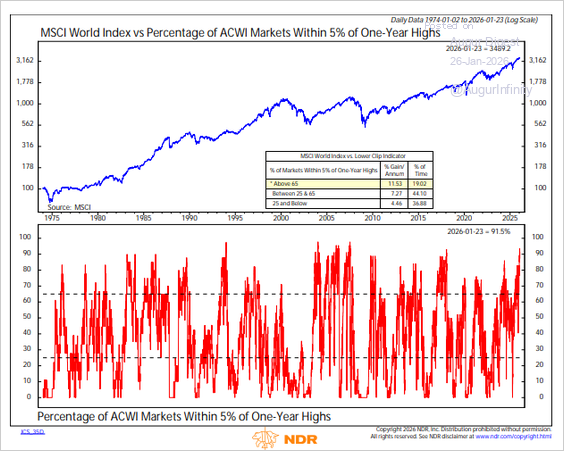
Source: NDR Research via Rob Anderson
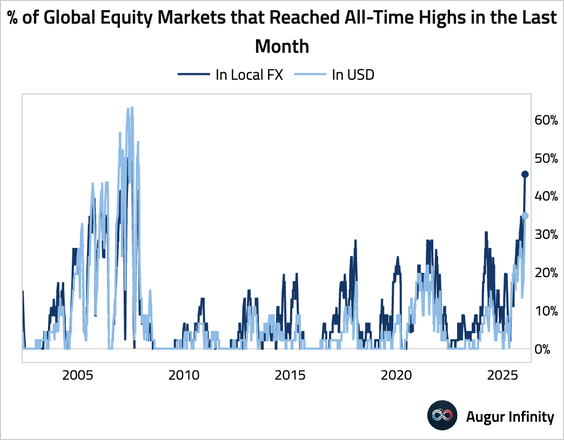
• Nearly half of global equity markets touched all-time highs at some point in the last month.
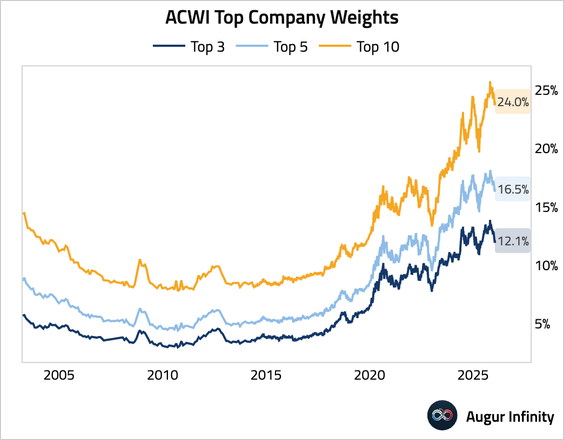
4. The market-cap weight of the top 10 companies in the S&P 500 has dipped below 40%.
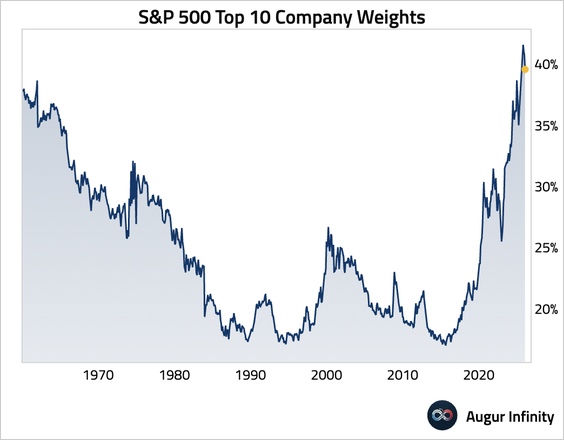
• Here are the weights of the top 3, 5, and 10 companies in ACWI, the global equity index.
5. Both the cap-weighted and equal-weighted S&P 500 are trading at high forward P/E multiples.
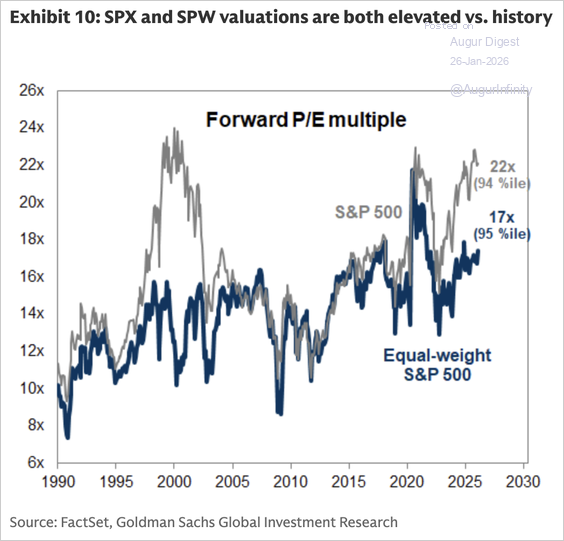
Source: Goldman Sachs
• Consensus estimates suggest earnings growth will be stronger for the cap-weighted S&P 500 (SPX) than for the equal-weighted counterpart (SPW) in 2026 and 2027.
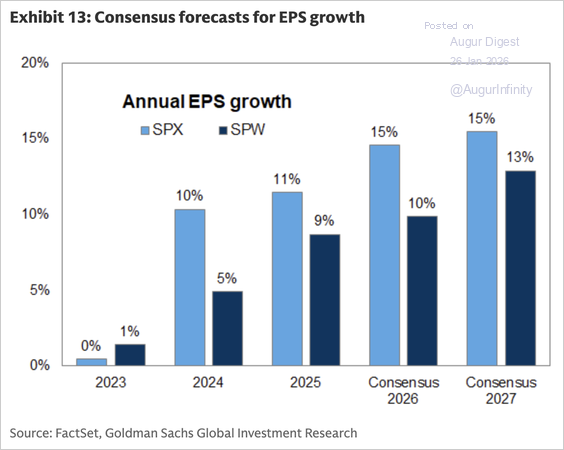
Source: Goldman Sachs
• EPS revisions have also been substantially stronger for the cap-weighted SPX than for the equal-weighted SPW.
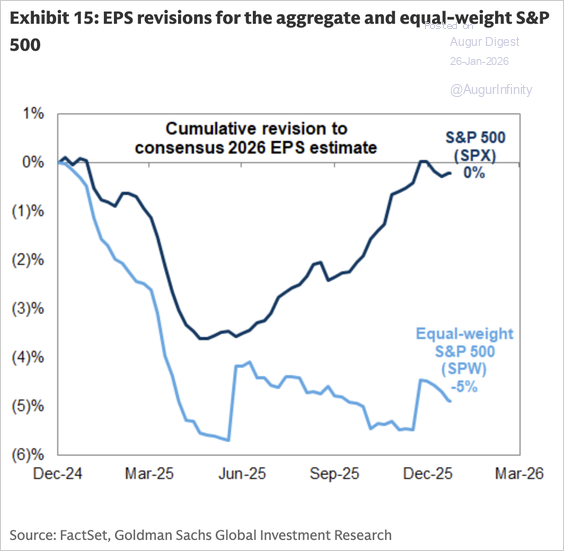
Source: Goldman Sachs
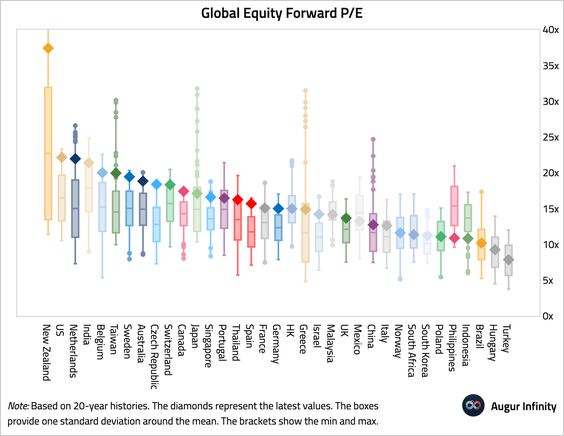
6. The US now has the second-highest forward P/E in our core coverage universe, surpassed only by New Zealand (though the latter is thinly represented).
7. US tech valuations have been flat over the past two years, unlike the surge in forward P/E during the final years of the tech bubble.
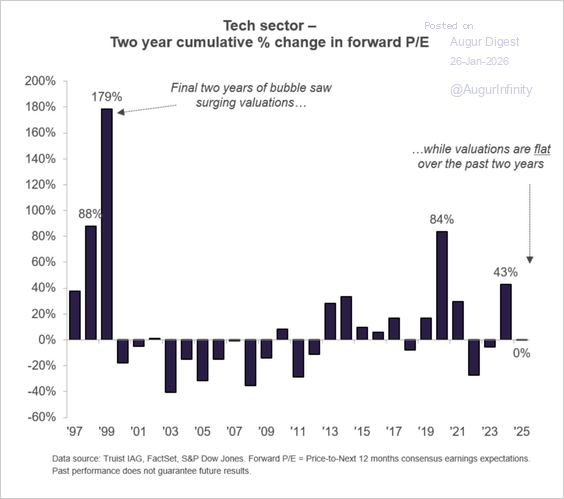
Source: Truist Advisory Service
8. Bank of America’s Bull & Bear Indicator suggests extreme bullishness.
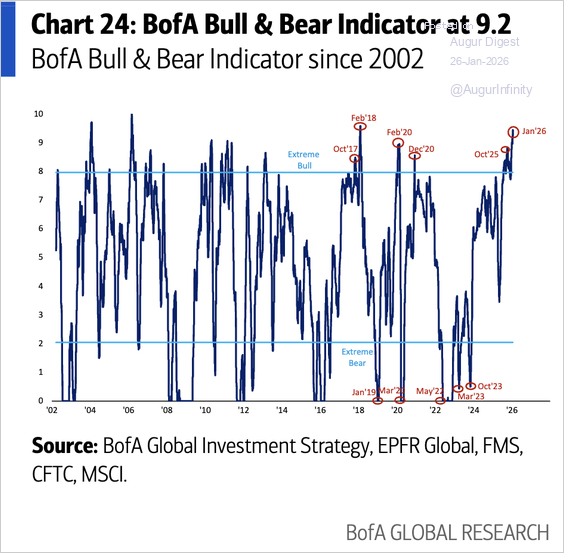
Source: BofA Global Research
9. The three major value groups are setting up for a synchronized breakout.
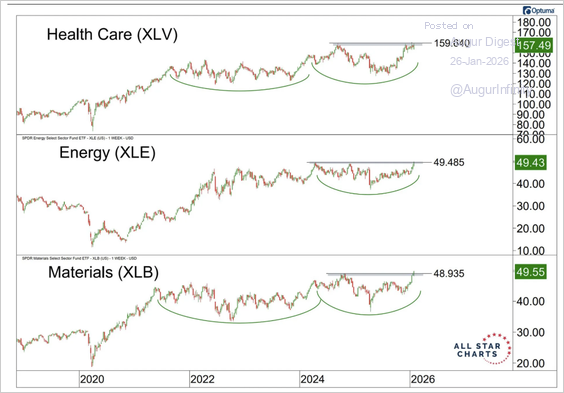
Source: @nullcharts
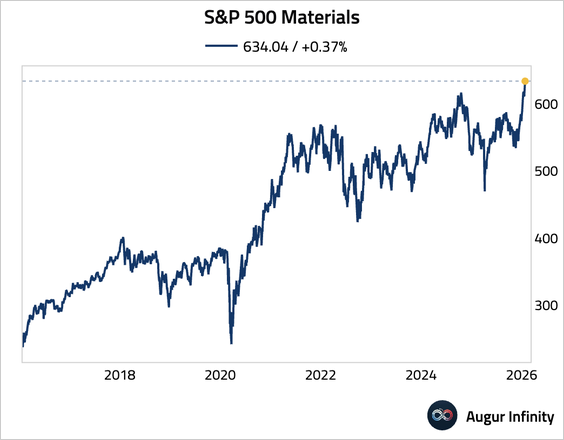
10. The materials sector has reached its sixth all-time high this year.
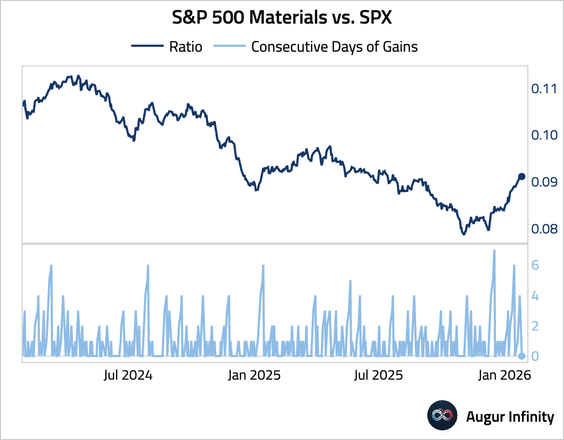
• The ratio of the materials sector to the S&P 500 has gained for five consecutive days.
Rates
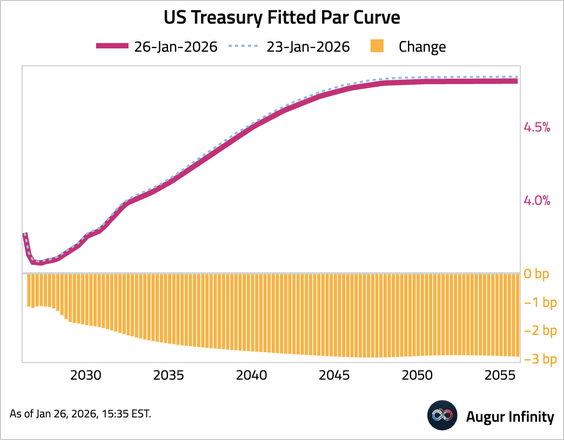
1. Treasury yields declined across the curve. The 10-year and 30-year yields both fell for the fourth consecutive day, declining by 2.4 bps and 2.9 bps, respectively.
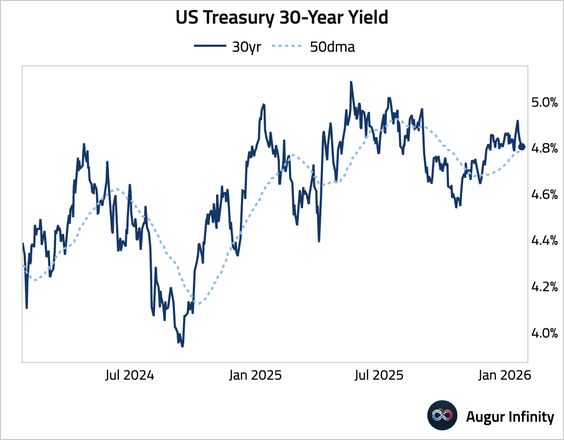
2. US Treasury 30-year yield is testing support at the 50-day moving average.
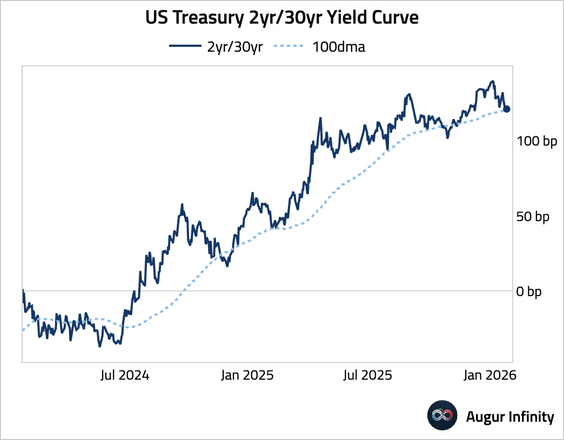
3. The US Treasury 2-year/30-year yield curve fell below its 100-day moving average.
Credit
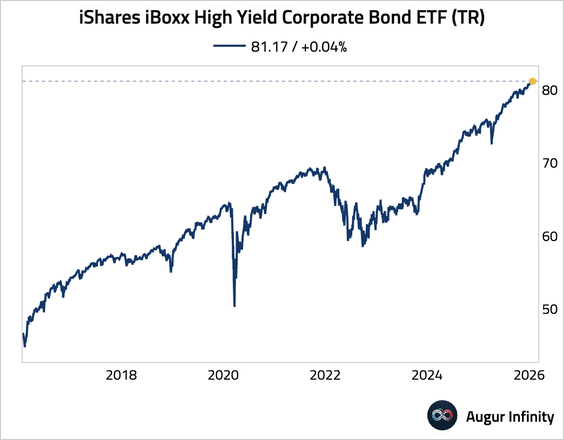
1. iShares iBoxx High Yield Corporate Bond ETF (TR) has reached an all-time high.
Energy
1. US natural gas soared above $6 for the first time since 2022 as the Arctic blast knocked out nearly 10% of production while heating demand spiked, with gains amplified by thin liquidity ahead of the February contract's expiry.
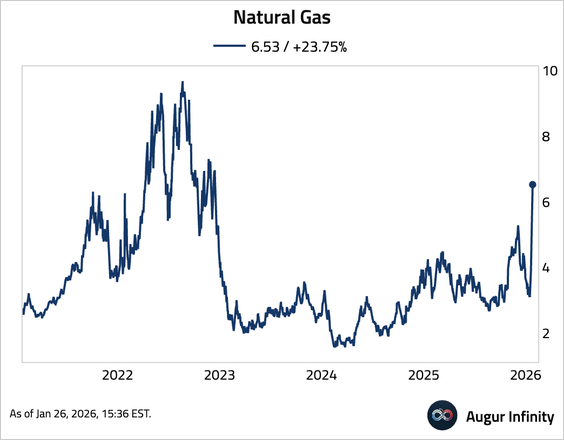

Source: Bloomberg Read full article
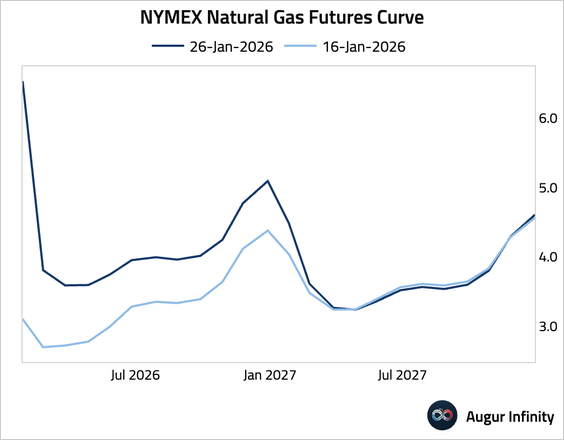
• The futures curve backwardation has intensified further.
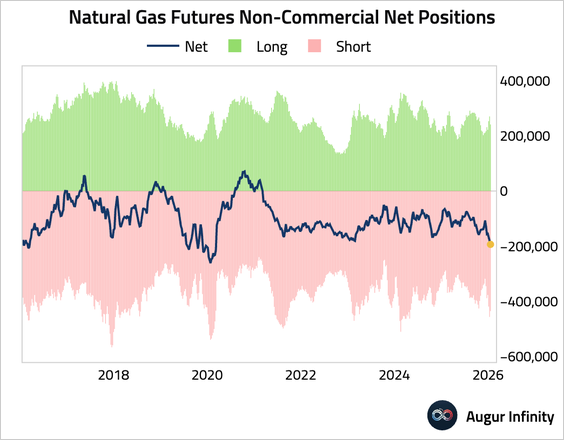
• Speculative accounts increased bets against natural gas last week.
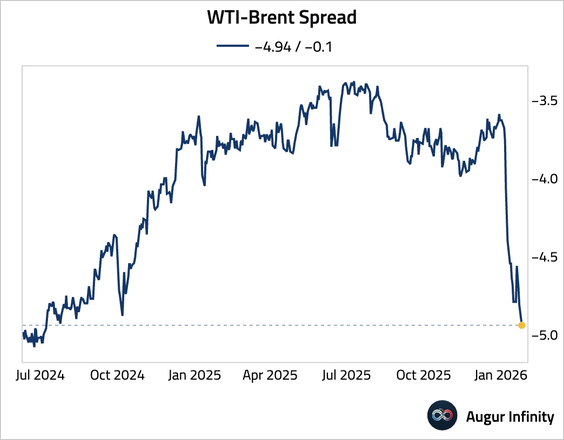
2. WTI-Brent spread is at the lowest level since October 2024.
Commodities
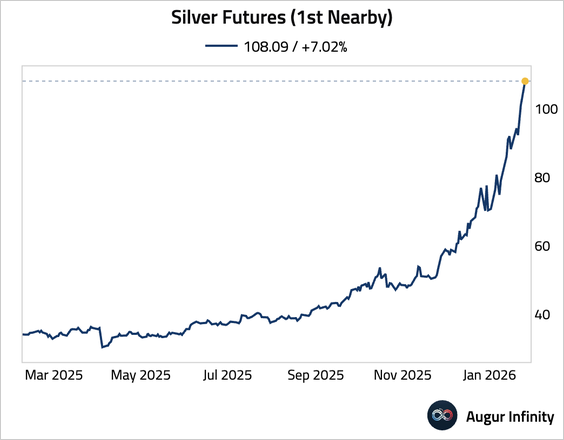
1. Gold surged beyond $5,000, …
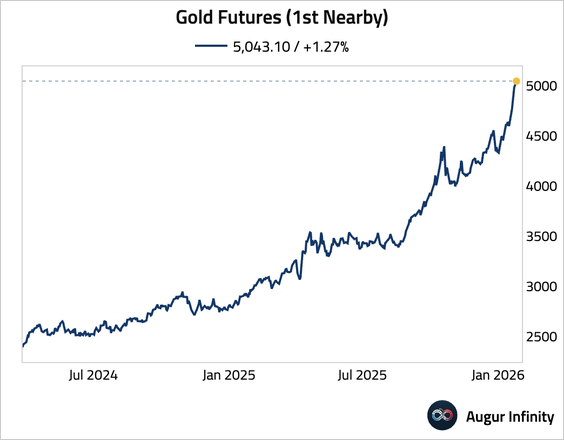
… while silver topped $100, as geopolitical upheaval, a weakening US dollar, heavy central-bank buying, and investor flight from bonds and currencies intensified the global “debasement trade.”

Source: @markets Read full article
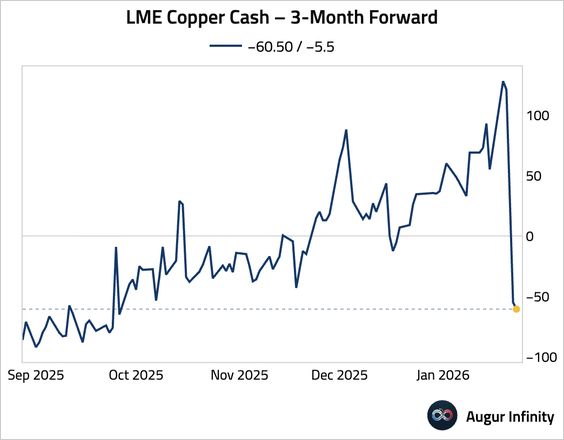
2. The copper curve flipped to contango.
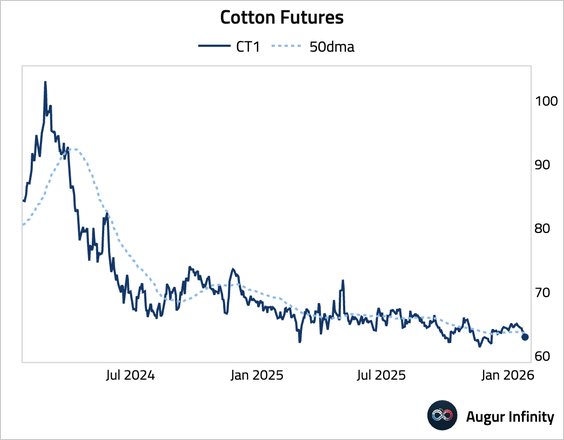
3. Cotton fell below its 50-day moving average.
Global Developments
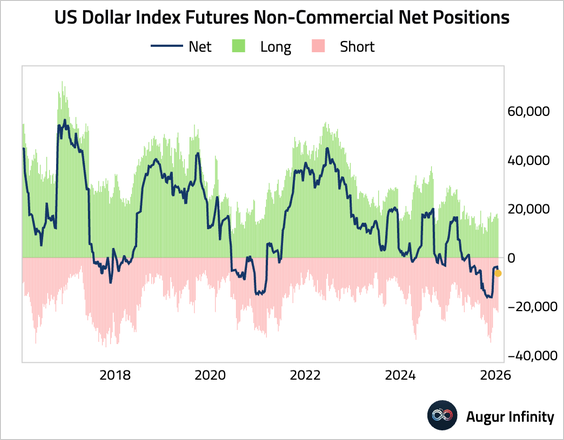
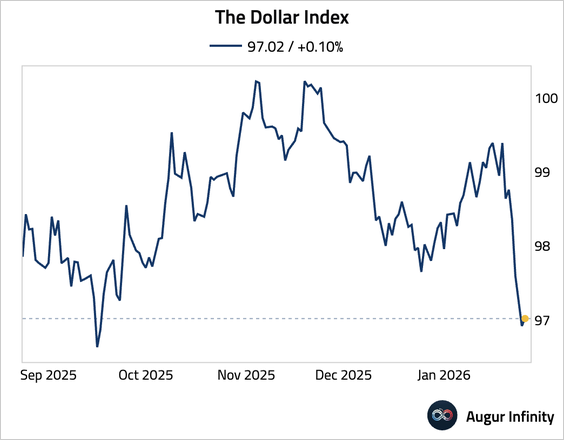
1. The dollar index had the worst day since April 2025 and fell to the lowest level since September 2025.
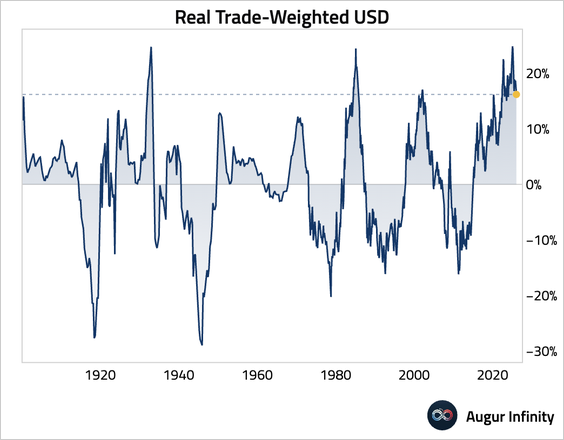
• The dollar remained elevated on a real, trade-weighted basis.
• Net positions in US dollar index futures fell for the first time in eight weeks.