Administrative Update
Starting February 2, Augur Digest will transition to require a paid subscription. As a thank you to our loyal readers, we will send out a special link with discounted pricing later this month.
The United States
1. The Conference Board consumer confidence index plunged to its lowest level since 2014, well below consensus. The sharp, broad-based decline was driven by pessimism over business, labor, and income outlooks.
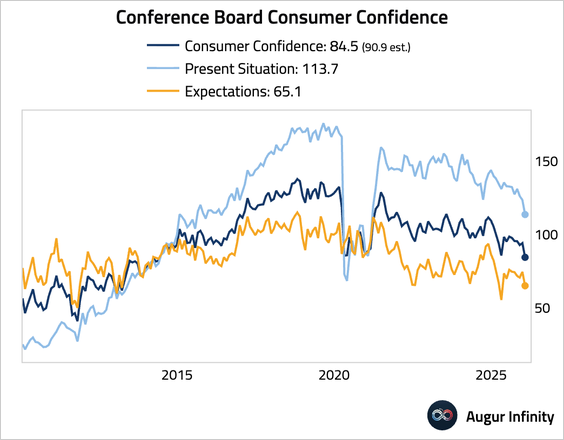
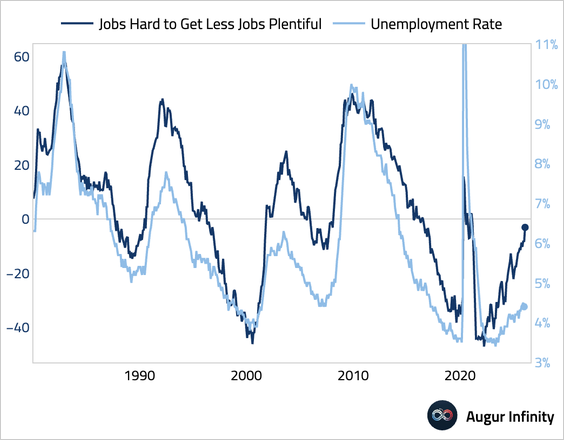
• The “jobs hard to get” less “jobs plentiful” spread rose to the highest level since early 2021.
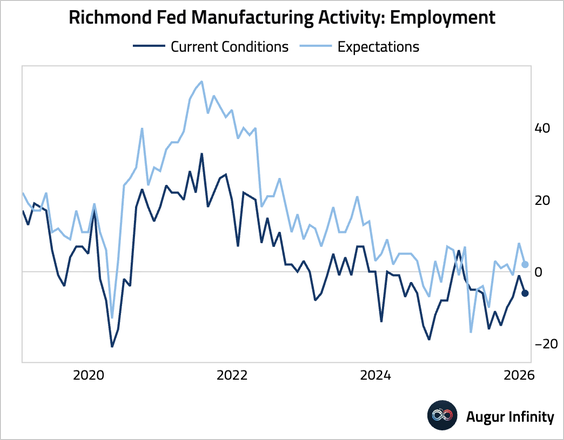
2. The Richmond Fed Manufacturing Index improved slightly to -6 in January, beating expectations but remaining in contractionary territory.
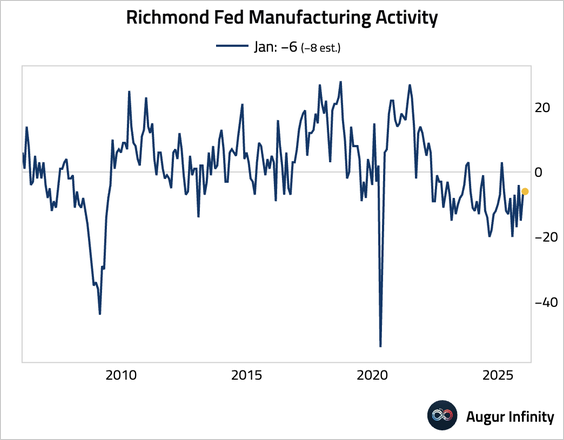
• The modest gain was driven by better shipments and new orders, …
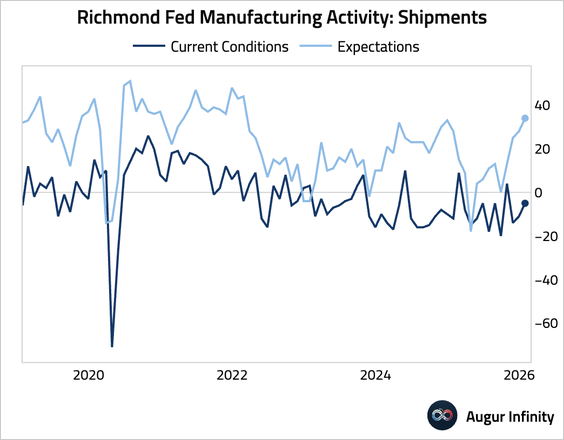
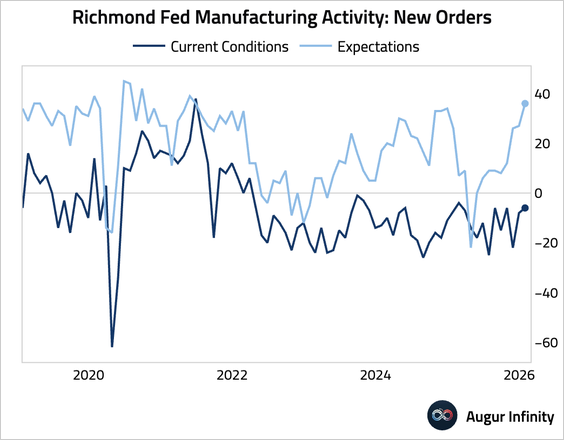
… offset by a drop in the employment component.
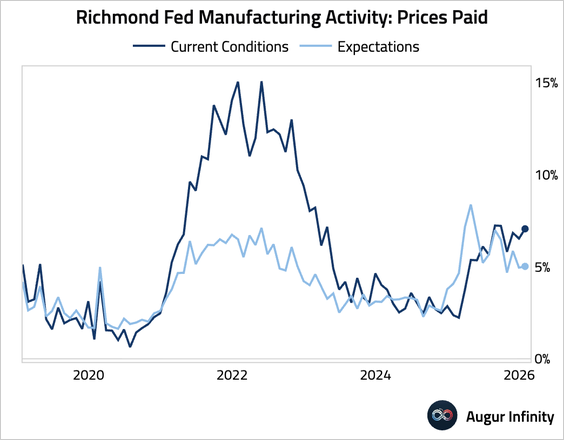
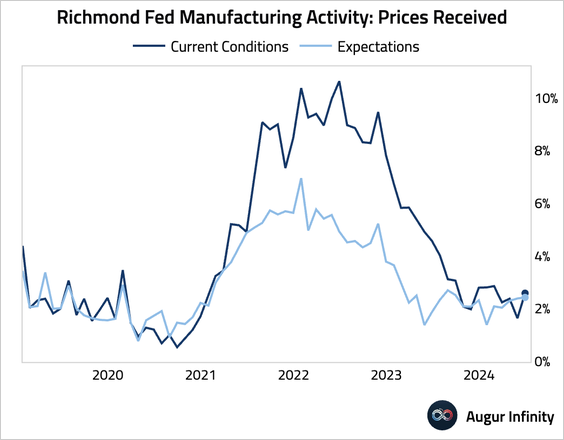
• Price data pointed to margin compression as prices paid rose while prices received fell.
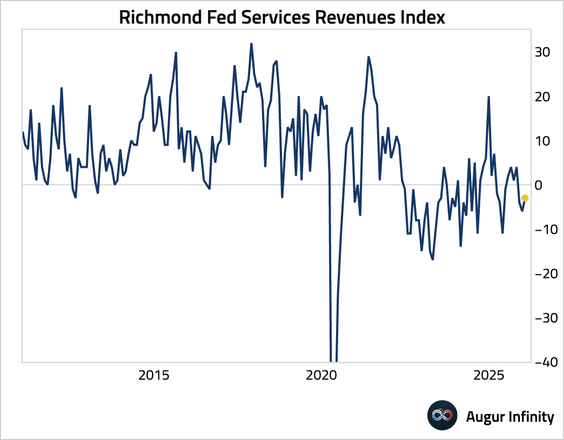
3. The Richmond Fed’s services revenue index improved in January but remained in contraction for a third consecutive month.
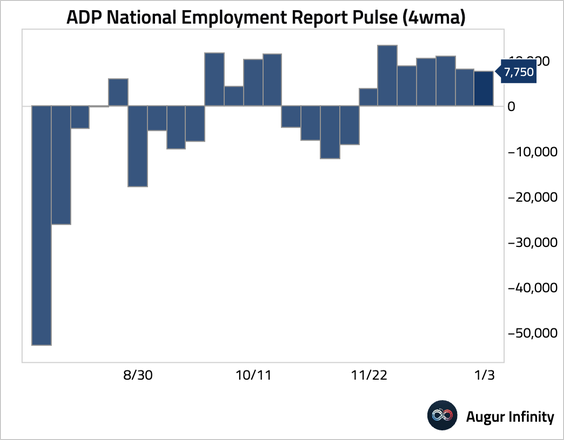
4. The ADP’s weekly employment report indicated roughly stable hiring.
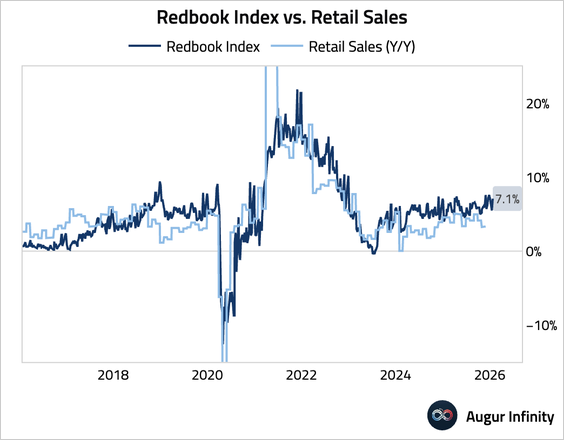
5. The Redbook index of same-store sales growth accelerated last week.
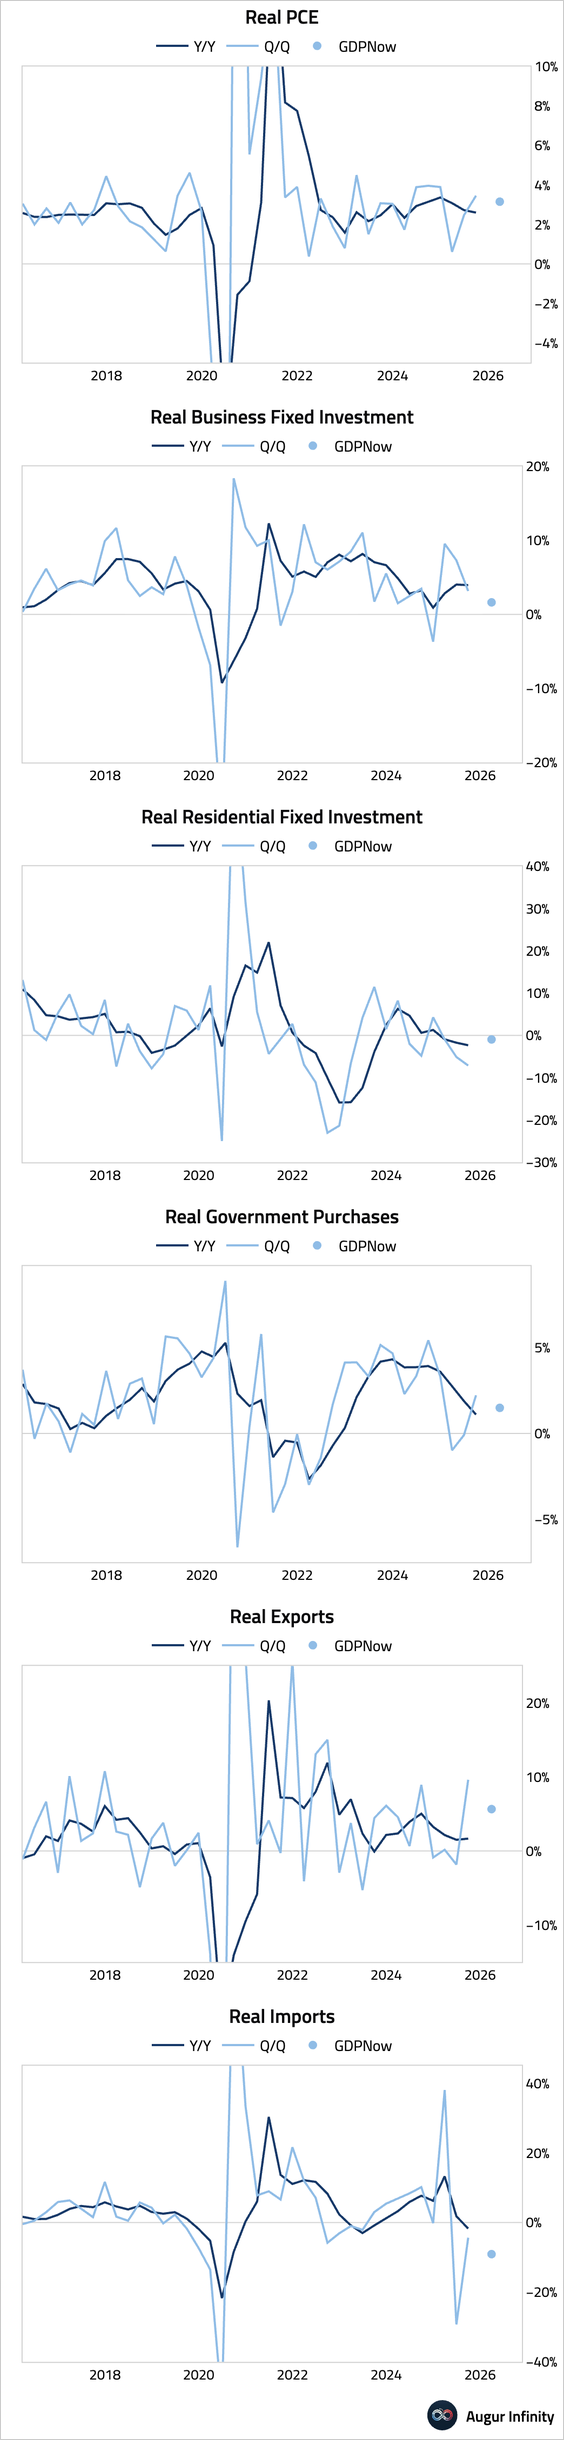
6. Here is an updated look at what the Atlanta Fed’s GDPNow model is saying about each component of GDP in Q4 2025.
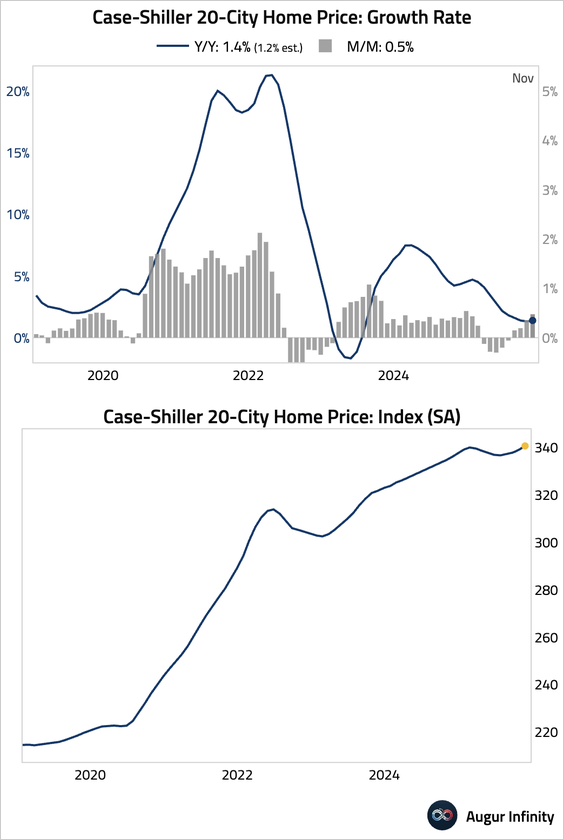
7. Home price growth accelerated, according to the S&P/Case-Shiller index, beating consensus expectations.
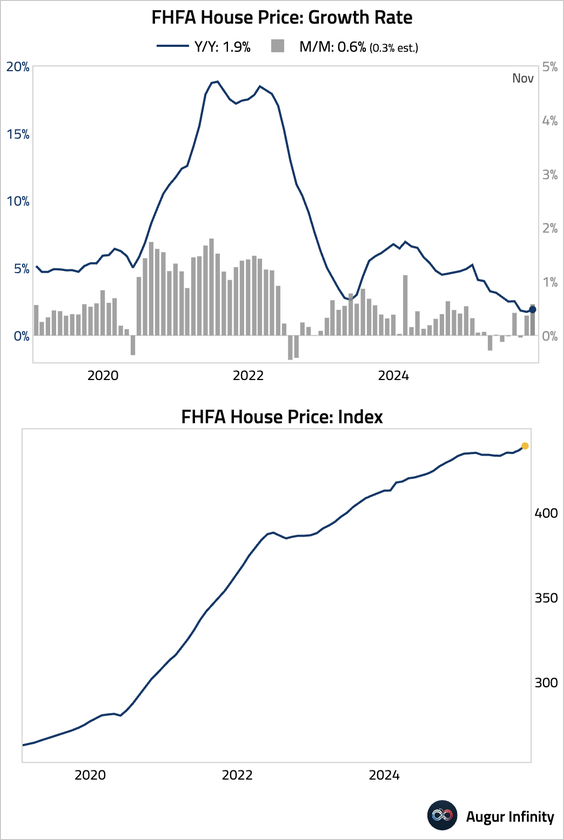
8. The FHFA House Price Index also topped expectations, rising to a new all-time high in November.
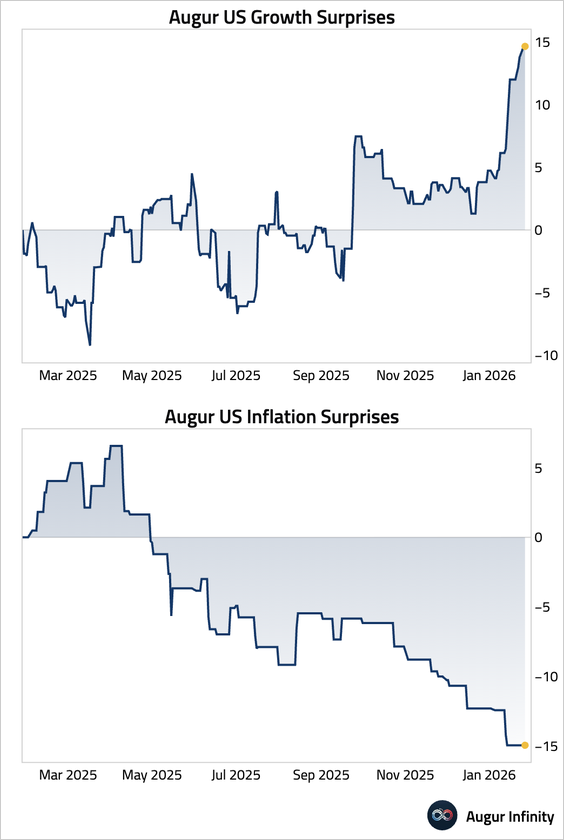
9. US growth data have generally surprised to the upside, while inflation data have surprised to the downside.
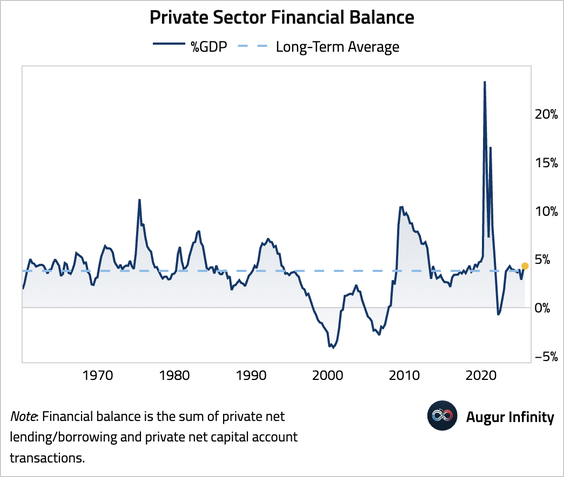
10. The private sector financial balance has improved, a touch above the long-term average.
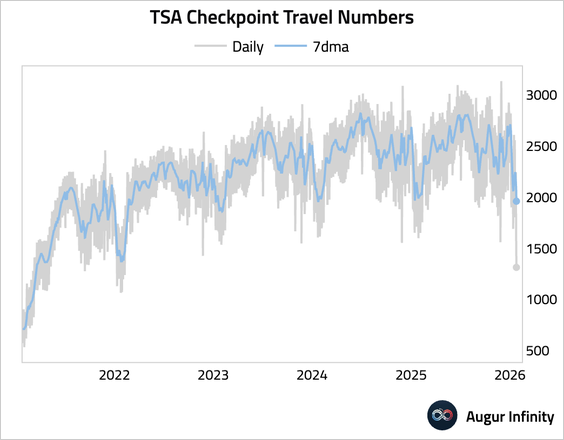
11. The winter storm has disrupted travel, forcing mass flight cancellations. • TSA checkpoint traveler volume:
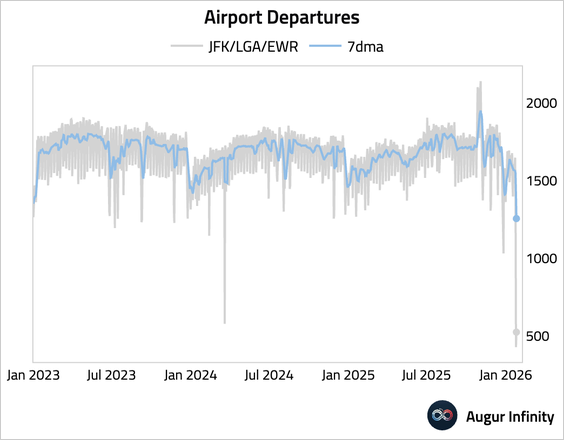
• Flight departures from the New York area:
Canada
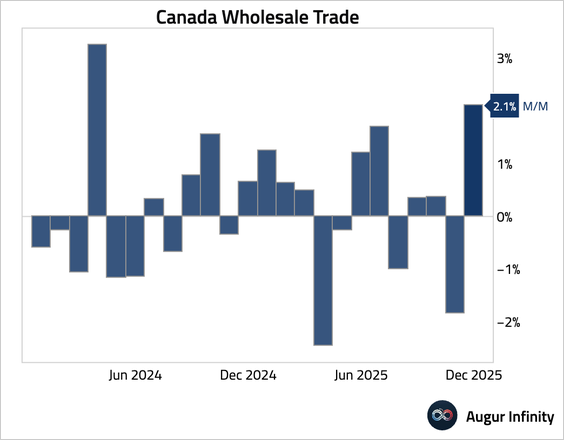
1. Wholesale sales rebounded strongly in December, reversing the prior month’s decline.
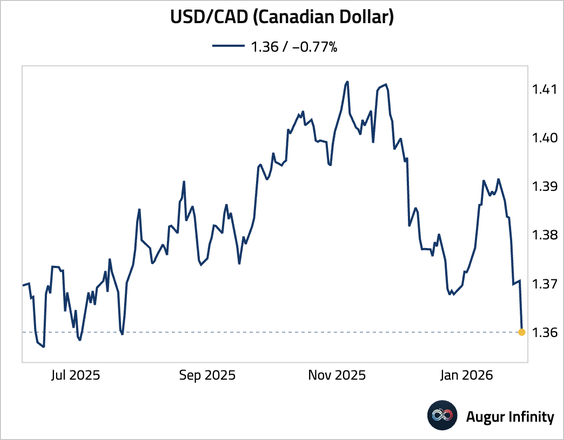
2. USD/CAD is at the lowest level since July 2025.
The Eurozone
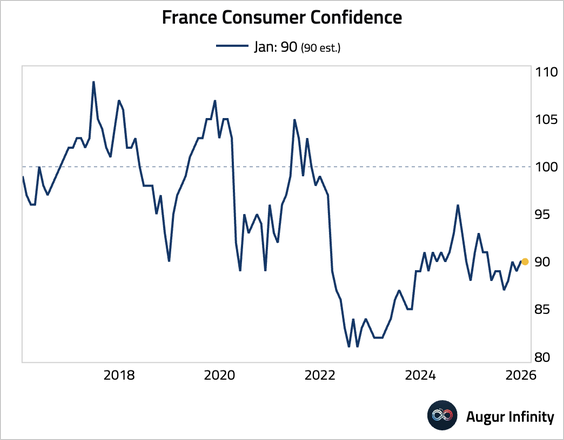
1. French consumer confidence held steady, with slightly firmer household financial expectations but softer purchasing intentions and living-standards outlook—pointing to a broadly stable consumer backdrop.
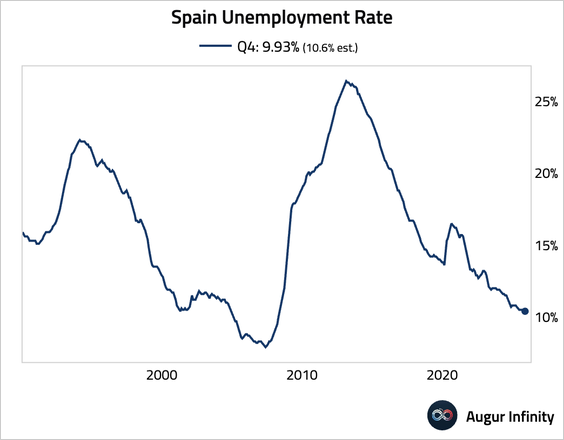
2. Spain’s unemployment rate fell to its lowest point since 2008.
3. The iTraxx Crossover index, a gauge of European credit risk, has dropped toward multiyear lows after a brief spike last week.
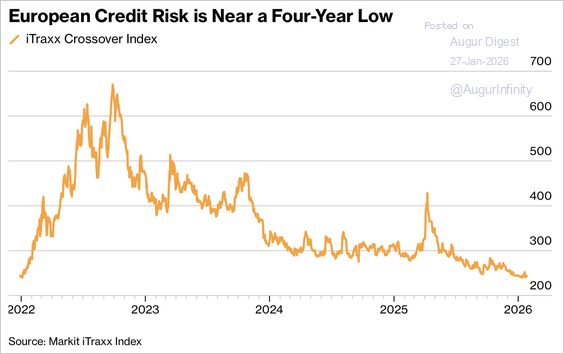
Source: @markets Read full article
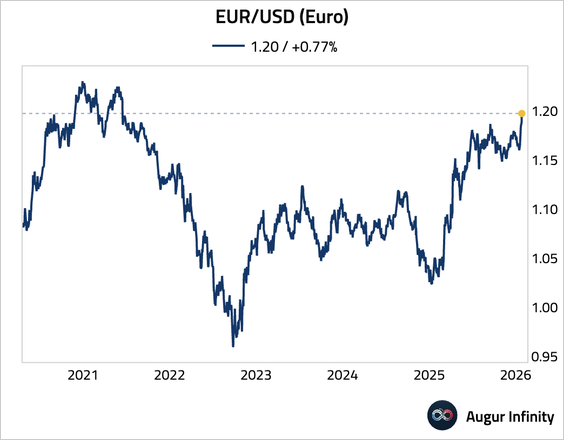
4. EUR/USD is trading at the highest level since June 2021.
Europe
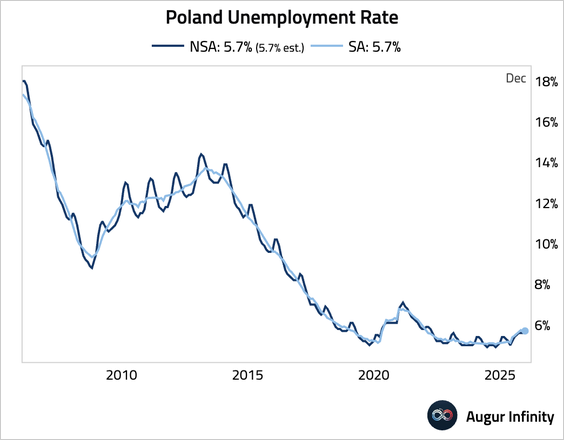
1. Poland’s unemployment rate edged up to 5.7% in January, matching consensus estimates.
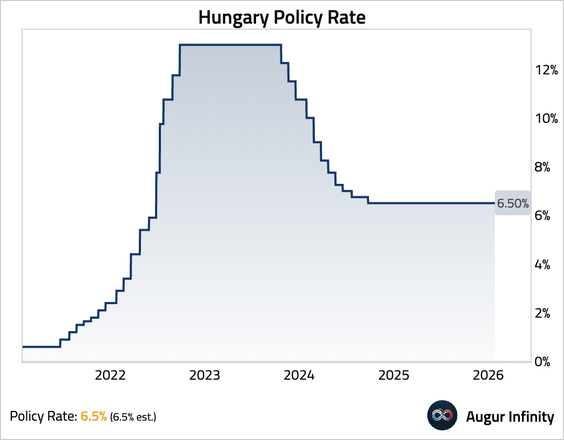
2. The National Bank of Hungary held its key interest rate steady at 6.5%, as expected.
Japan
1. Japan’s government bond liquidity index, which measures the pricing deviation of individual JGBs relative to a fair value curve, has deteriorated sharply.
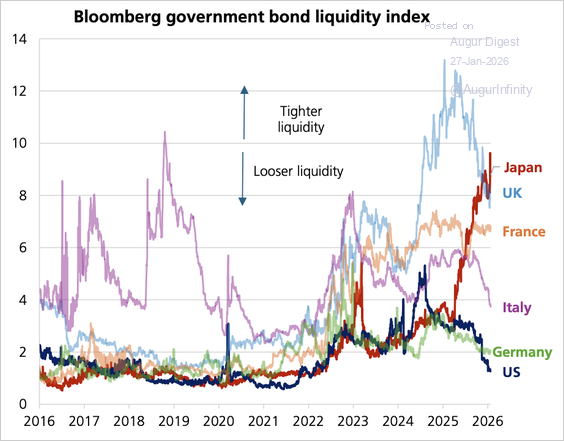
Source: Bloomberg via UBS
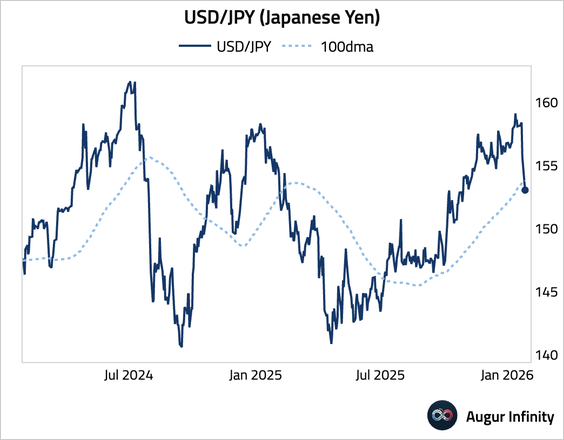
2. USD/JPY fell below its 100-day moving average.
Asia-Pacific
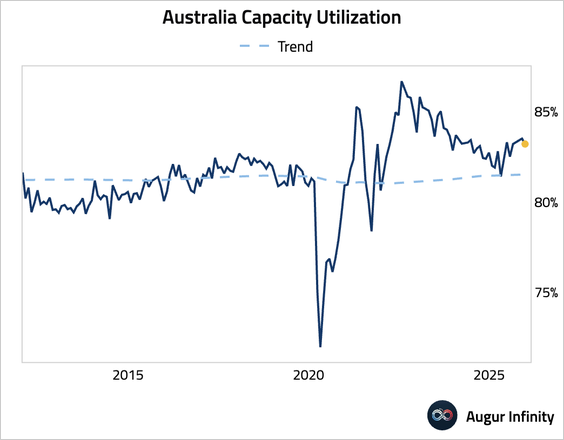
1. Australian business confidence edged higher in December, driven by stronger trading conditions and profitability.
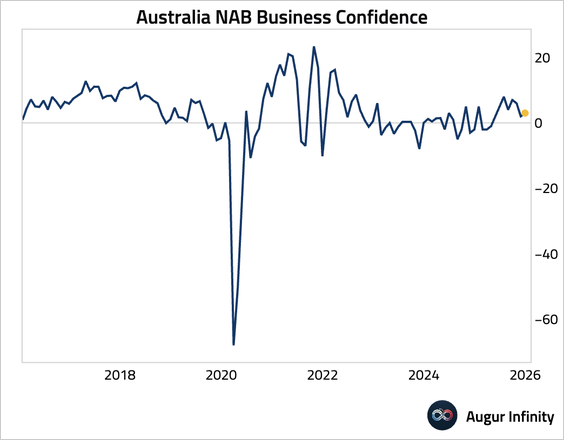
• Capacity utilization inched down but remained well above trend.
2. South Korean business confidence jumped to its highest reading since June 2024.
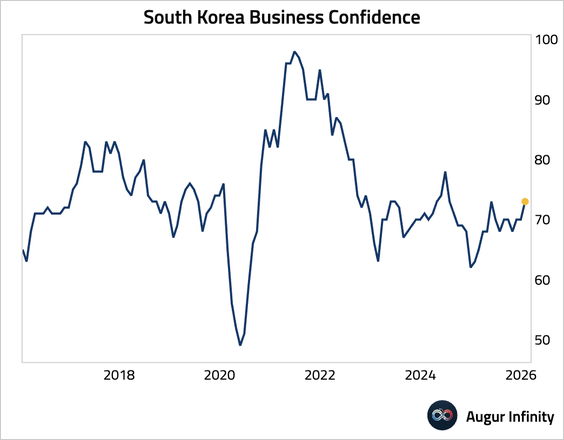
• President Trump threatened to hike tariffs on goods imported from South Korea to 25%, citing the failure of the country’s legislature to codify the trade deal.

Source: @bpolitics Read full article
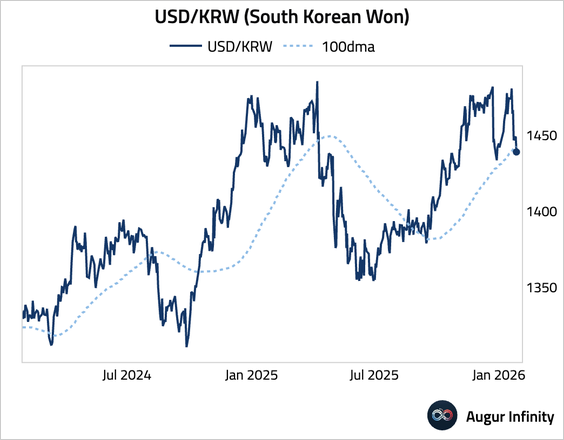
• The Korean won continued to strengthen, with USD/KRW falling below its 100-day moving average.
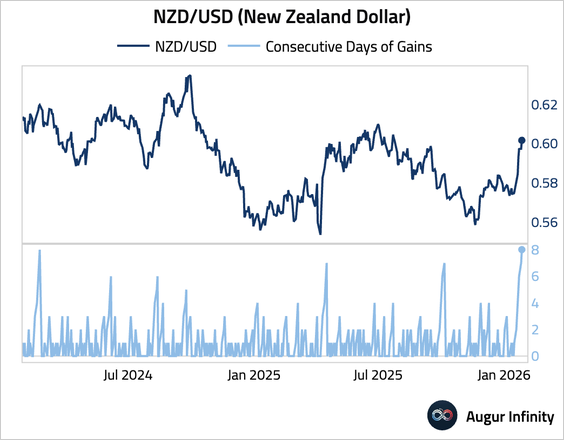
3. NZD/USD has gained for eight consecutive days.
China
1. Industrial profits rose 0.6% for the full year of 2025. The December single-month data showed a significant rebound, with profits rising 5.3% year over year, driven by strong performance in downstream equipment manufacturing, particularly railways and electronics.
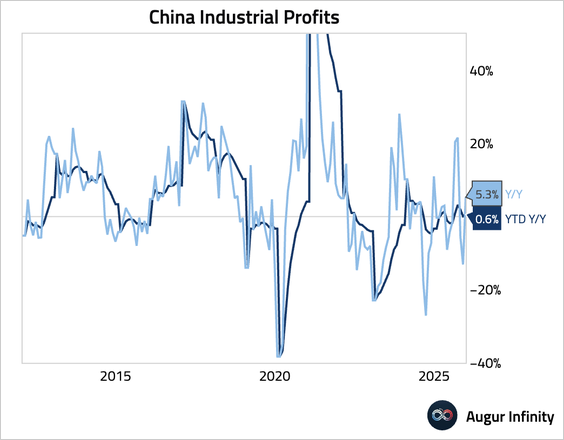
• The profit surge occurred despite a drop in industrial revenue, indicating substantial margin expansion.
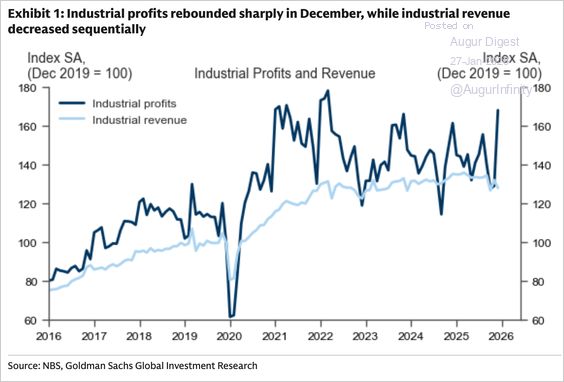
Source: Goldman Sachs
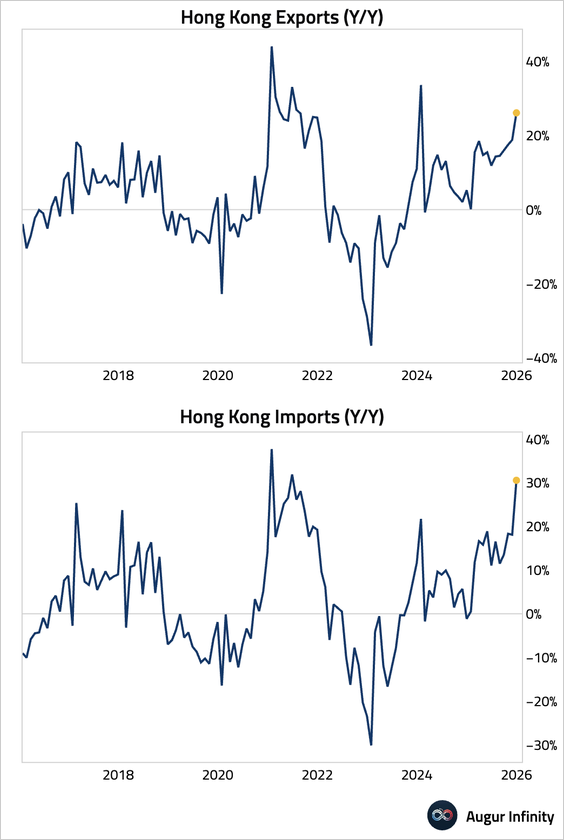
2. Hong Kong’s exports and imports continue to surge.
Emerging Markets
1. Brazil’s mid-month IPCA inflation was in line with consensus this month. The moderation in month-over-month inflation was driven by a sharp drop in volatile airfares and regulated prices.
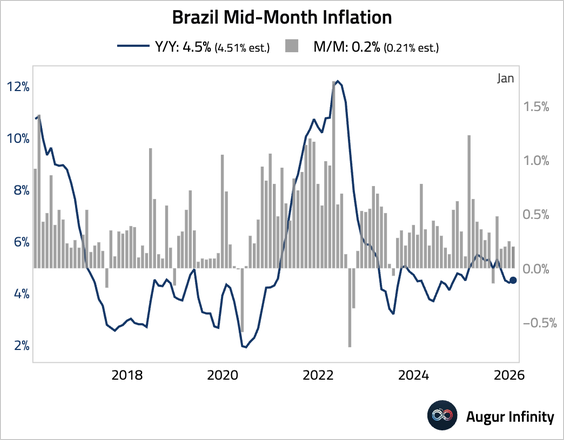
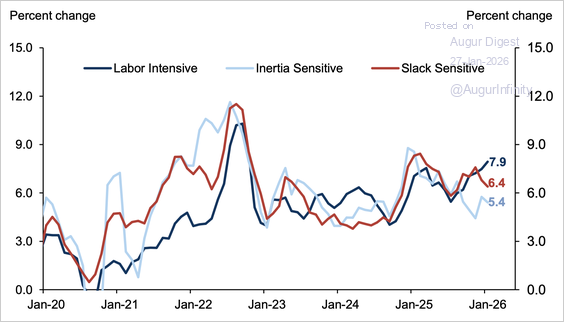
• However, underlying pressures among services remain intense, with labor-sensitive services inflation accelerating.
Source: Goldman Sachs
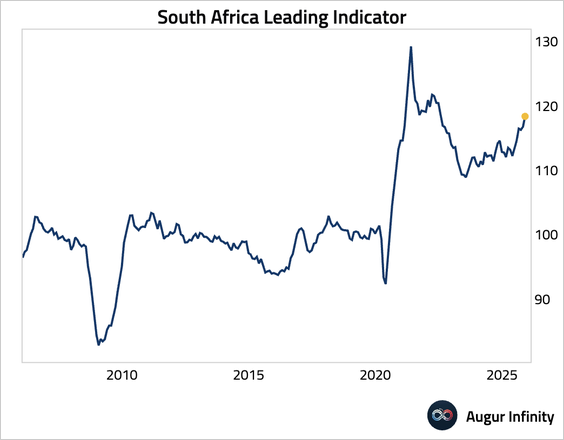
2. South Africa’s leading business cycle indicator accelerated in November.
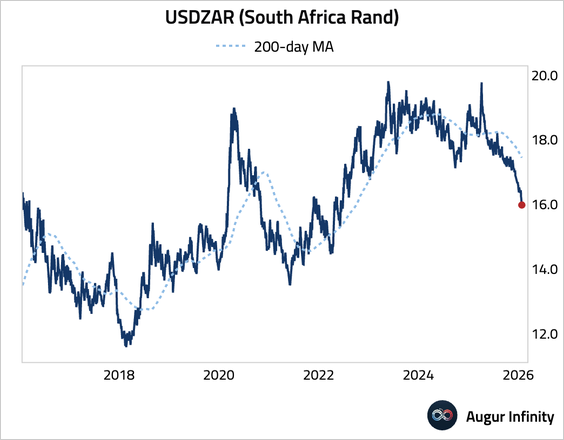
• USD/ZAR is firmly below its 200-day moving average.
Equities
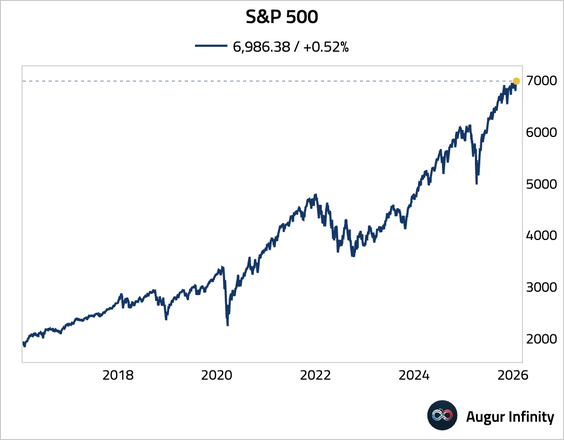
1. The S&P 500 Index has reached an all-time high.
2. Buybacks have driven 27% of S&P 500 returns since 2011.
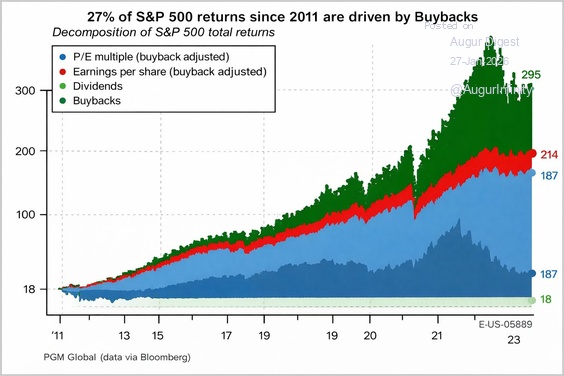
Source: PGM Global via @patientinvestor
3. Over the past 20 years, all of the increase in the S&P 500’s operating margin has come from tech-related sectors.
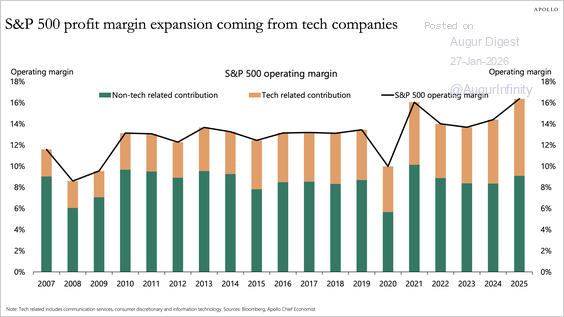
Source: Torsten Slok, Apollo
4. A falling dollar should be a tailwind for S&P 500 earnings revisions over the next several months.
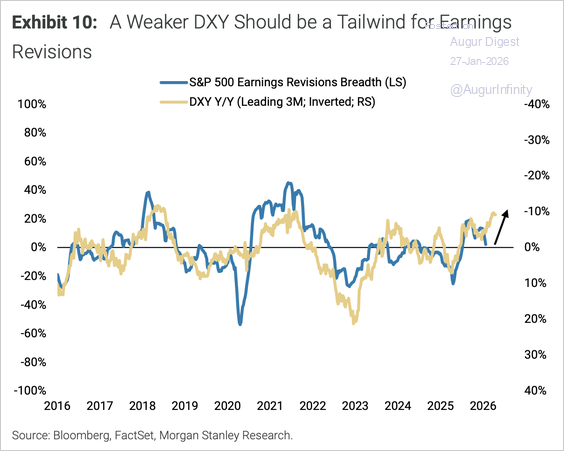
Source: Morgan Stanley Research
5. BCA’s cash-on-the-sidelines measure for the US is at a record low as a percentage of US equity market cap.
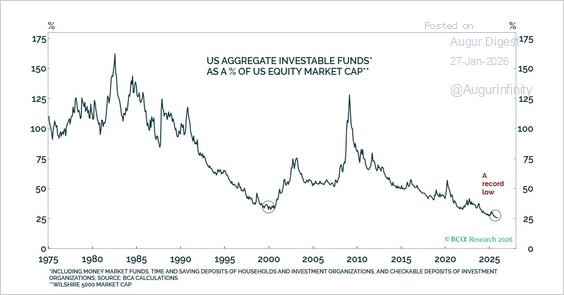
Source: @BudaghyanArthur
6. Goldman’s Risk Appetite Indicator rose to the highest level since 2021, …
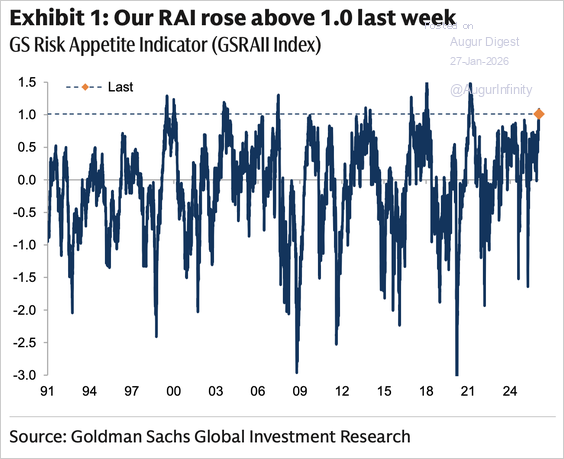
Source: Goldman Sachs
… with broad-based risk-on repricing.
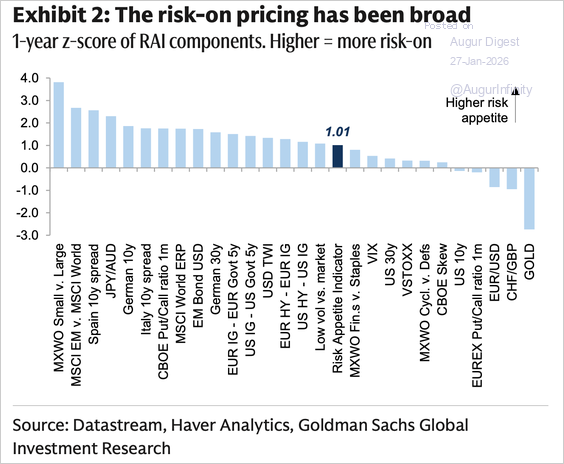
Source: Goldman Sachs
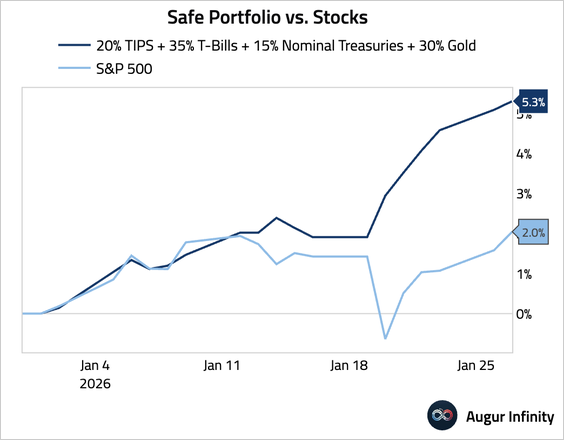
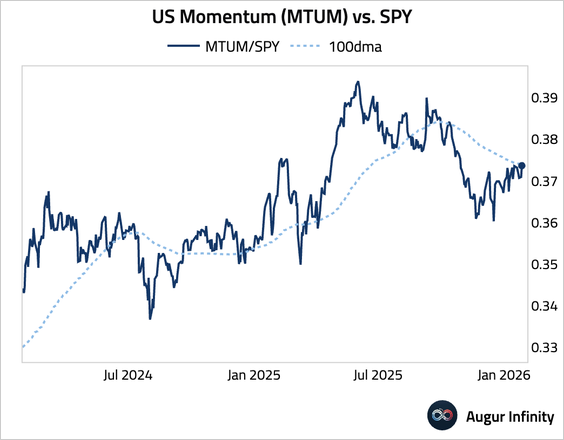
7. After a stellar performance in 2025, the “Safe Portfolio” continues to outperform the equity market this year.
8. US Momentum (MTUM) vs. SPY is testing resistance at the 100-day moving average.
Rates
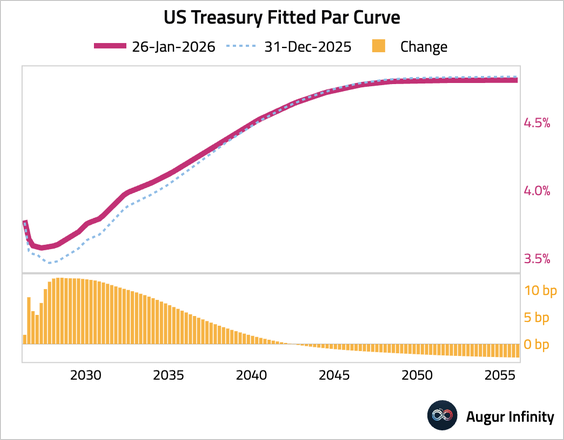
1. Here is how the US Treasury yield curve has reshaped so far this year.
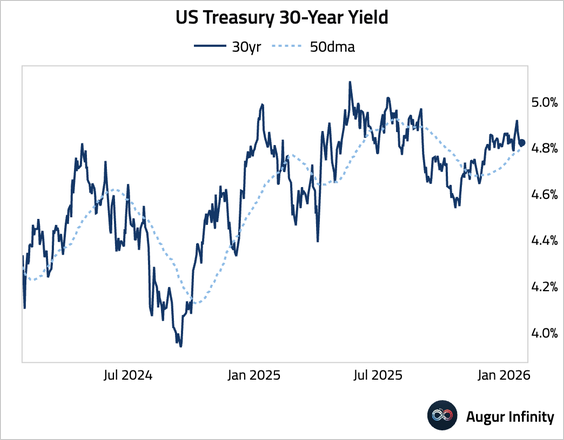
• The 30-year yield is testing support at the 50-day moving average.
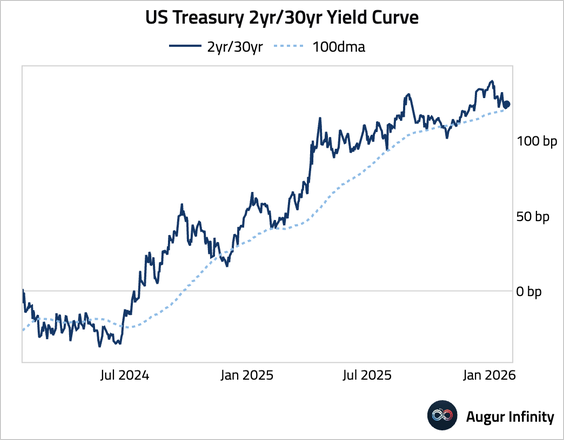
• The yield curve has flattened, with the 2-year/30-year spread testing support at the 100-day moving average.
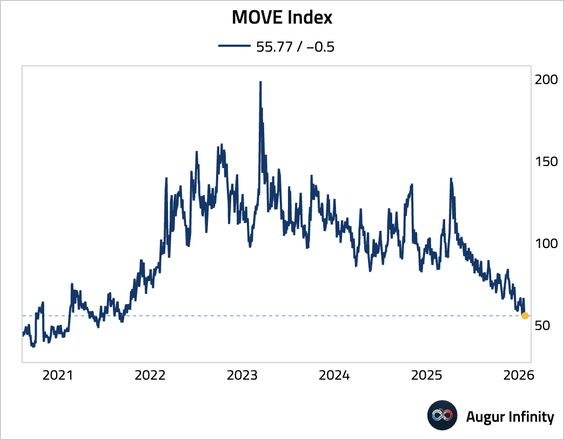
2. The MOVE Index fell to the lowest level since September 2021.
Energy
1. Oil market forecasts for 2026 remain sharply divided, with the IEA and EIA projecting a large supply surplus driven by weaker demand growth, while OPEC sees the market as broadly balanced.
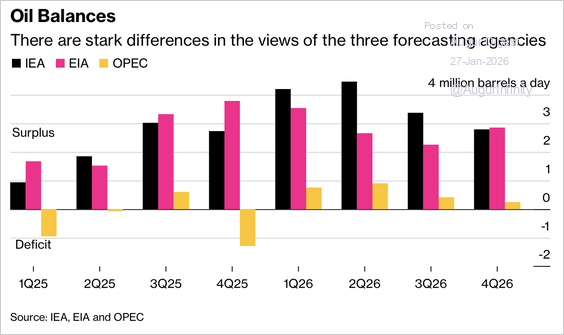
Source: @markets Read full article
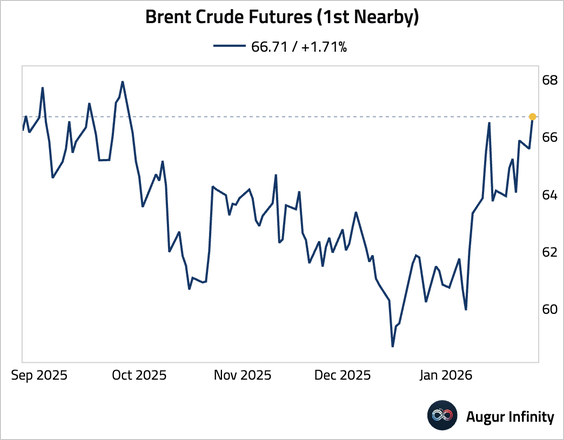
2. Brent crude is trading at the highest level since September 2025.
Commodities
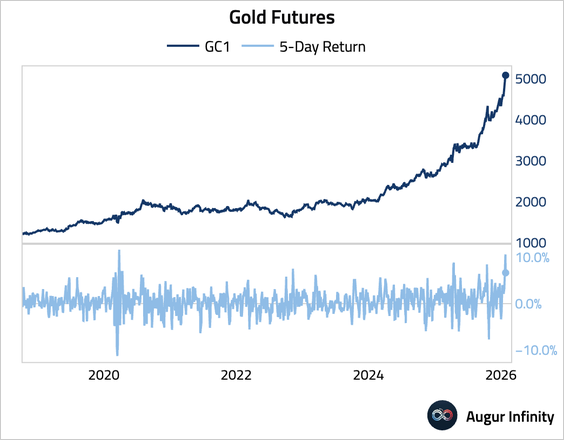
1. Gold futures had the best five days since 2020.
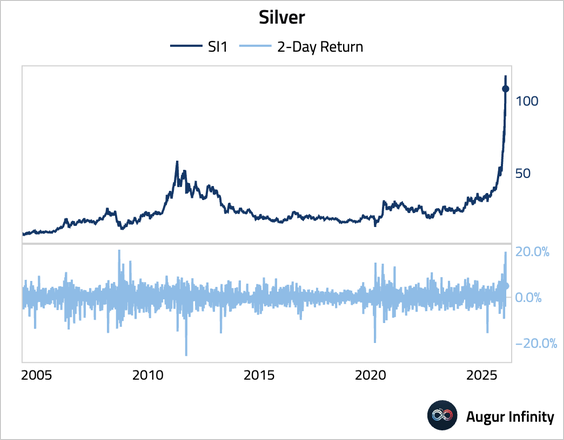
2. Silver futures had the best two days since 2008.
• The silver market remains tight, with implied lease rates (the cost of borrowing physical silver) still elevated.
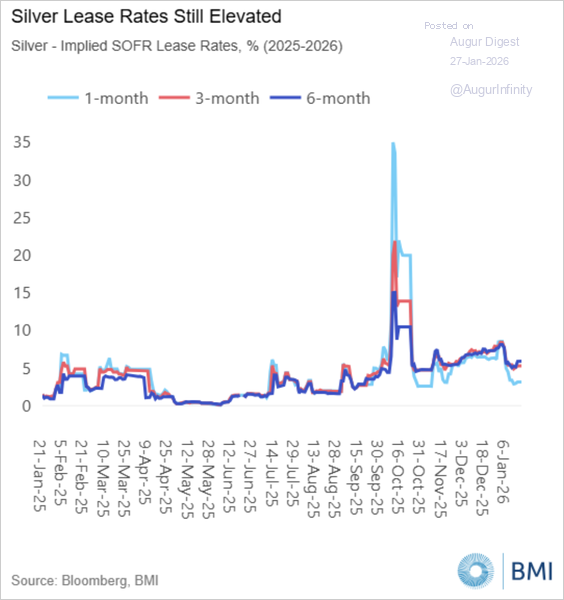
Source: BMI
• The Shanghai-over-London premium is at an all-time high, indicating strong demand from China.
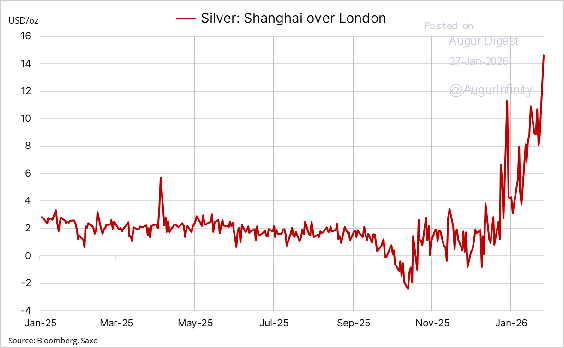
Source: Ole S Hansen
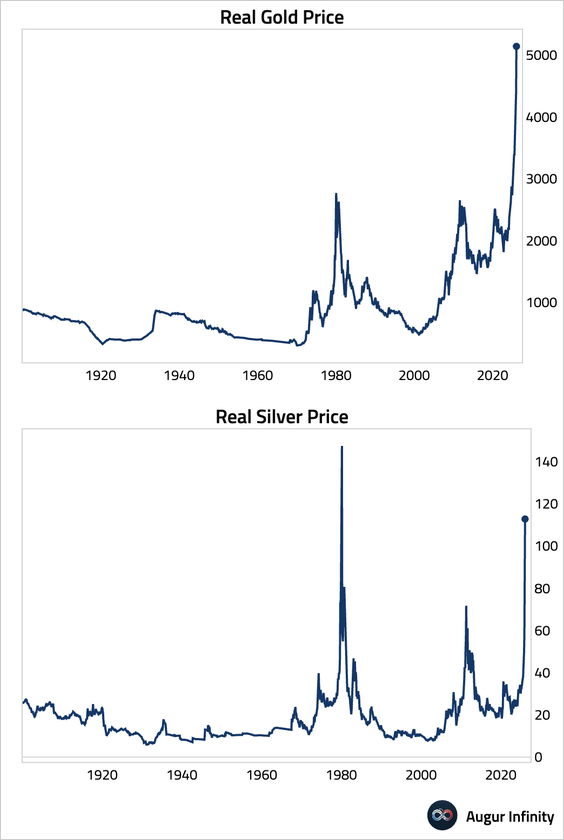
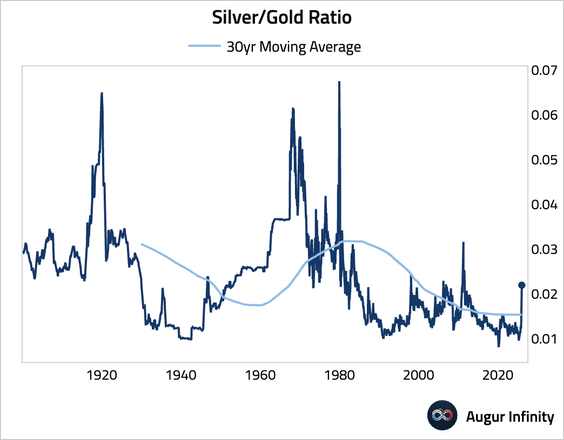
3. Here is a long-term view of inflation-adjusted gold and silver prices.
4. The silver/gold ratio has surged to the highest level since 2011.
Global Developments
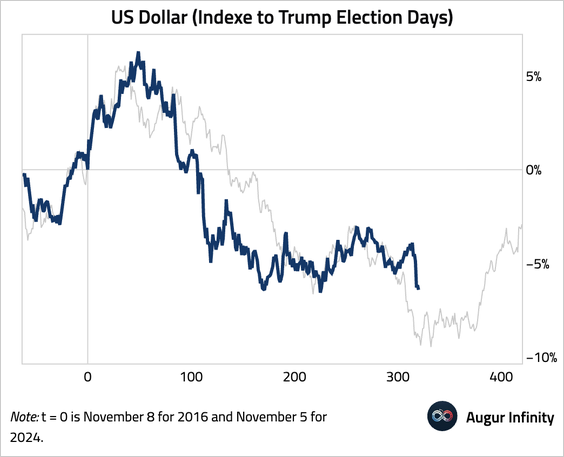
1. This chart compares US dollar price action following Trump’s second election with the trajectory seen after his first election.
2. The dollar’s share of global foreign currency reserves has fallen by 20 percentage points over the past 25 years, according to Bloomberg Intelligence.
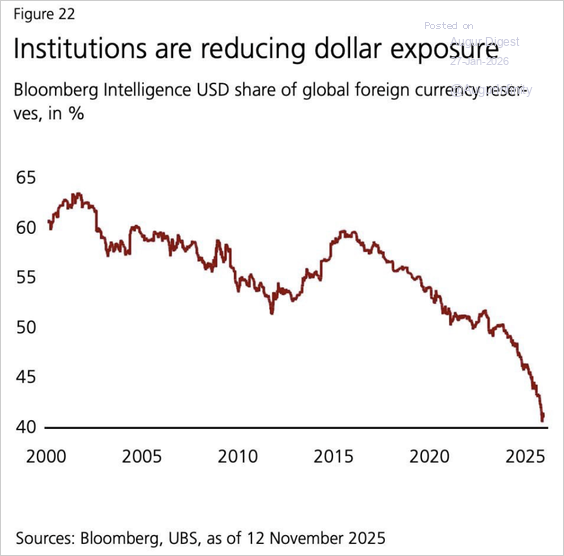
Source: Bloomberg via @balajis