The United States
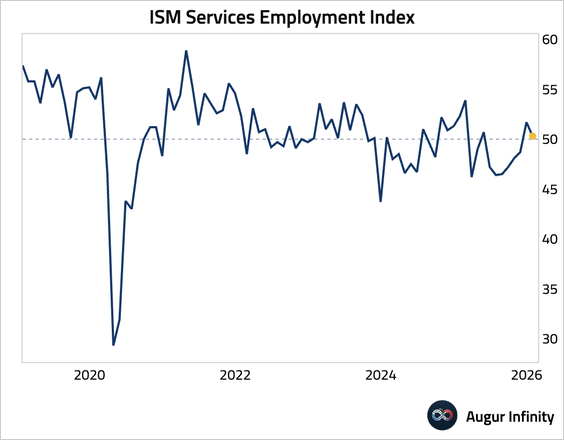
1. The ISM Services PMI held steady at a robust 53.8 in January.
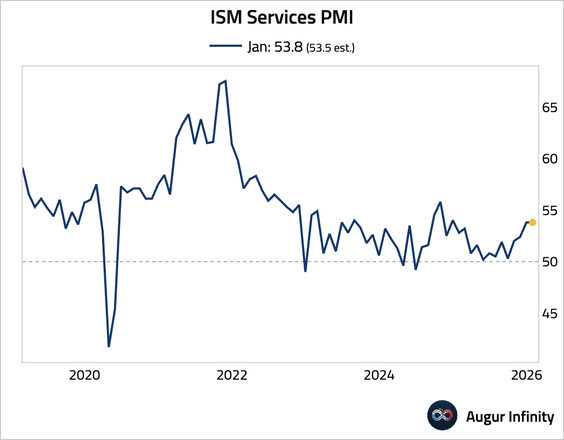
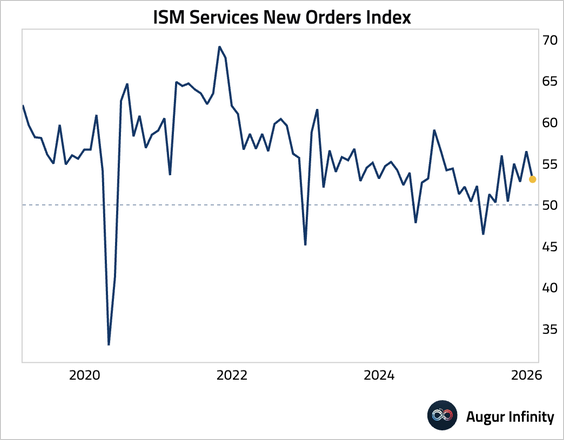
• The underlying details were mixed, with the business activity index surging to a 13-month high, …
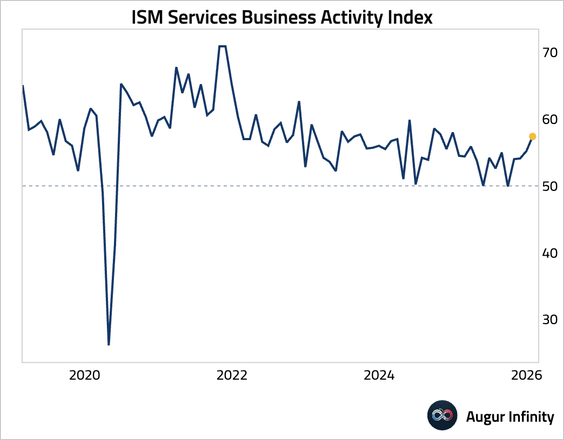
… while the new orders and employment subcomponents softened.
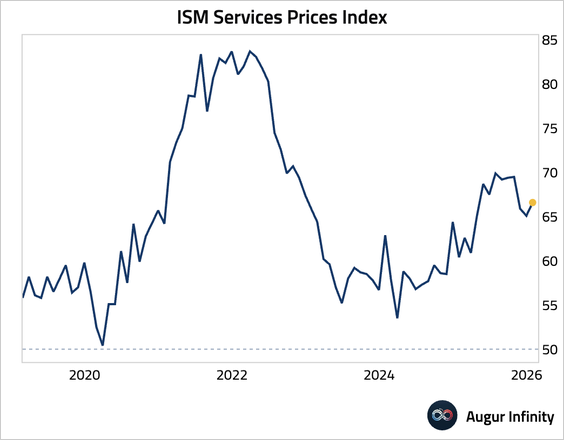
• Price pressure intensified.
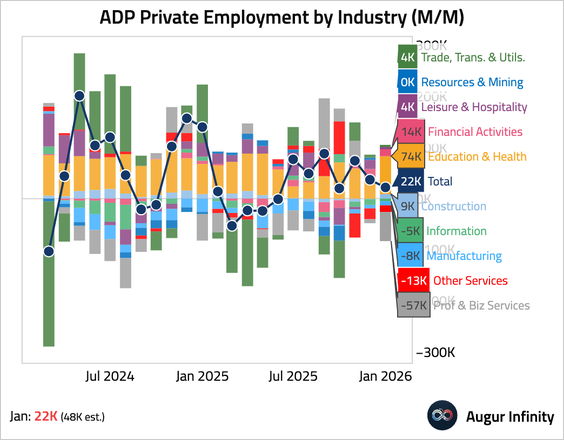
2. Private payrolls increased by just 22k in January, significantly missing the consensus forecast of 48k. The weakness was particularly pronounced for professional and business services (-57k), offset by strength in education and health services (74k).
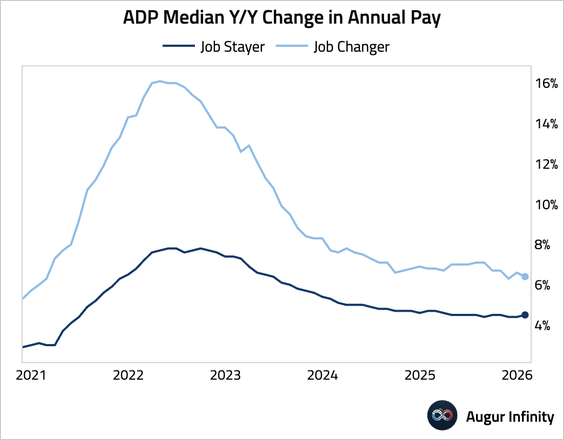
• Wage growth firmed up slightly for job stayers, but moderated for job changers.
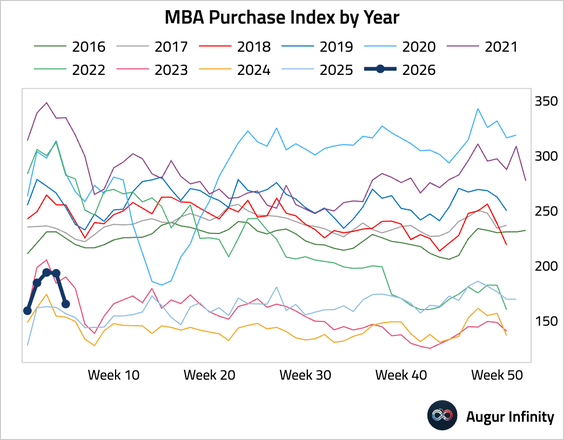
3. Mortgage applications fell considerably.
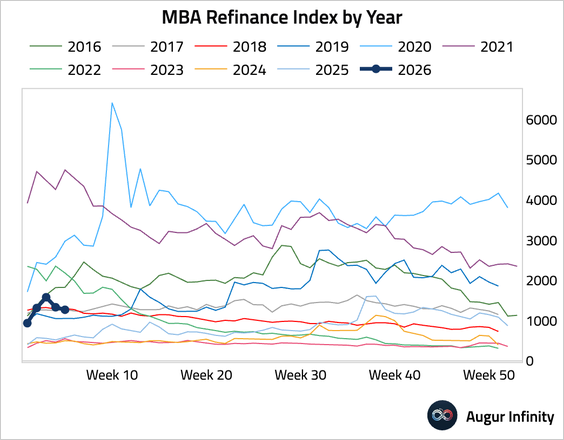
• Refinancing activity also edged down.
4. January had the most snow since 2014 on a population-weighted basis.
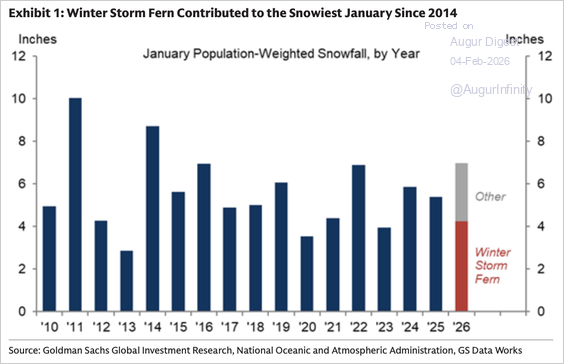
Source: Goldman Sachs
• Goldman expects the cold weather to hit housing activity the hardest.
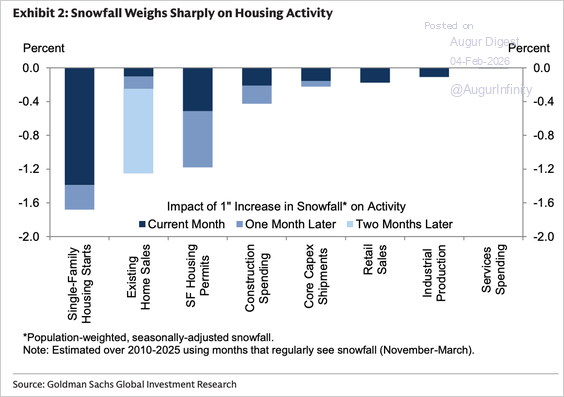
Source: Goldman Sachs
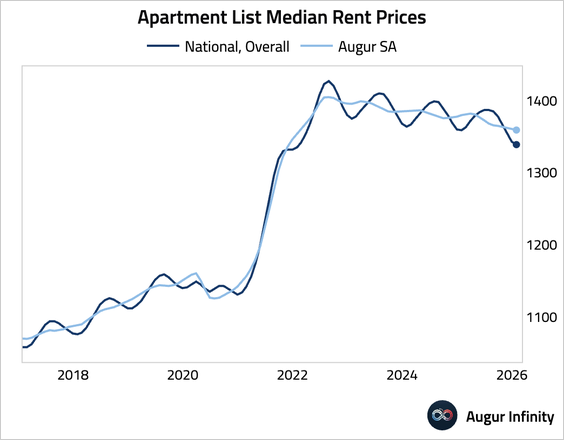
5. According to Apartment List, US rents continue to soften, with its seasonally adjusted series having declined for 10 consecutive months.
6. The increase in the Adobe Digital Price Index this January was abnormally high.
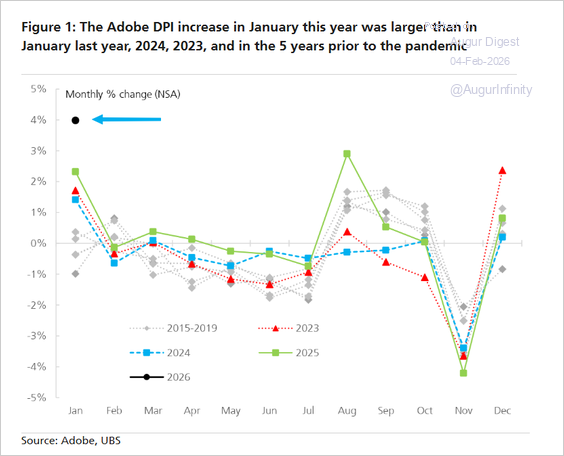
Source: Adobe via @NickTimiraos
7. While economy-wide productivity more than doubled between 1970 and 2024, productivity in the construction industry fell by 30% over the same period.
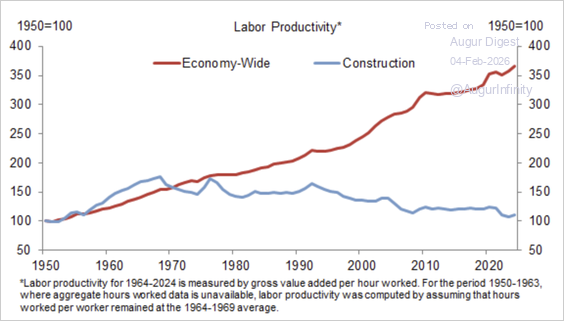
Source: Goldman Sachs
8. Bank of America finds that National Football League home game days drive a 77% average increase in card spending within host-stadium ZIP codes.
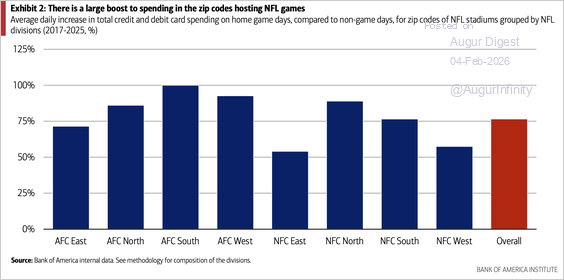
Source: Bank of America Institute Read full article
Canada
1. The Canadian services PMI fell, signaling an accelerating contraction. The downturn was attributed to weak domestic demand and uncertainty over tariffs impacting exports to the US.
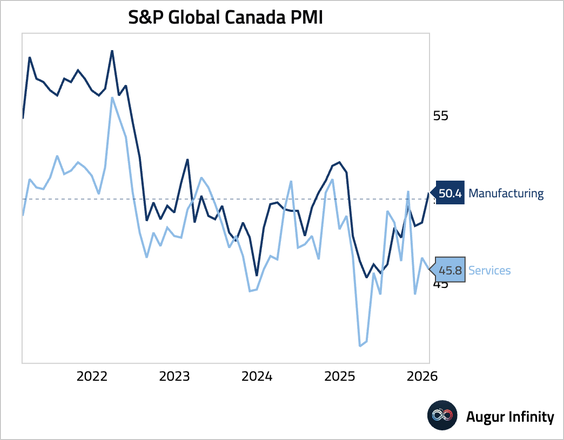
Source: S&P Global PMI
2. This chart shows the return attribution of Canadian equities by market cap.
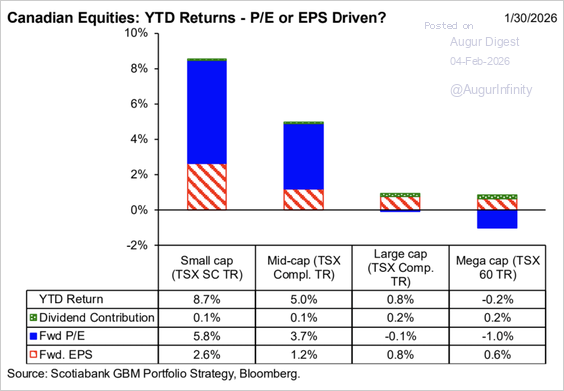
Source: Scotia Capital
The Eurozone
1. Let’s begin with some updates on services PMI reports.
• Eurozone: revised down but still pointing to a solid expansion.
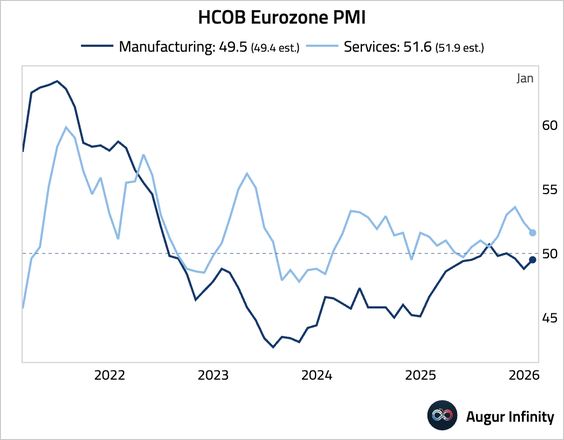
Source: S&P Global
• Germany: revised down but still a solid reading, with the fastest new export business growth since May 2023.
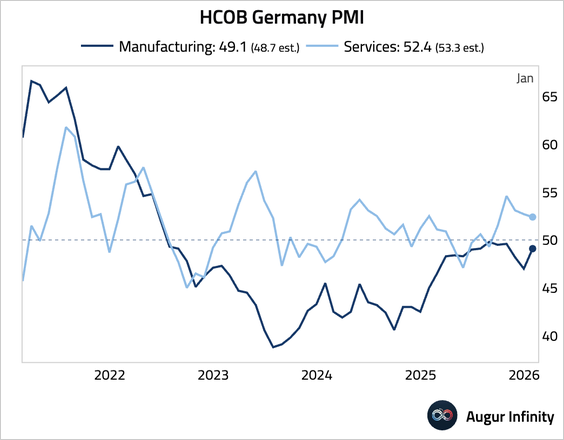
Source: S&P Global
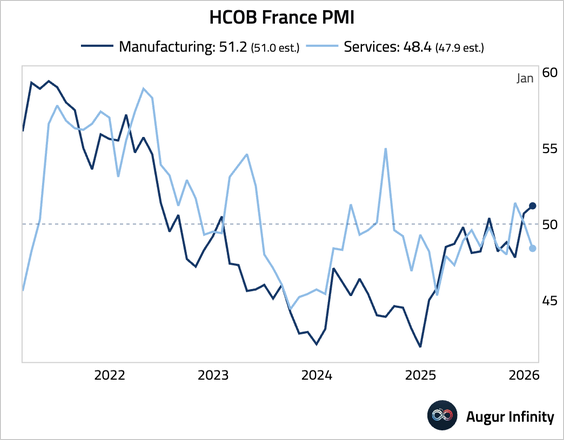
• France: revised up, but still signaled a contraction, with the steepest fall in new business, though future activity expectations surged.
Source: S&P Global
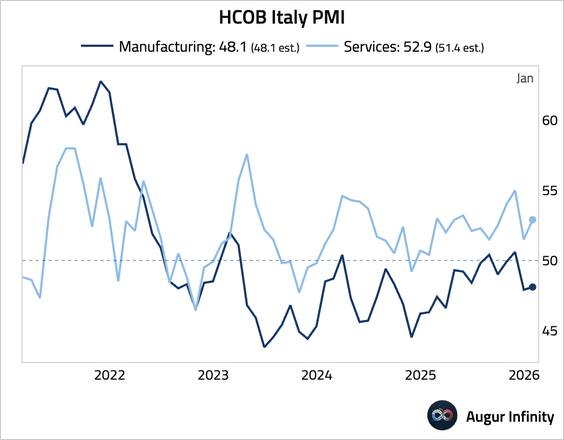
• Italy: rose to a 14-month high, though underlying weakness is emerging as new business growth softened.
Source: S&P Global
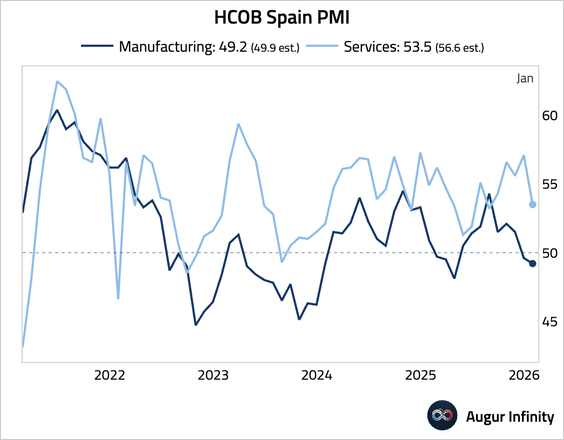
• Spain: moderated, driven by a slowdown in new business and weaker export sales to Europe.
Source: S&P Global
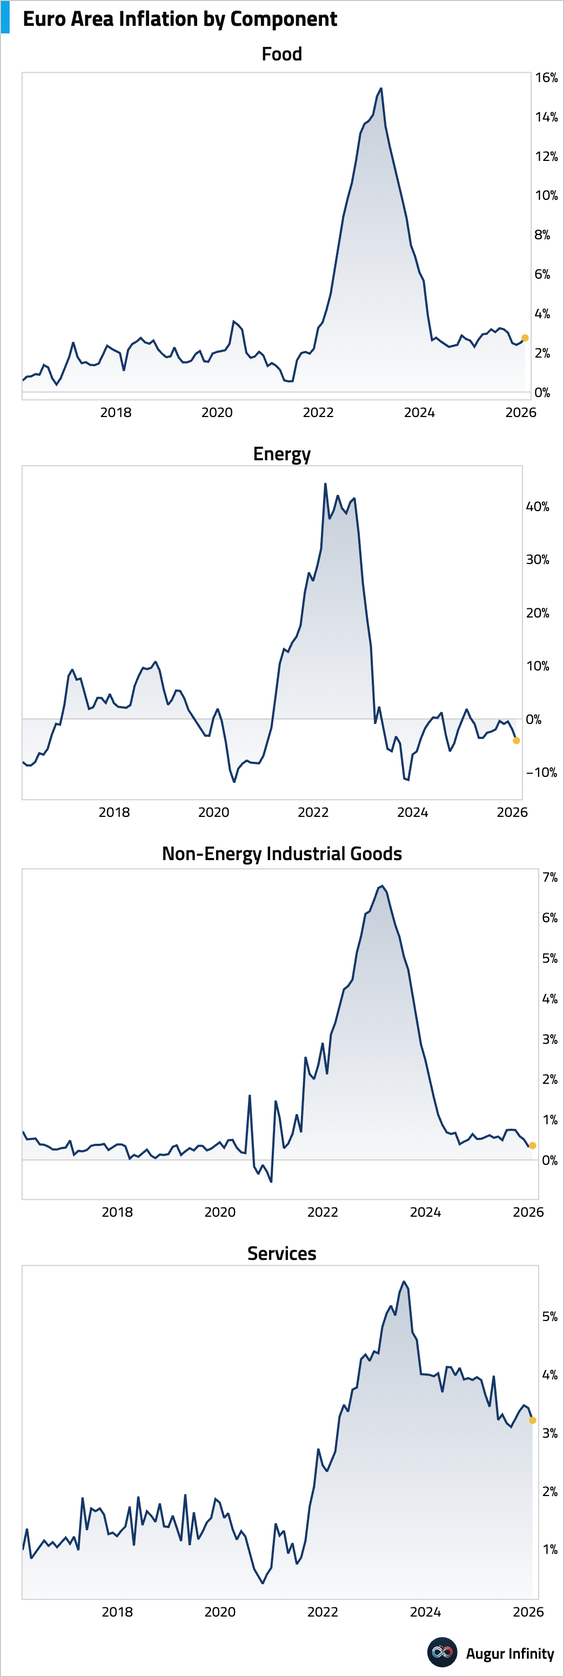
2. Euro area core inflation cooled further and came in below expectations in January.
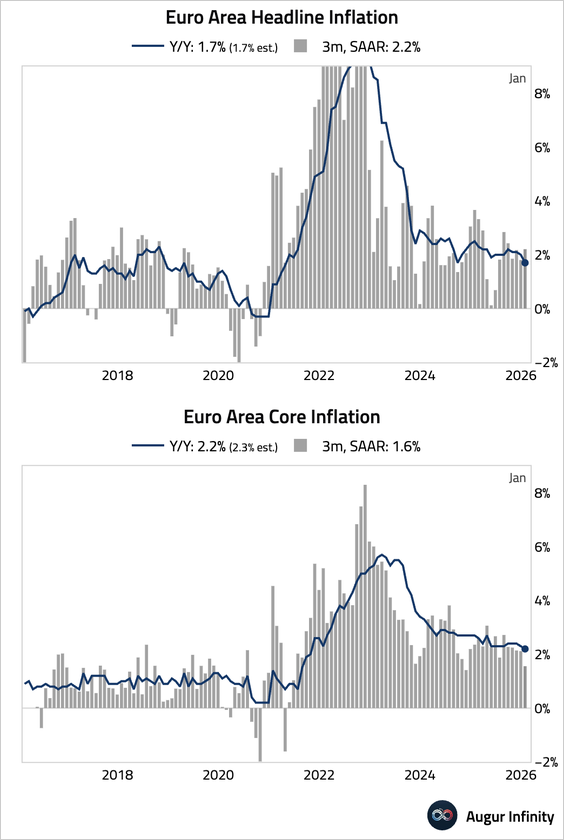
• The downward surprise was driven by a sharper-than-expected slowdown in services.
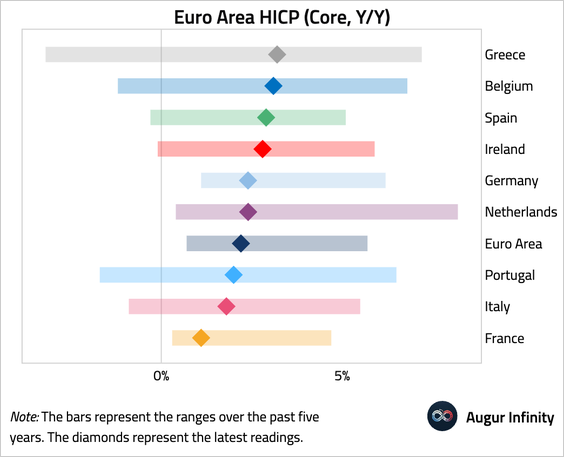
• This chart shows core HICP inflation by country.
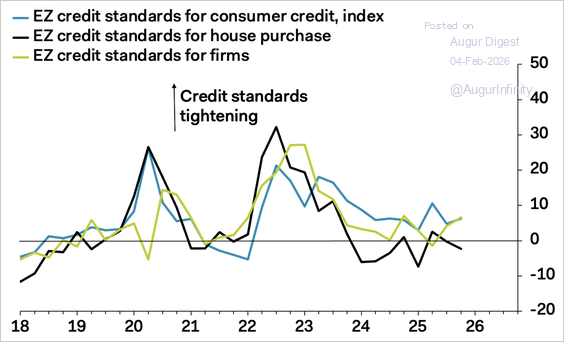
3. The ECB’s bank lending survey shows credit conditions remain tight for firms and for consumer credit, but relatively loose for residential mortgages.
Source: Pantheon Macroeconomics
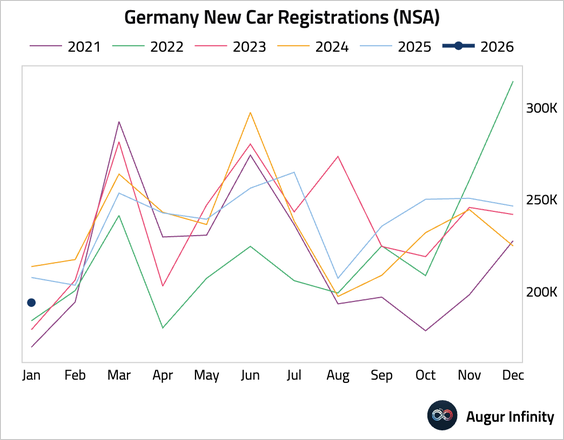
4. German new car registrations contracted year over year in January.
Europe
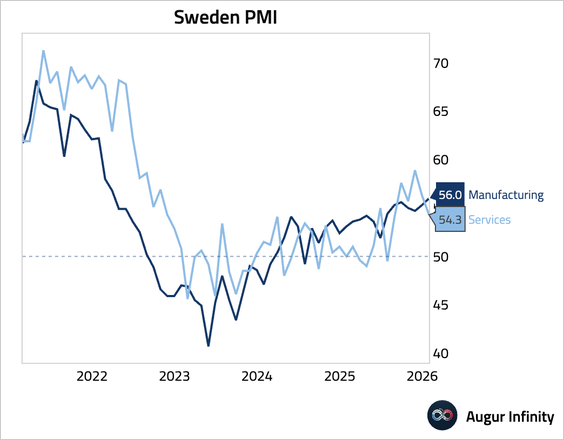
1. Sweden’s Services PMI fell to 54.3 in January, a notable cooling from the previous month but still indicative of solid expansion.
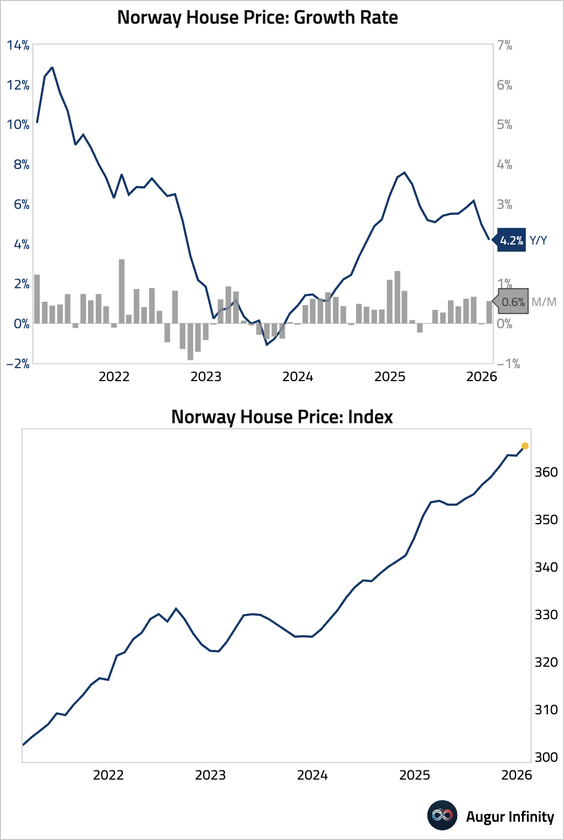
2. Norwegian house prices posted solid gains month over month, though the year-over-year growth rate moderated further.
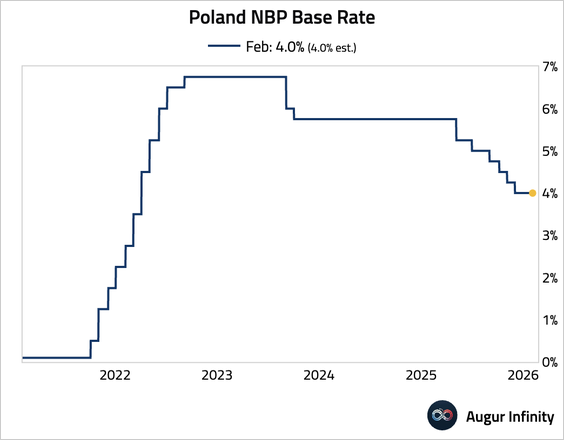
3. As expected, the National Bank of Poland held its key policy rate steady.
Japan
Forward estimates of return on equity for Japanese stocks have risen meaningfully over the past year.
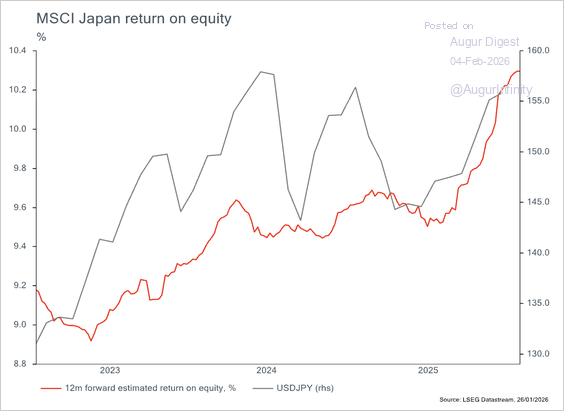
Source: Eastspring Investments
Asia-Pacific
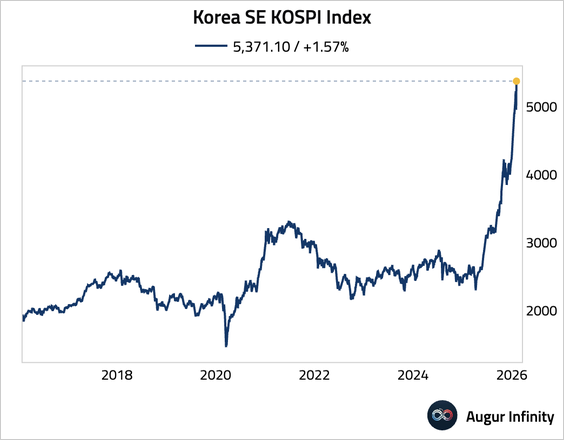
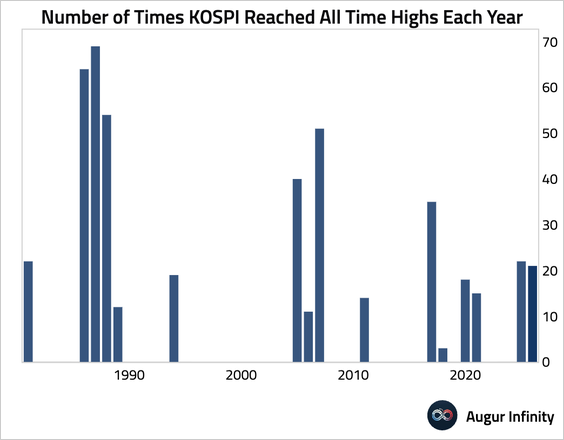
1. The KOSPI set record highs on 21 of the 24 trading sessions this year.
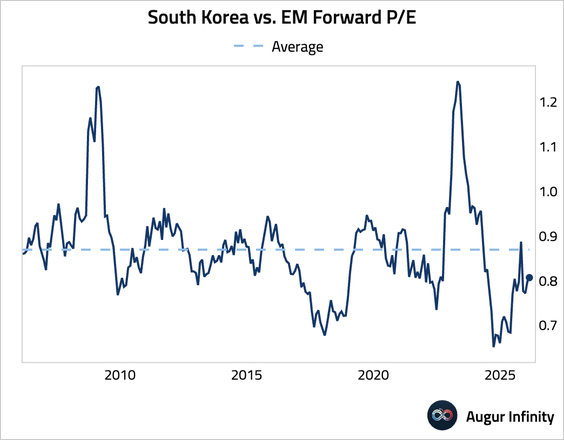
• Despite the strong run, the ratio of the South Korean equity forward P/E relative to the EM aggregate is still below the long-term average.
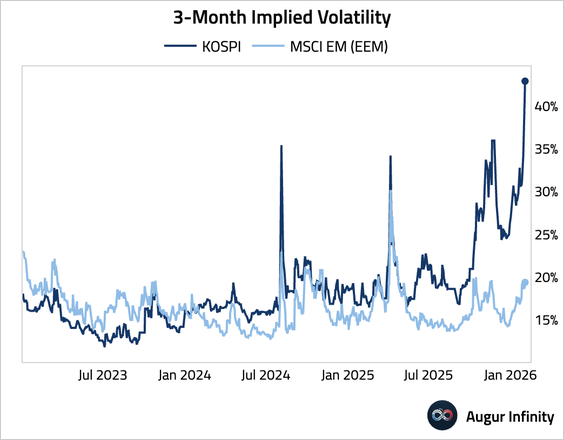
• The implied volatility of the KOSPI Index continued to surge.
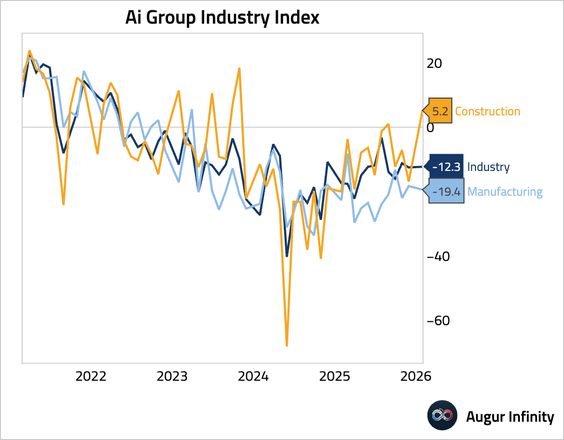
2. Australia’s Ai Group indexes for January showed a mixed picture. The headline Industry Index improved slightly but remained deep in contraction. The manufacturing component worsened, while the construction index surprisingly jumped back into expansionary territory.
• Here’s a look at the RBA’s recent forecast changes, which include higher-than-expected inflation, a higher policy rate path, and an upgrade to the near-term growth outlook.
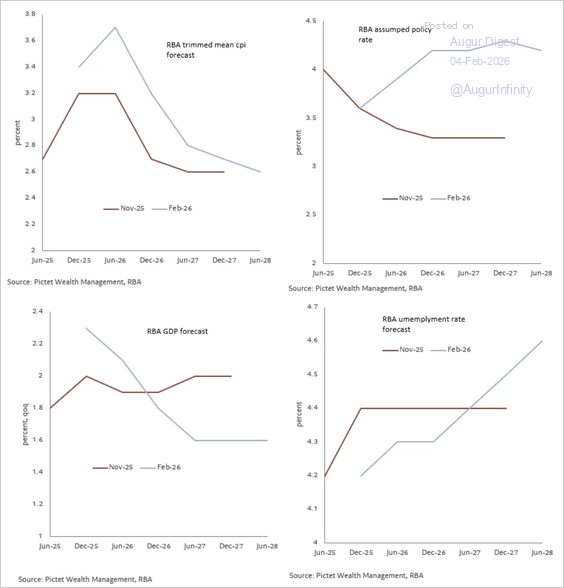
Source: Pitctet Asset Management Read full article
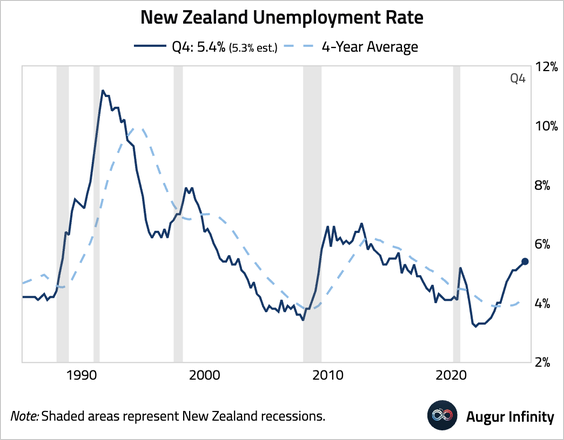
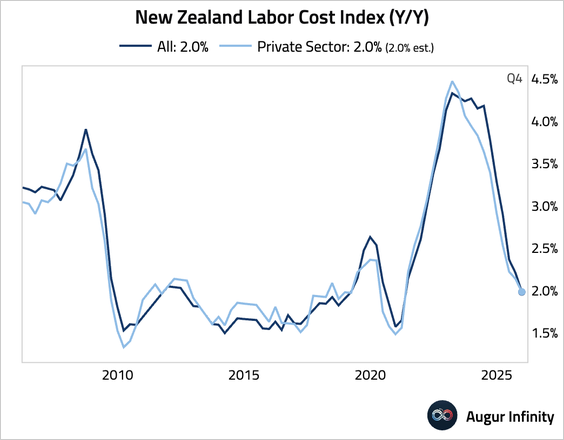
3. New Zealand’s employment growth rebounded in Q4.
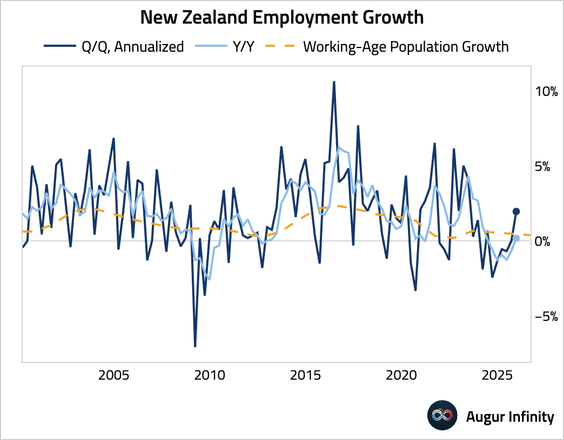
• The unemployment rate edged up to its highest level in over a decade with participation rate ticking up.
• Wage growth, as measured by the Labour Costs Index, cooled slightly.
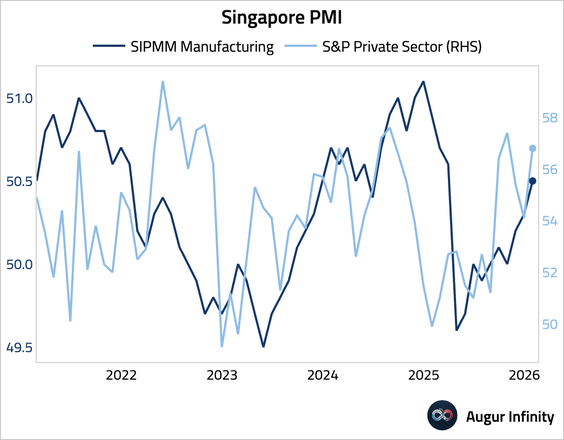
4. The S&P Global PMI for Singapore surged, consistent with the improvement in the SIPMM indicator.
China
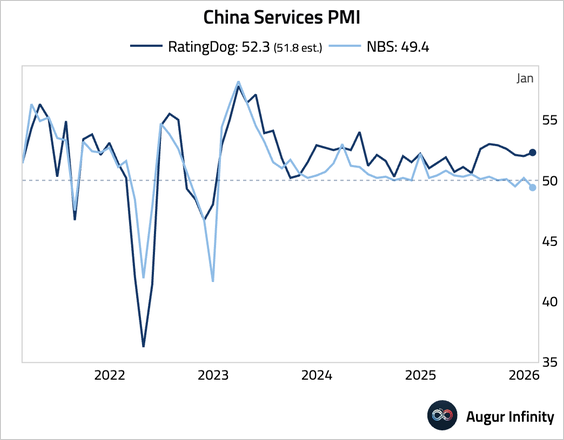
1. Diverging from the official PMI, the RatingDog Services PMI rose to a three-month high, driven by accelerating new business growth, which prompted the first increase in employment in six months.
2. Hong Kong’s PMI improved, driven by the sharpest rise in new export orders in nearly three years, particularly from Mainland China.
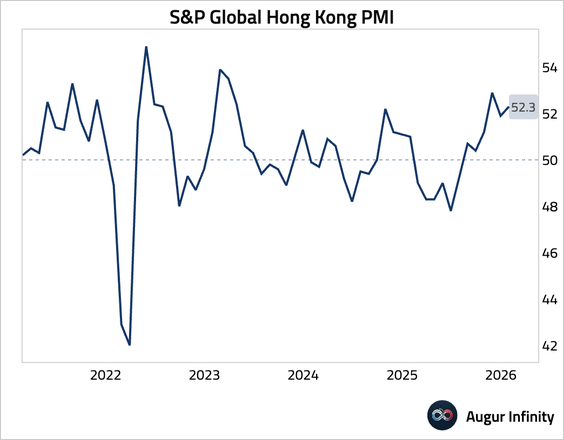
Source: S&P Global
3. Individual investors opened 4.9 million accounts in January—the highest number since the 2024 boom.
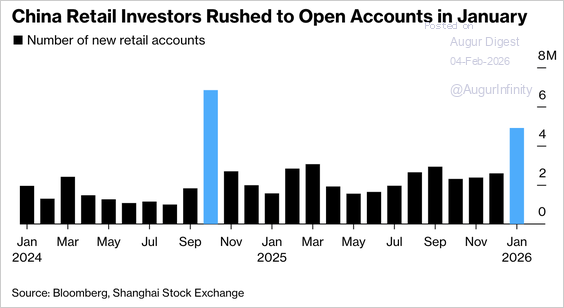
Source: @markets Read full article
Emerging Markets
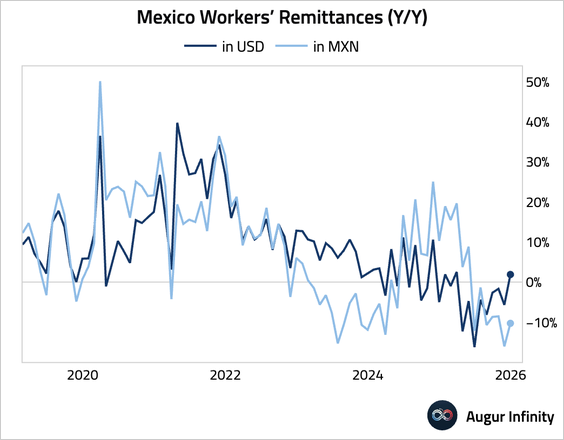
1. Workers’ remittances in Mexico firmed in December, but a sharp peso appreciation continued to erode local purchasing power.
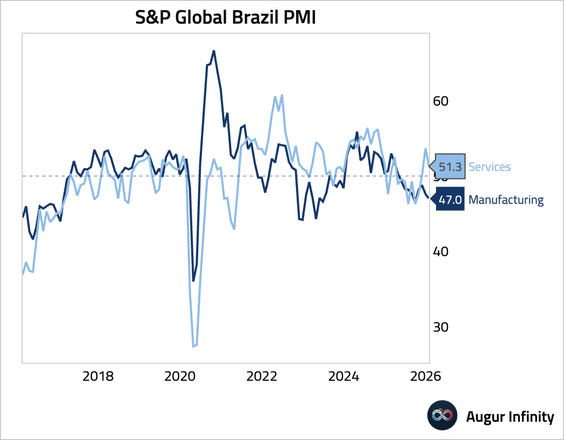
2. Brazil’s services PMI moderated, though it remained in expansionary territory.
3. Russia’s Services PMI rose, driven by faster new order growth, supporting a renewed increase in employment.
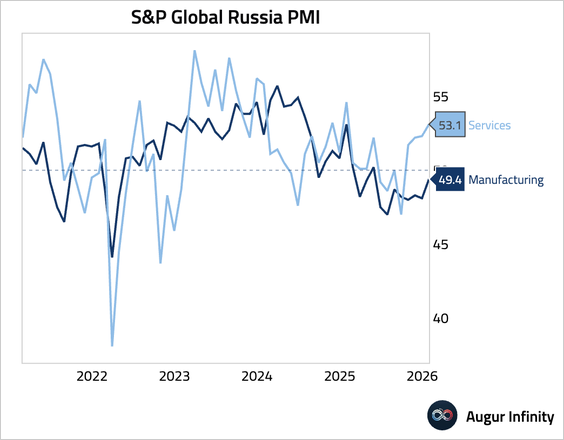
Source: S&P Global PMI
4. The S&P Global private sector PMI for South Africa stabilized at the neutral level in January. While output and new orders were flat, firms reduced employment for the first time since September.
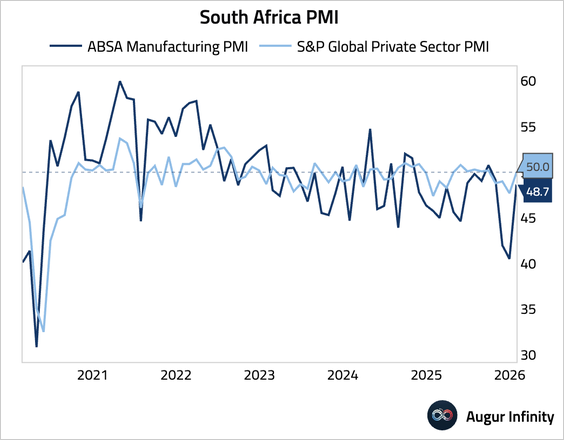
Source: S&P Global PMI
Equities
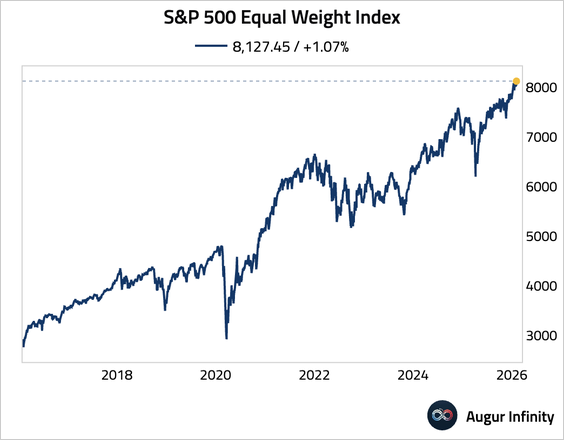
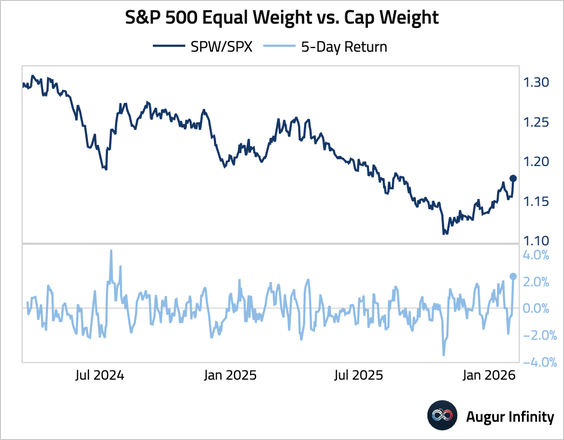
1. While the The S&P 500 struggled today, the S&P 500 Equal Weight Index reached an all-time high.
• The equal-weight index outperformed the cap-weighted benchmark by the most over the past five days since July 2024.
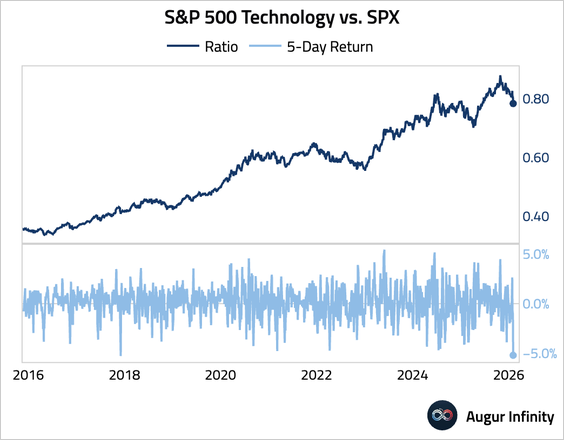
• The underperformance of the tech sector relative to the S&P 500 over the past five days is the worst since December 2017.
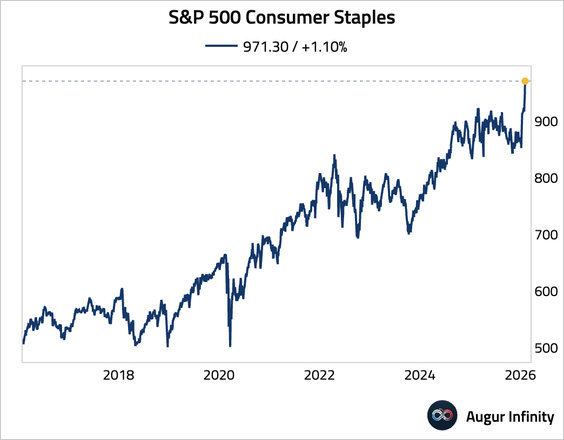
2. The consumer staples sector has reached the fifth record high of 2026.
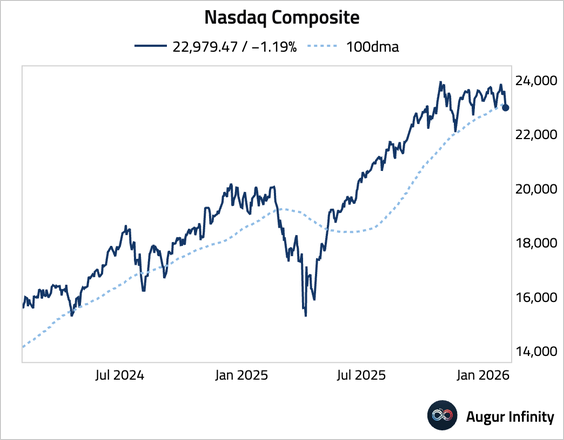
3. The Nasdaq composite fell below its 100-day moving average.
4. Software stocks became the most oversold since 2018 based on the RSI.
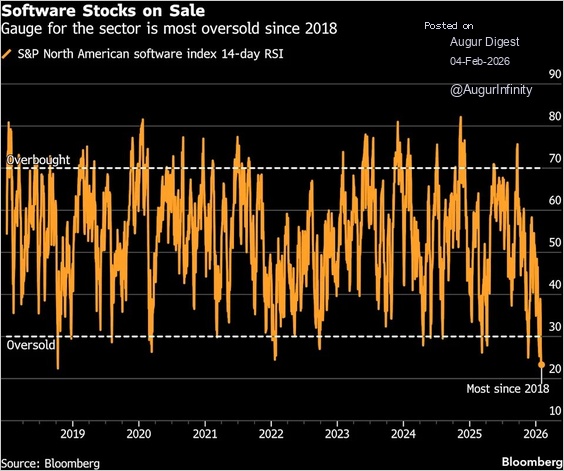
Source: Bloomberg via @HedgeVision
• The forward P/E for software stocks has compressed to a multi-year low.
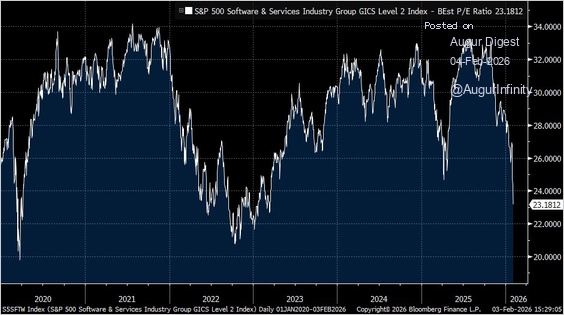
Source: Bloomberg via @LizThomasStrat
5. Transportation stocks have broken out after four years of no progress.
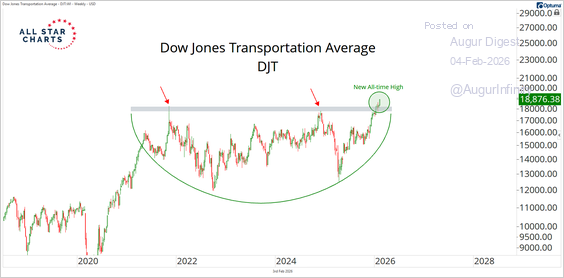
Source: Alfonso De Pablos
6. The S&P 500’s blended net profit margin for Q4 2025 is tracking at 13.2%—the highest level in more than 15 years—driven by strength in information technology and industrials.
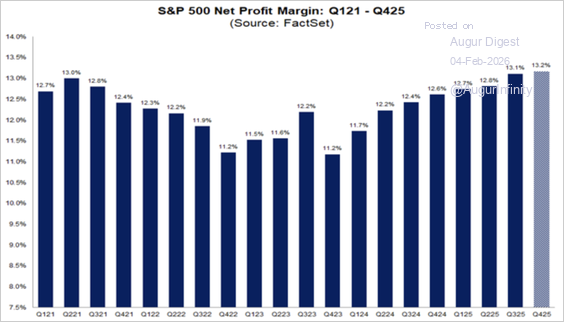
Source: FactSet
• S&P 500 forward profit margin has supported elevated valuations.
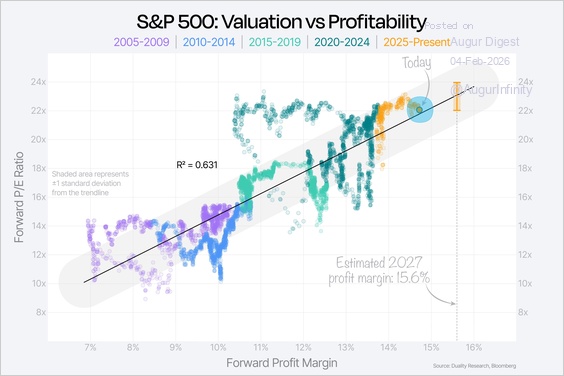
Source: Duality Research Read full article
7. Growth sectors have increased in size in the S&P 500 Index over the past century, which also supported higher-than-average valuations.
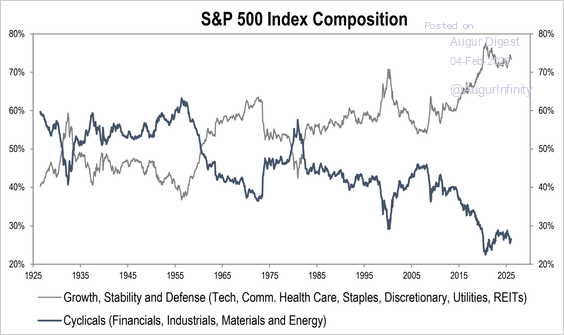
Source: Piper Sandler
8. Variant Perception’s US EPS leading indicators continued to firm.
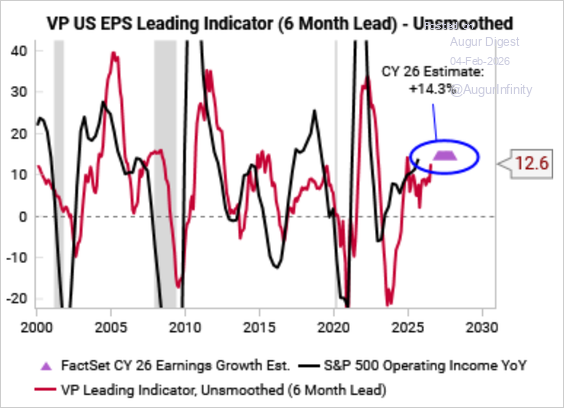
Source: Variant Perception
9. Here’s a look at the five-year z-scores of forward PEGs (price/earnings-to-growth) by sector. Based on this metric, tech turns out to be the cheapest sector.
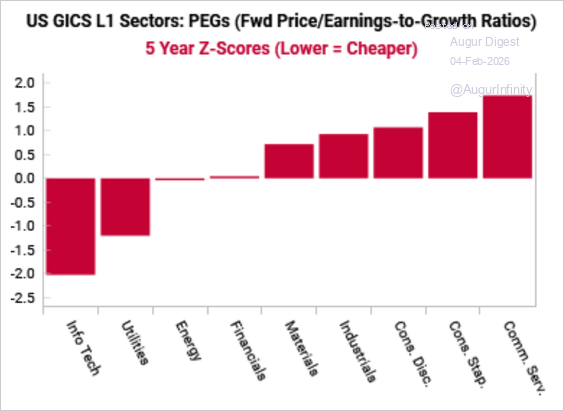
Source: Variant Perception
10. The share of nonfinancial companies with higher sales than the previous year continued to rise.
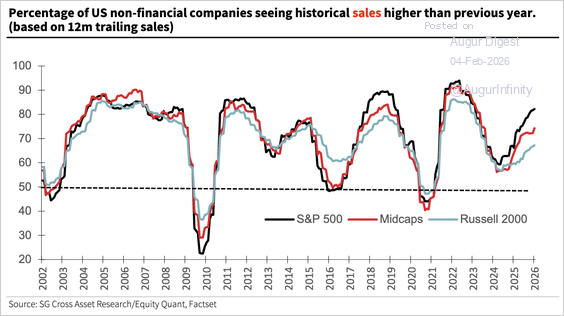
Source: Société Générale
• However, the share with higher net income than the previous year has flattened for large caps.
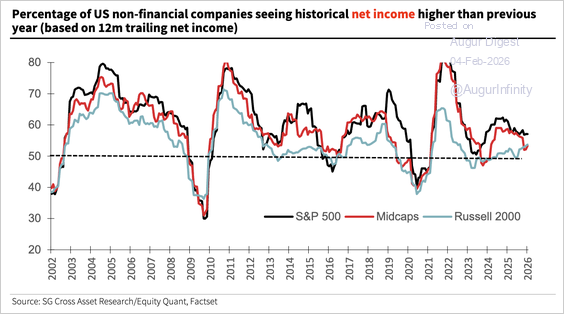
Source: Société Générale
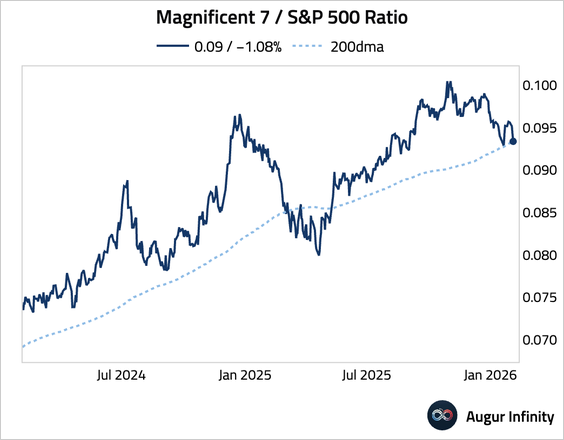
11. The Magnificent 7-to-S&P 500 ratio is testing support at the 200-day moving average.
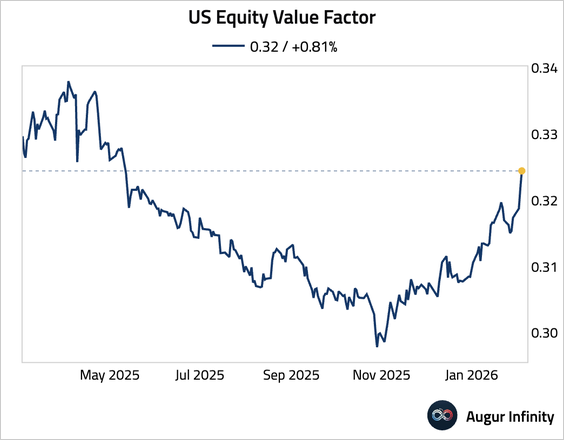
12. US equity growth factor is at the lowest level since April 2025, …
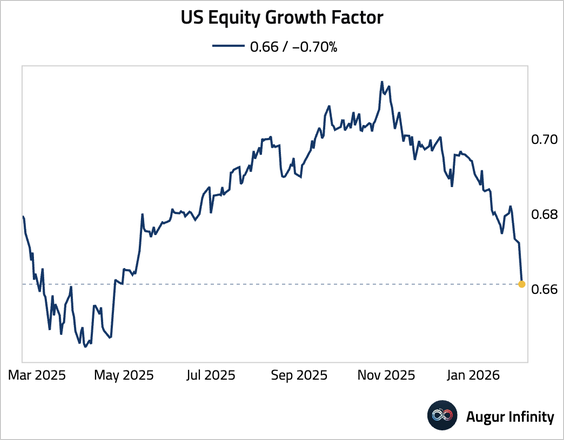
… while the value factor is at the highest level since May 2025.
Energy
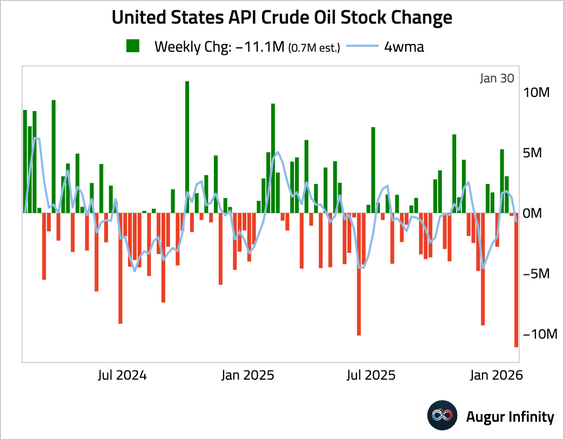
1. US API crude oil inventories posted a surprisingly large drawdown for the week, defying expectations for a build.
2. Weak oil price expectations have weighed on capex. Could we see a turnaround?
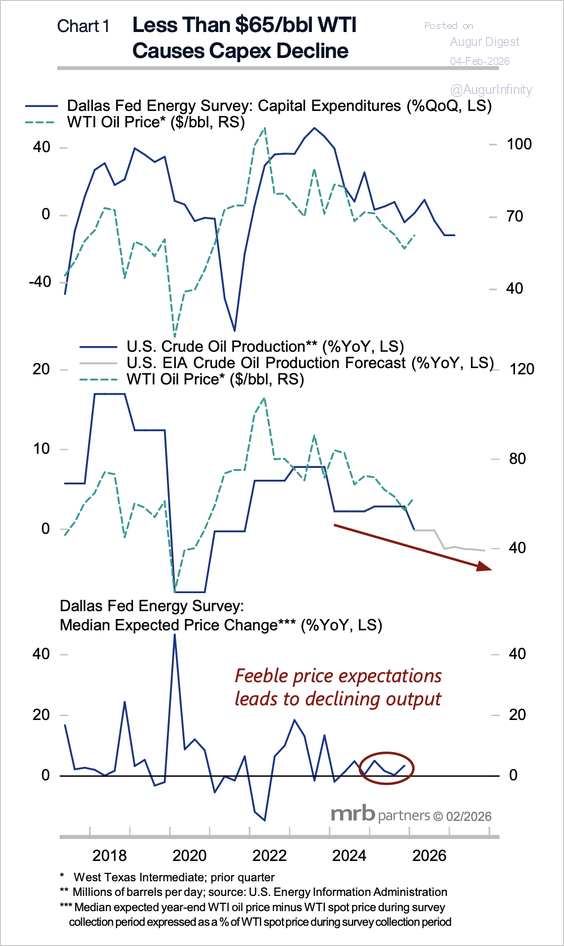
Source: MRB Partners
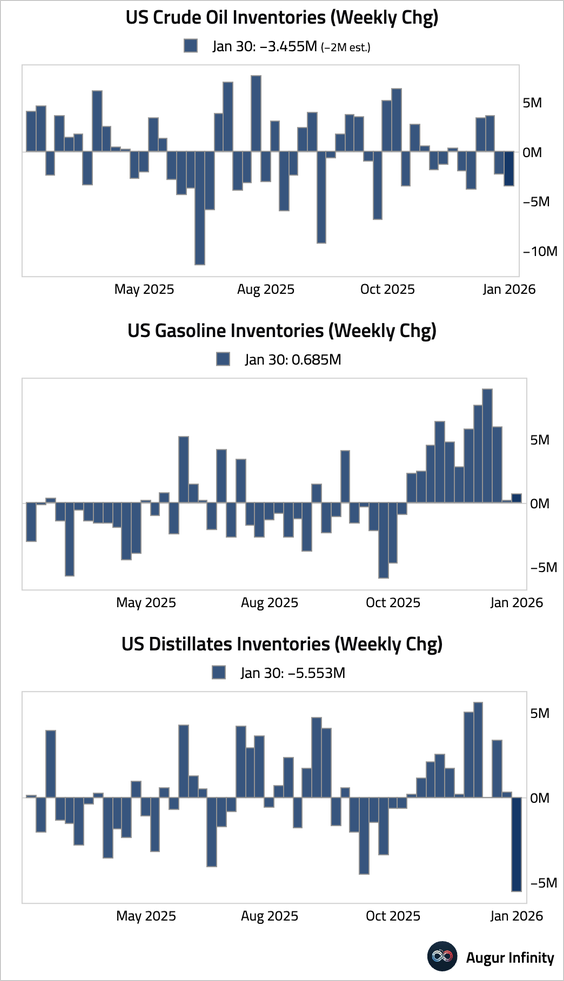
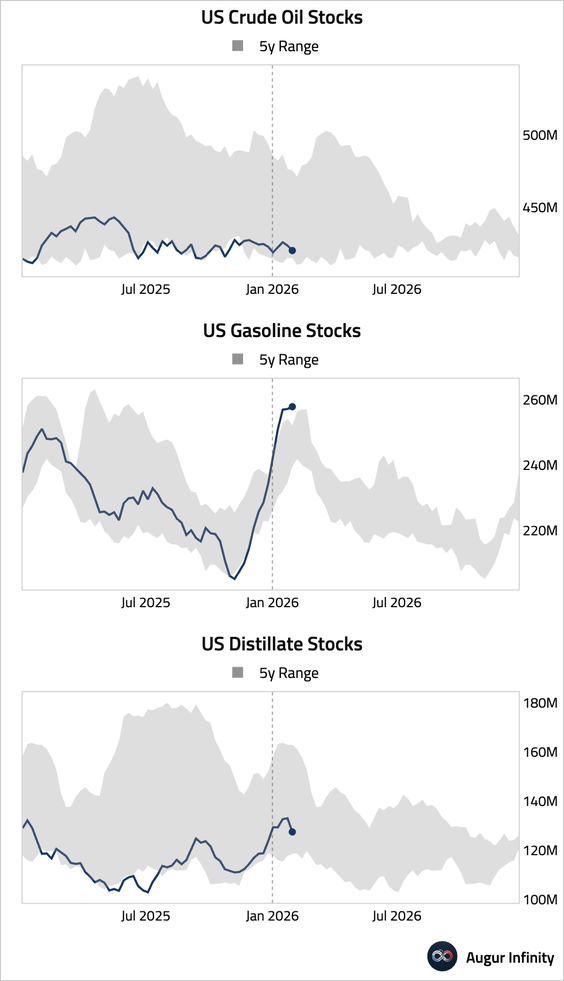
3. US commercial crude oil and distillates inventories posted a large drawdown last week. In contrast, gasoline inventories posted a small build.
– Weekly changes:
– Levels:
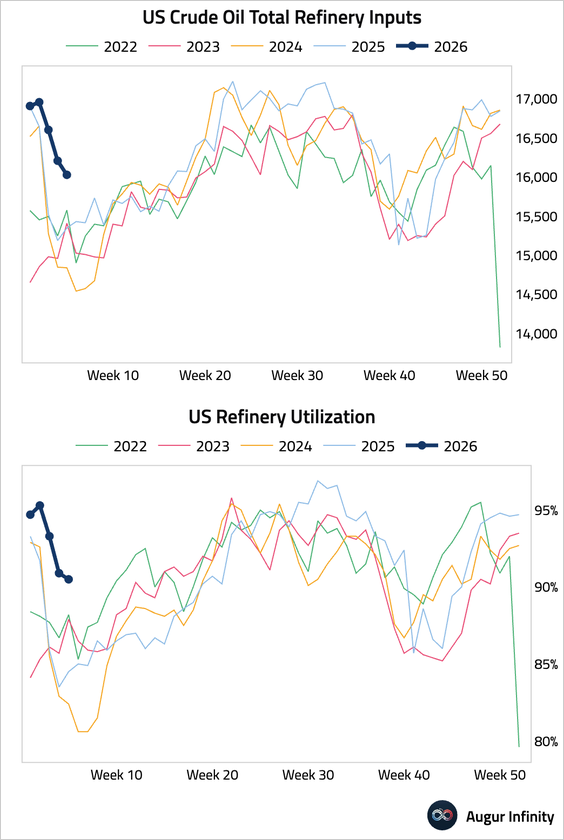
• Refinery utilization eased further.
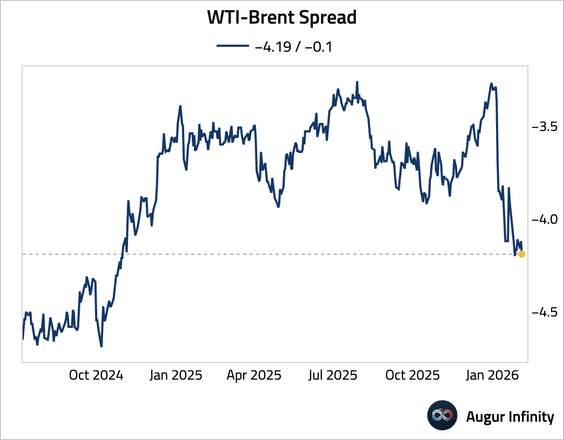
4. The WTI-Brent spread is at the lowest level since October 2024.
Commodities
1. Gold touched above $5,000, before giving back some gains.
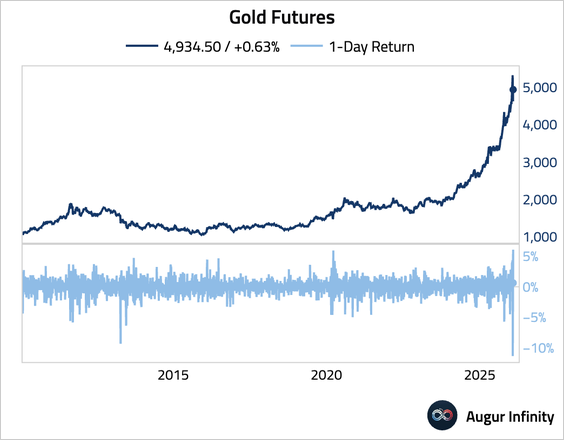
Source: @markets Read full article
• China’s largest gold-backed ETFs saw record daily outflows of nearly $1 billion as an abrupt pullback from all-time highs rattled retail investors, underscoring how speculative positioning amplified the recent surge.
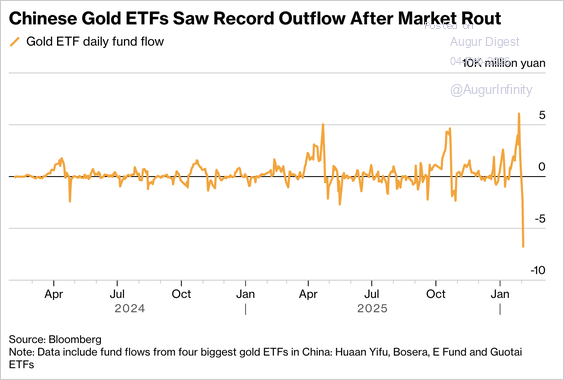
Source: @markets Read full article
2. Silver has also continued rebounding.
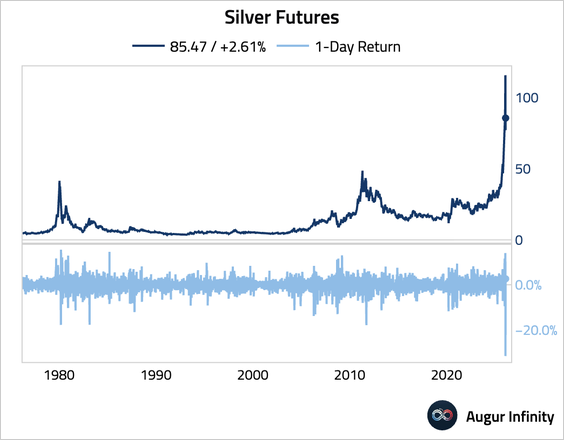
• The silver miners-to-silver spot price ratio is currently at one of its lowest levels in history.
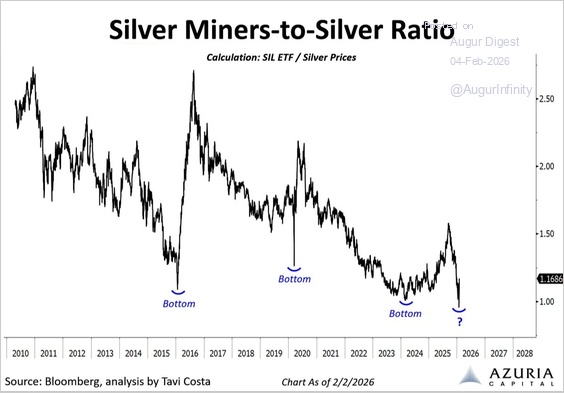
Source: @TaviCosta
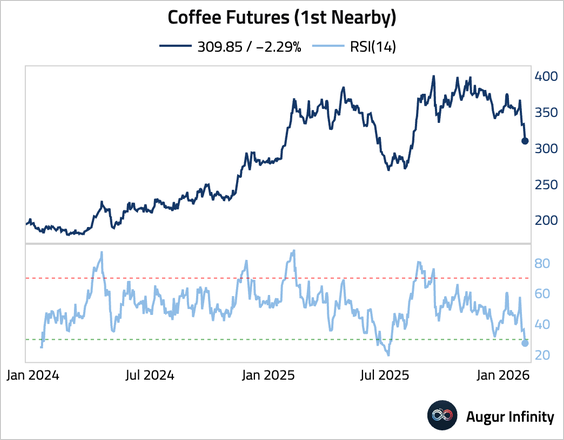
3. Coffee has entered oversold territory.
Global Developments
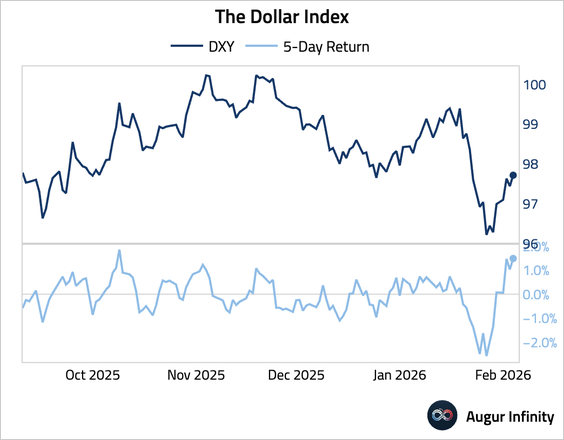
1. The dollar index’s five-day return is the highest since October 2025.
Cryptocurrency
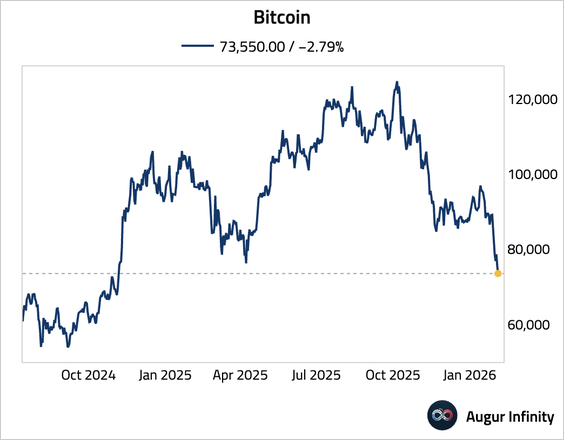
1. Bitcoin is at the lowest level since November 2024.
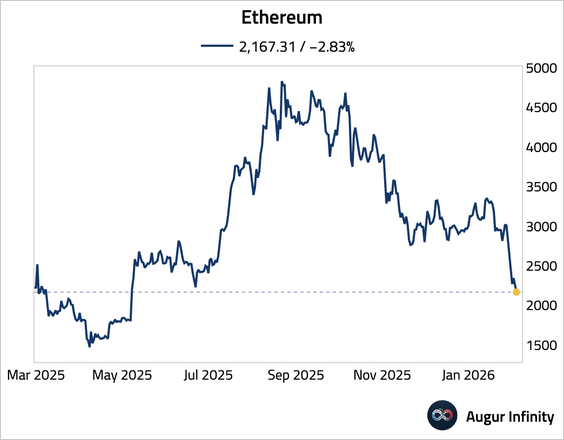
2. Ethereum is at the lowest level since May 2025.