
Equities
1. The S&P 500 bounced back, gaining 2% today. Meanwhile, the S&P 500 Equal Weight Index has stayed strong, reaching an all-time high.
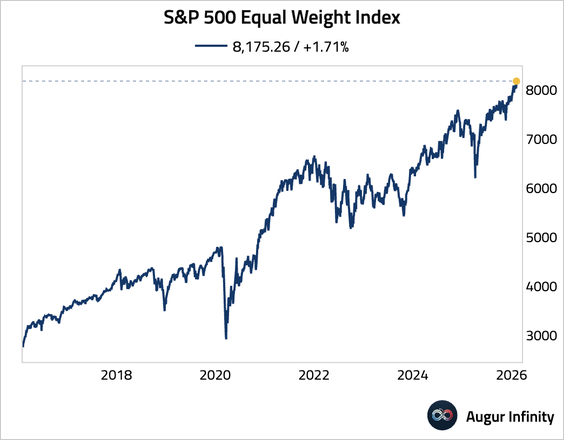
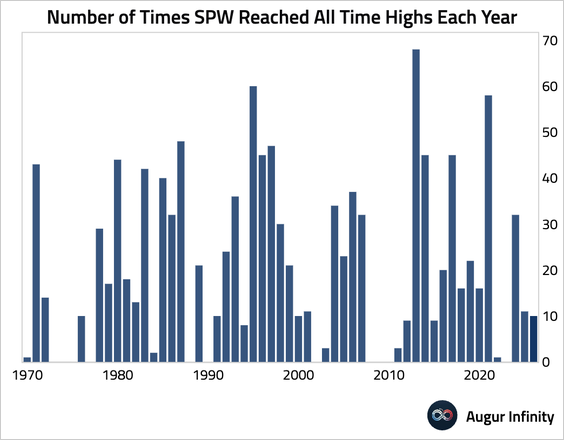
• This is its 10th record high this year.
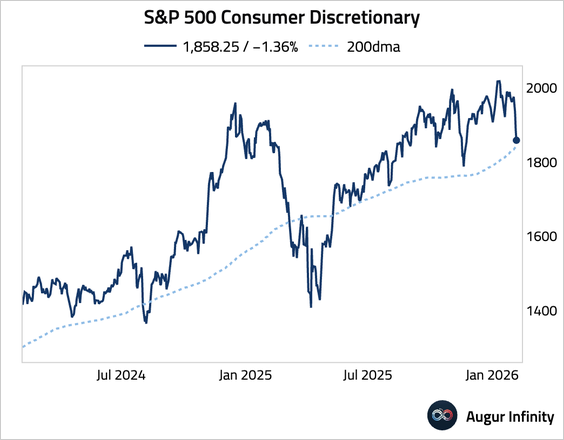
2. The consumer discretionary sector is testing support at the 200-day moving average.
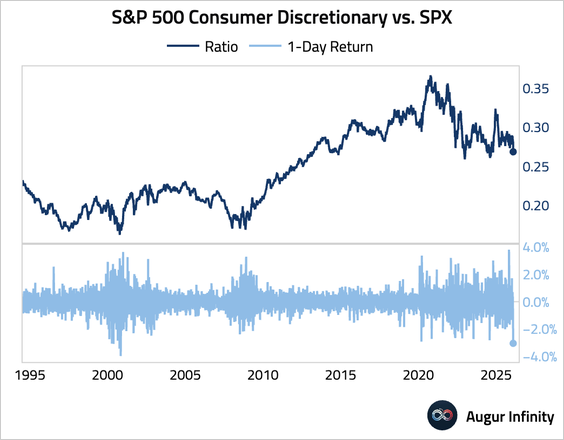
• The underperformance relative to the S&P 500 on Friday was the worst since November 2000.
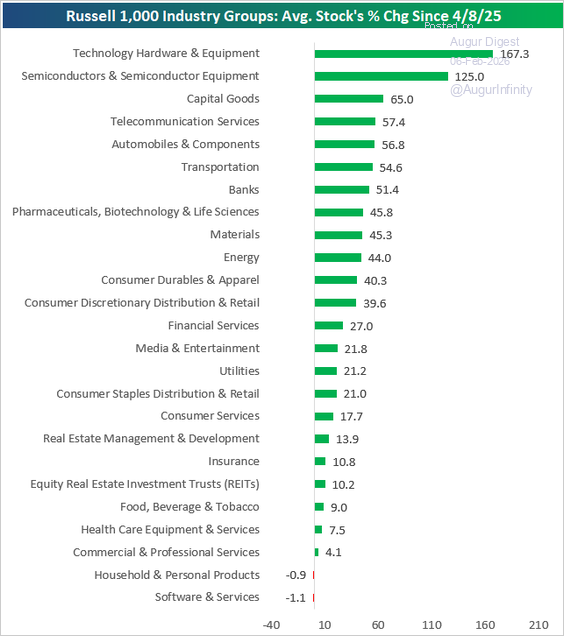
3. The average large-cap software stock is now down since the tariff tantrum low.
Source: @bespokeinvest
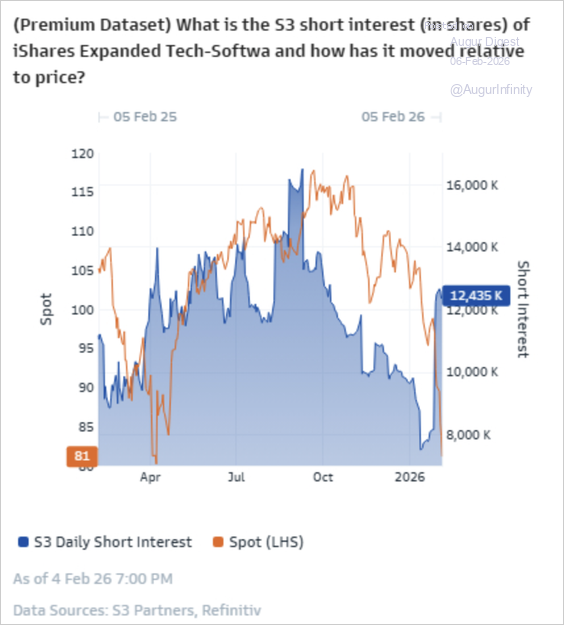
• Short interest in the software ETF (IGV) has reached elevated levels.
Source: Goldman Sachs
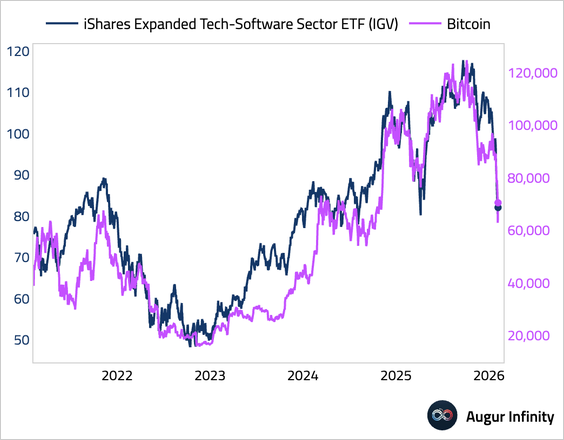
• This chart compares the performance of software stocks with that of Bitcoin.
Source: @MichaelKantro
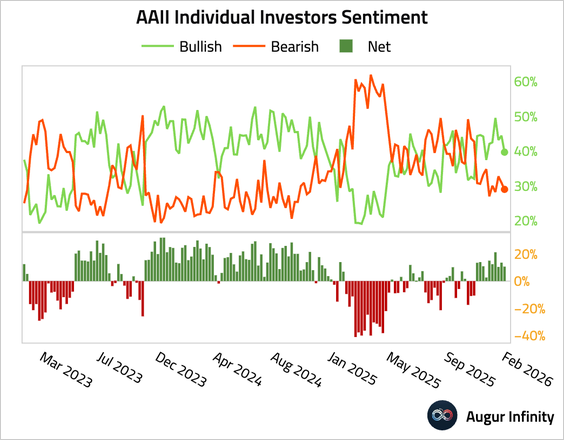
4. The AAII Bull–Bear spread (retail investor sentiment) remained positive for the 10th consecutive week.
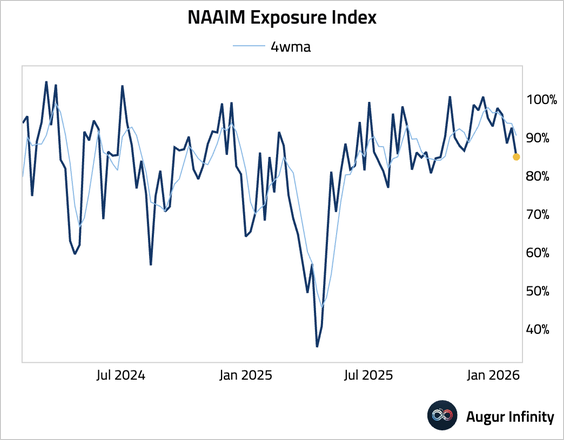
• Active managers cut exposure to US equities.
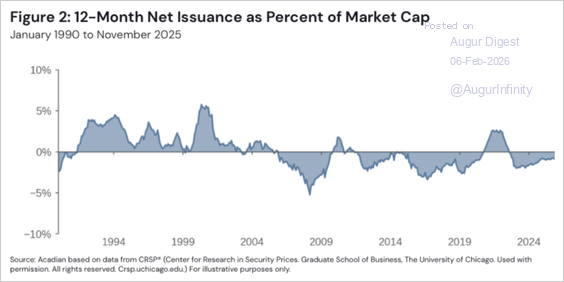
5. The supply of equity shares has been shrinking, with trailing 12-month net issuance at -0.9% of total market cap.
Source: Acadian via Snippet Finance
The United States
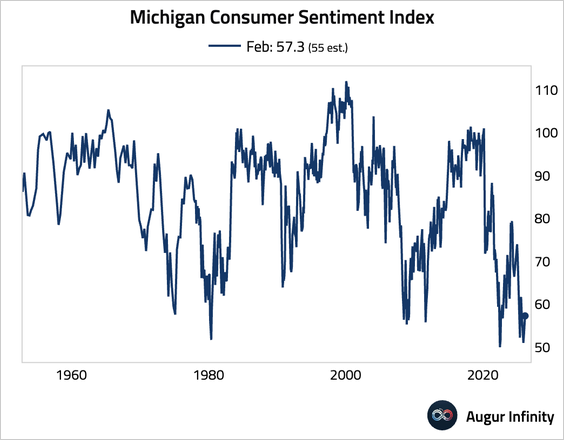
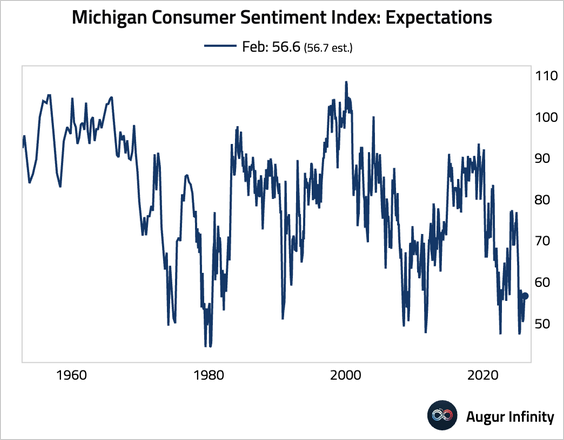
1. The University of Michigan consumer sentiment index unexpectedly rose to 57.3, beating the consensus estimate of 55.
• The increase was driven by an improvement in the current conditions component, …
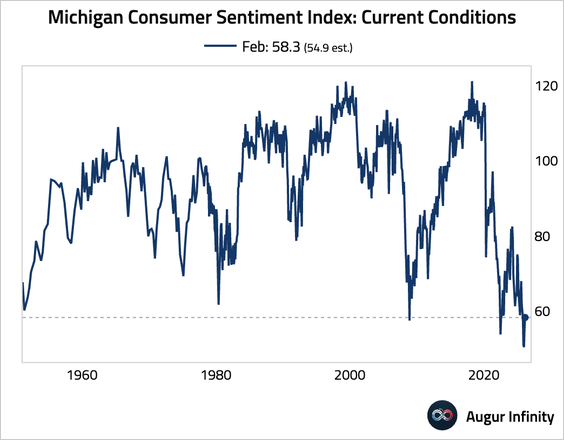
… while the expectations component inched down.

Subscribe to read the rest.
Become a subscriber of Augur Digest Premium to get access to this post and other subscriber-only content.
Upgrade