Global Developments
1. The US and Israel launched large-scale strikes on Iran, triggering retaliatory missile attacks across Israel and Gulf states, heightening risks of a broader regional war and disrupting shipping through the Strait of Hormuz.
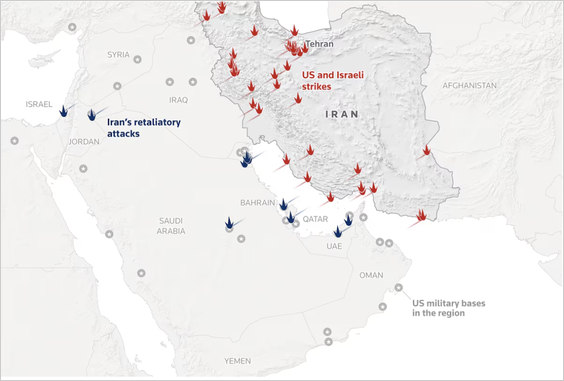
Source: Institute for the Study of War & AEI Critical Threats Project

Source: Reuters Read full article
– Hezbollah launched rocket and drone attacks on Israel, prompting Israeli airstrikes in Lebanon and further escalating regional tensions.

Source: Reuters Read full article
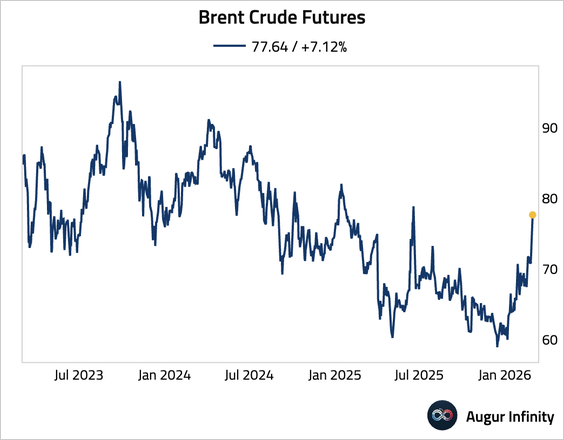
• Oil prices jumped.
– Iran represents about 5% of global oil production, …
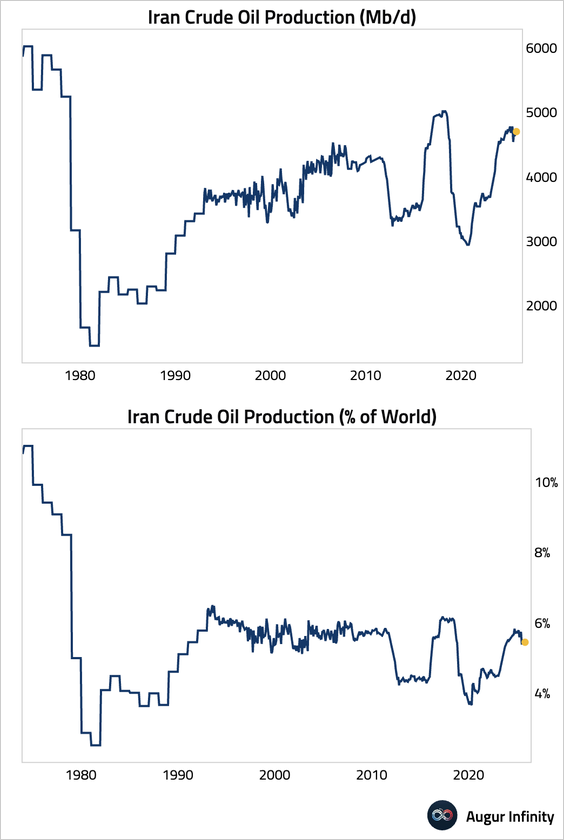
… with most of its exports destined for China.
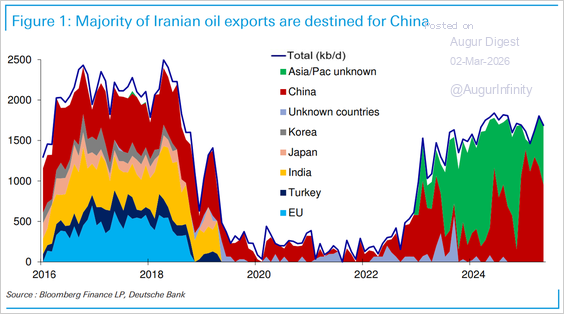
Source: Deutsche Bank Research
– This chart illustrates the oil flows through the Strait of Hormuz.
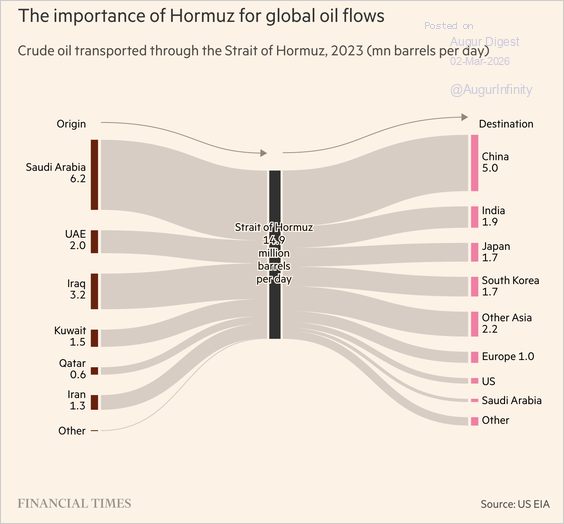
Source: @financialtimes Read full article
– Tanker traffic through the Strait has dwindled.
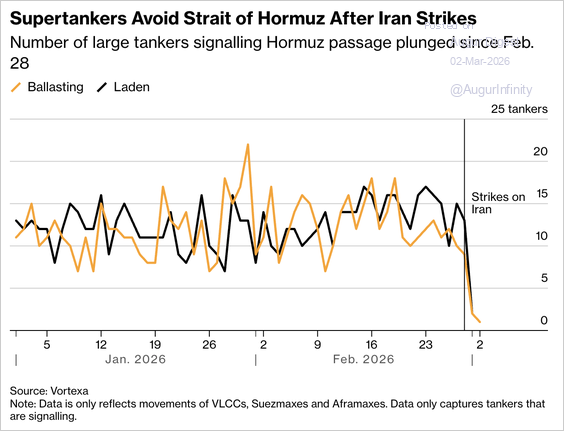
Source: @markets Read full article
– Goldman estimates the fair value of oil prices could rise by $10–15 in a one-month full Strait of Hormuz closure scenario.
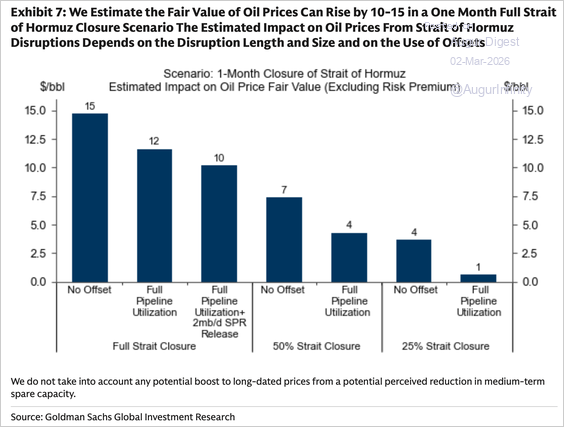
Source: @JKempEnergy
– Money managers had been adding to their net long positions in oil.
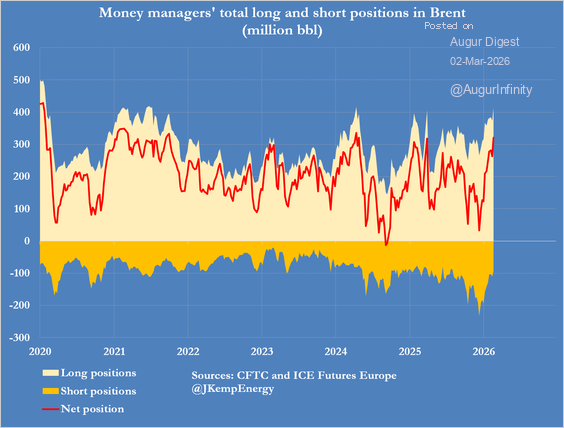
Source: @JKempEnergy
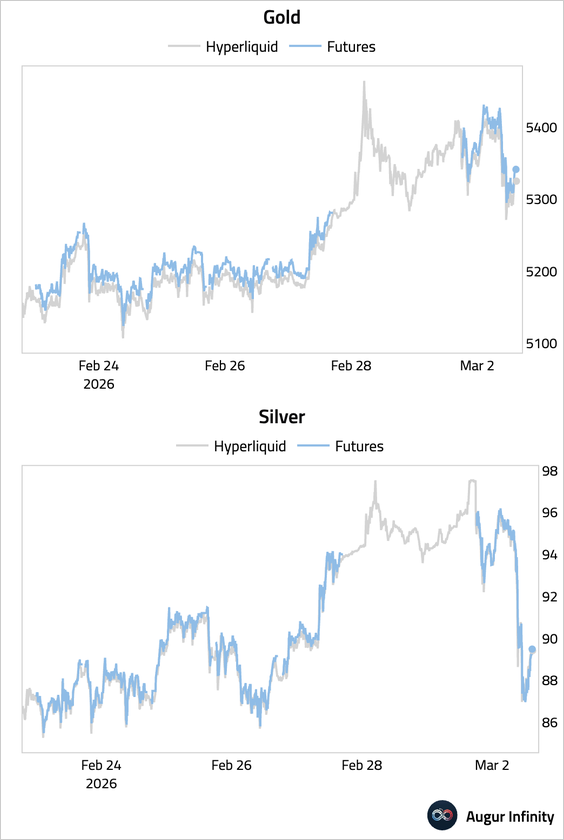
• Precious metals jumped.
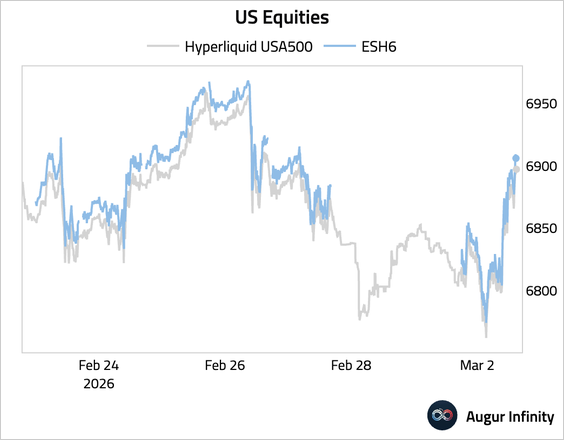
• Equities sold off all weekend... before rallying back into the green today.
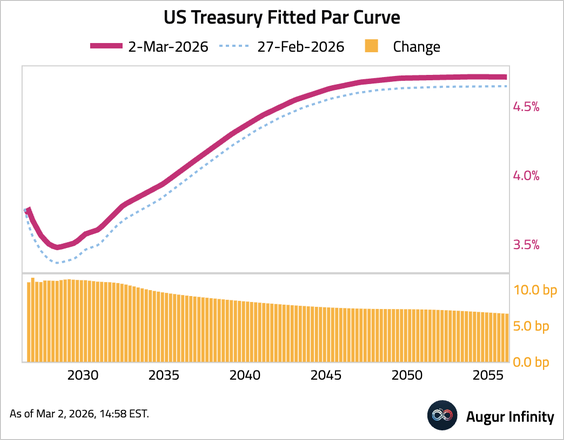
• US Treasury yields initially fell, but have since reversed course, led by the front end.
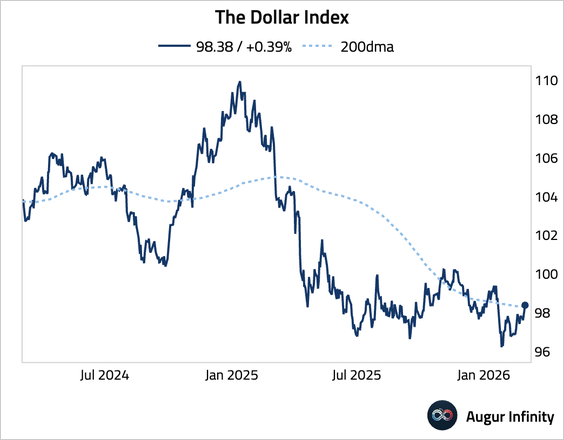
• The dollar index broke above its 200-day moving average.
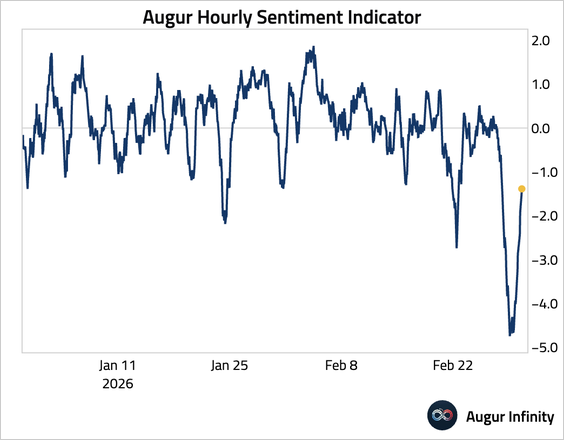
• Our high-frequency sentiment indicator cratered over the weekend, but has rebounded off the low.
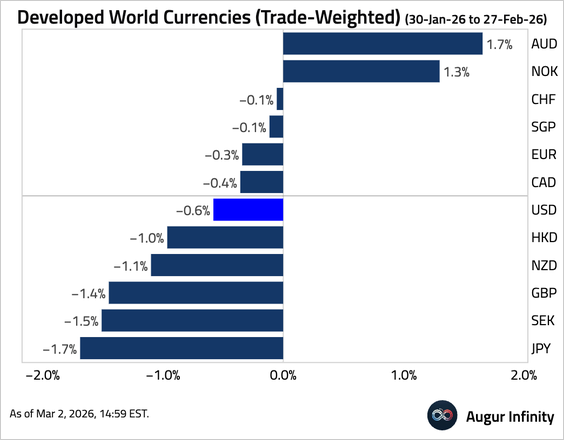
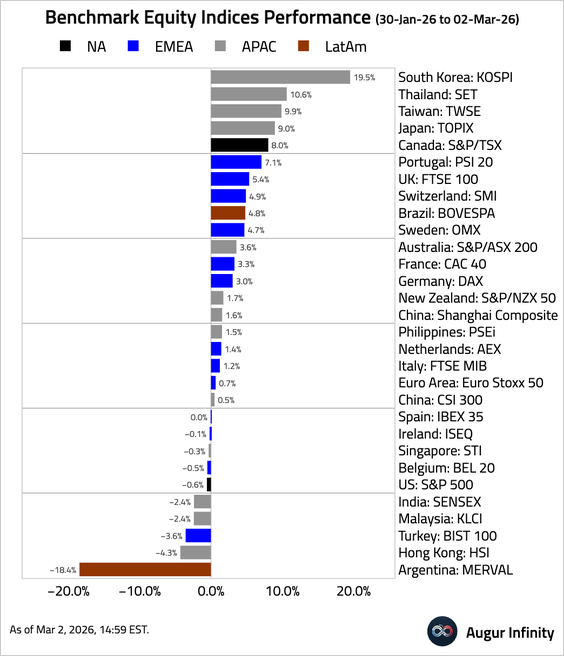
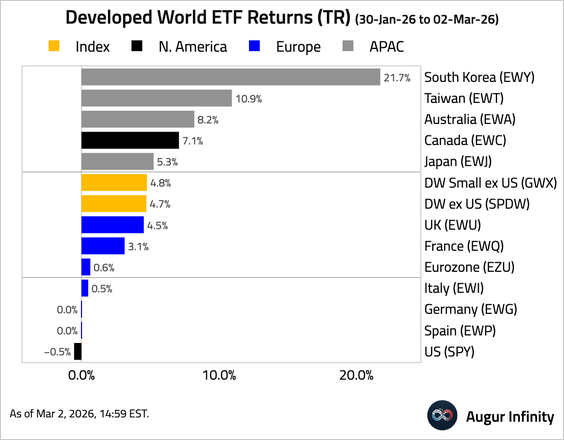
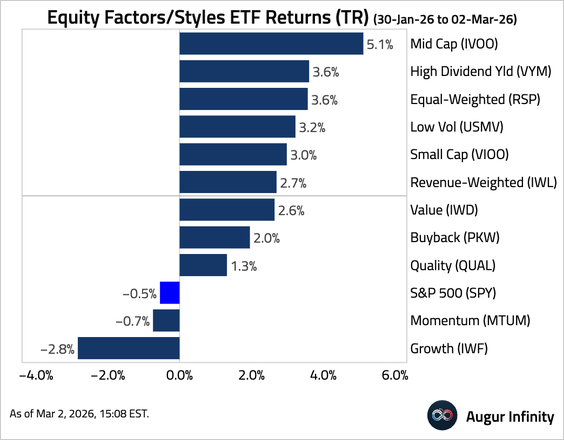
2. Next, we have some performance data for February.
• Currencies:
• Bond yields:

• Equity indices:
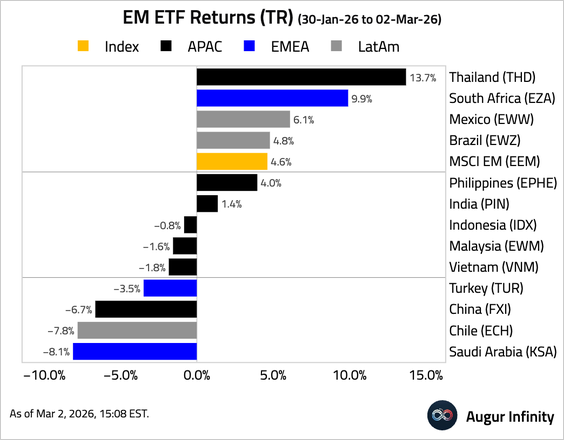
• USD-denominated equity ETFs:
The United States
1. These charts show how different US indicators are likely to respond to a $10 increase in oil prices, based on the Fed’s FRB/US model.
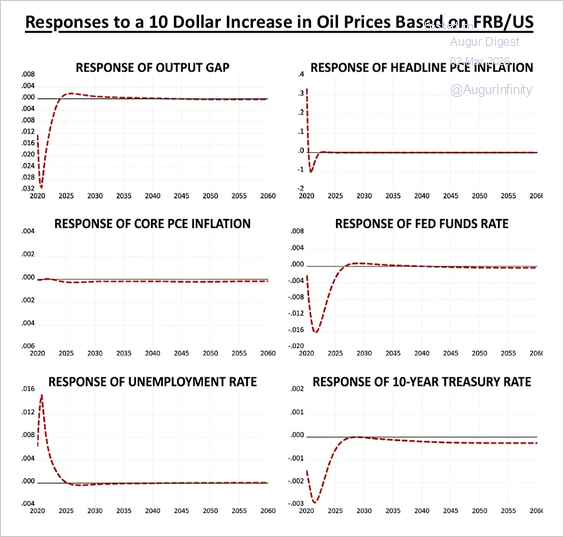
Source: Federal Reserve Read full article
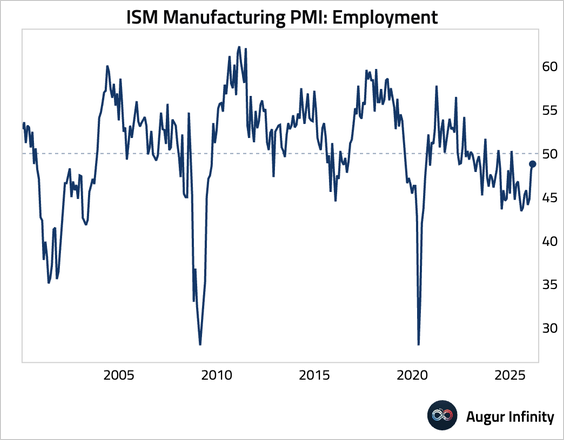
2. The ISM manufacturing PMI remained firmly in expansionary territory, near the highest reading in over three years.


Source: Reuters Read full article
– This chart shows the contribution of each component to the headline figure.
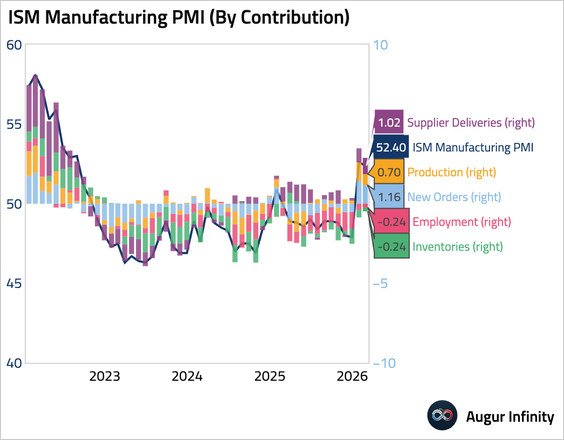
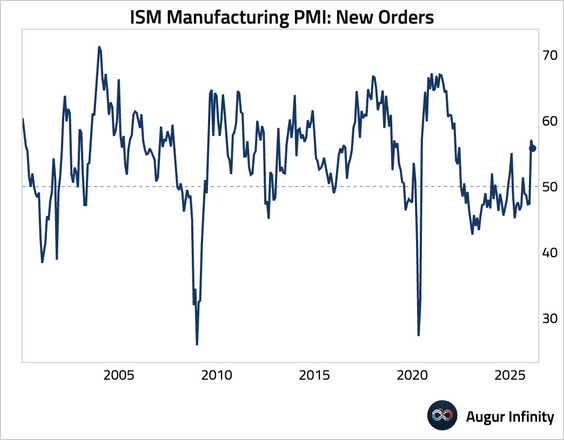
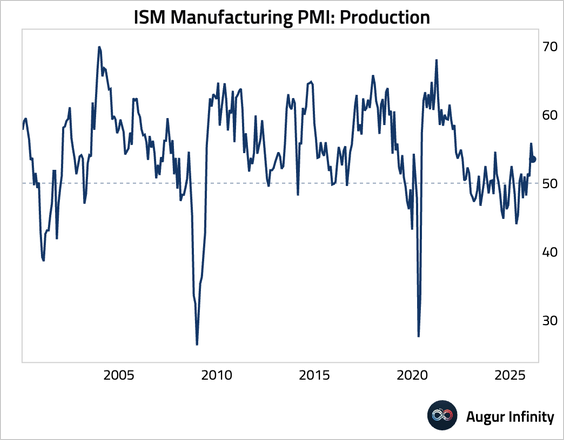
• New orders and output moderated, but both remained in solid expansion.
• Employment remained in contraction, but the pace of contraction eased further.
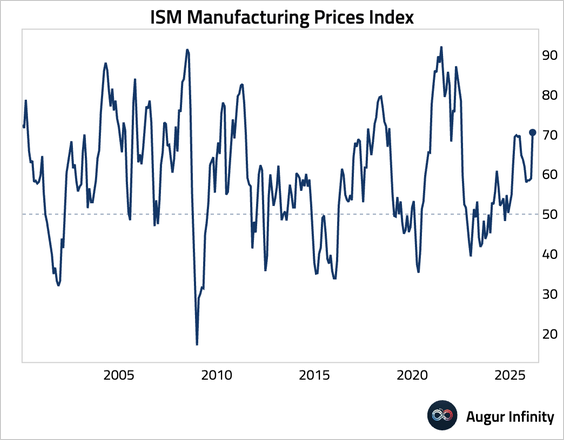
• The price index surged to the highest level since mid-2022, with firms widely citing higher metals costs and tariffs, indicating stubborn price pressures.
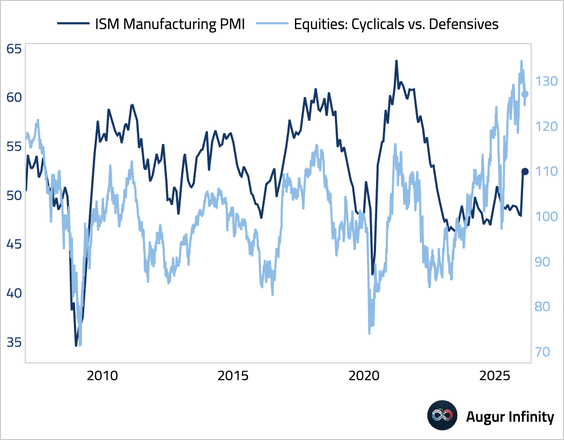
• The gap between PMI and the ratio of cyclical versus defensive equities remains large.
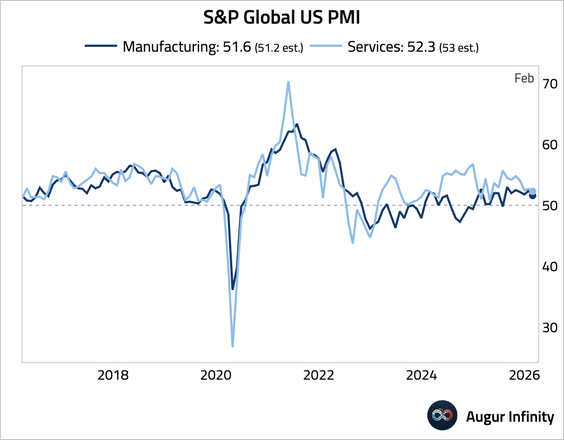
3. The S&P Global Manufacturing PMI was revised higher, confirming that factory activity remained in expansion.
Canada
1. Canada’s manufacturing PMI rose to its highest reading in over a year, signaling a modest but accelerating expansion in the factory sector.
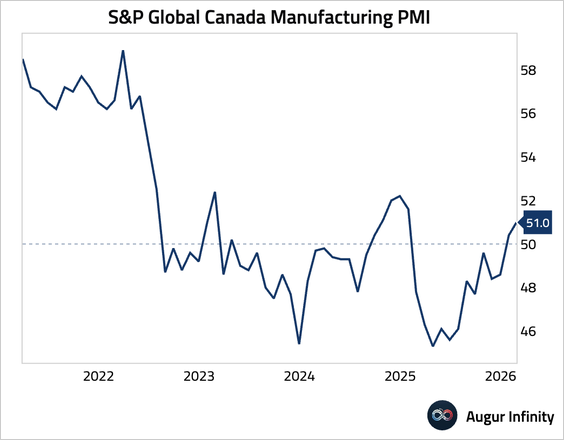
Source: S&P Global PMI
The United Kingdom
1. Household credit creation remained solid overall, with consumer credit picking up further, offset by a decline in mortgage lending.
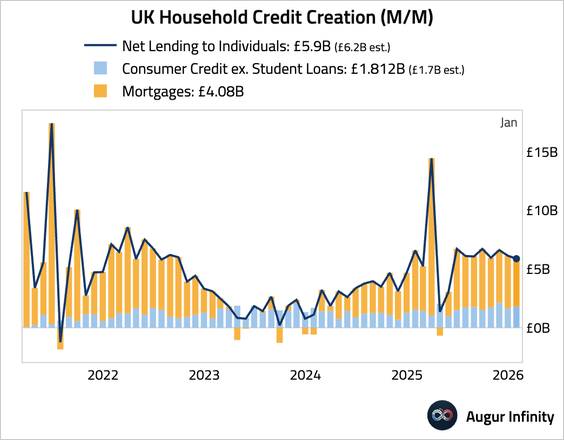
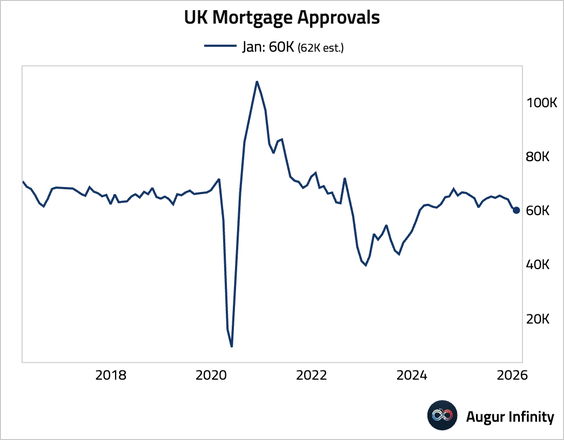
• New mortgage approvals for house purchases fell to a two-year low and disappointed relative to the consensus. However, with the RICS new buyer inquiries balance jumping to a six-month high in January, mortgage approvals should rebound.
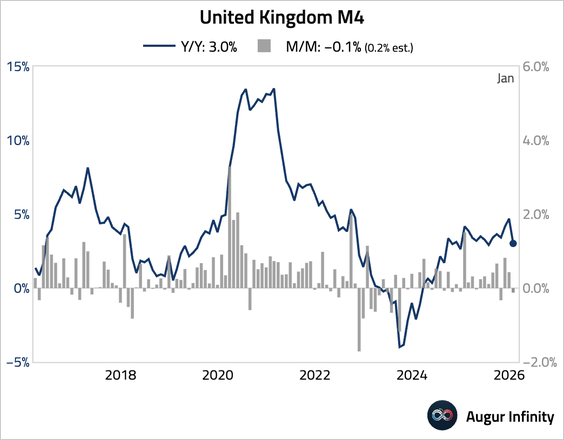
2. The M4 money supply growth slowed considerably.
3. House prices rose 0.3% in February, extending January’s gain, as resilient demand and lower interest rates support a modest recovery.
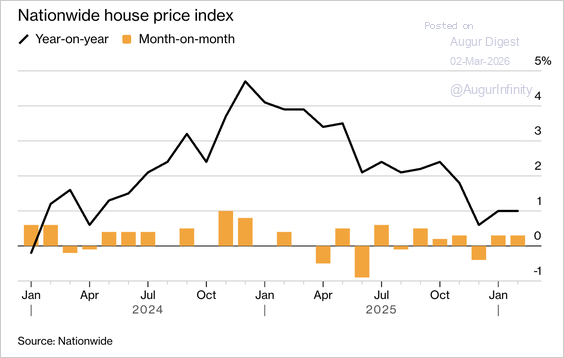
Source: @markets Read full article
4. Tax receipts have significantly outperformed forecasts, delivering a £22 billion fiscal windfall that is expected to reduce gilt issuance and ease pressure on bond yields, although the durability of the improvement remains uncertain amid ongoing fiscal challenges.
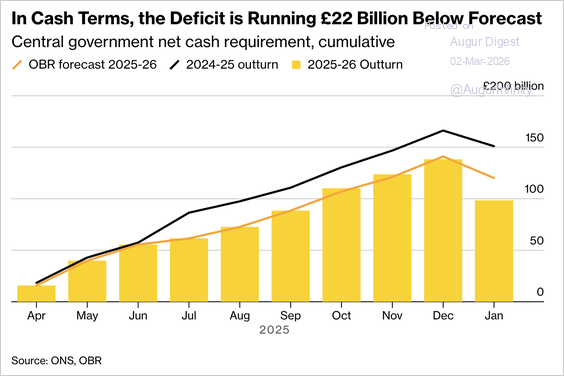
Source: @bpolitics Read full article
5. The weight of capital-light businesses is much lower in the UK than in the US.
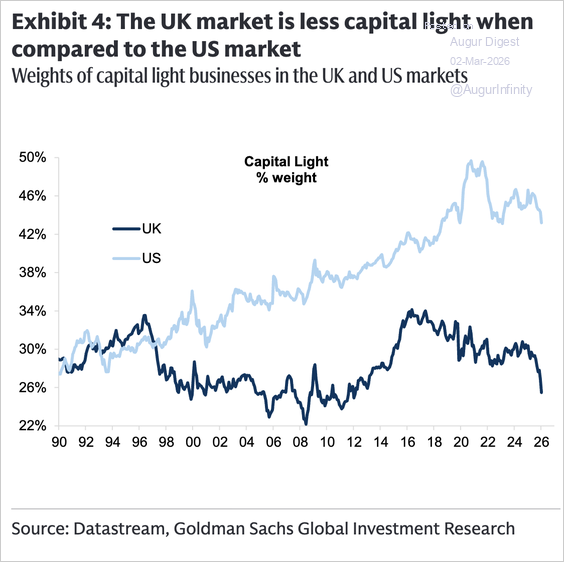
Source: Goldman Sachs
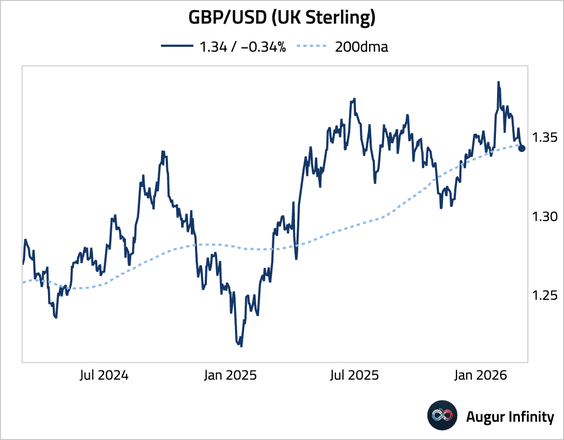
6. The pound fell below its 200-day moving average.
The Eurozone
1. Let’s scan through manufacturing PMIs in the euro area.
• Eurozone (expansion):
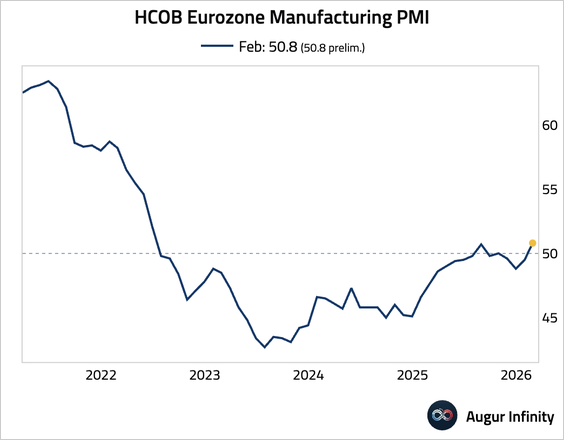
Source: S&P Global PMI
• Germany (slightly stronger expansion than initial report):
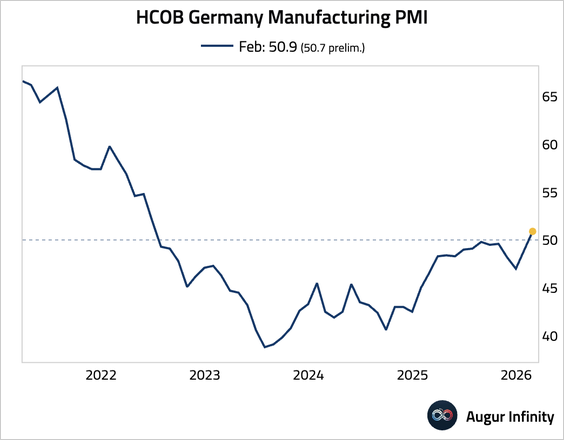
Source: S&P Global PMI
• France (revised up to an expansion reading):
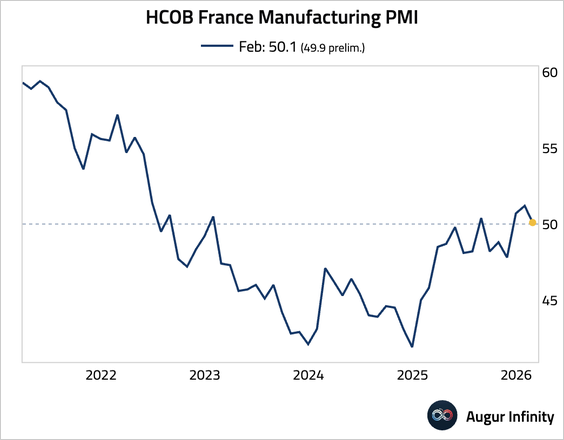
Source: S&P Global PMI
• Italy (returned to expansionary territory):
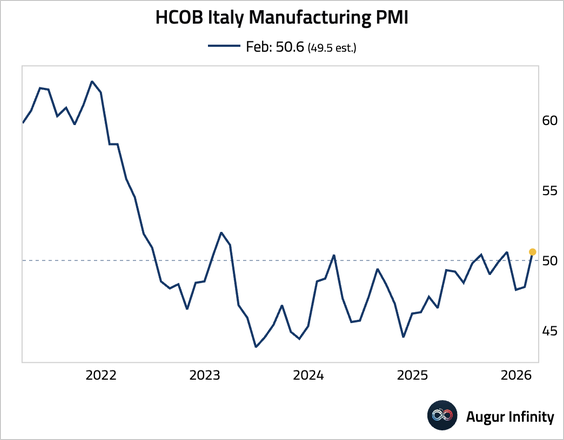
Source: S&P Global PMI
• Spain (stabilization):
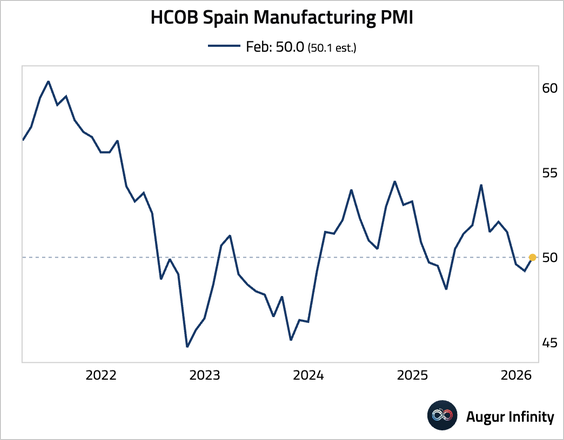
Source: S&P Global PMI
• The Netherlands (acceleration in expansion):
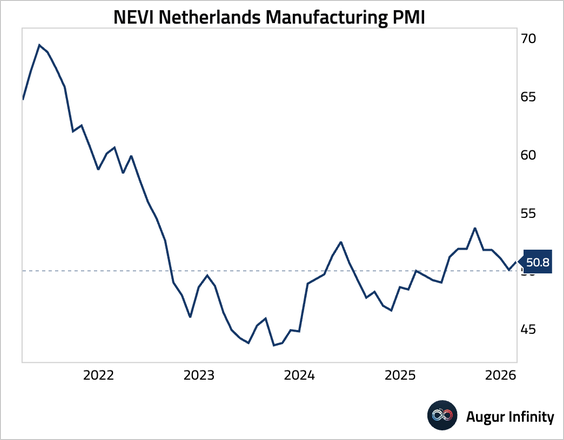
Source: S&P Global PMI
• Greece (further acceleration in strong expansion):
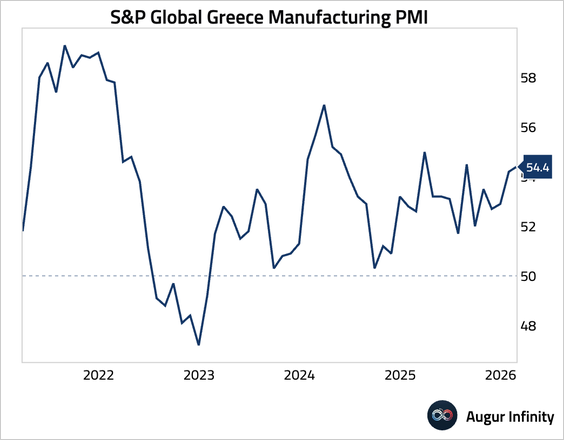
Source: S&P Global PMI
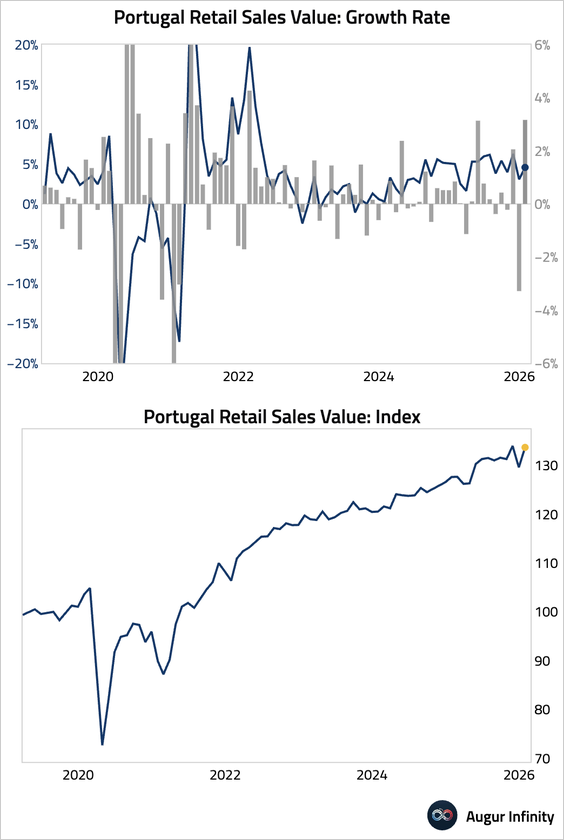
2. Portugal’s industrial production rebounded sharply.
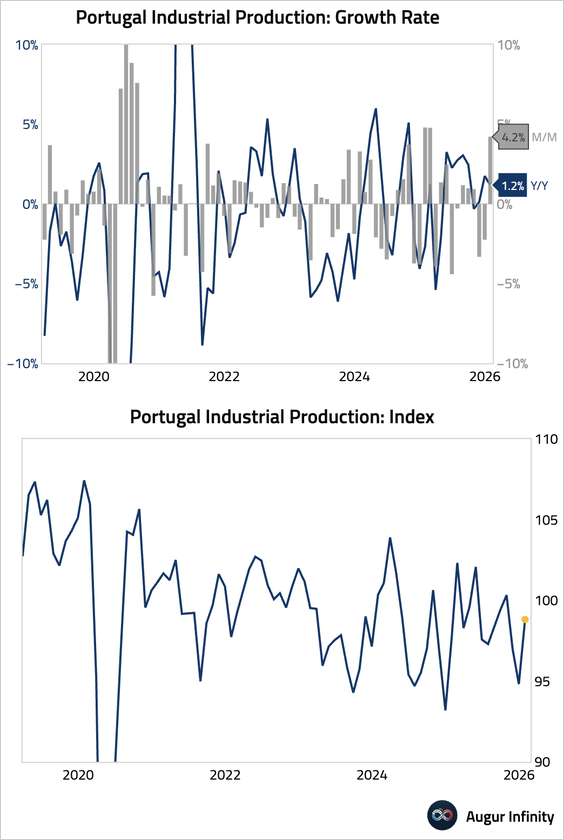
• Retail sales also posted a strong rebound.
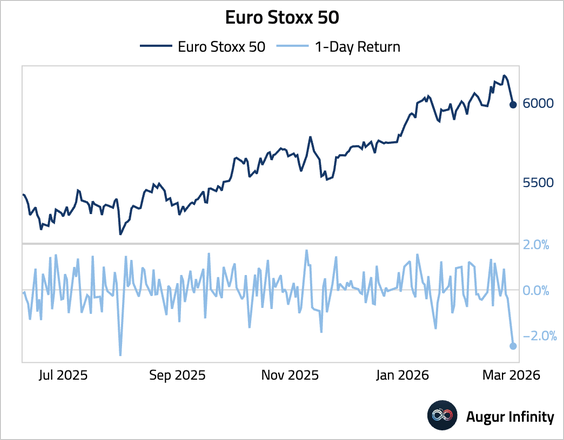
3. Euro Stoxx 50 is on track for the worst day since August 2025.
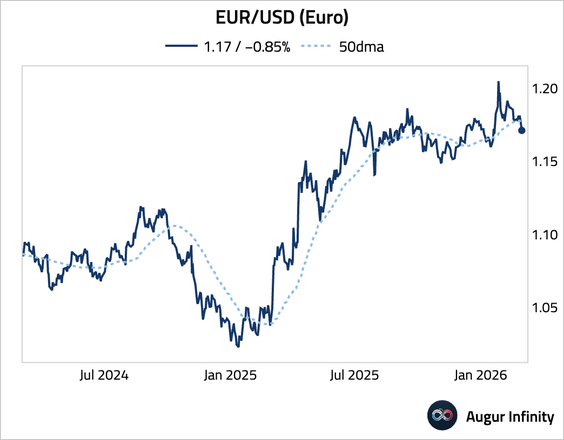
• EUR/USD fell below its 50-day moving average.
Europe
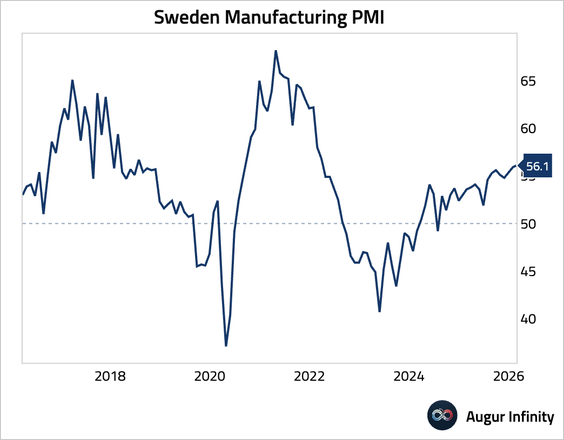
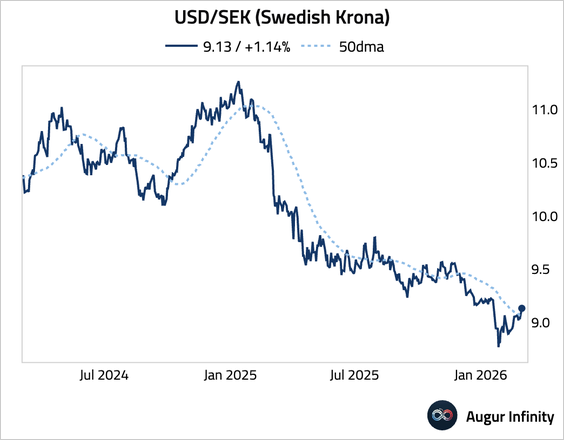
1. Sweden’s manufacturing PMI edged up to its highest reading in nearly four years, pointing to a robust expansion in factory activity.
• USD/SEK rose above its 50-day moving average.
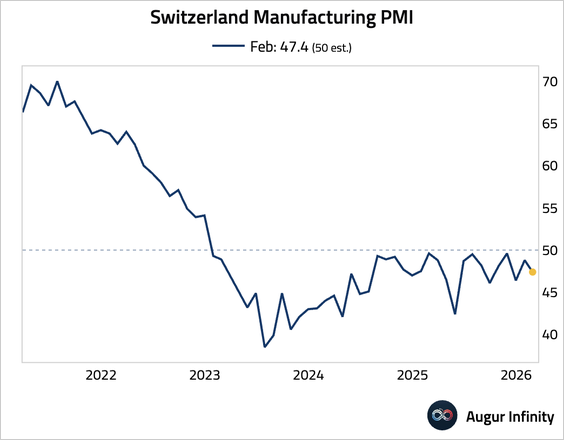
2. The Swiss manufacturing PMI fell deeper into contractionary territory.
3. Poland’s manufacturing PMI slipped further into contractionary territory. In contrast, the Czechia manufacturing PMI stabilized at 50, while factory activity in Hungary moved back into an expansion.
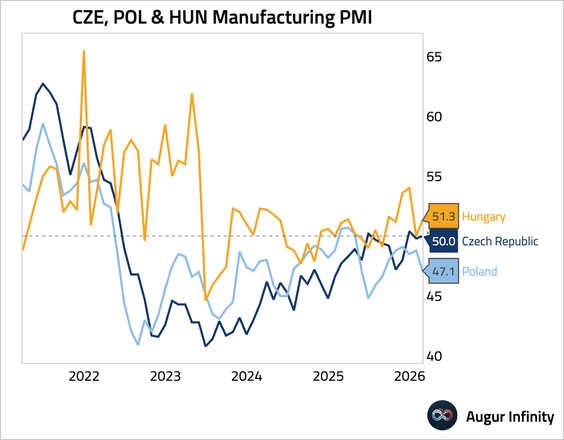
Source: S&P Global PMI
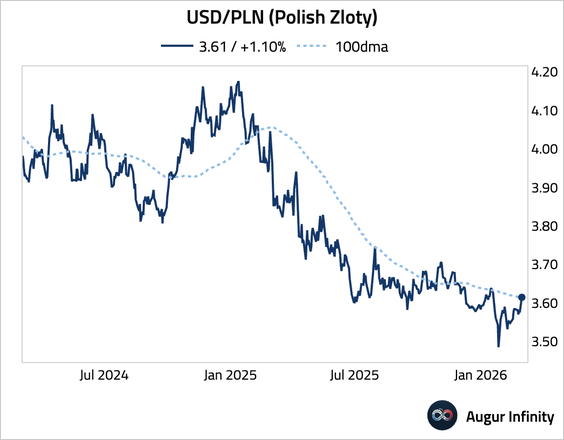
• The Polish zloty depreciated sharply against the dollar, with USD/PLN breaking above its 100-day moving average.
Asia-Pacific
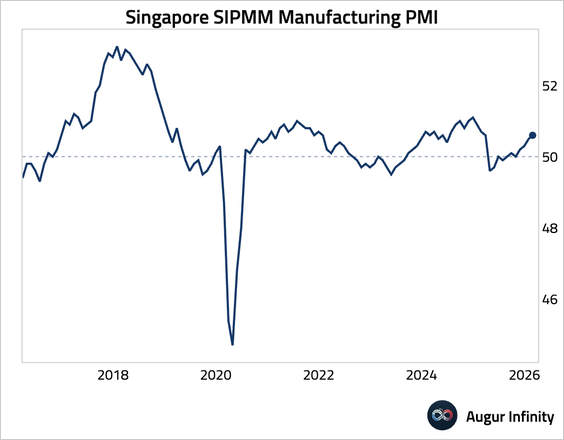
1. Singapore’s manufacturing sector expanded at an accelerating pace in February.
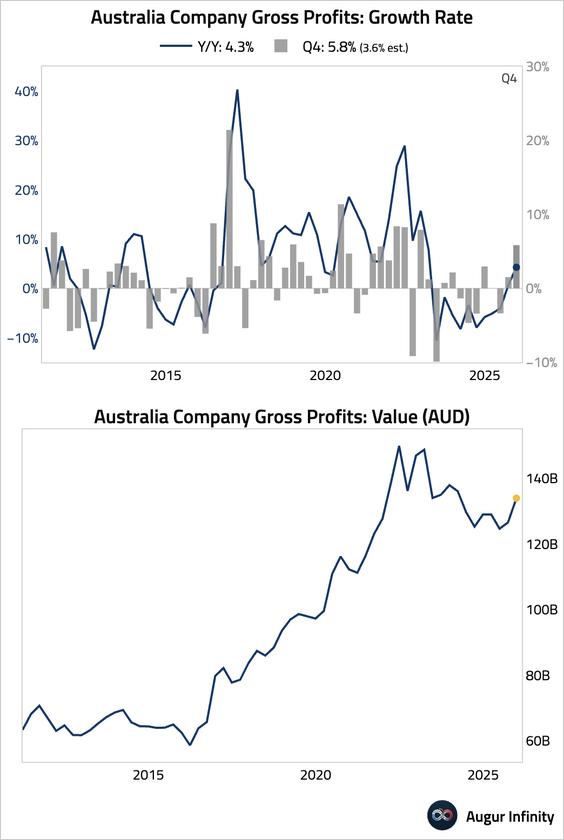
2. Australian corporate gross operating profits surged in Q4, crushing expectations, while business inventories edged down. The profit beat was broad-based but led by a sharp rise in mining profits.
• The Melbourne Institute’s inflation gauge eased month over month, but the year-over-year gauge remained firm.
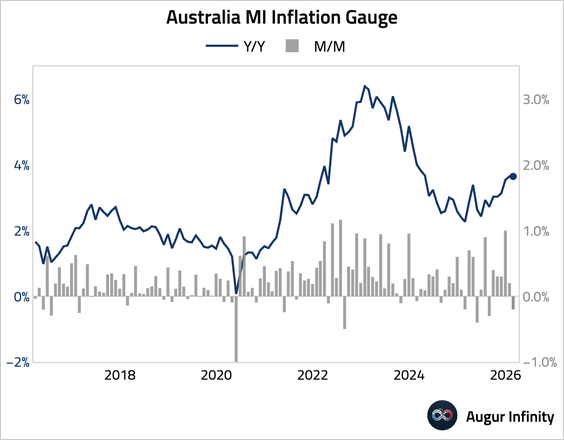
Source: Melbourne Institute
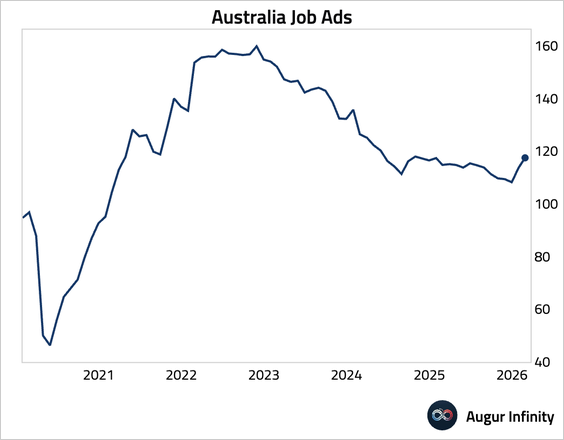
• Job ads picked up further.
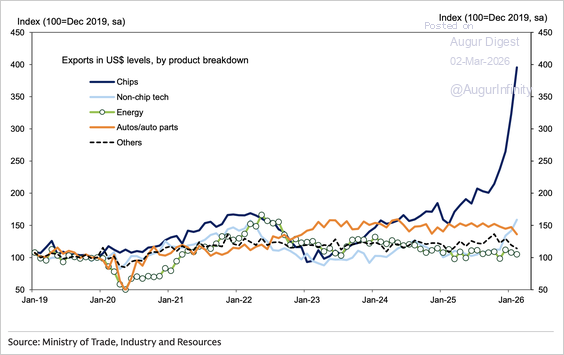
3. South Korea’s exports surged in February, …
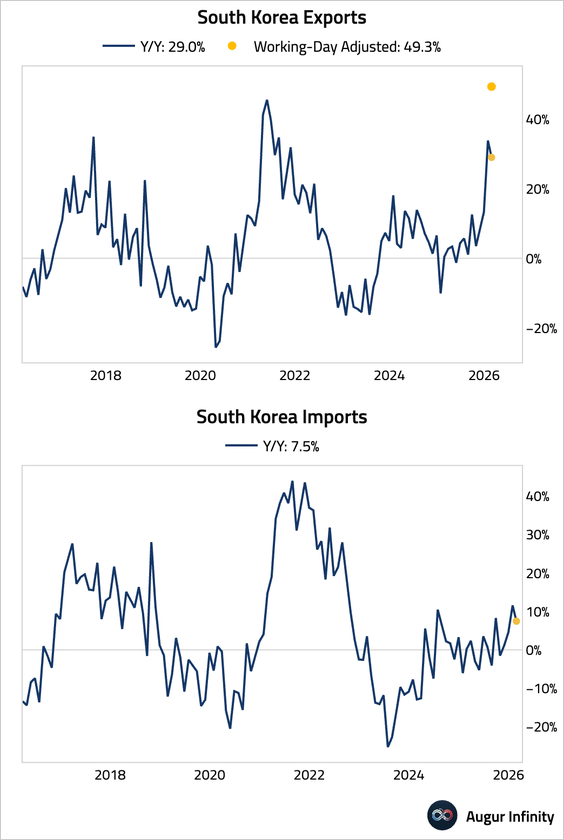
… driven entirely by record semiconductor shipments.
Source: Goldman Sachs
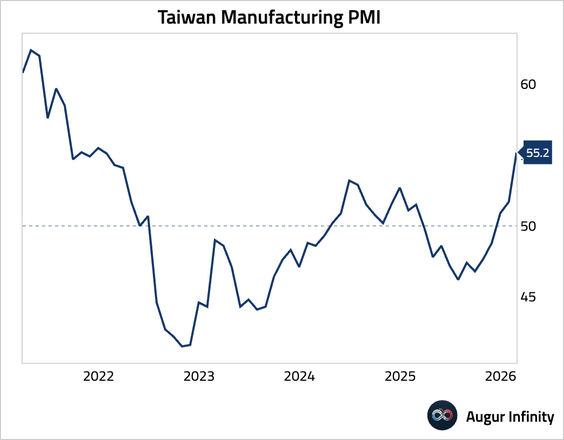
4. Taiwan’s Manufacturing PMI surged to the highest level since December 2021, driven by strong global tech demand. This boom is straining supply chains and outpacing hiring, leading to the sharpest backlog accumulation since August 2021 and accelerating input cost inflation.
Source: S&P Global PMI
China
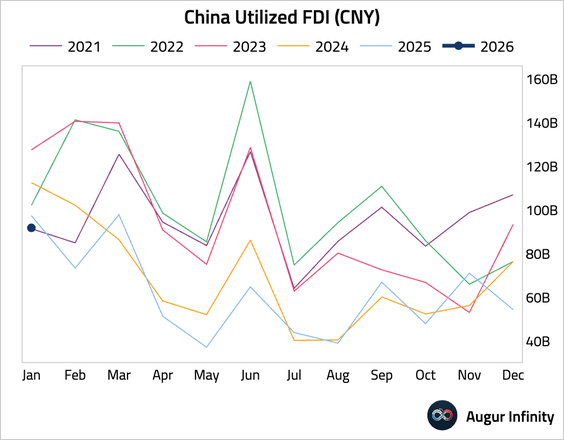
1. China’s utilized foreign direct investment fell by 5.7% year over year.
2. The PMI for emerging industries fell in February.
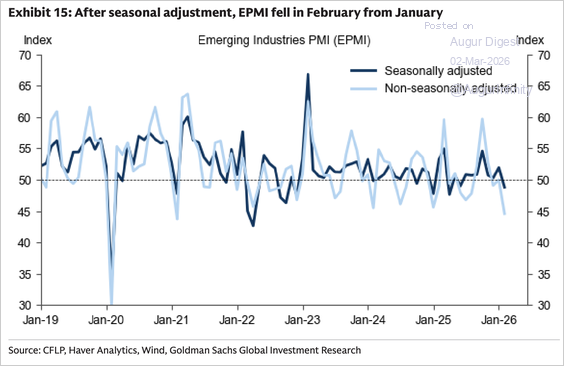
Source: Goldman Sachs
3. Household bank deposits are well above their pre-pandemic trend.
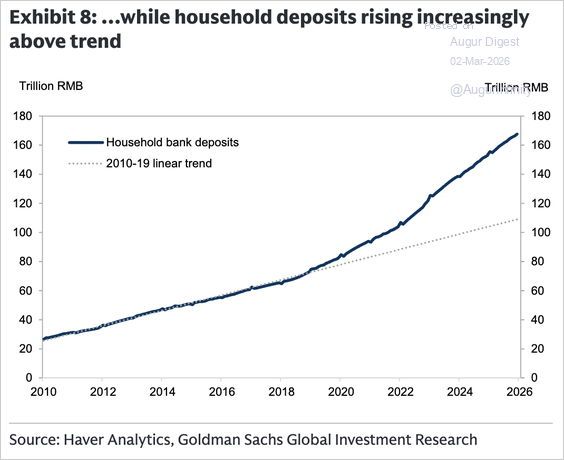
Source: Goldman Sachs
4. Property transaction volume in the secondary market edged up, roughly in line with last year’s level.

Source: Goldman Sachs
5. Property transaction volume in the secondary market edged up, roughly in line with last year’s level.
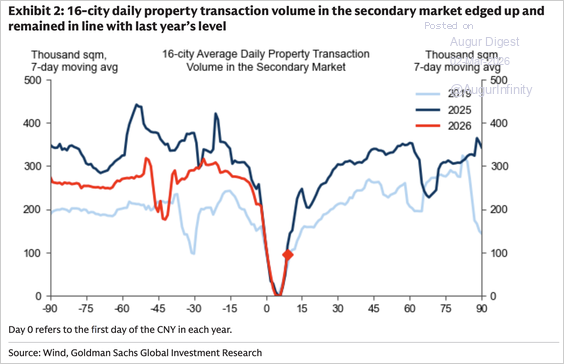
Source: Goldman Sachs
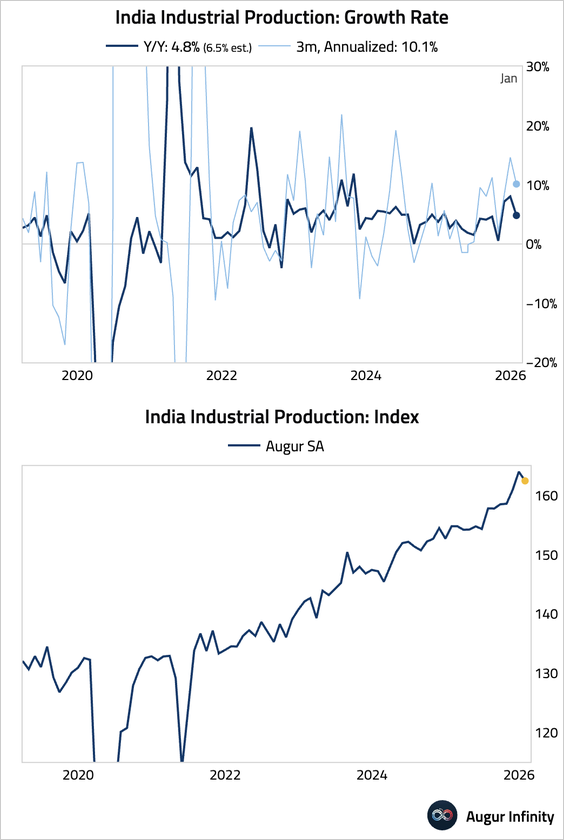
India
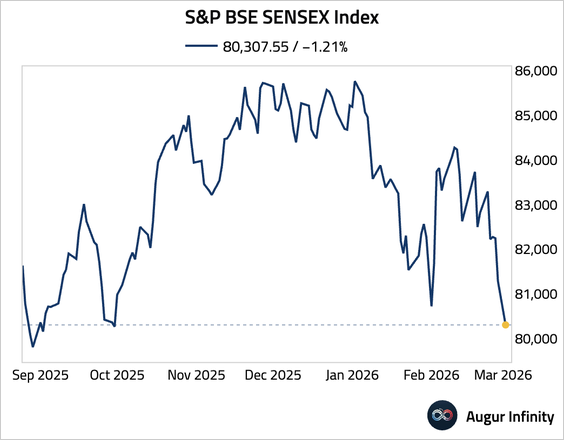
1. Sensex is trading at the lowest level since September 2025.
2. Industrial production eased from high levels in January.
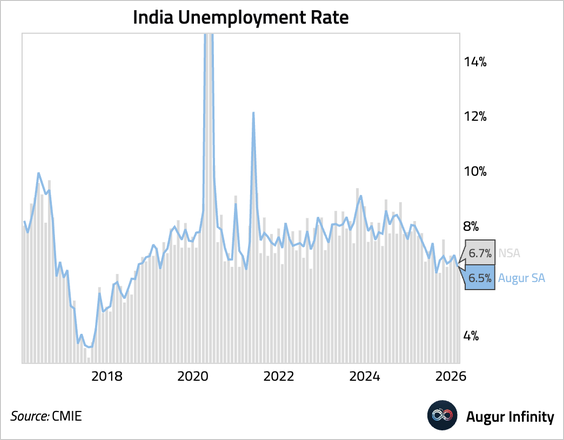
3. The unofficial CMIE unemployment rate declined in February.
Emerging Markets
1. Here is a look at some EM Asia manufacturing PMI trends.
• Thailand (reaccelerating expansion):
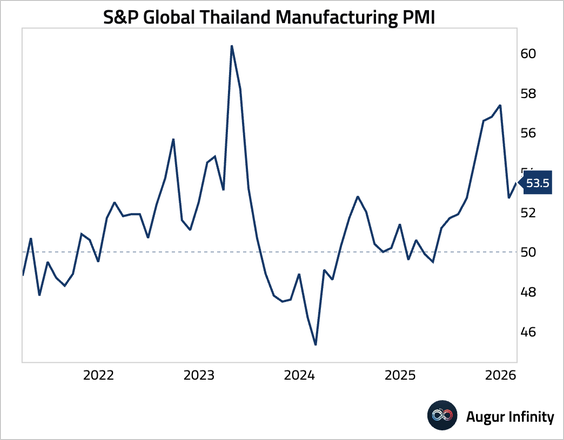
Source: S&P Global PMI
• Indonesia (strongest expansion in nearly two years):
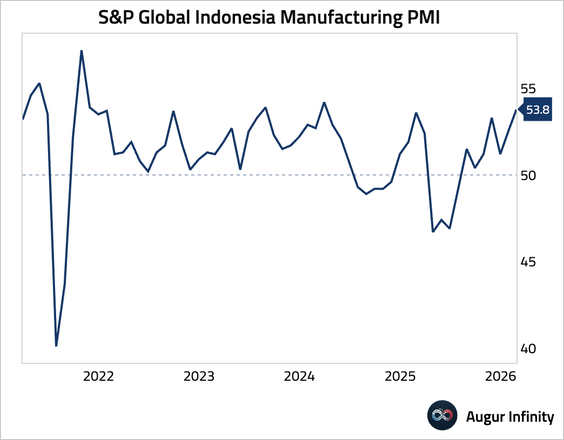
Source: S&P Global PMI
• The Philippines (strongest expansion in over eight years):
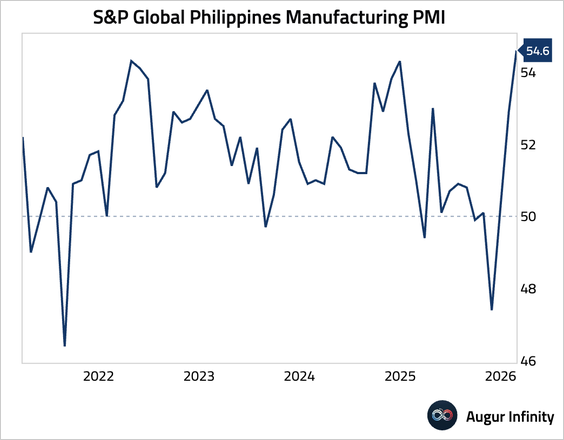
Source: S&P Global PMI
• Vietnam (acceleration):
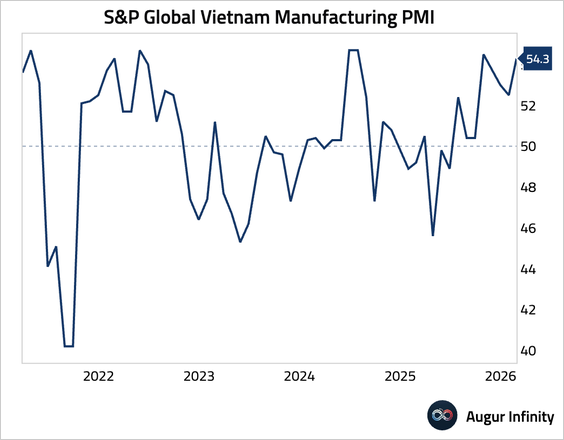
Source: S&P Global PMI
• Malaysia (contraction):
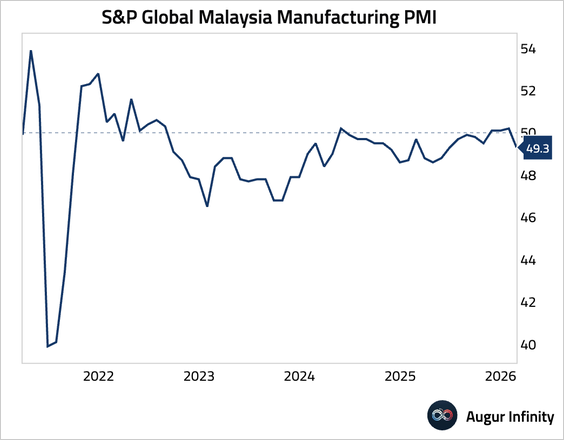
Source: S&P Global PMI
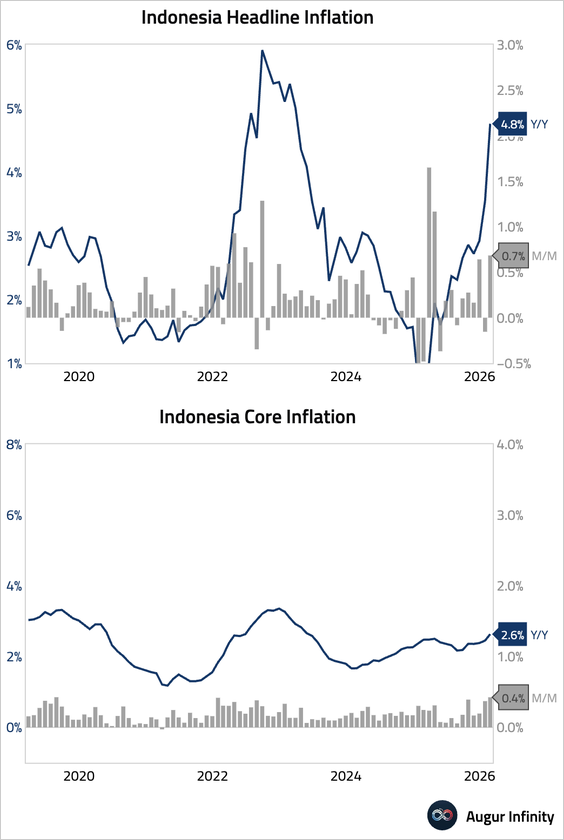
2. Indonesian inflation accelerated, pushing it above the central bank’s 1.5%–3.5% target range, driven primarily by higher food prices.
3. Brazil’s manufacturing sector remained in contraction for a 10th straight month, as new business intakes fell at the fastest pace in five months, weighed down by weak demand and high interest rates.
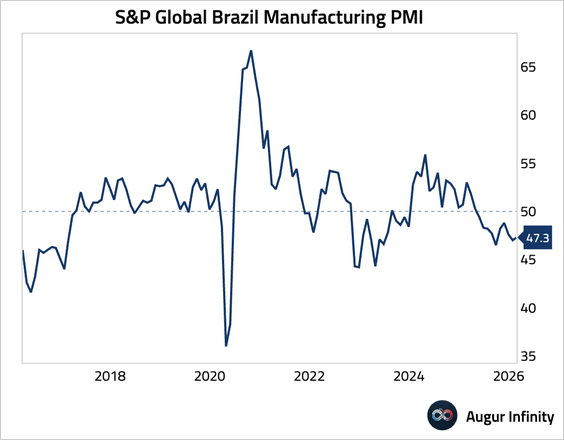
Source: S&P Global PMI
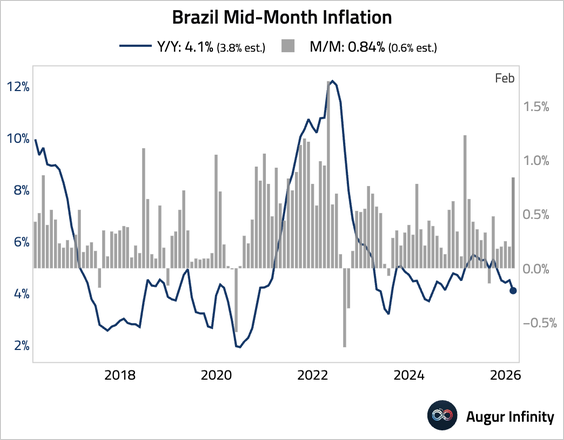
4. Brazil’s mid-month inflation was much higher than expected, driven by seasonal school tuition hikes, a sharp rise in airfares, and urban transport costs.
5. The S&P Global and IMEF manufacturing PMIs for Mexico rose, but both remained deep in contractionary territory, signaling ongoing weakness in factory activity.
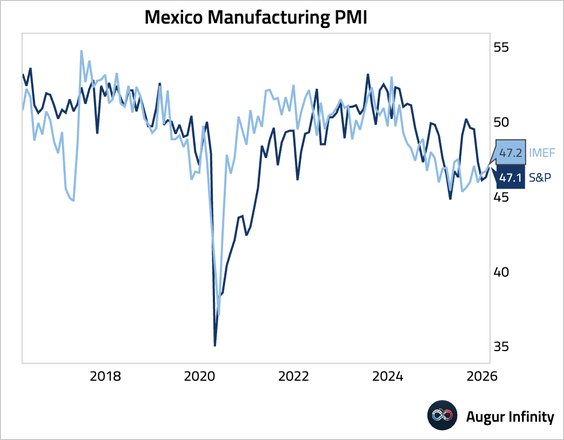
Source: S&P Global PMI
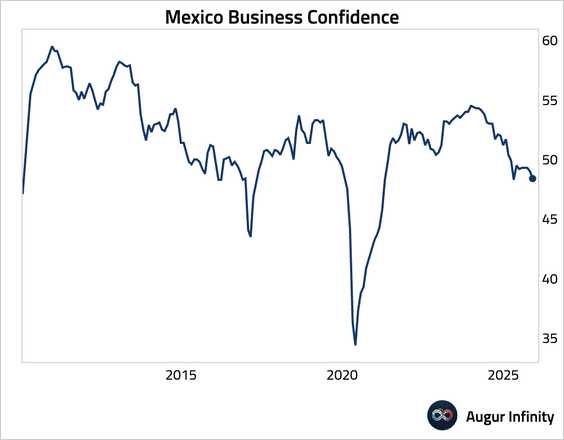
• Business confidence declined further into pessimistic territory.
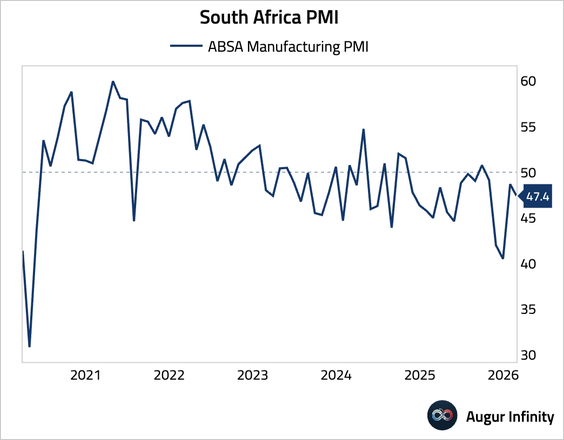
6. South Africa’s manufacturing sector contracted further in February.
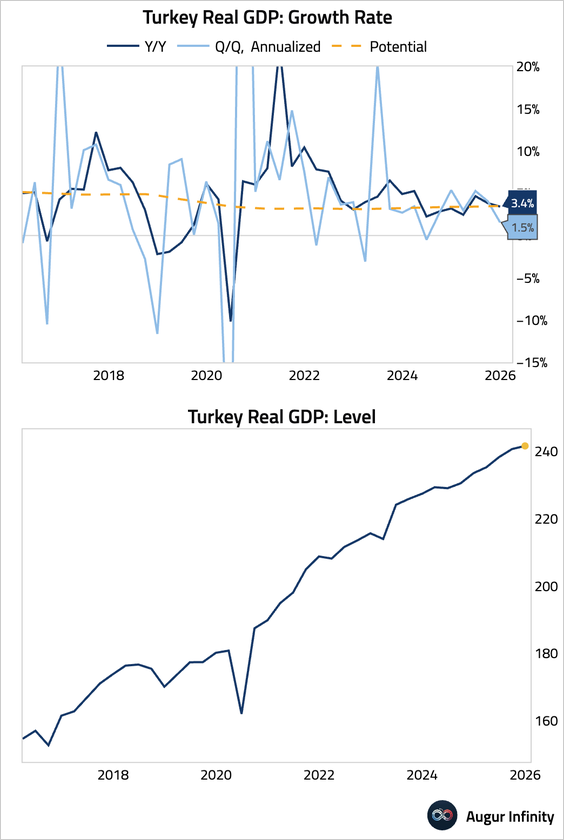
7. Turkey’s GDP growth slowed in Q4, as tight monetary policy and elevated borrowing costs weighed on domestic demand.
• Manufacturing PMI rose to a 22-month high of 49.3, but remained in contractionary territory.

• Turkey’s central bank suspended lending at its main one-week repo rate—effectively raising rates by 300 bps—and announced FX-settled forward sales to defend the lira, while regulators imposed a temporary short-selling ban after an emergency financial stability meeting.

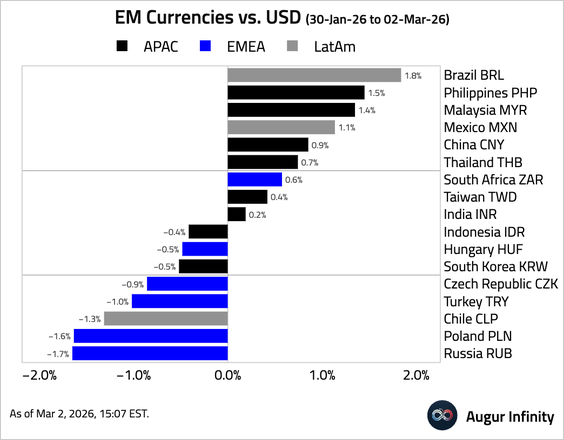
• Currencies:
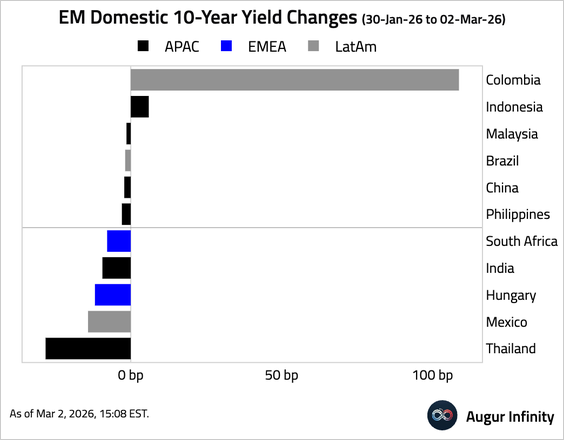
• Bond yields:
• Equity ETFs:
Equities
1. US equities advanced on Monday, bucking the global trend amidst heightened geopolitical risks.
• Let’s first take a look at positioning by sector.
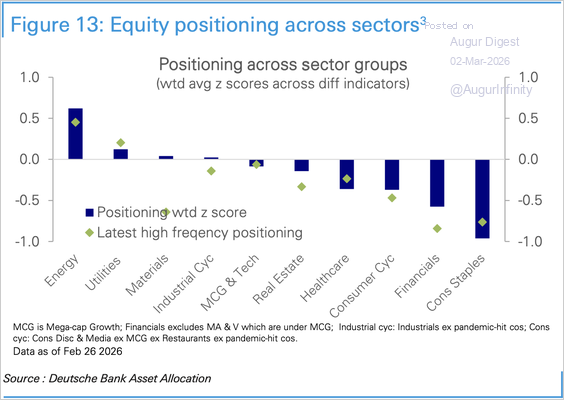
Source: Deutsche Bank Research
2. The average number of years a company remains in the S&P 500 index continues to decline.
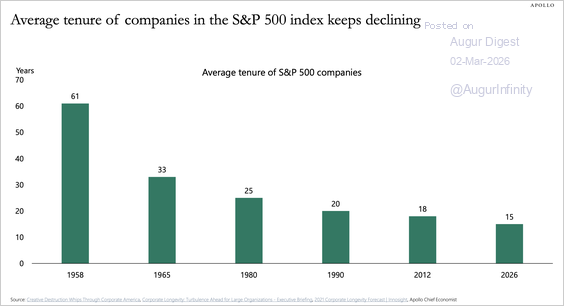
Source: Torsten Slok, Apollo
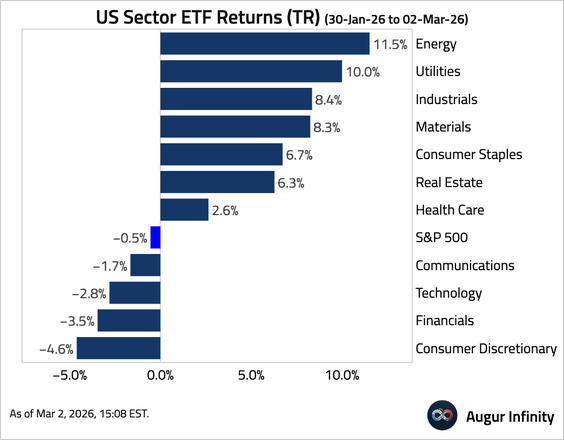
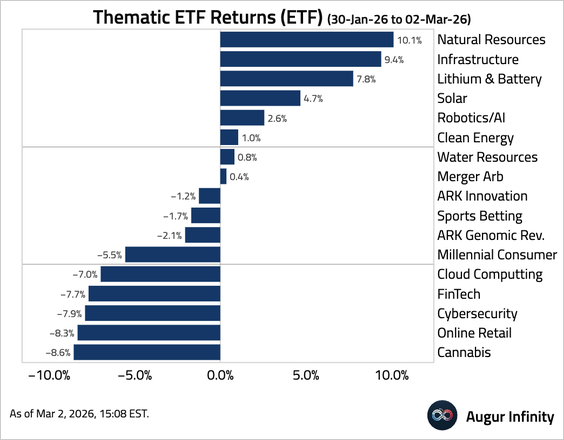
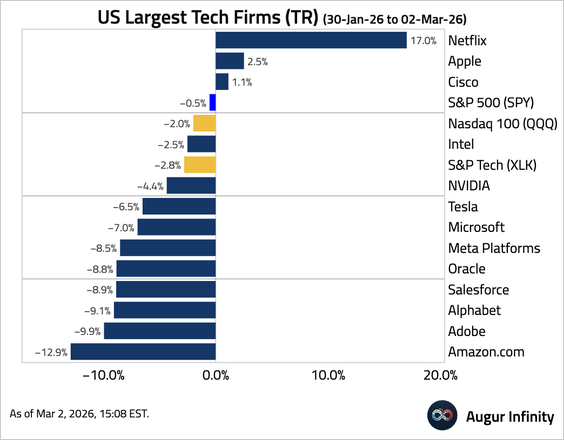
3. Next, we have some performance data for February.
• Sectors:
• Equity factors/styles:
• Thematic ETFs:
• Largest US tech firms:
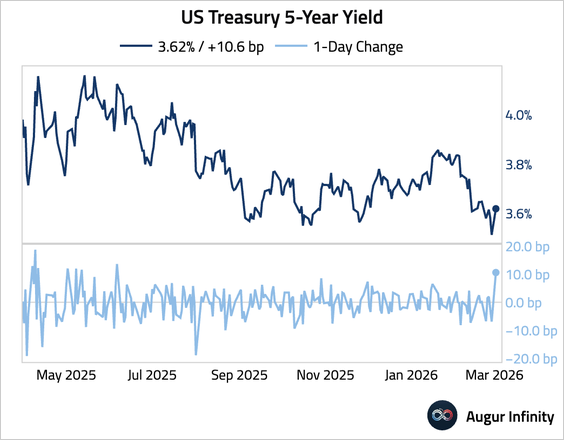
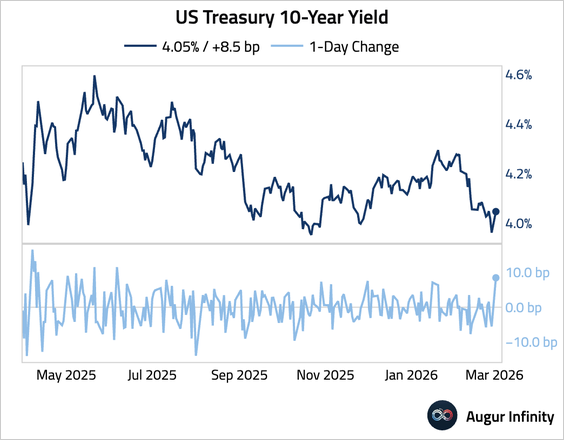
Rates
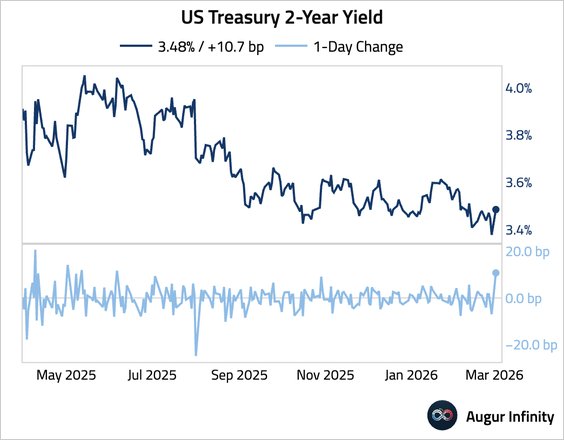
1. Treasury yields rose sharply, driven by higher oil prices and a surge in the ISM Prices index.
• 2-year:
• 5-year:
• 10-year:
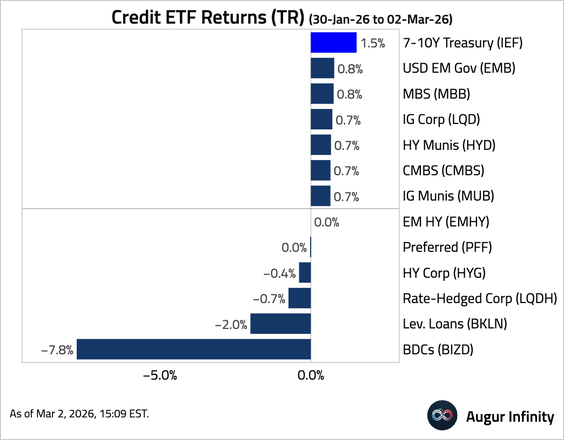
Credit
1. US leveraged loans posted their largest monthly decline since 2022 in February, led by software and services borrowers, as rising concerns over AI disruption pushed more debt into distressed territory and slowed new issuance.
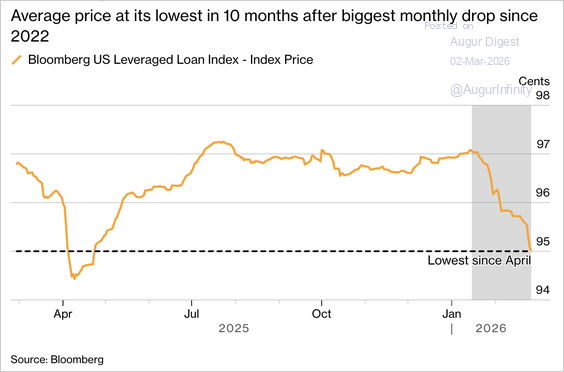
Source: @markets Read full article
2. High-yield bond issuance remained robust last month, with the YTD total at $30 billion, or 43% ahead of last year’s pace, according to PitchBook.
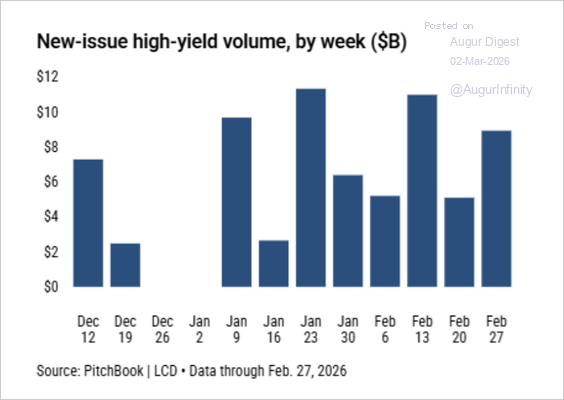
Source: PitchBook
3. Here is the performance data for February.
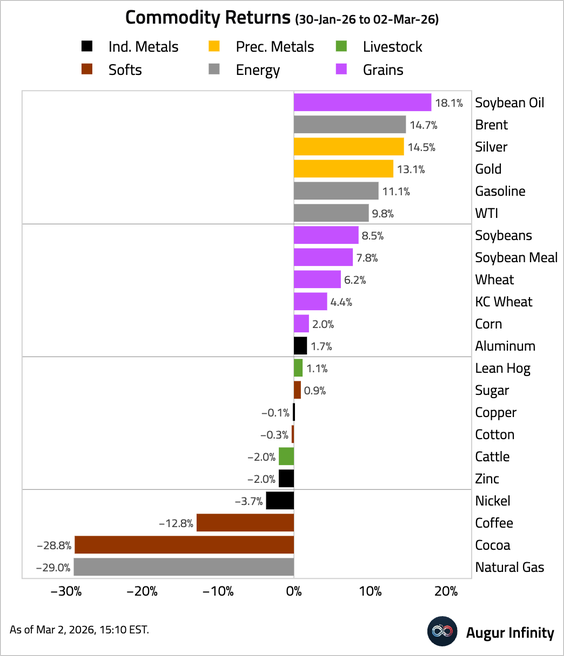
Commodities
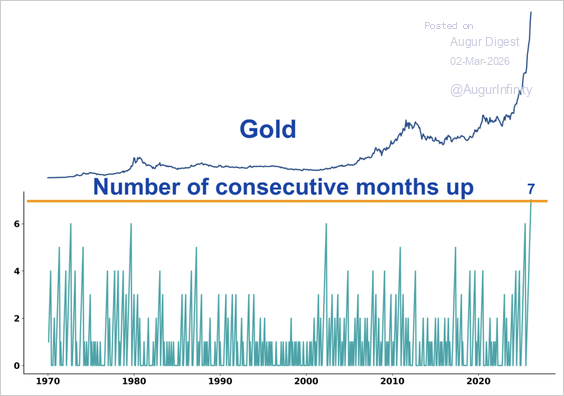
1. Gold has been up for seven consecutive months.
2. Small-cap miners are trending higher relative to their spot commodity prices.
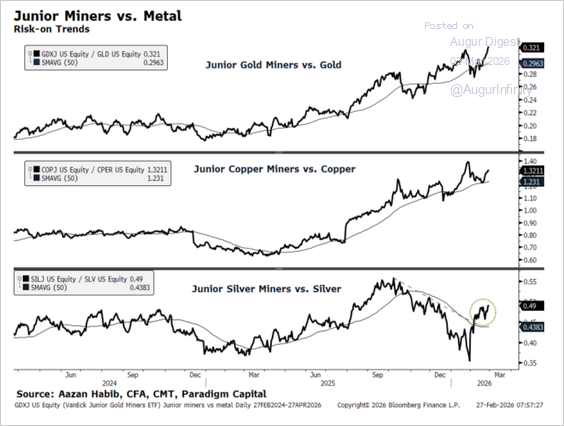
Source: Paradigm Capital
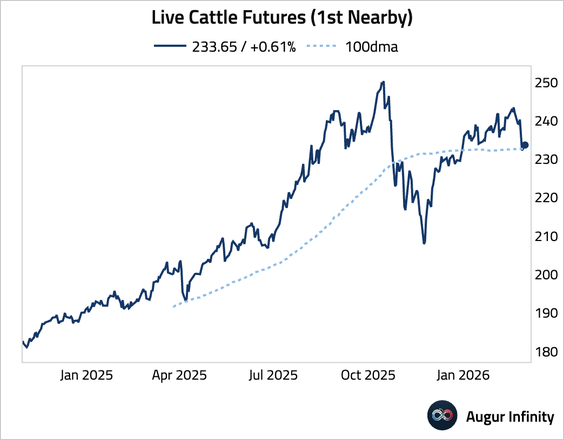
3. Live cattle slumped below its 100-day moving average.
4. Here is a look at the performance data from February.
Alternatives
February was a volatile month for listed PE stocks.
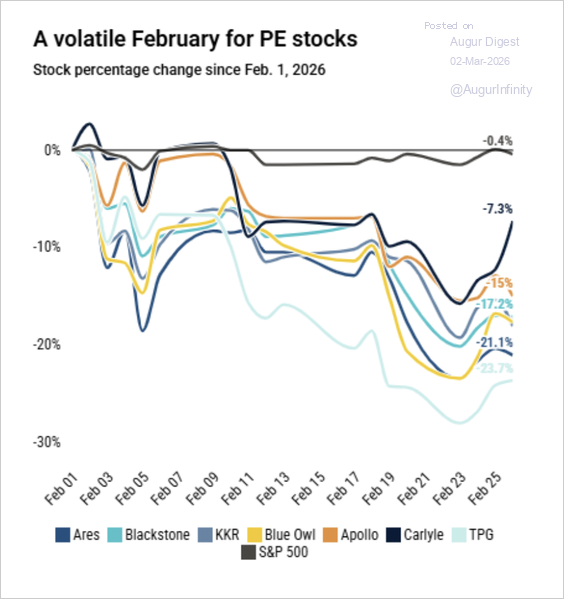
Source: PitchBook