
The United States
1. The NFIB Small Business Optimism index edged down, below consensus and marking the second consecutive monthly decline.

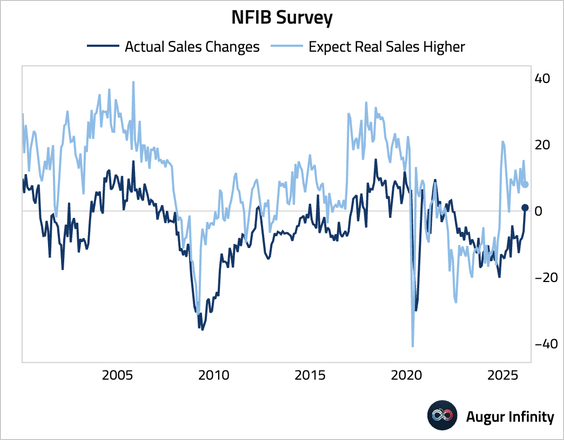
• Sales (picked up but future expectations slumped):
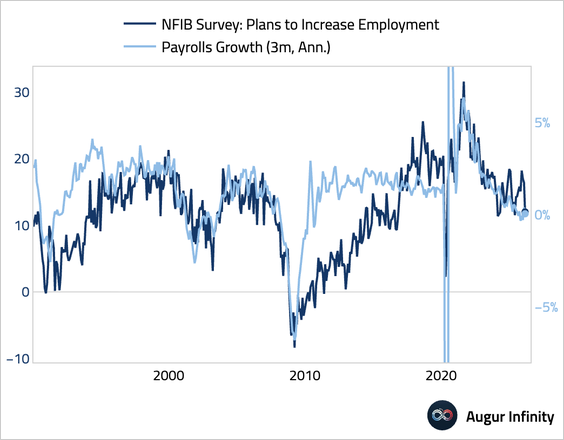
• Hiring intentions (deteriorated sharply):
• Job openings (ticked up but remained near the weakest level since the pandemic):

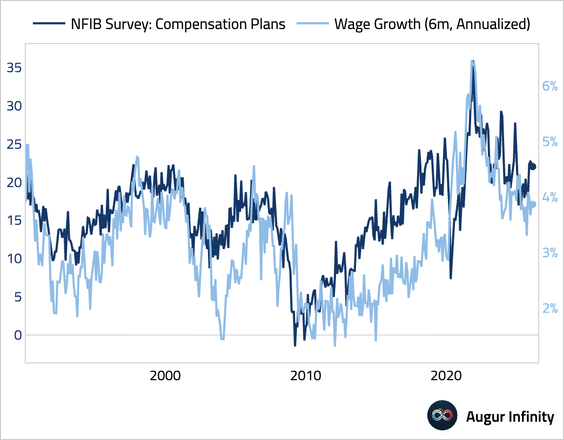
• Wage plans (eased):
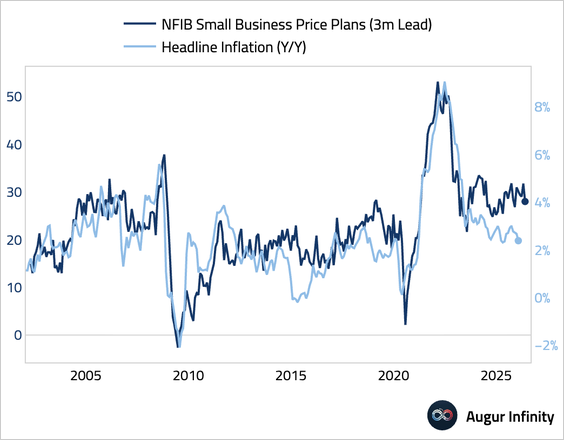
• Price plans (edged down, signaling cooling inflationary pressure):
• Capex intentions (worsened and depressed relative to history):

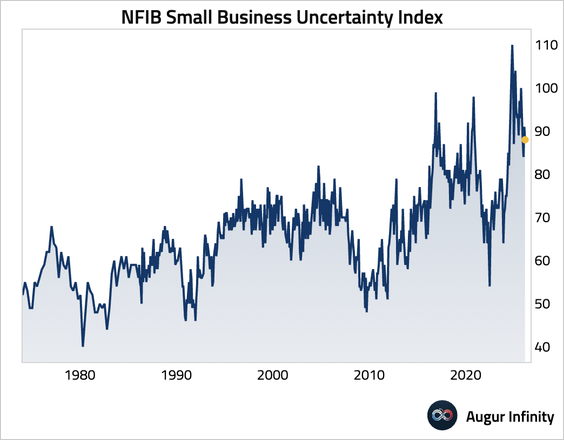
• Uncertainty (declined):
2. The weekly ADP employment reading showed that the private sector added 15,500 jobs per week over the past four weeks, indicating stable job creation.

3. The Redbook index showed same-store sales growth moderated to a still-strong 6.2% year over year.

4. Bank of America’s internal data show total credit and debit card spending per household increased 3.2% year over year in February, the highest growth rate since January 2023.

Source: Bank of America Institute
5. Existing-home sales rose month over month, but activity remains subdued and is likely to improve only gradually as elevated mortgage rates and affordability constraints continue to weigh on demand.
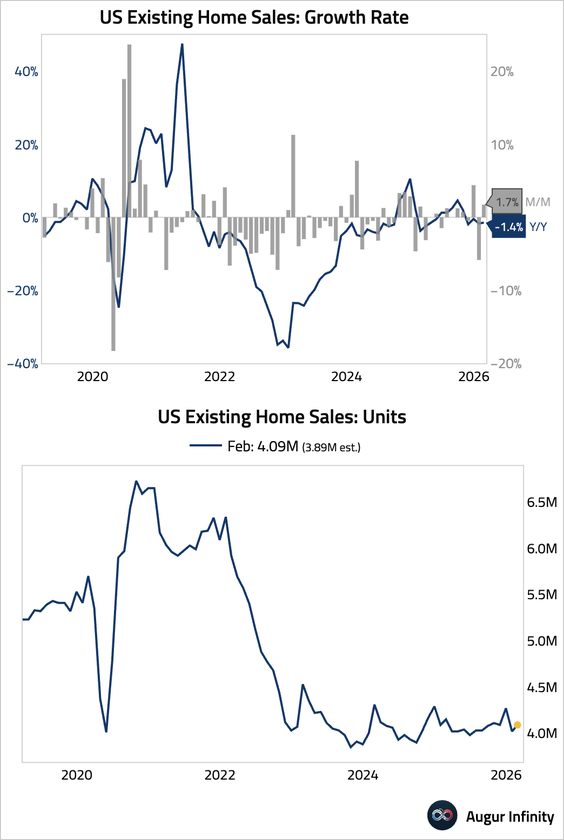
• Inventory increased, though the year-over-year growth rate eased.

6. Let’s look at a few updates on housing.
• Active inventory of single-family homes, as of March 6, was up 6.9% year over year compared to the same week in 2025.

Source: Calculated Risk
• The national housing payment-to-income ratio has declined over the past year.

Source: ICE Read full article
• Average annual property insurance payments rose to an all-time high.

Subscribe to read the rest.
Become a subscriber of Augur Digest Premium to see all 72 charts today.
Upgrade