- Headlines
- Charts of the Day
- United States
- Europe
- Asia-Pacific
- China
- Emerging Markets ex China
- Equities
- Fixed Income
- Commodities
- FX
Headlines
- Geopolitical tensions escalated after the United States conducted military strikes on three Iranian nuclear facilities, prompting a retaliatory missile attack by Iran on a U.S. military base in Qatar.
- Following the US strikes, Iran’s parliament approved a measure to close the Strait of Hormuz, with a final decision pending approval from the country's Supreme National Security Council.
- The United States and the European Union are reportedly close to finalizing an agreement on several non-tariff trade issues.
- In domestic policy, the Senate parliamentarian rejected a proposal to include food aid reductions in a key reconciliation bill.
Charts of the Day
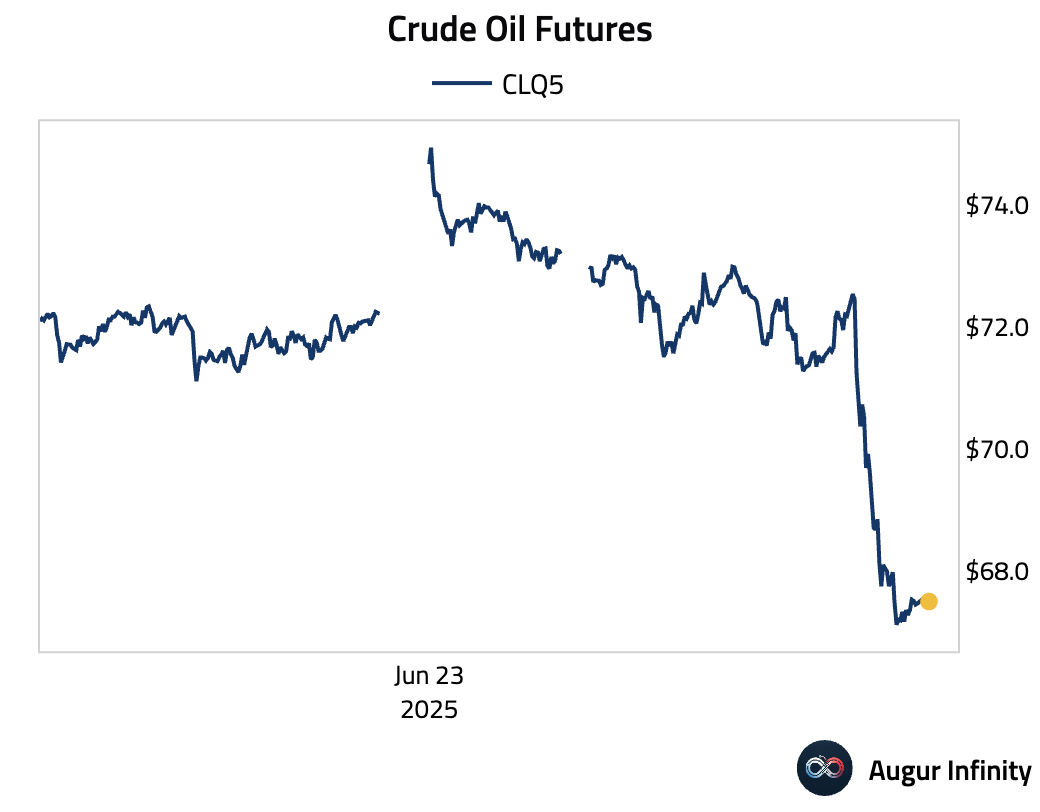
- Oil markets initially jumped after the surprise attack against Iranian nuclear sites, but ended the day down 7% as traders bet the crude supply wouldn't be materially disrupted.
- The probability of Iran closing the Strait of Hormuz before July initially jumped to over 50%, but has since fallen to around just 10%.
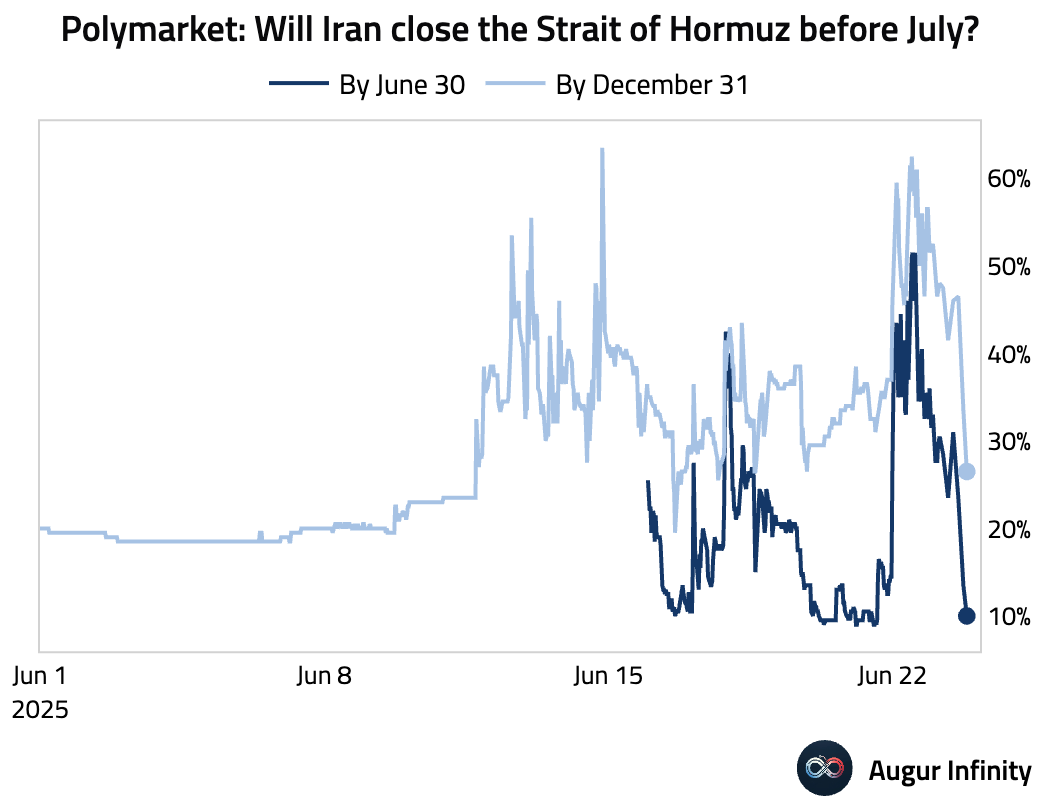
Source: Polymarket
- For the first time in over a month, Drewry's World Container Index declined, mainly due to the low demand for US-bound cargo.
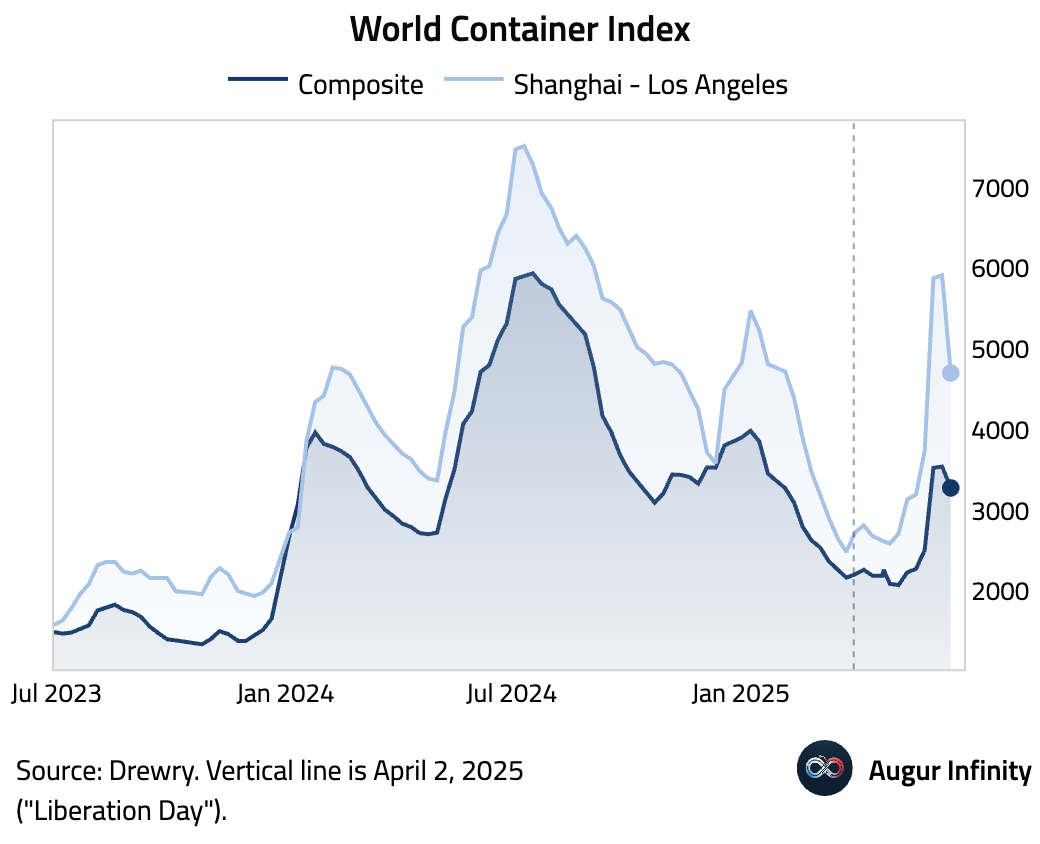
Source: Drewry World Container Index
United States
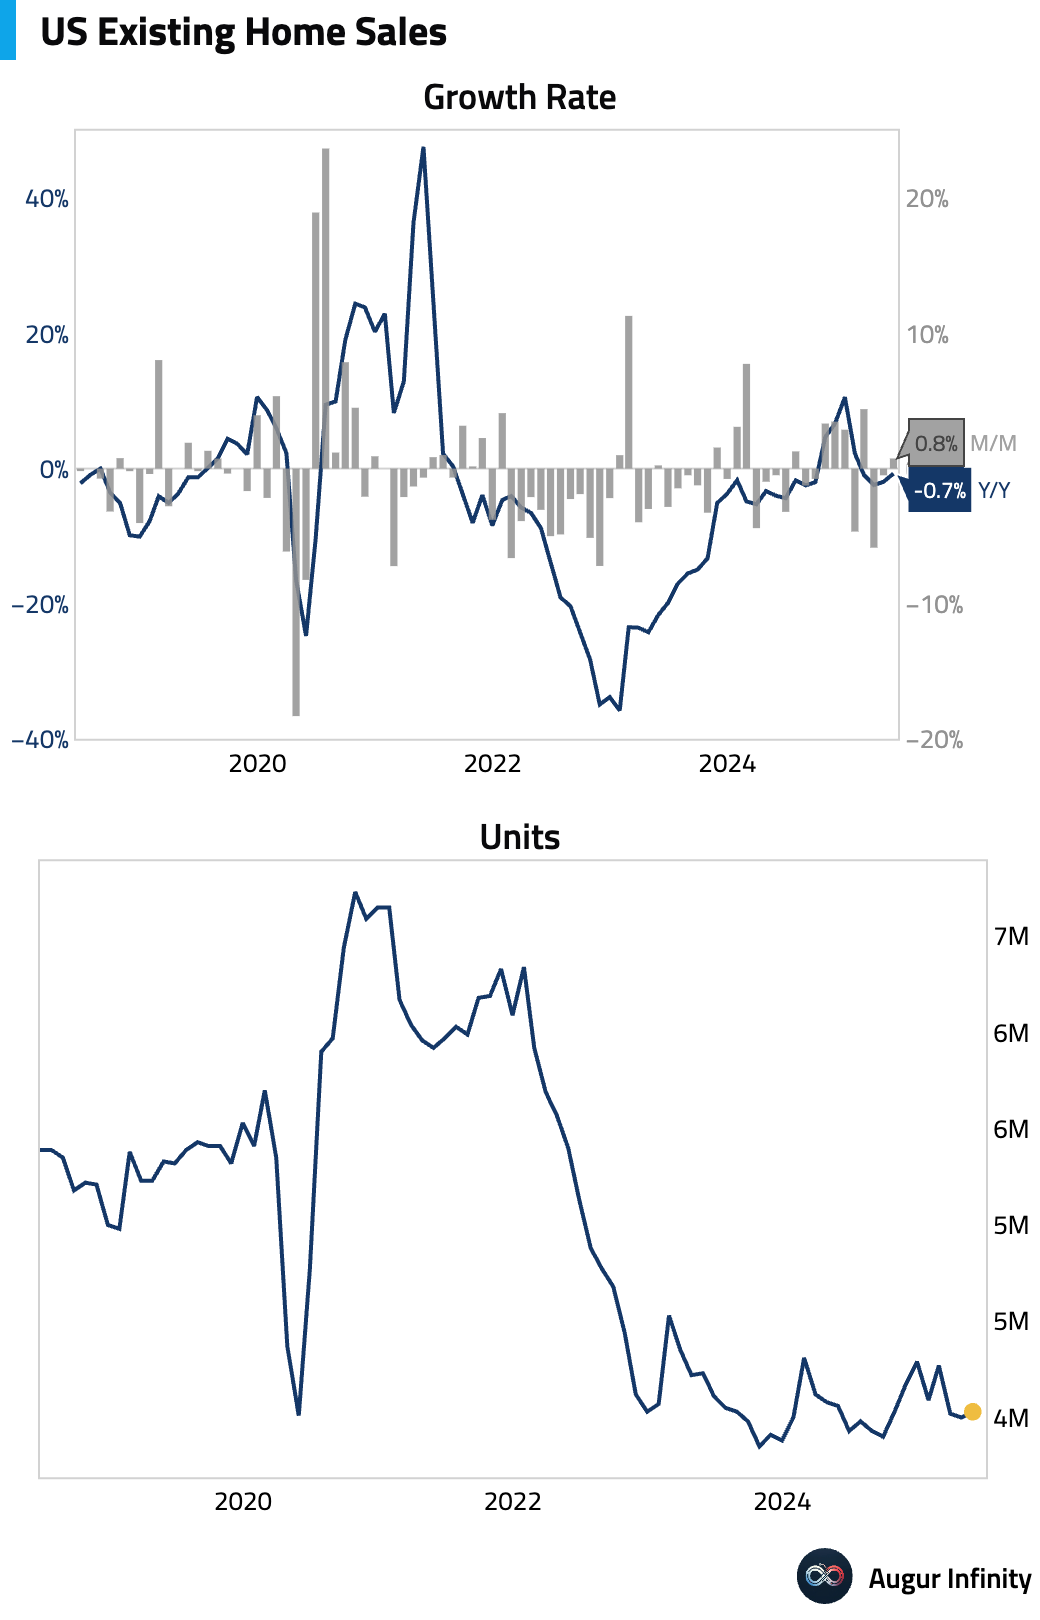
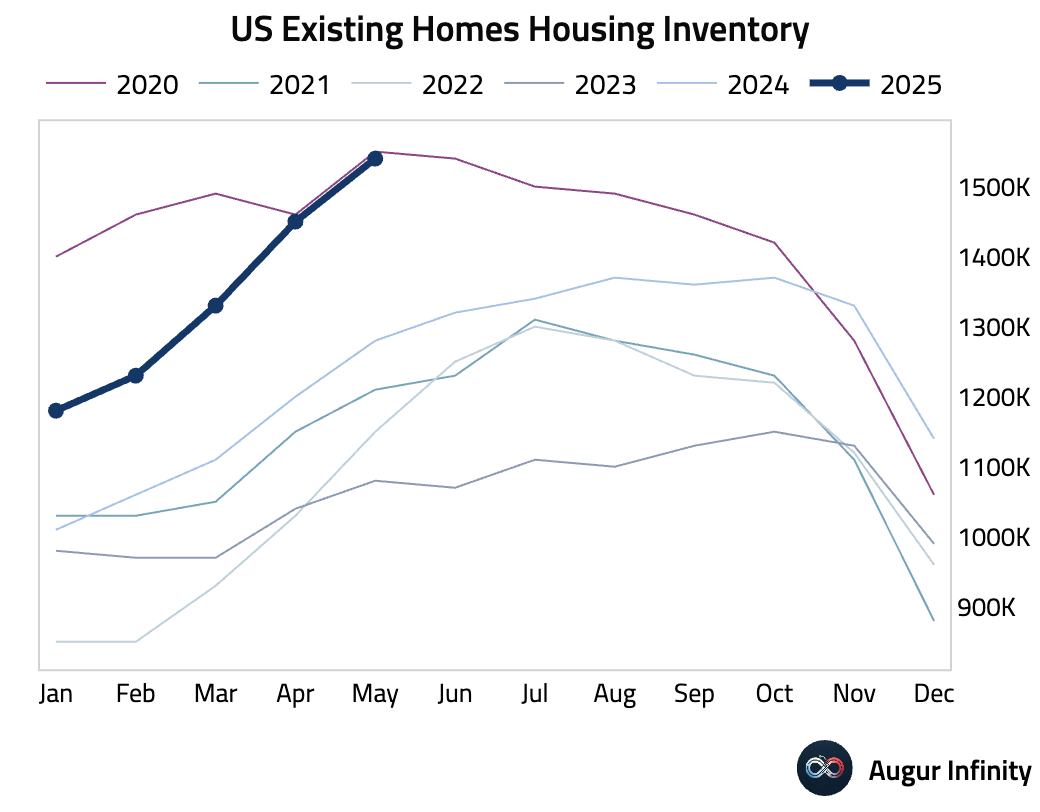
- U.S. existing home sales unexpectedly rose 0.8% M/M in May to a 4.03 million annualized pace, beating consensus for a 1.3% decline. The increase comes despite persistently high mortgage rates, with the supply of homes for sale rising to its highest level since late 2022.
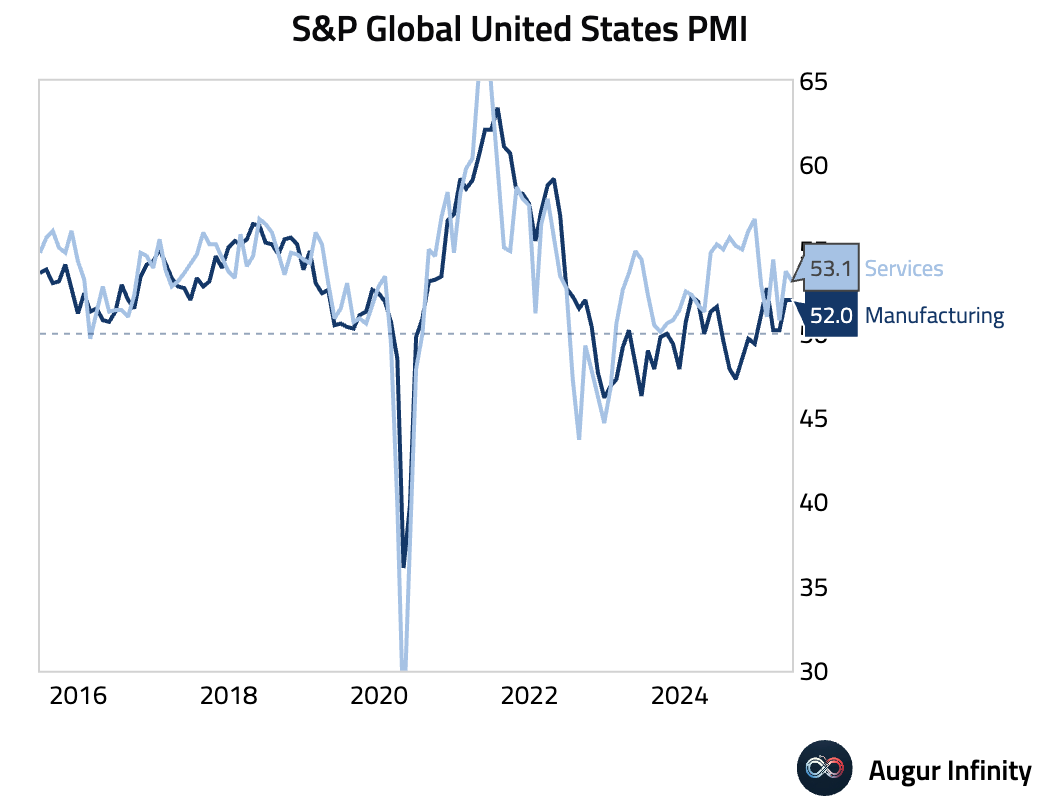
- The flash S&P Global PMI report for June showed slightly slower but still solid growth. The Manufacturing PMI held at a 15-month high of 52.0, while Services cooled to 53.1. Price pressures jumped sharply, with manufacturers widely blaming tariffs for the fastest rise in costs since July 2022. The manufacturing strength may be driven by tariff-related inventory building rather than pure demand.
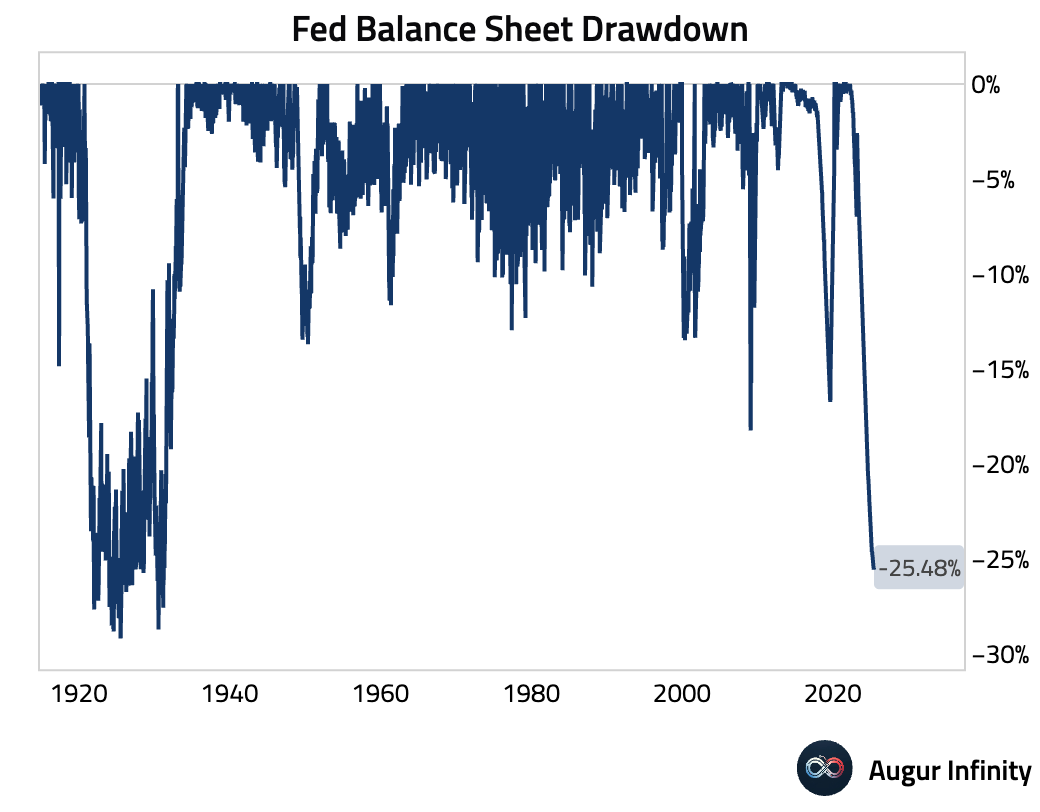
- The Federal Reserve’s balance sheet held steady at $6.68 trillion last week. The pace of quantitative tightening remains consistent with the central bank’s previously announced plans.
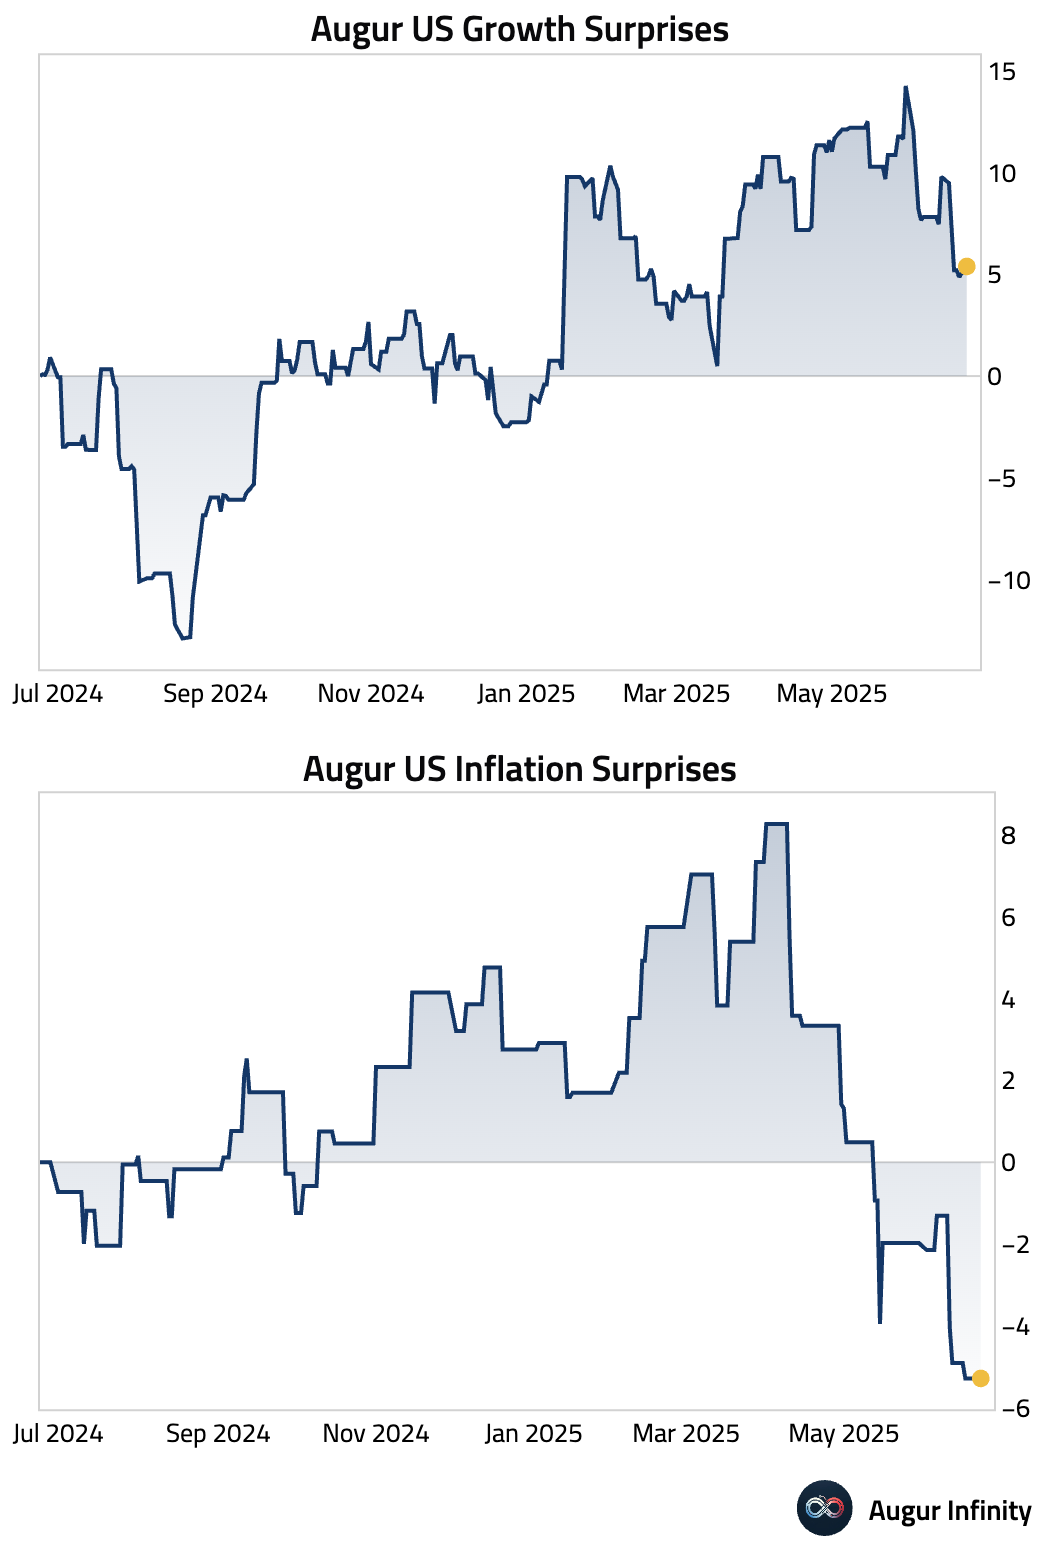
- Both growth and inflation surprises have surprised to the downside in the US over the past month.
Europe
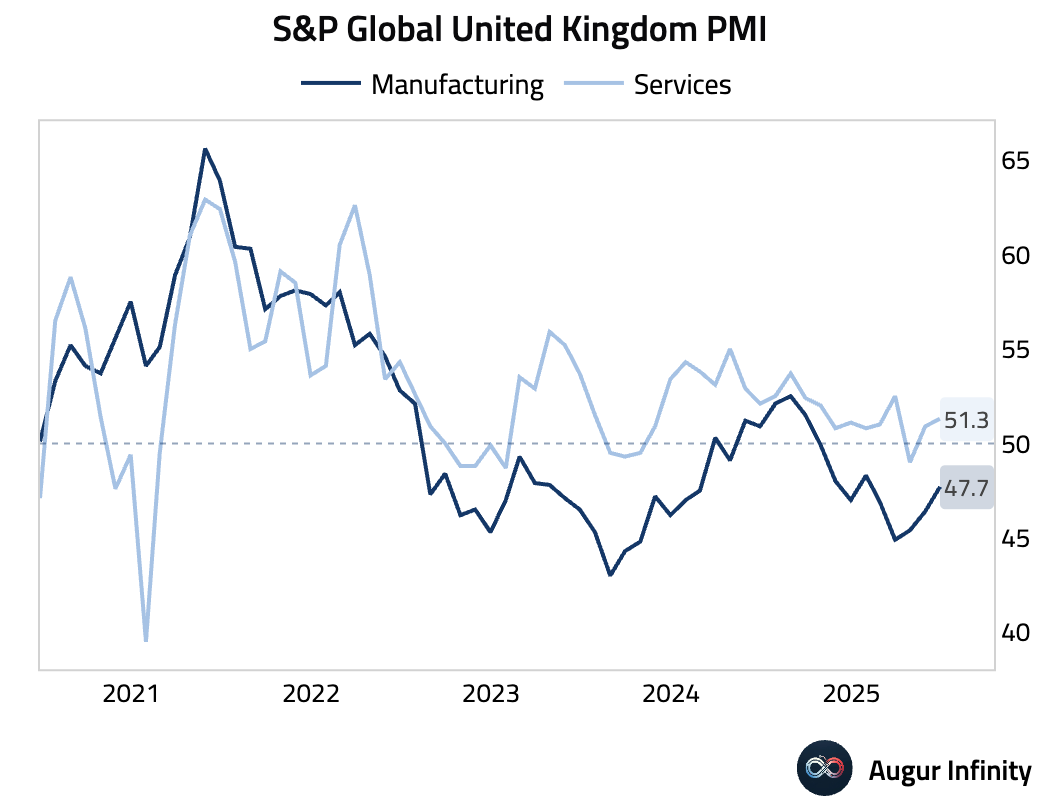
- The U.K.’s flash Composite PMI for June climbed to a three-month high of 50.7, as a solid reading in the services sector (51.3) offset continued weakness in manufacturing (47.7). Slowing price inflation and a ninth consecutive monthly decline in employment could clear the path for the Bank of England to cut interest rates in August.
- The Eurozone’s flash Manufacturing PMI held steady at 49.4 in June. New manufacturing orders stabilized, which ended a three-year streak of contraction, suggesting a potential bottoming in industrial demand. Flash Services PMI for June was 50.0, matching estimates and up from 49.7 in May. The reading signals a stabilization in the services sector after a brief dip into contraction.
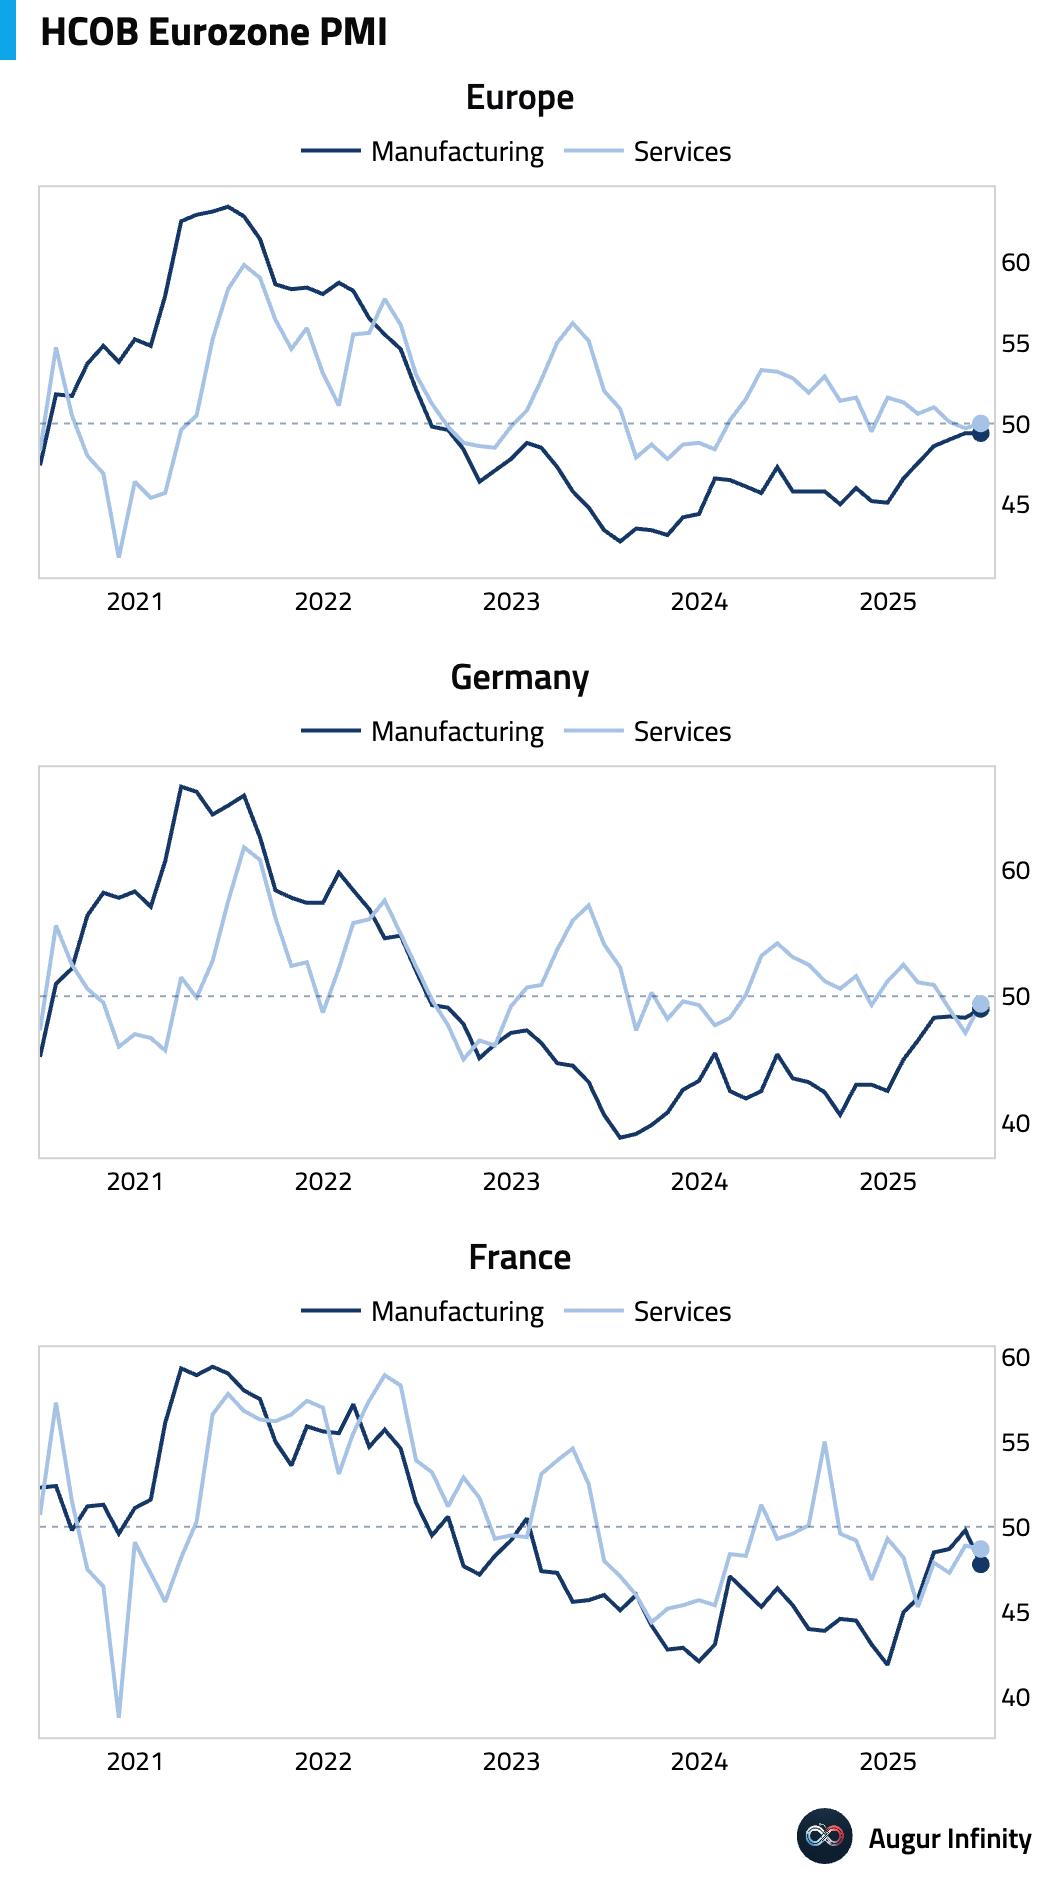
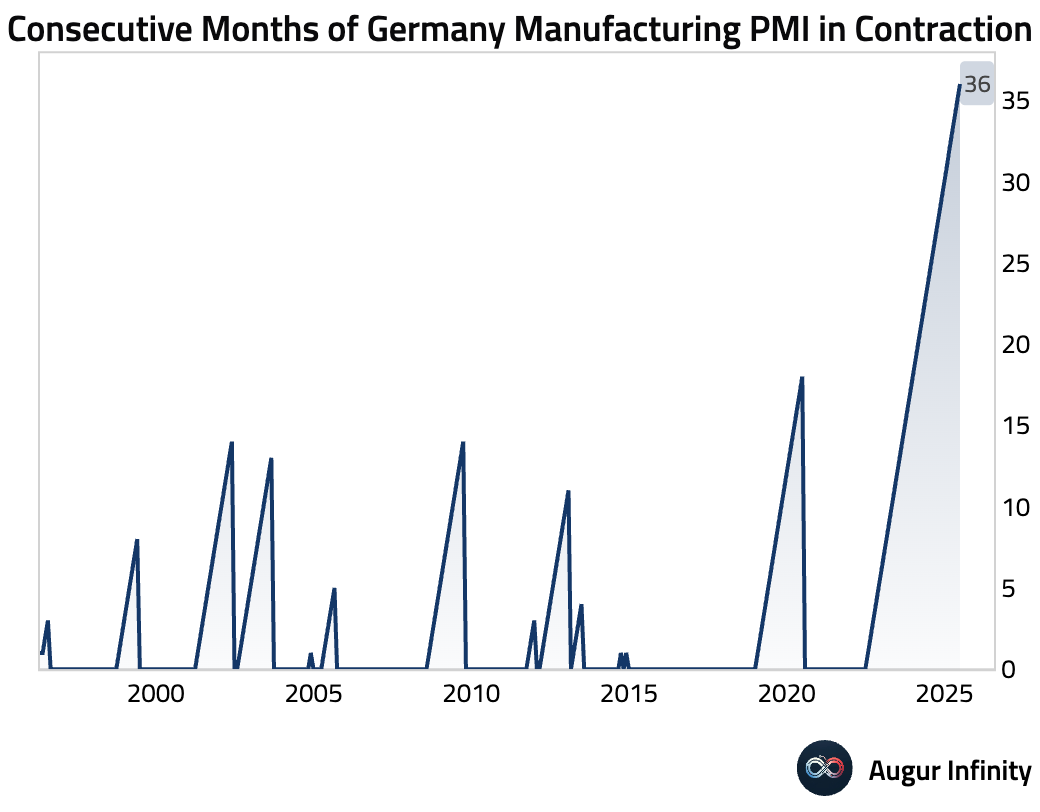
- Germany’s flash Manufacturing PMI for June rose to a three-month high of 49.0, in line with consensus. This is the 36th consecutive month of contractionary reading.
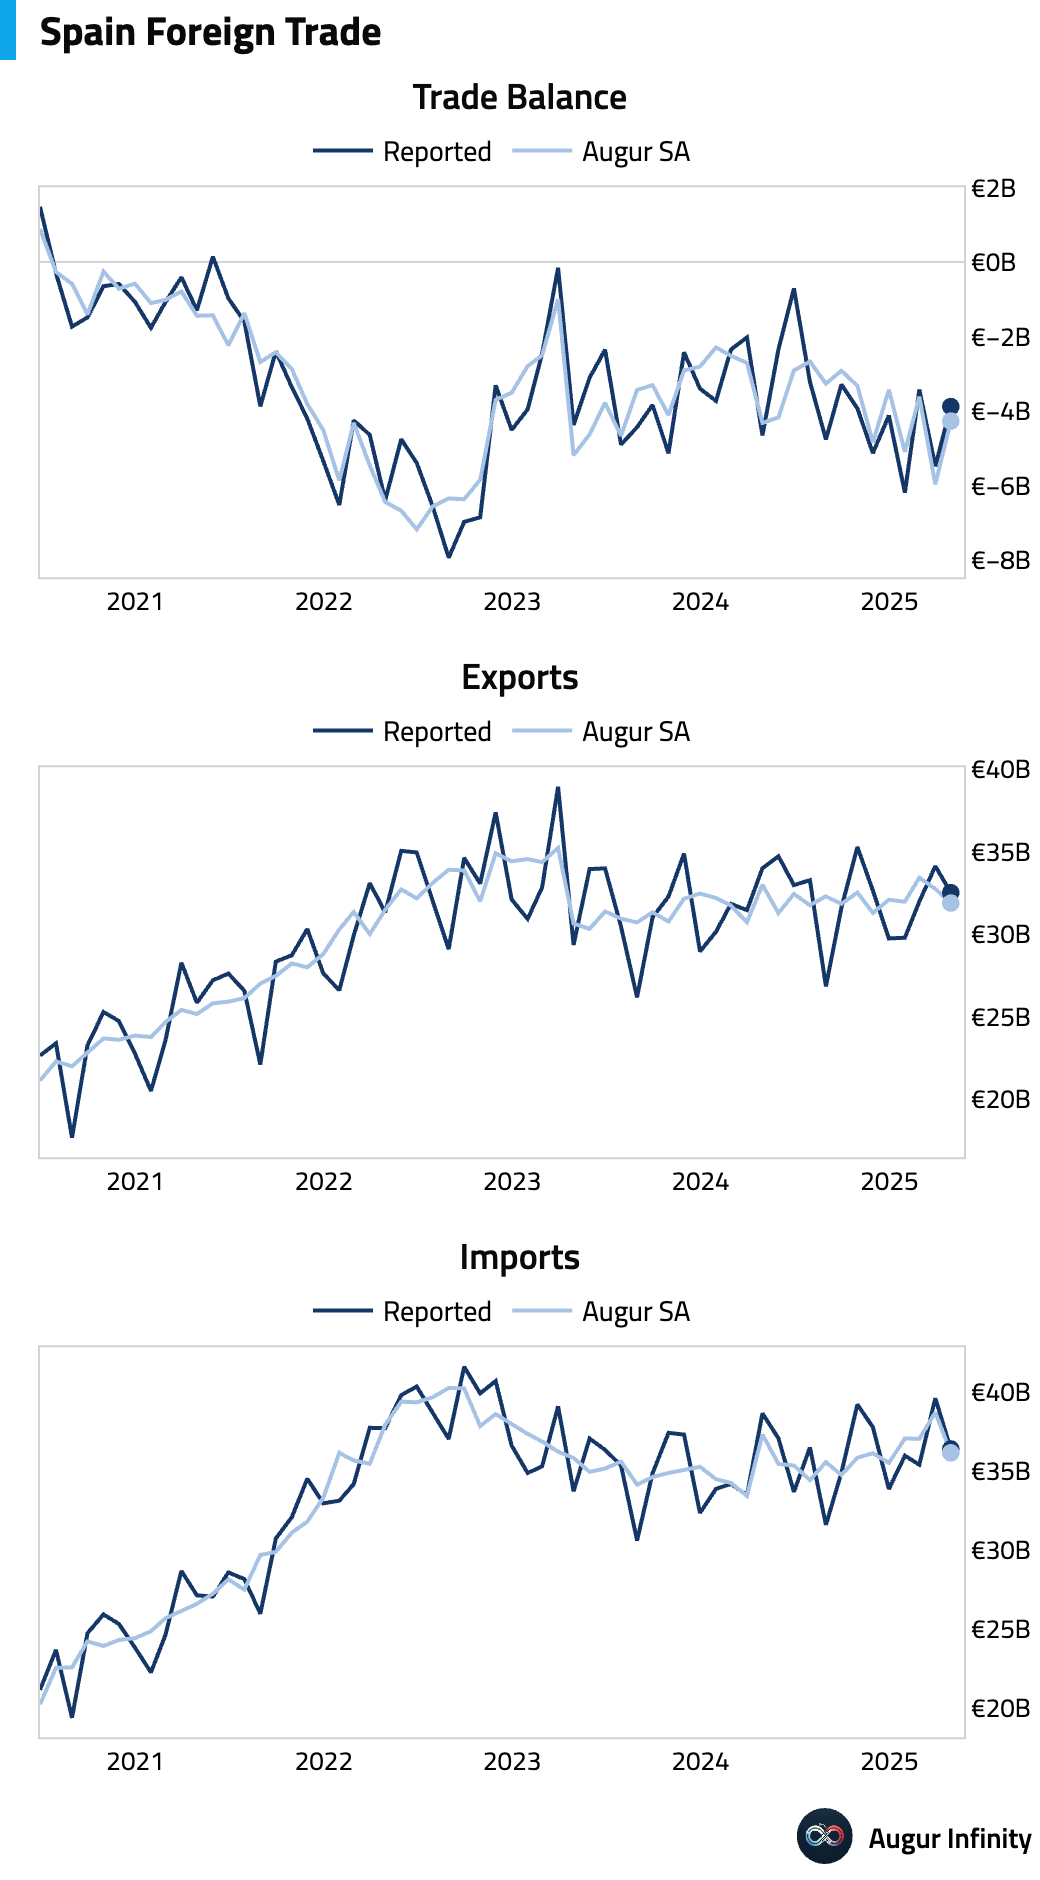
- Spain’s trade deficit narrowed to €3.88 billion in April from €5.48 billion in the prior month, reflecting an improvement in the country's external balance.
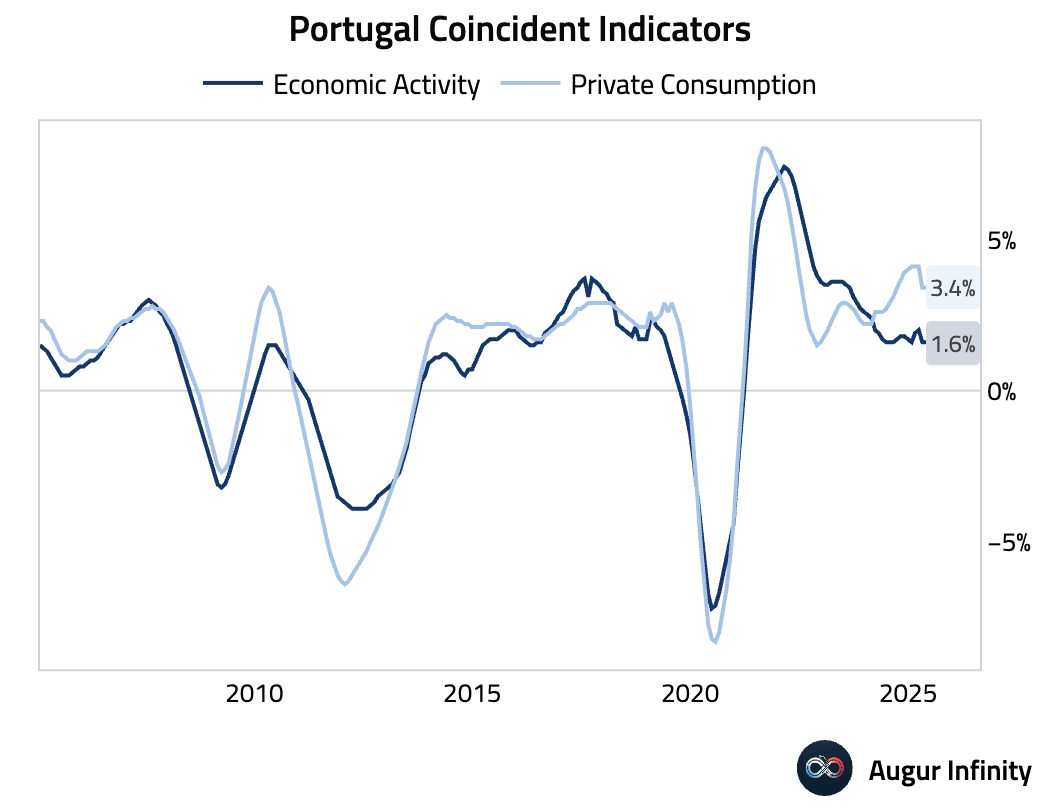
- In Portugal, the economic activity coincident indicator was unchanged at 1.6% Y/Y in May, while the private consumption indicator edged down to 3.4% from 3.5%.
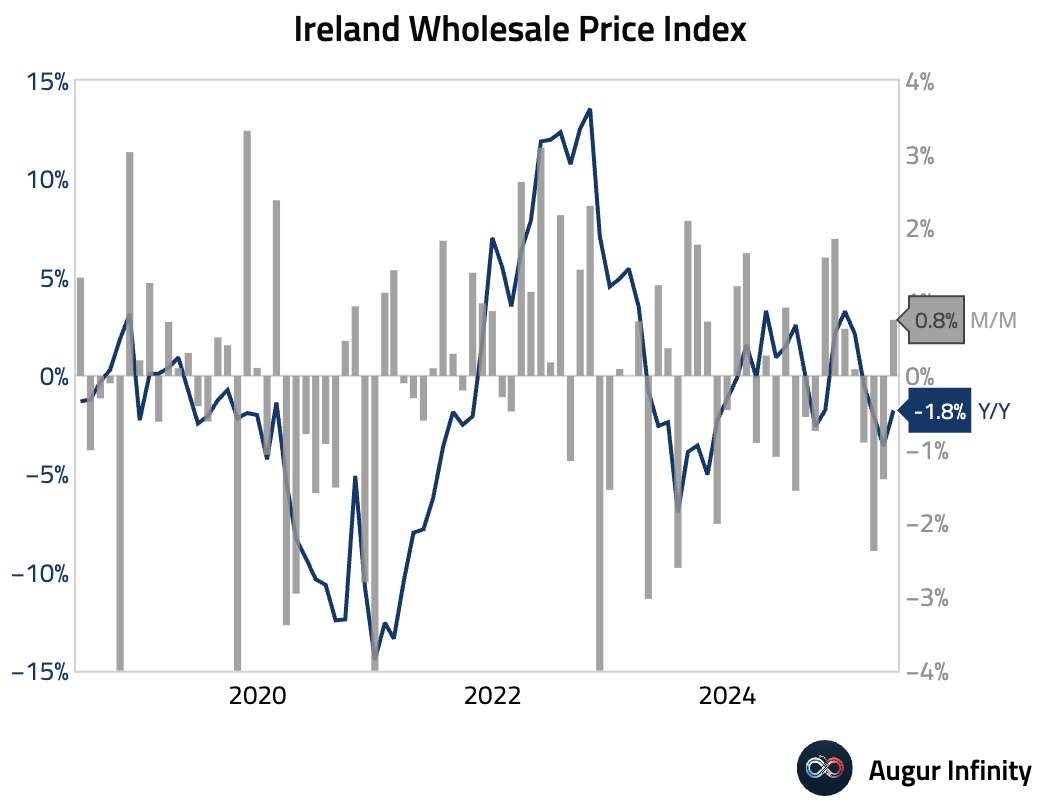
- Ireland’s wholesale prices rose 0.8% M/M in May, rebounding from a 1.4% drop in April. The annual rate remained deflationary at -1.8% Y/Y, though this was an improvement from the prior month's -3.6% reading.
Asia-Pacific
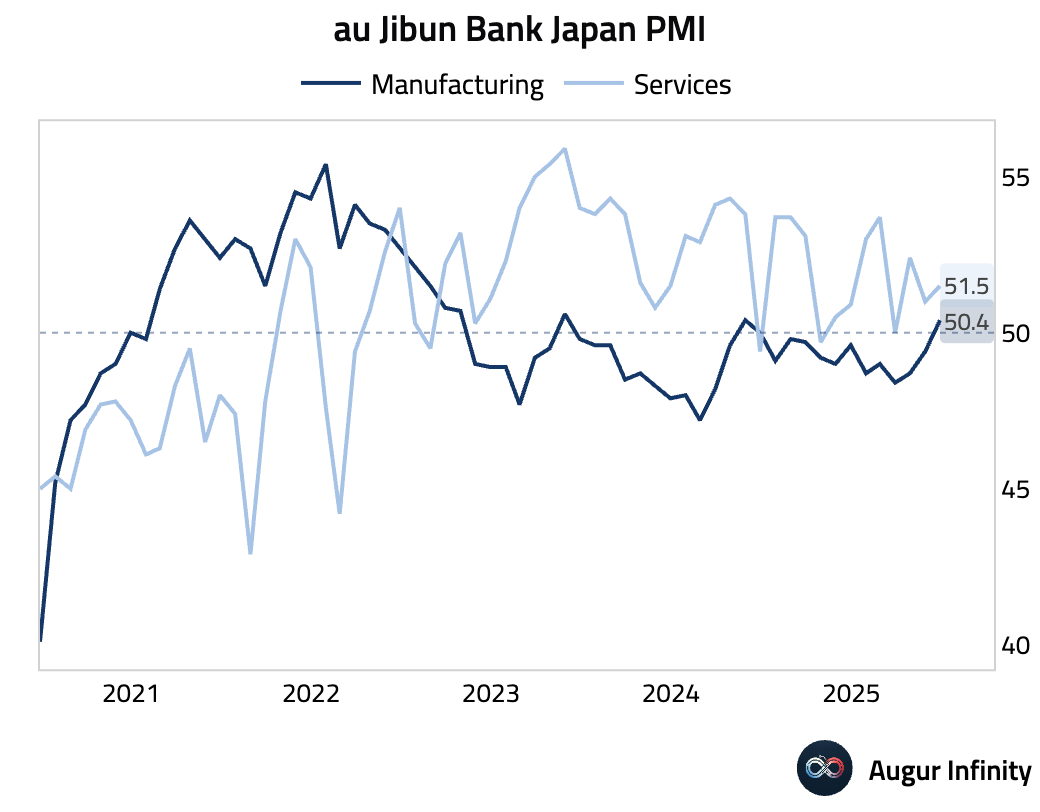
- Japan’s Jibun Bank flash Manufacturing PMI for June rose to 50.4, returning to expansionary territory and beating the 49.5 consensus, while the Services PMI increased to 51.5. The manufacturing strength may be misleading, however, driven by firms stockpiling inventory ahead of a July 9 U.S. tariff deadline, as underlying new orders remained weak.
- Although the Bank of Japan has lifted its policy rate off the zero bound, Japan's real short-term interest rate remains deeply negative.
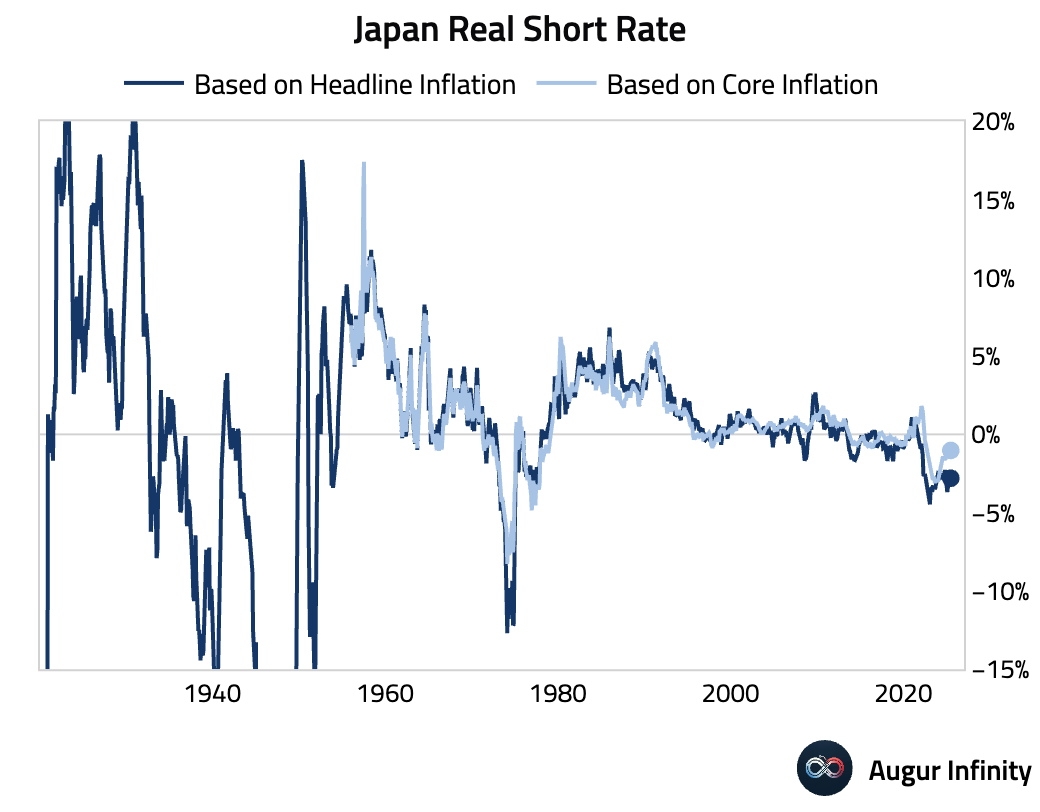
Source: @DannyDayan5
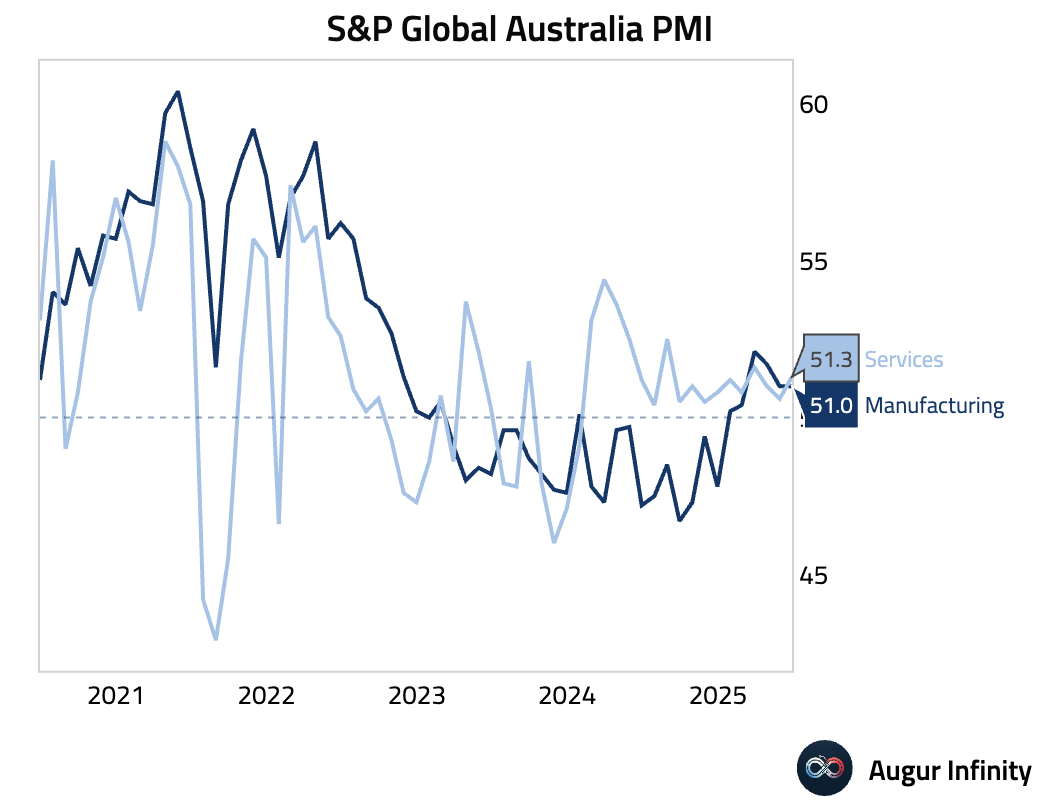
- Australia’s flash PMIs for June showed the Composite index at a three-month high of 51.2, driven by services (51.3) while manufacturing held steady (51.0). However, the data revealed a sharp contraction in new export orders, the fastest in nearly a year, which firms linked to U.S. trade policy. Softer output price inflation supports the case for RBA rate cuts.
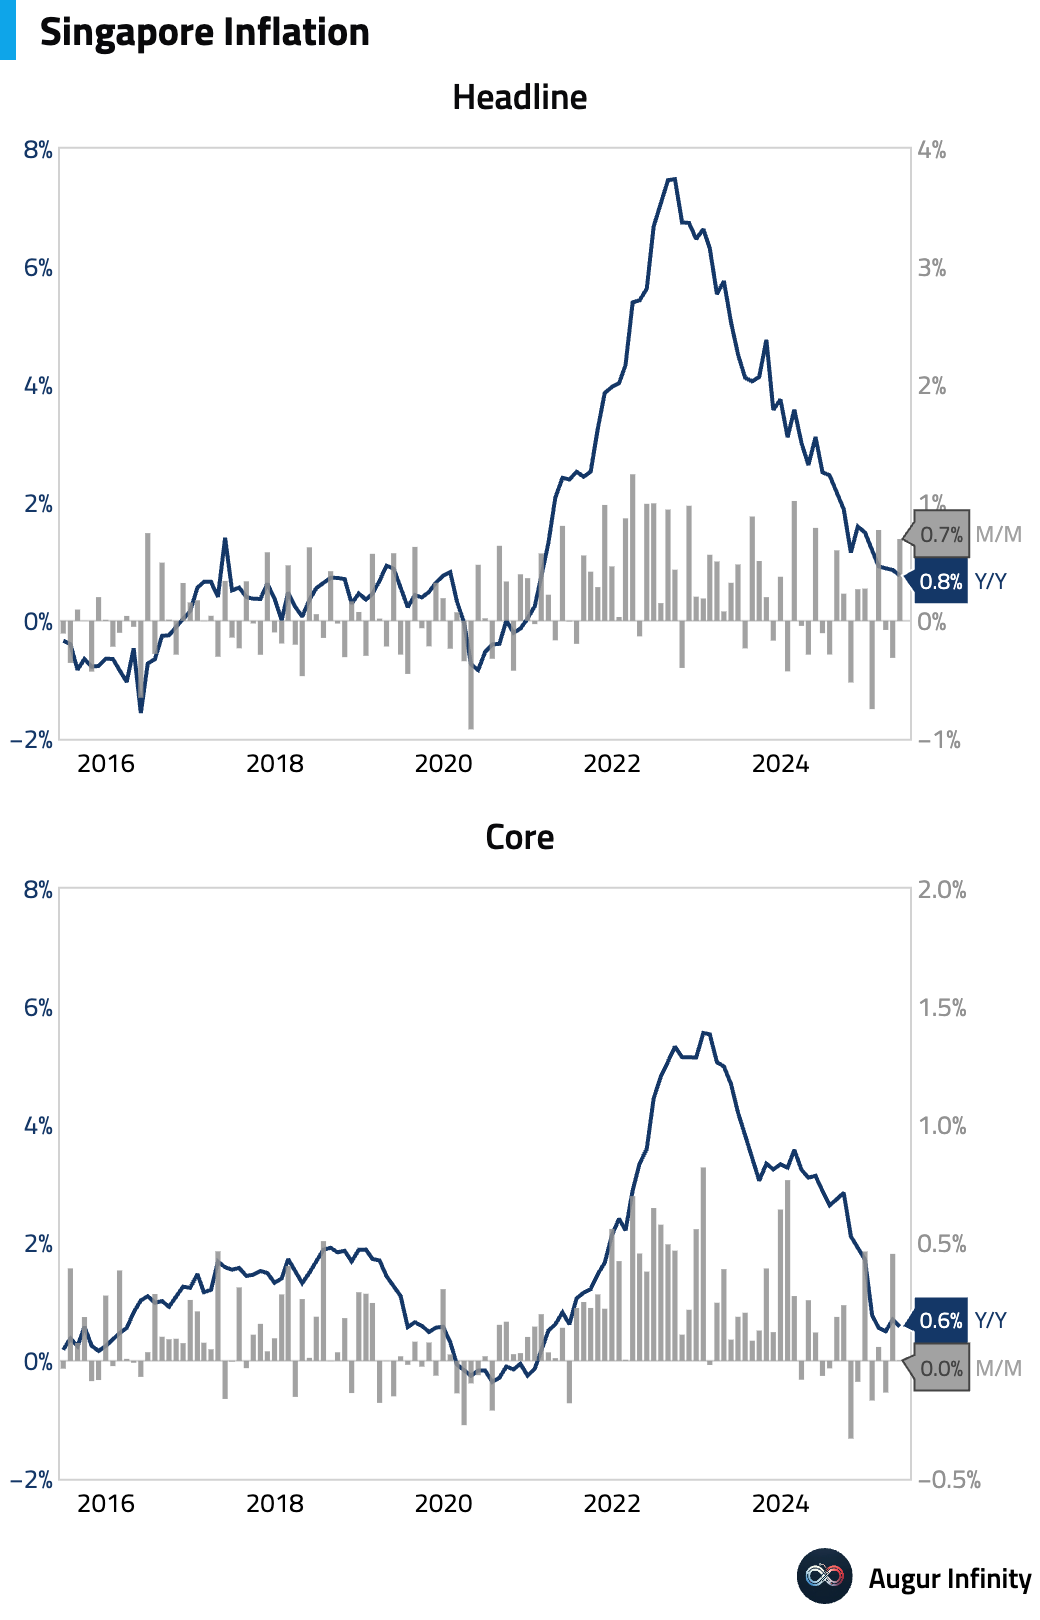
- Singapore’s inflation rate eased in May, with the headline CPI falling to 0.8% Y/Y from 0.9% and the core rate declining to 0.6% Y/Y from 0.7%. On a monthly basis, prices rose 0.7%, reversing a 0.3% drop in April.
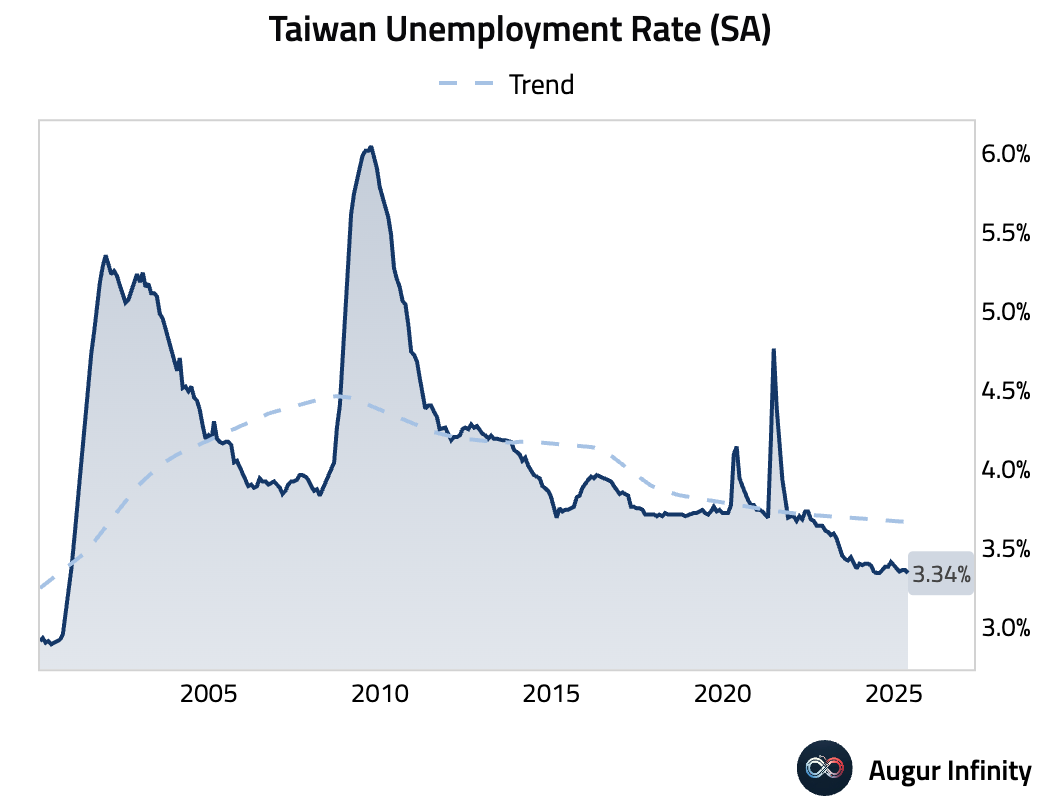
- Taiwan’s unemployment rate edged down to 3.34% in May from 3.36% in April, marking its lowest level since November 2000.
China
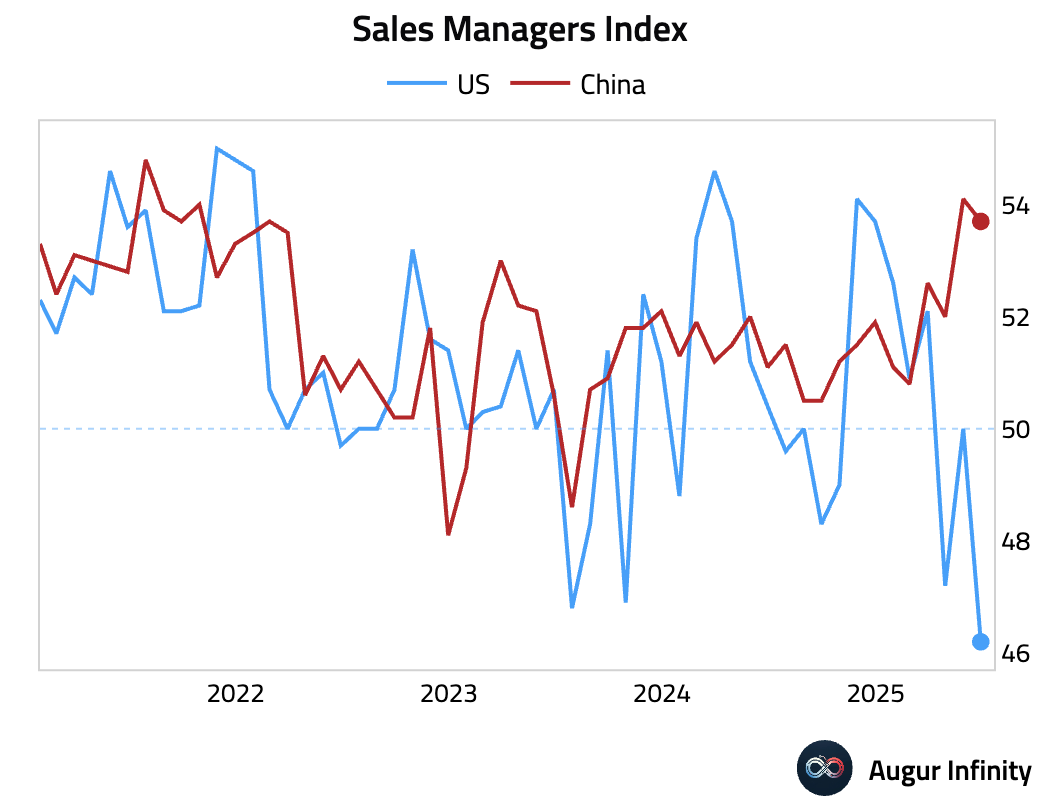
- China's Sales Manager Business Confidence Index held up in June, defying concerns over U.S. tariffs. This contrasts with a similar index in the U.S. which plunged during the same period.
Source: World Economics
Emerging Markets ex China
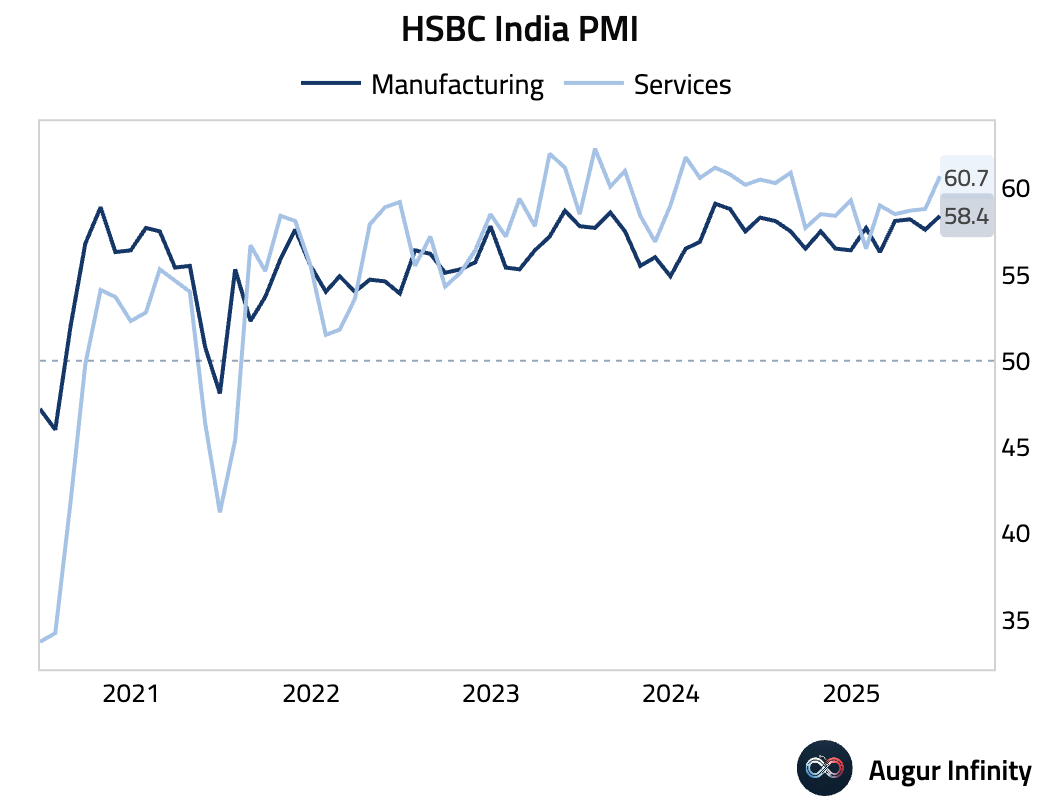
- India’s flash PMIs for June showed a robust expansion, with the Composite index surging to a 14-month high of 61.0. The strength was broad-based, with Manufacturing at 58.4 and Services at 60.7. The upturn was fueled by the strongest increase in new export orders since 2014, while input cost inflation softened to a 10-month low.
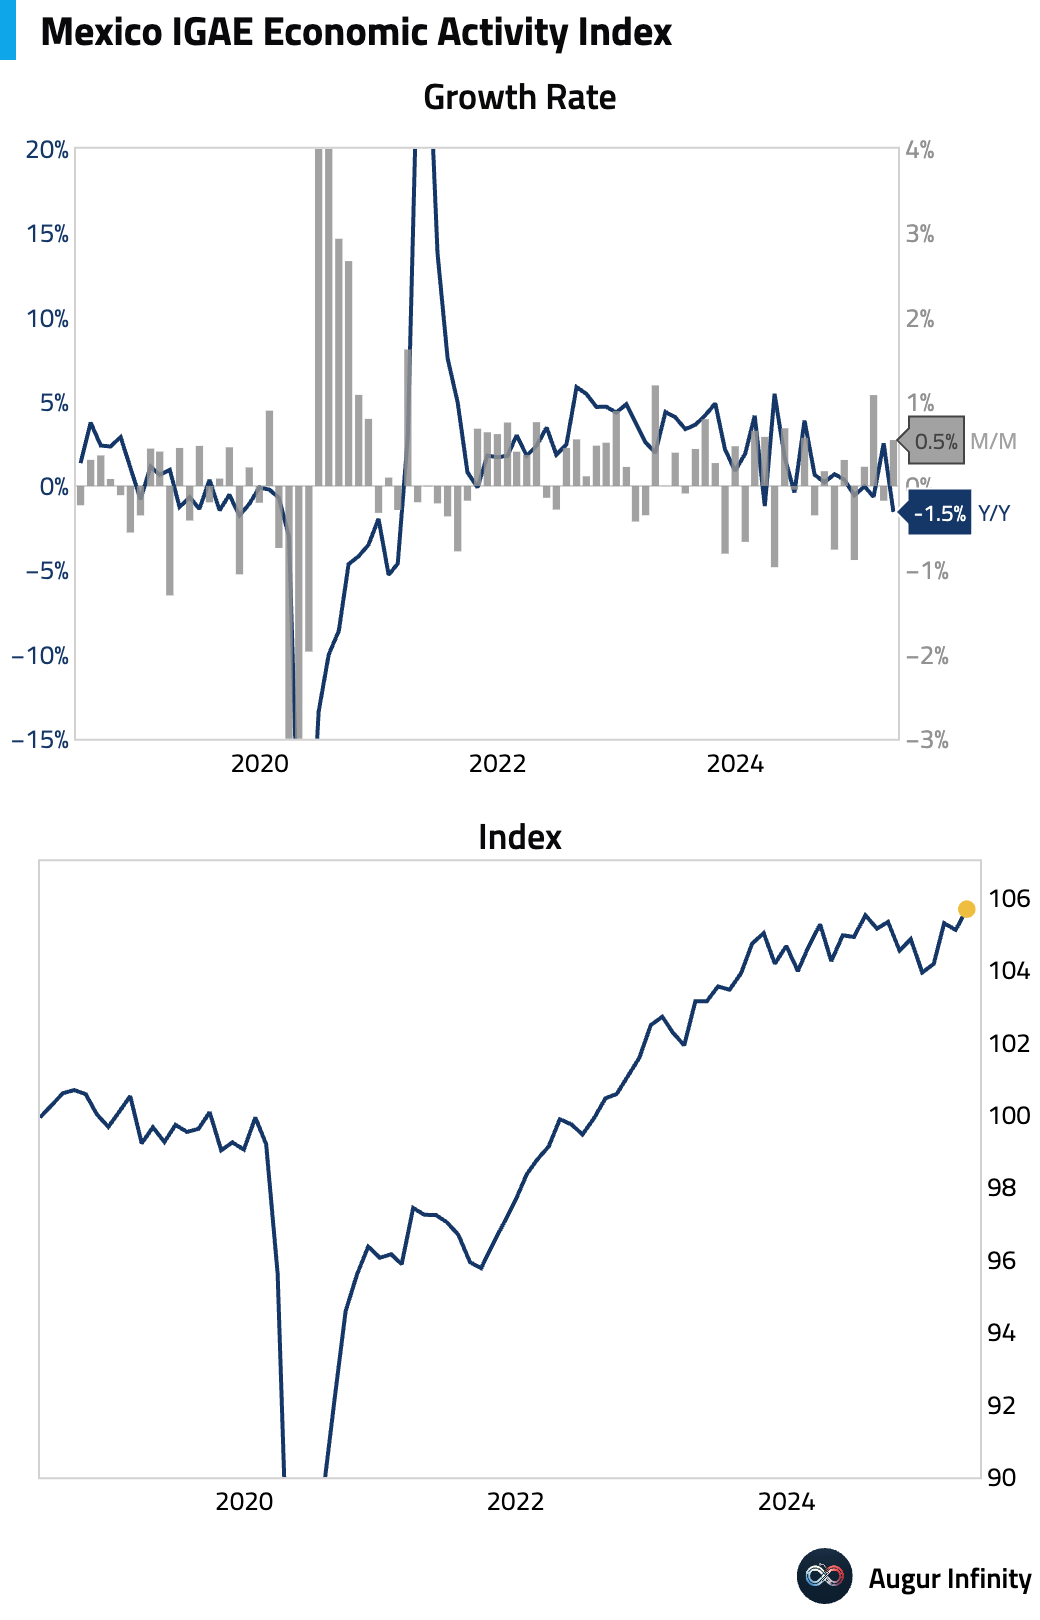
- Mexico’s economic activity index (IGAE) rebounded by 0.5% M/M in April, ahead of the 0.2% consensus, following a 0.2% decline in March. However, the year-over-year figure showed a 1.5% contraction.
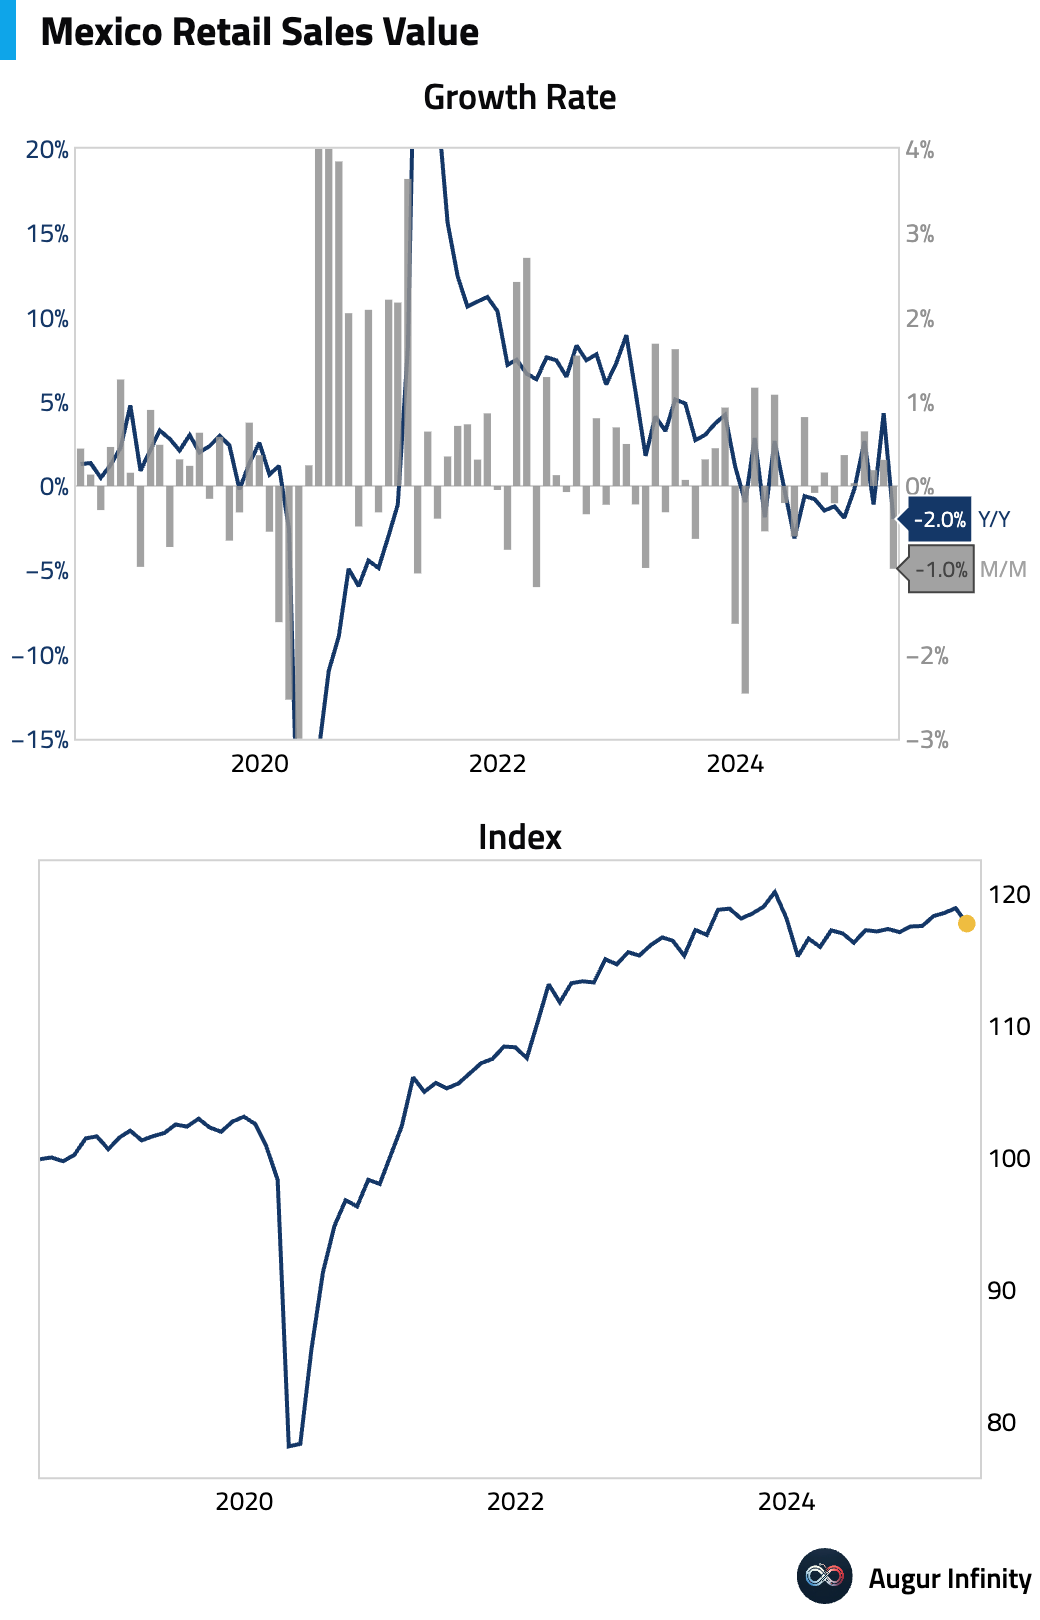
- Mexican retail sales fell 1.0% M/M in April, a larger decline than the previous month's 0.5% gain. Annually, sales contracted by 2.0%.
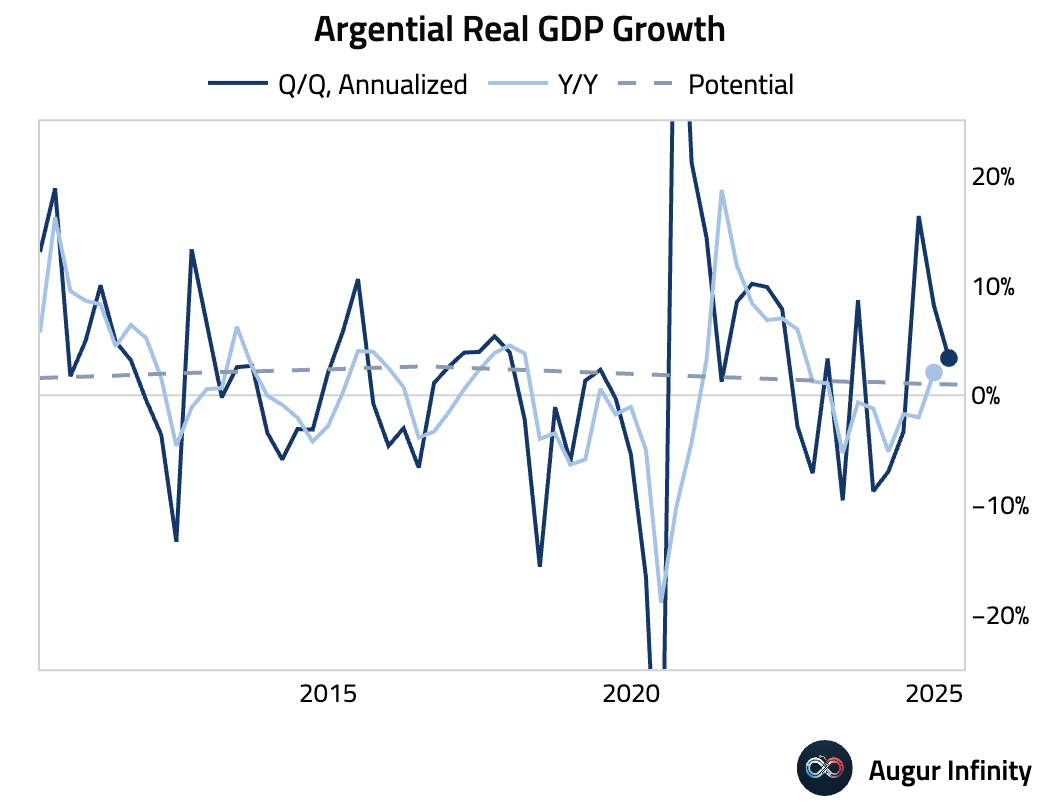
- Argentina’s GDP grew 0.8% Q/Q in the first quarter of 2025, a slowdown from the 1.1% expansion in the prior quarter. The year-over-year growth of 5.8% missed the consensus forecast of 6.1%.
- Poland reported a series of economic data for May. Industrial production rose 3.9% Y/Y, beating expectations. Annual wage growth slowed to 8.4% from 9.3%, while employment growth remained at -0.8% Y/Y. Producer prices fell 1.5% Y/Y.
- Indonesia’s M2 money supply growth slowed to 4.9% Y/Y in May from 5.2% in April.
Equities
- U.S. equities gained, with the S&P 500 up 1.0% and the Nasdaq climbing 0.9%. Elsewhere, South Korean equities rose 1.3%, marking a third consecutive day of gains. In Latin America, Brazilian equities were flat but recorded a fourth straight day of losses, while Mexican equities fell 0.3%.
Fixed Income
- U.S. Treasury yields fell across the curve, led by the belly. The 2-year yield decreased by 5.4 bps to 4.14%, its fourth consecutive daily decline, while the 10-year yield fell 3.5 bps to 4.16%.
Commodities
- Oil prices experienced significant volatility amid rising geopolitical tensions in the Middle East. After initially surging on news of U.S. strikes on Iran, Brent crude reversed course and fell sharply as markets assessed that a major supply disruption through the Strait of Hormuz was unlikely in the immediate future.
FX
- The U.S. dollar was mixed against its G10 peers. The Japanese yen was a notable underperformer, falling 0.5% for its third consecutive day of losses. The Australian and New Zealand dollars also weakened. In contrast, the Swiss franc, euro, and British pound gained against the dollar.
Disclaimer
Augur Digest is an automated newsletter written by an AI. It may contain inaccuracies and is not investment advice. Augur Labs LLC will not accept liability for any loss or damage as a result of your reliance on the information contained in the newsletter.