
Energy
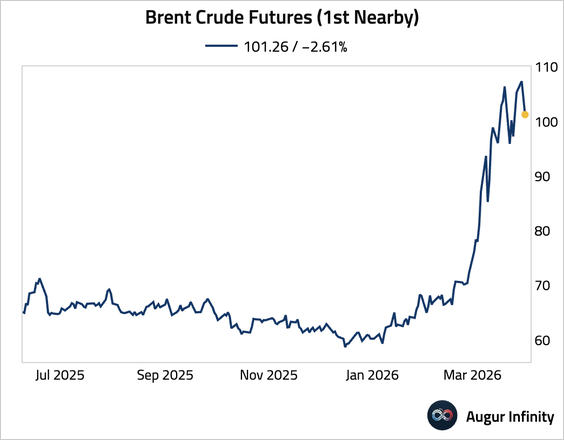
1. Brent crude prices continued falling as cautious optimism grows that the Iran conflict may end soon. President Trump will speak on Iran tonight.

Source: @bpolitics Read full article

Source: CNBC Read full article

Source: NBC News Read full article
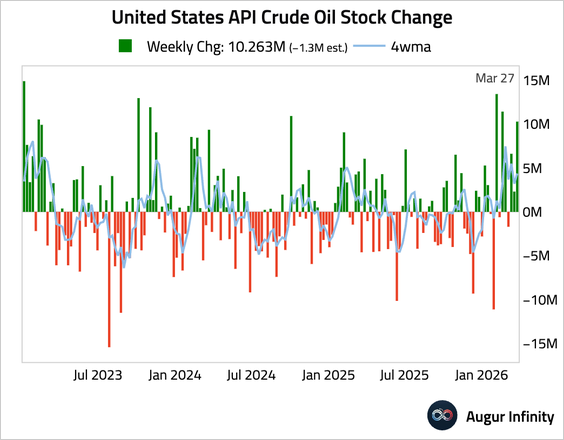
2. US API crude oil inventories posted a surprise build last week, defying expectations for a drawdown.
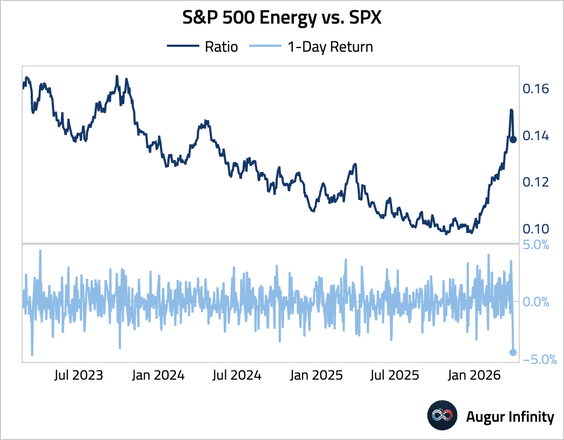
3. Yesterday’s underperformance of the S&P 500 energy sector relative to the broader market was the largest since October 2023.
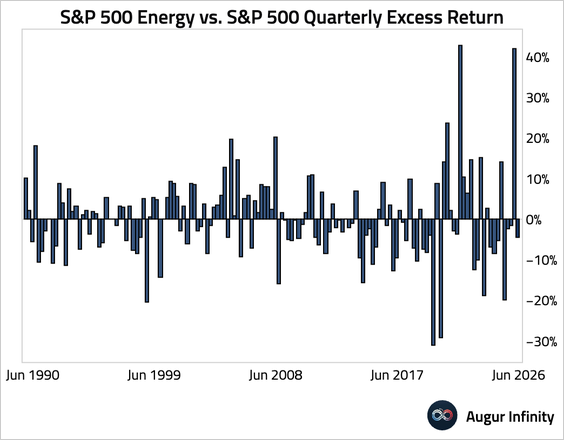
• However, the S&P 500 energy sector still posted the second-best quarter relative to the overall market.
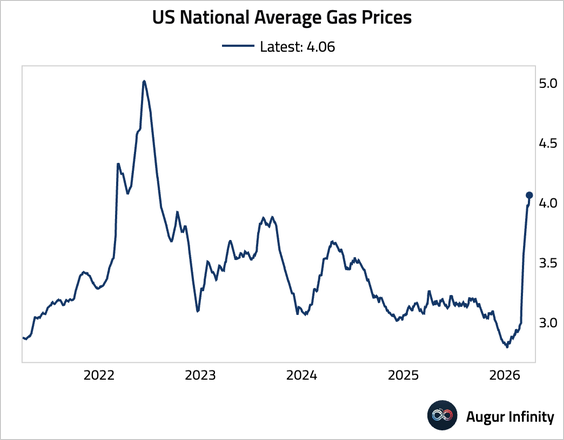
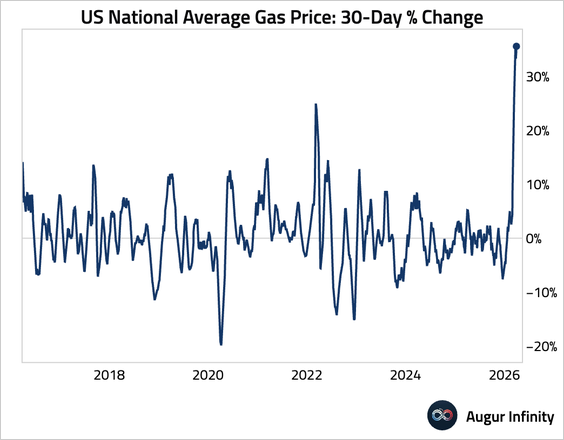
4. The US national average price for regular gasoline jumped further above $4 per gallon.
• The 30-day percentage increase is higher than after the Russia-Ukraine conflict.
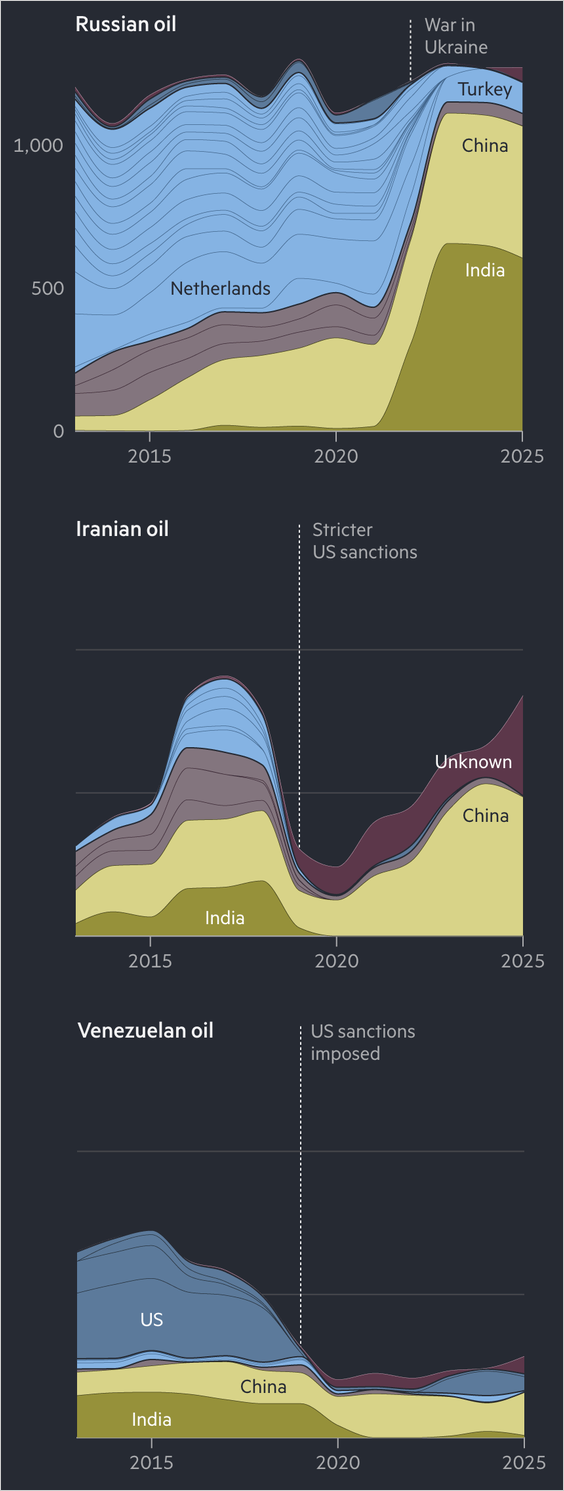
5. China and India have become key destinations for sanctions-hit oil.
Source: @financialtimes Read full article
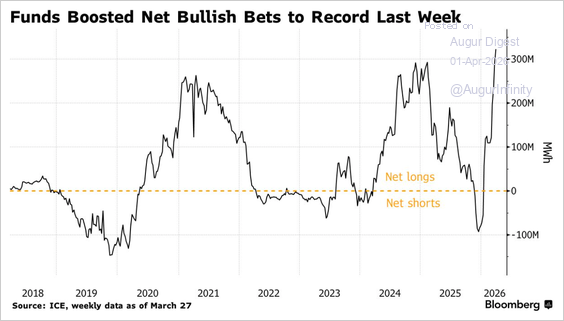
6. Funds and other speculators boosted their net long positions in European natural gas to a record high.
Source: @markets Read full article
The United States
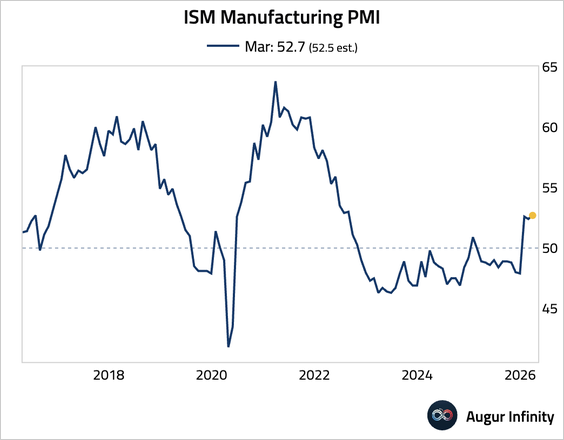
1. The ISM manufacturing PMI edged up to the highest level since 2022, a touch above the consensus estimate.

Source: @economics Read full article
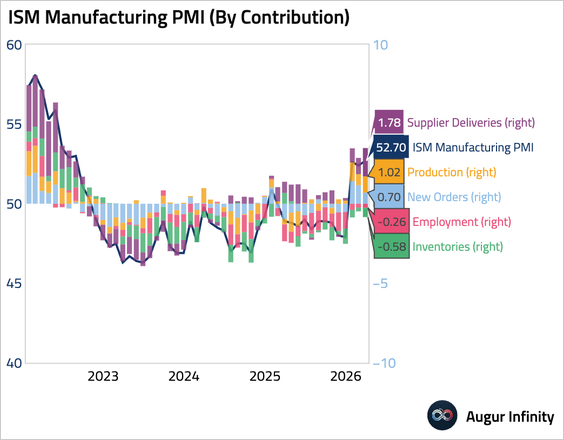
– This chart shows the contribution of each component to the headline figure.
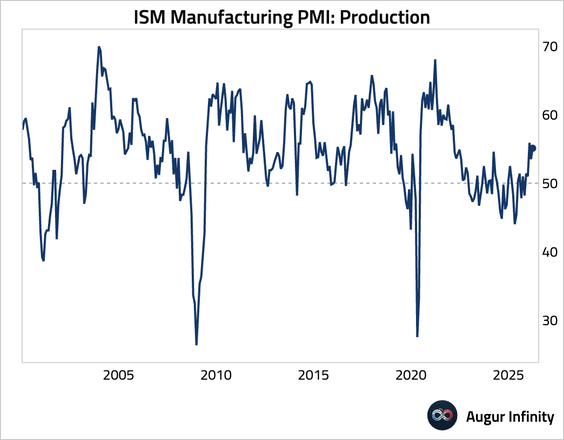
• The production index climbed, indicating solid manufacturing output.
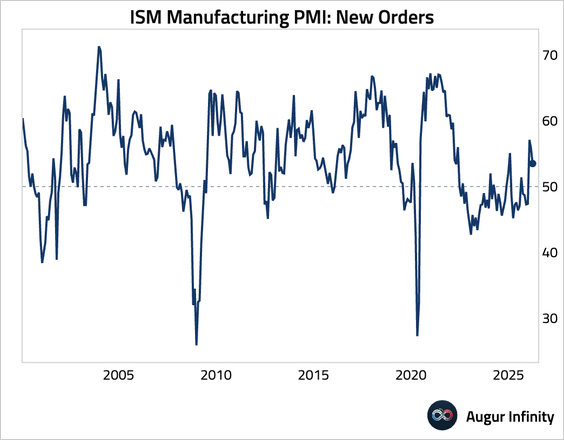
• The new orders index moderated but remained at strong levels.
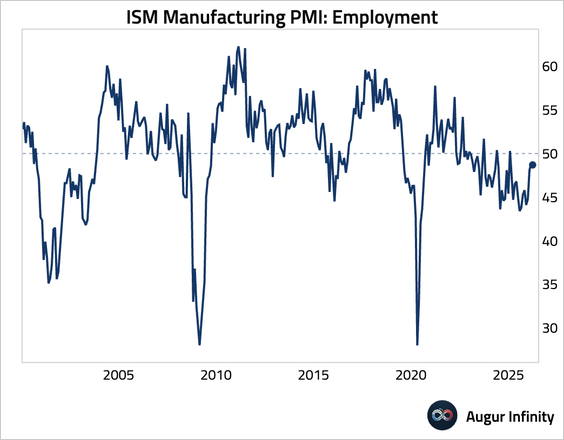
• Employment remained in contraction, but has improved over the past few months.
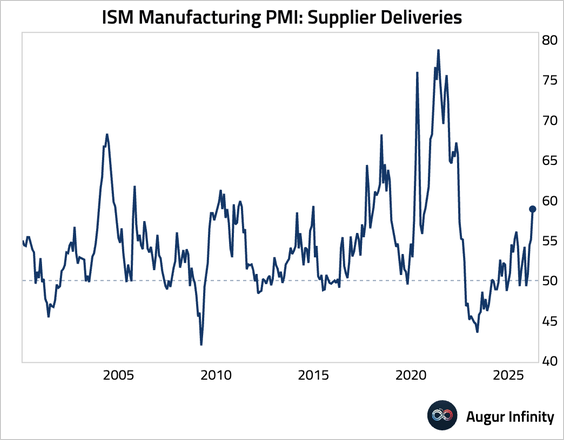
• Supplier deliveries slowed markedly, signaling supply chain friction.
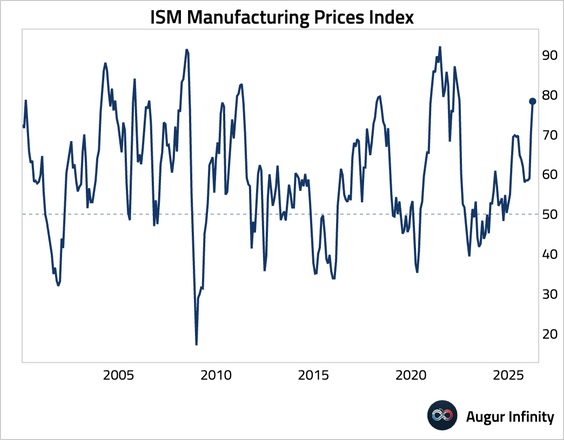
• The prices index, which reflects prices paid, surged to the highest level since June 2022.
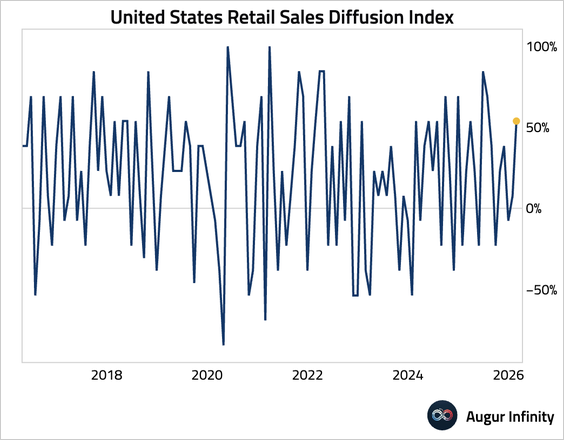
2. February retail sales posted a broad-based beat against consensus estimates. The key “control group”—a direct input for GDP—expanded by a solid 0.5%.
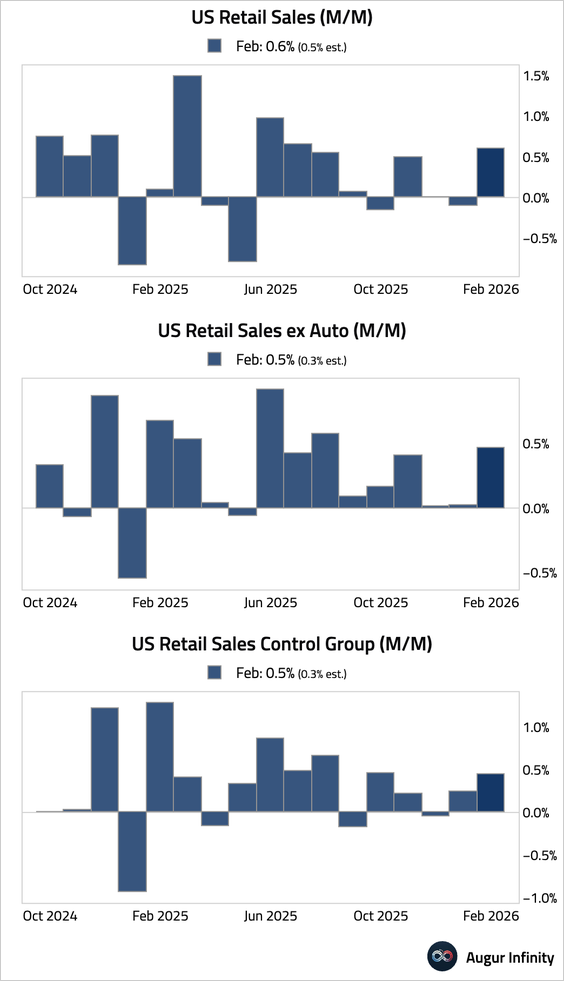
• The strength was broad-based.

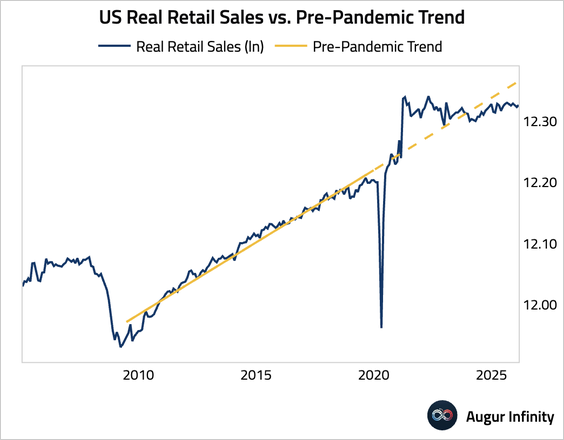
• Here are real retail sales versus the pre-pandemic trend.
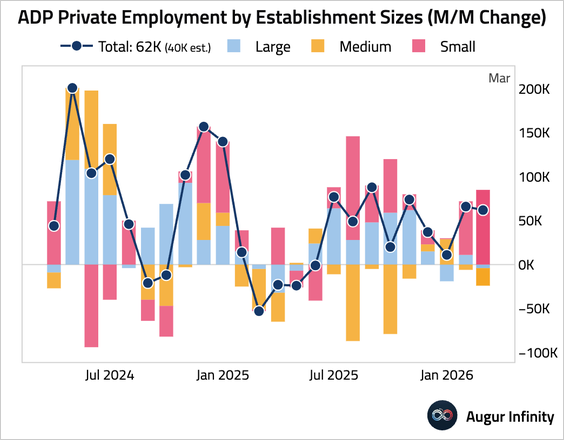
3. ADP private payrolls unexpectedly declined by 32K, the biggest drop in more than two and a half years. The decline was driven entirely by a 120K job loss at small businesses.
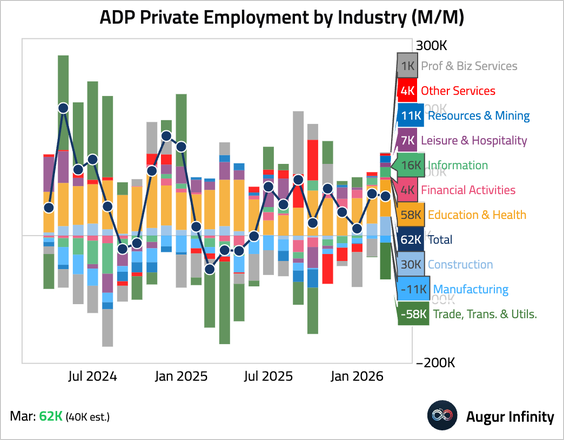
• Here is a breakdown by industry.
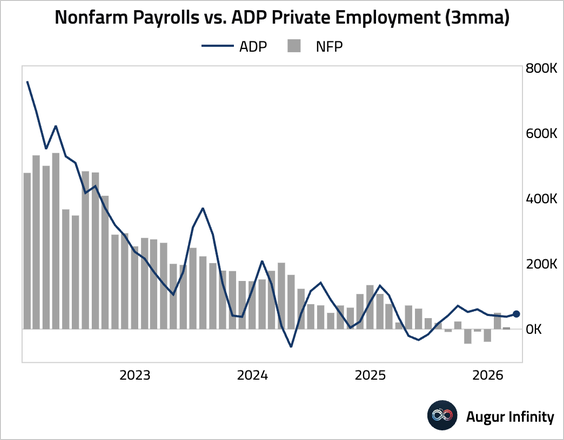
• The ADP report, smoothed on a three-month rolling basis, points to a stabilizing labor market.
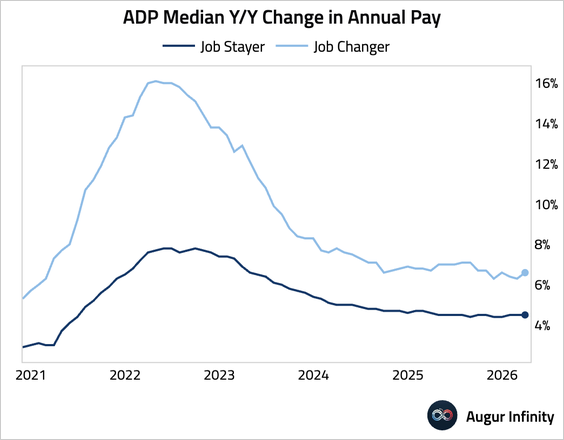
• Wage growth was stable for job stayers, but edged up for job switchers.
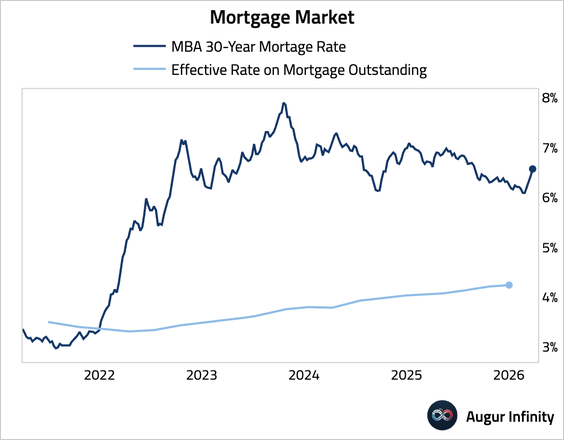
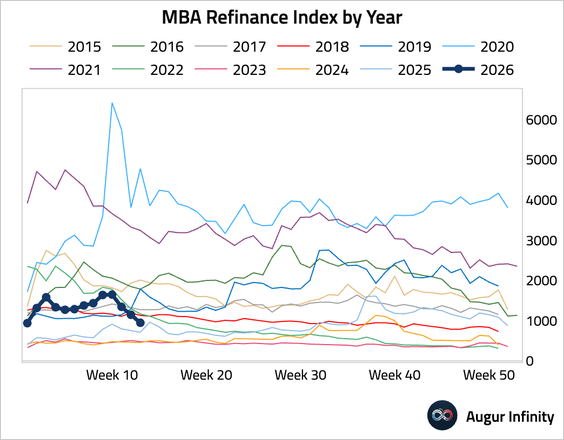
4. Mortgage applications fell as the 30-year fixed mortgage rate climbed for a fourth straight week.
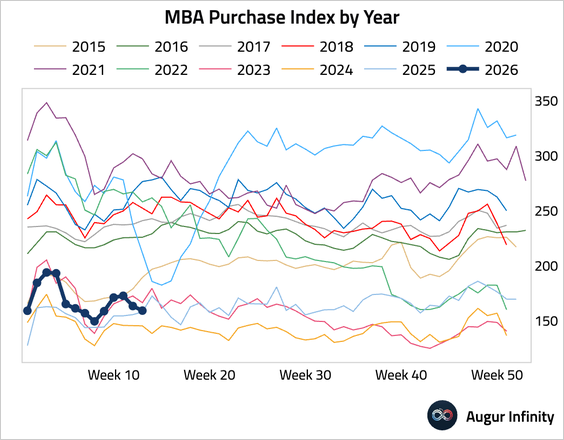
• Refinancing activity also declined.
5. The Atlanta Fed’s GDPNow model is now tracking Q1 GDP at 1.9%, down from 2.1% on March 25.

Subscribe to read the rest.
Become a subscriber of Augur Digest Premium to see all 94 charts today.
Upgrade