Administrative Update
Augur Digest will not be published on <b>Friday</b> (April 3), in observance of Good Friday.
Global Developments
1. Brent crude prices surged as President Trump signaled an escalation of the Iran conflict, dimming hopes for a swift resolution. The market moves were tempered by hopes of of a reopening protocol from Iran and Oman.
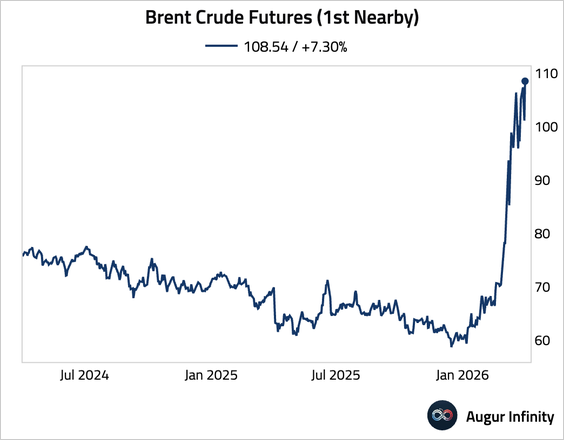

Source: @markets Read full article

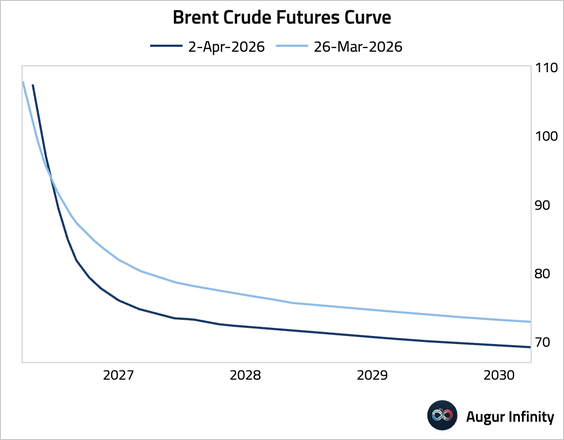
– The term structure remains in deep backwardation.
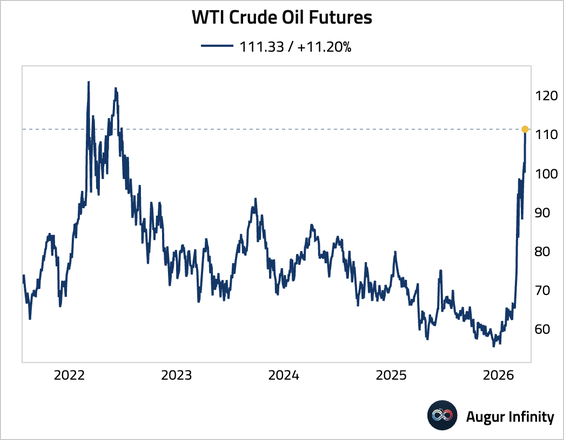
• WTI crude oil is also firmly above $100.
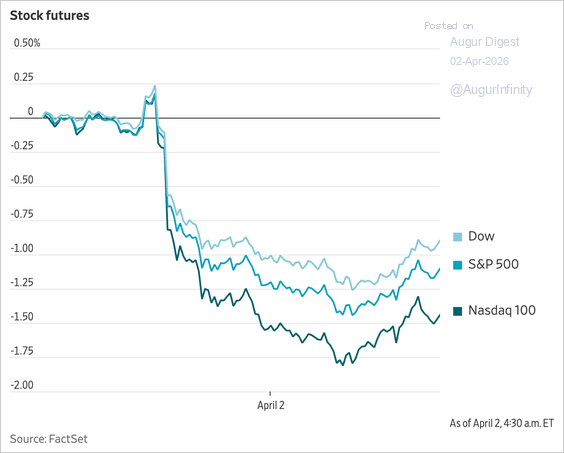
• Risk sentiment soured, with US equity futures falling more than 1% overnight before rallying back into the green on news of the protocol.
Source: @WSJ
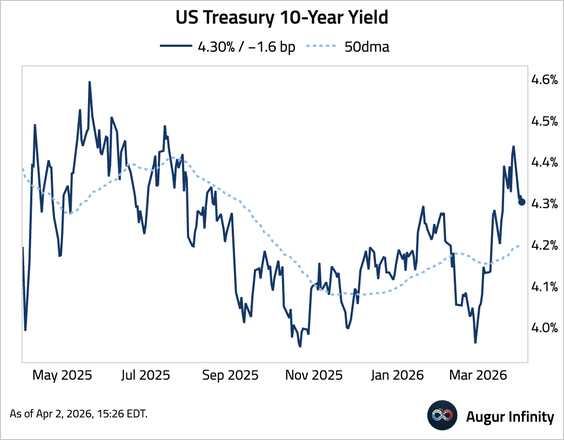
• Bond yields rose overnight before reverting to close the day.
• Goldman Sachs has cut its 2026 growth forecast further below consensus.
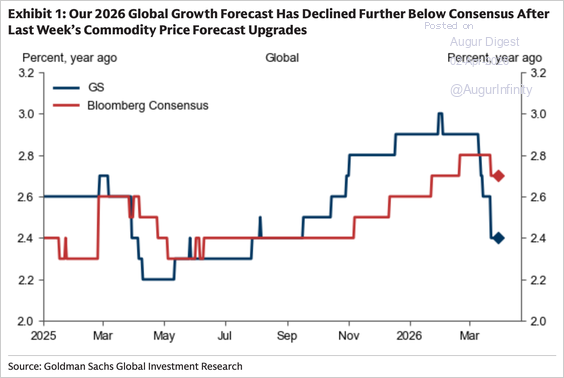
Source: Goldman Sachs
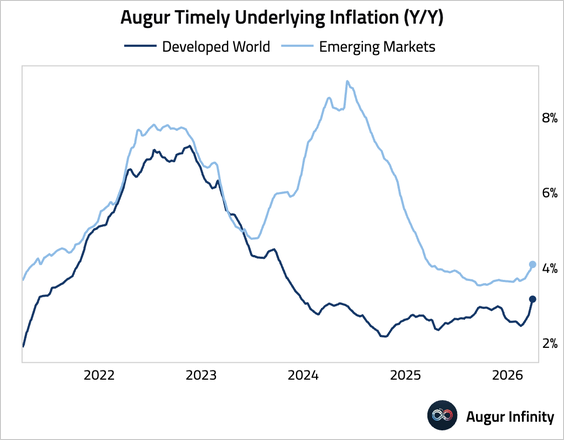
2. Global inflation has firmed, based on our tracking.
3. Here is a look at traffic at the top 10 shipping chokepoints since the commencement of the Iran conflict.
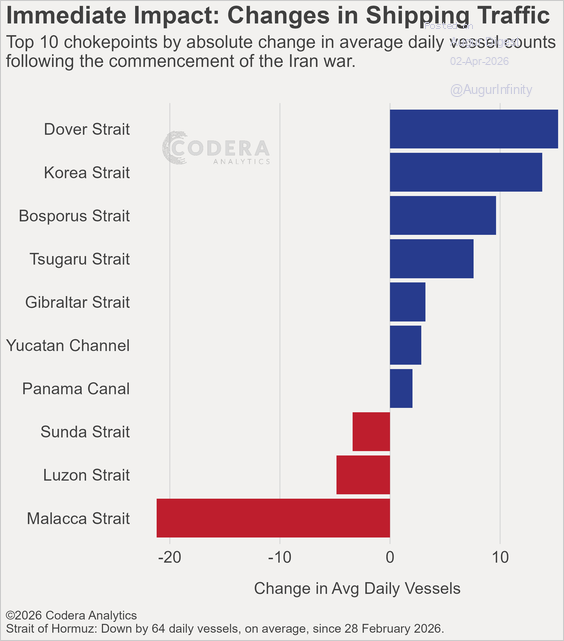
Source: Codera Analytics
The United States
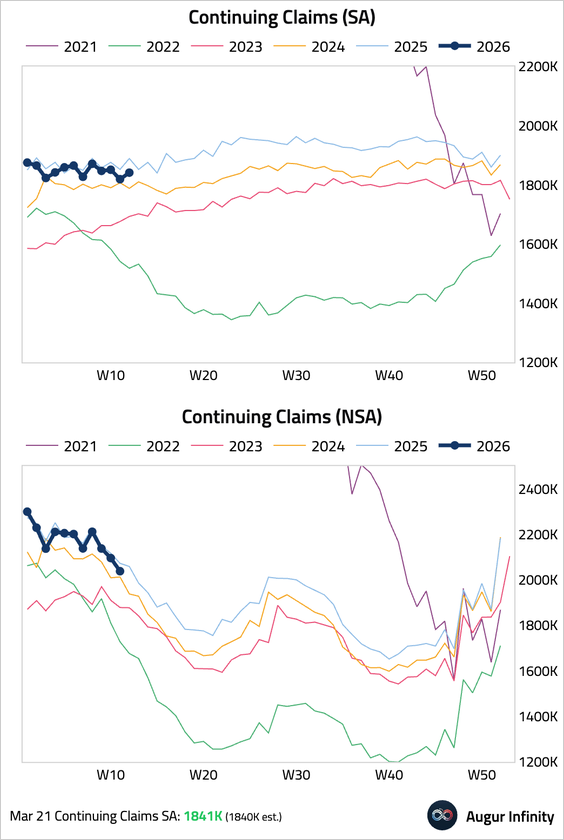
1. Initial jobless claims fell to 202K, below consensus and near a two-year low, signaling limited layoffs.
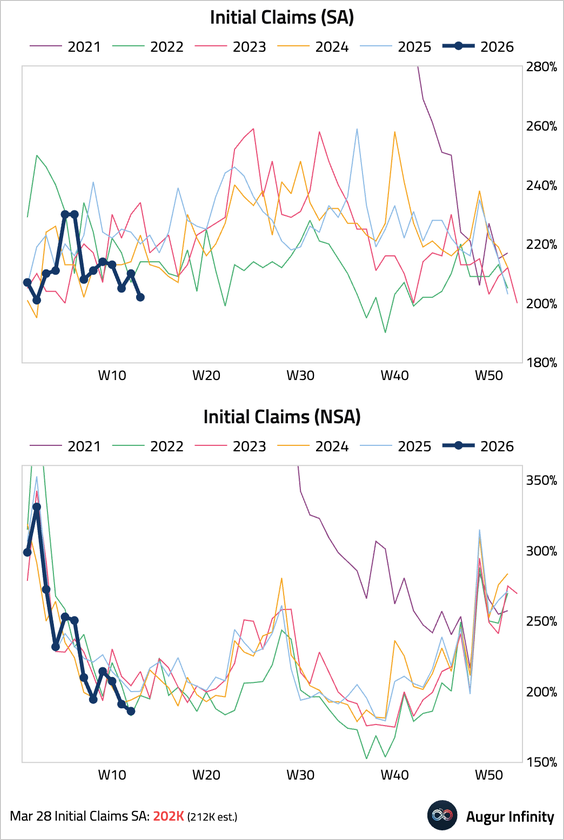
• Continuing claims ticked higher but remained near historic lows.
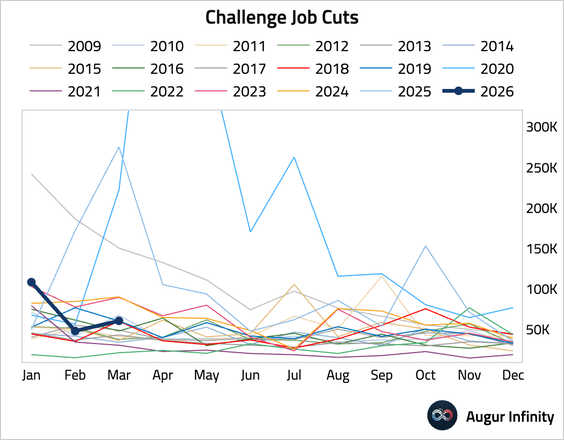
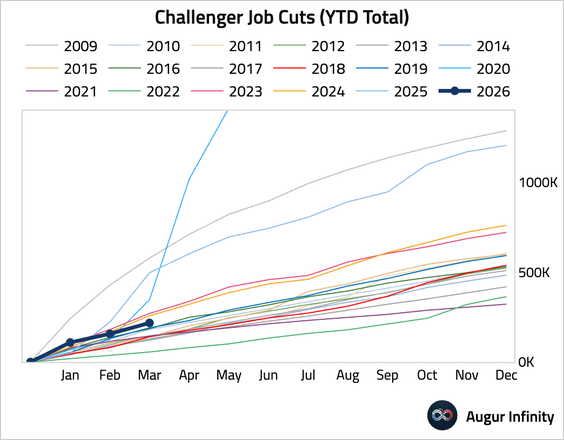
2. Announced job cuts rose, led by the technology sector. Notably, “Artificial Intelligence” was the top reason for job cuts, accounting for a quarter of layoffs.
3. Revelio Labs’s US nonfarm employment rose by 19K, with expansion in both government and private jobs.
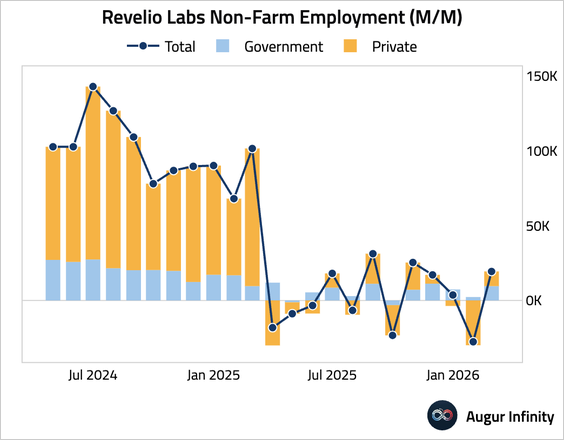
Source: Revelio Labs
• Here’s a look at monthly changes in employment by sector.
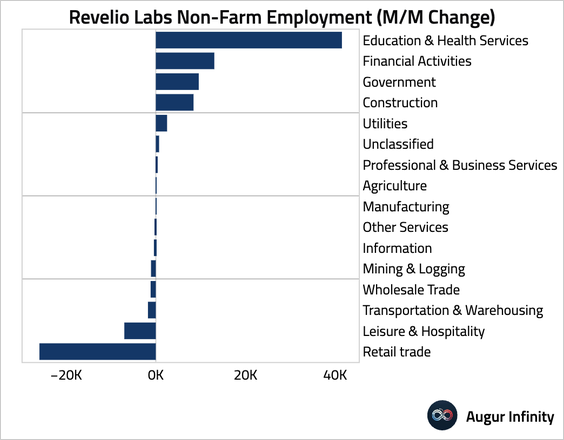
Source: Revelio Labs
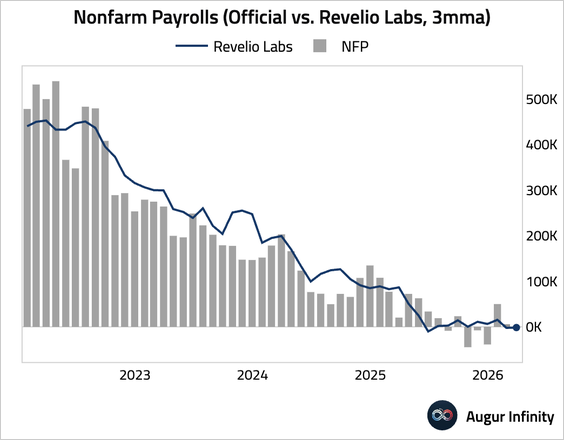
• Smoothed on a rolling three-month basis, Revelio’s estimates remain subdued.
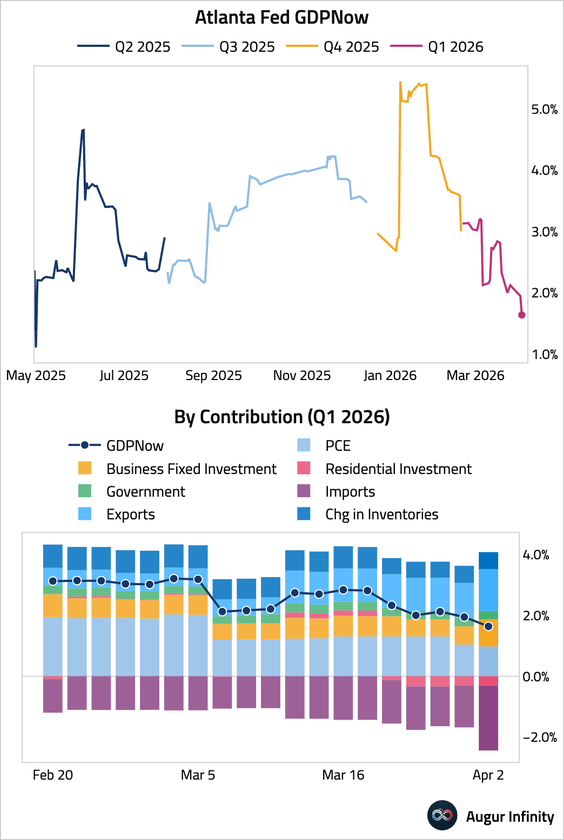
4. The trade deficit widened. A surge in imports, particularly of electronics and semiconductors for AI investment, drove a significant widening of the underlying (ex-gold) deficit. The increase in imports offset a rise in exports, which reached an all-time high.
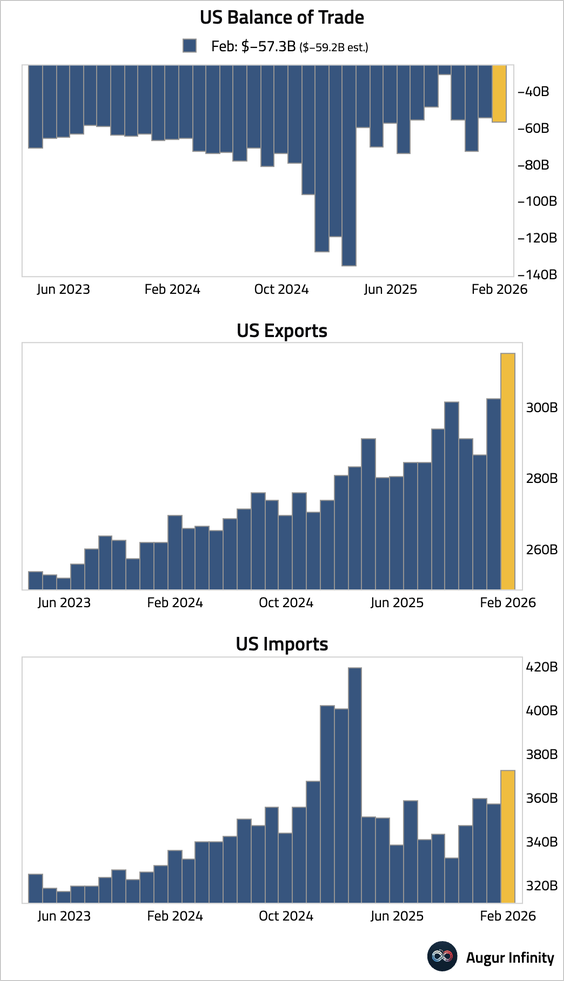
• The weaker net trade data prompted a downward revision to the Q1 GDP tracking estimate, lowering the Atlanta Fed’s GDPNow estimate to 1.6% from 1.9% on April 1.
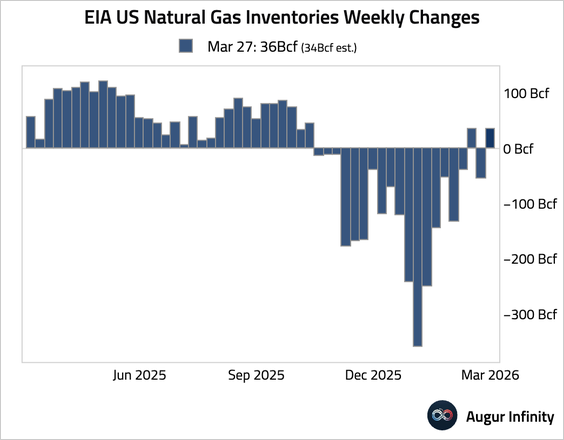
5. US natural gas inventories recorded a larger-than-expected build for the week.
Canada
1. The trade deficit widened more than anticipated, as record-high imports, driven by surging gold inflows from the US, outpaced export growth.
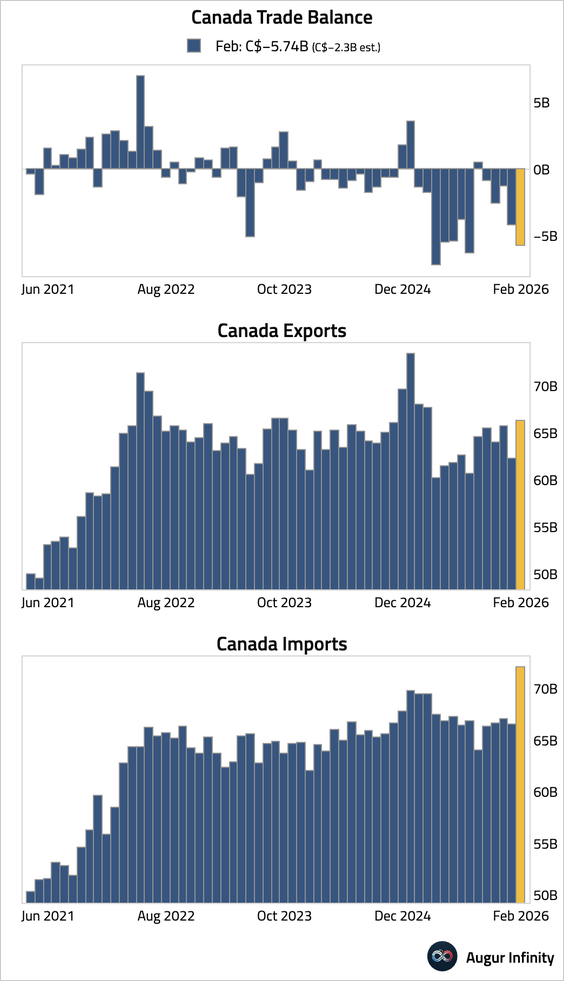

Source: @economics Read full article
The Eurozone
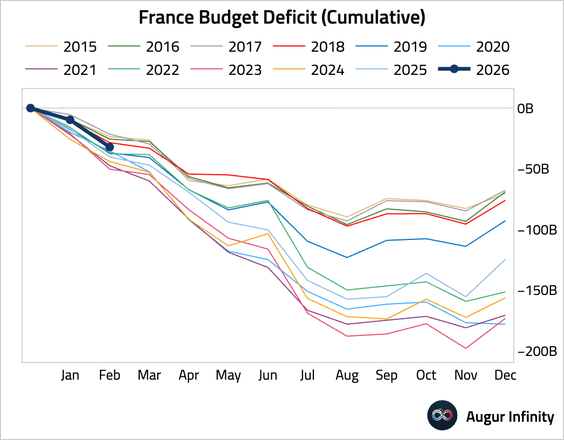
1. France’s year-to-date government budget deficit was narrower than the same period last year.
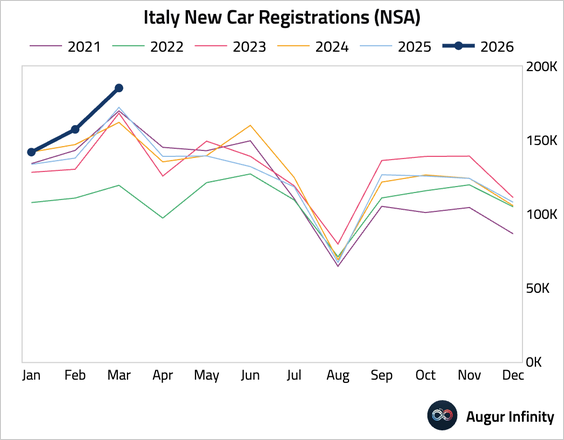
• Italy’s new car registrations also jumped.
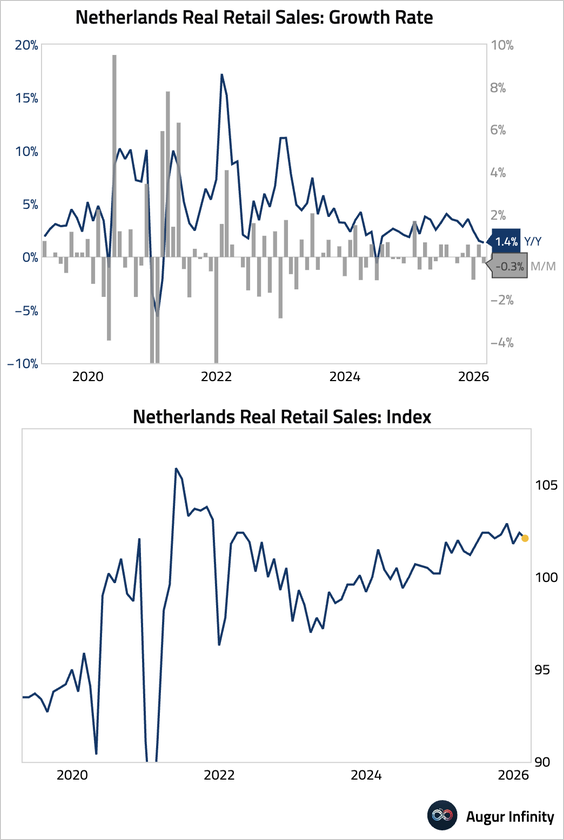
2. Dutch retail sales growth moderated year over year.
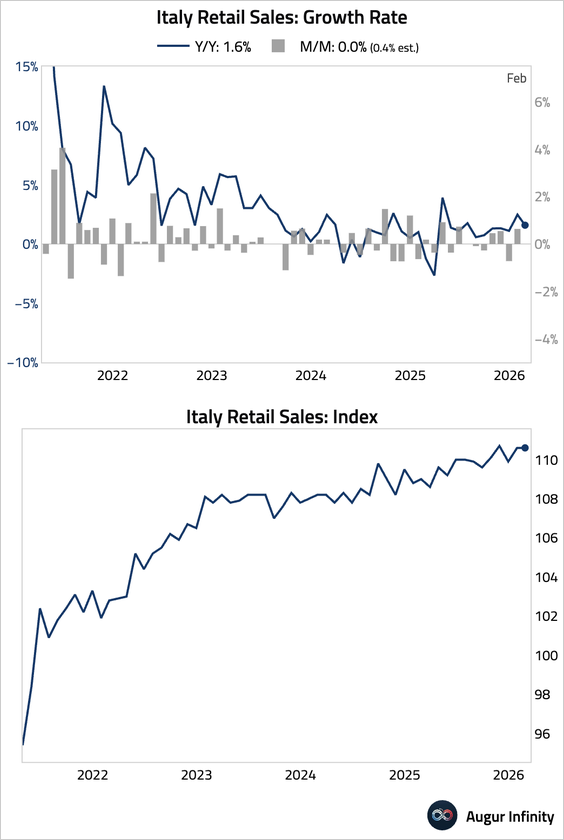
3. Italian retail sales stagnated in February.
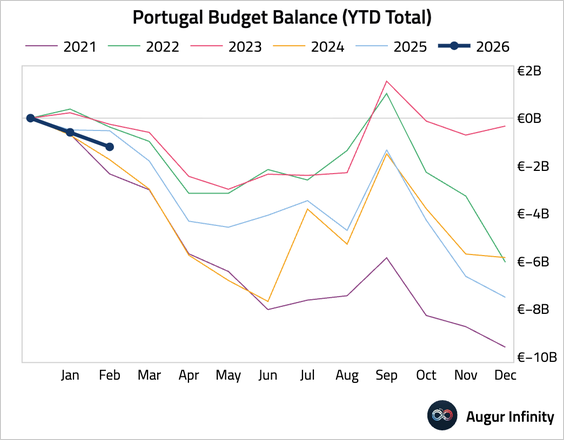
4. Portugal’s year-to-date budget deficit was higher than the same period last year.
Europe
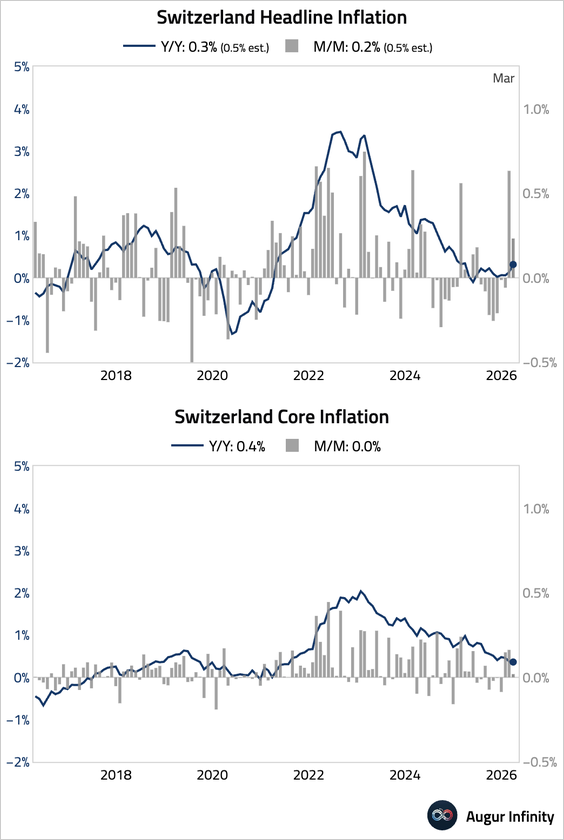
Swiss headline inflation was cooler than expected, as a surprise fall in domestic inflation offset a sharp rise in costs for imported energy.
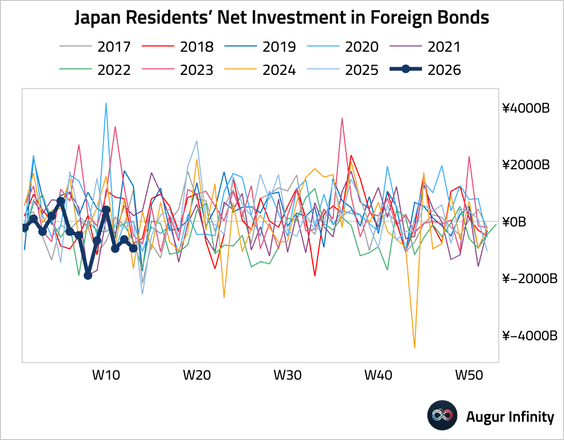
Japan
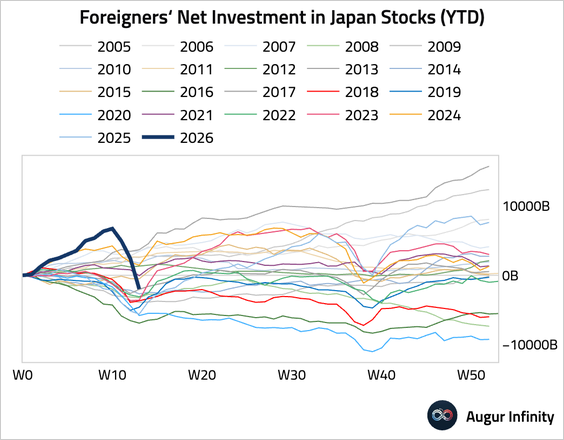
Foreign investors were significant net sellers of Japanese stocks last week, with outflows reaching a record high.
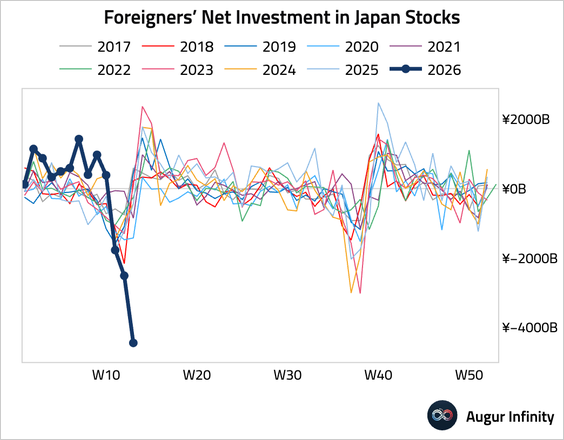
• Japanese investors continued to reduce their foreign bond exposure.
Asia-Pacific
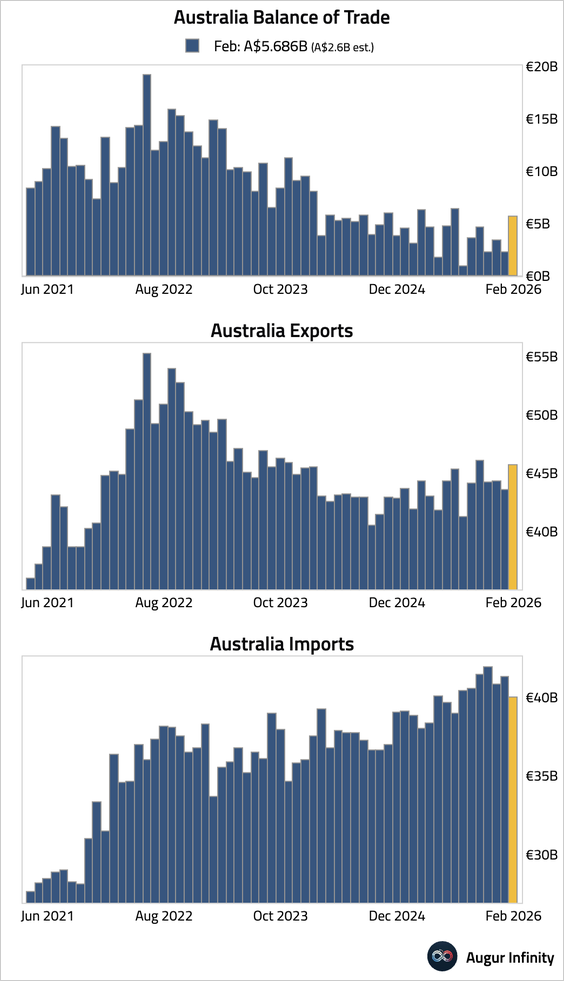
1. Australia’s trade surplus widened significantly. However, the headline strength was almost entirely due to a surge in non-monetary gold exports, which masked underlying weakness in core commodity shipments like metal ores and mineral fuels.
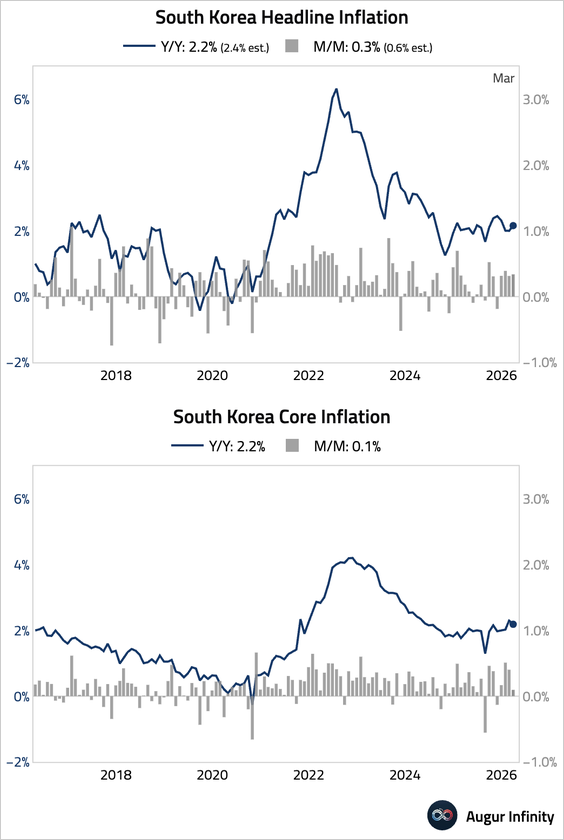
2. South Korea’s headline inflation accelerated, driven by a sharp rise in oil product prices. However, underlying price pressures appear to be moderating, as core inflation eased and momentum in services inflation slowed to its lowest since last November.
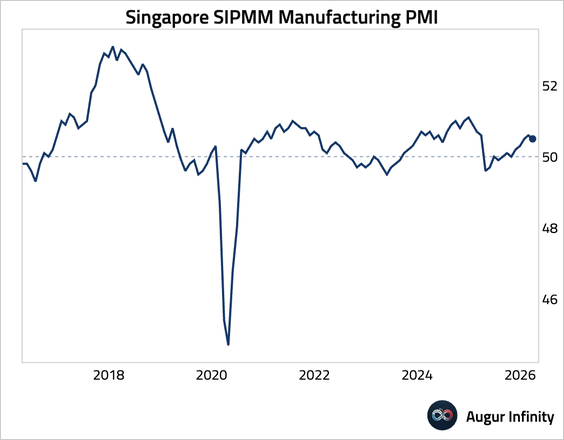
3. Singapore’s manufacturing sector continued to expand in March, though at a slightly slower pace.
China
1. Chinese government bonds have remained resilient amid a global sell-off.
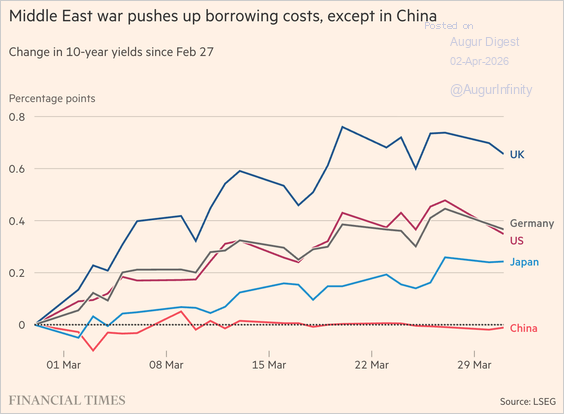
Source: @financialtimes Read full article
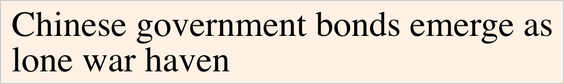
2. Chinese technology firms reported their weakest earnings growth in three years, with profits in the Hang Seng Tech Index falling 30% year over year.
Source: @markets Read full article
Emerging Markets
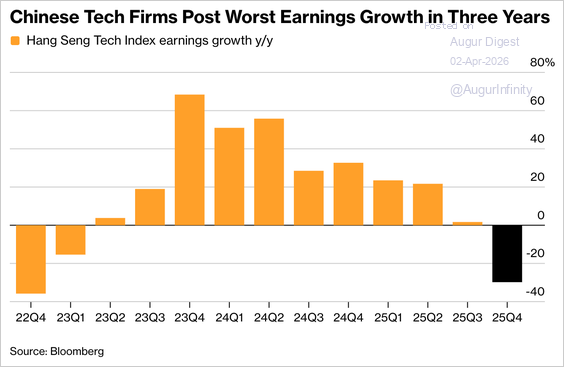
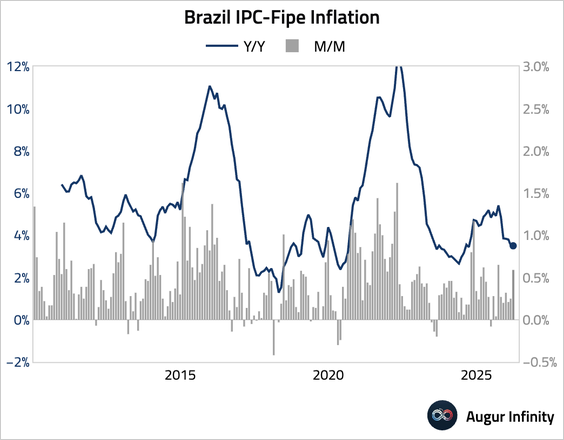
1. Brazil’s industrial production was stronger than expected in February, with January’s growth rate revised upward.
• Inflation in São Paulo accelerated more than expected in March, with the month-over-month rate reaching the fastest pace in six months.
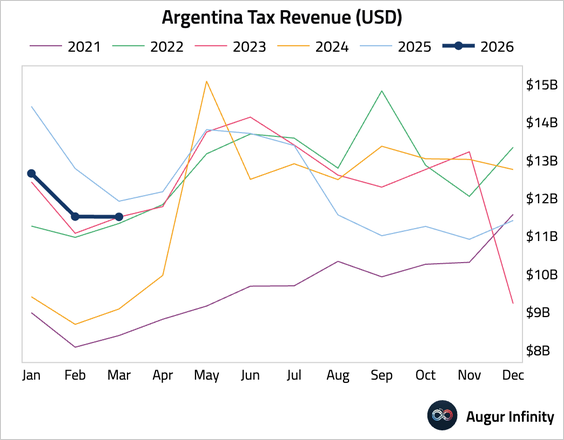
2. Argentina’s tax revenue declined year over year.
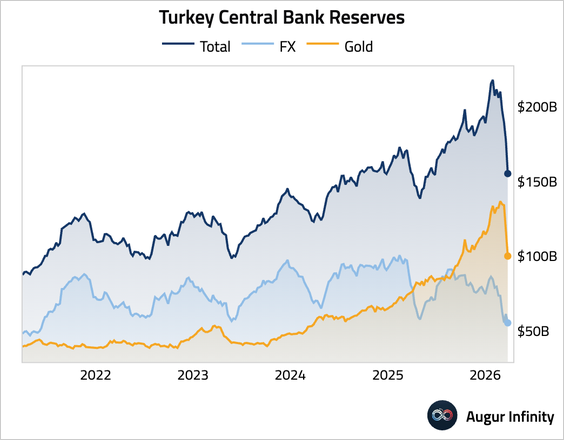
3. Turkey’s trade deficit widened.
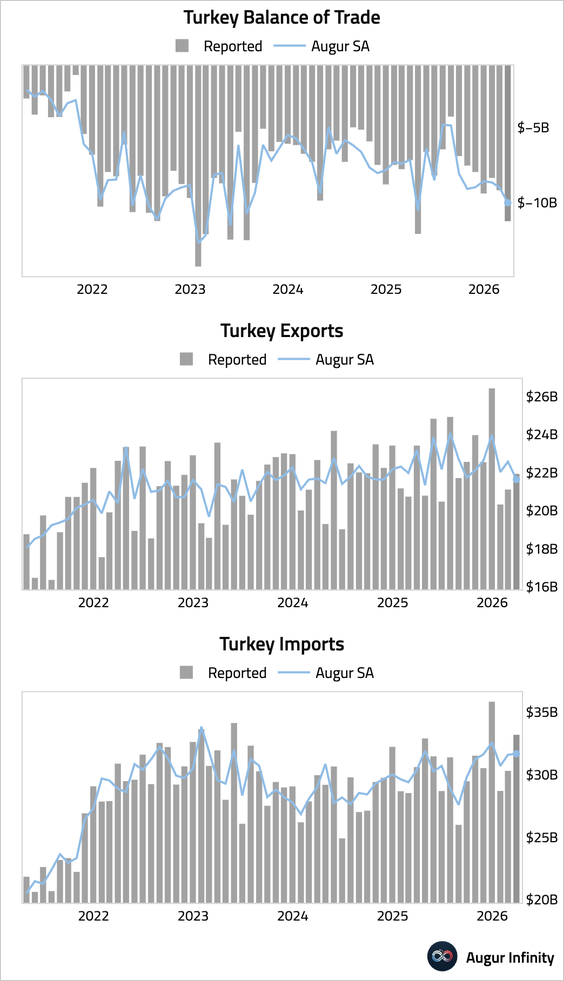
• The international reserves declined to their lowest level since mid-2021.
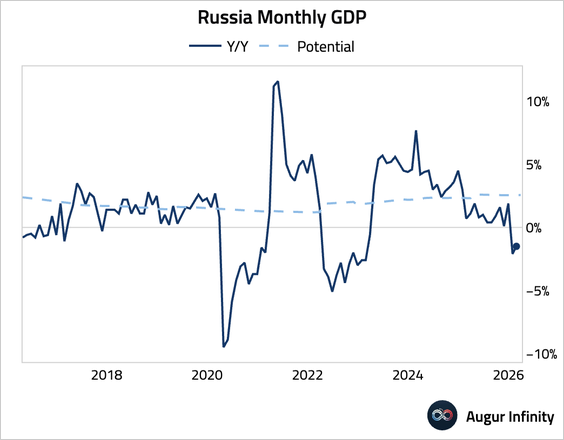
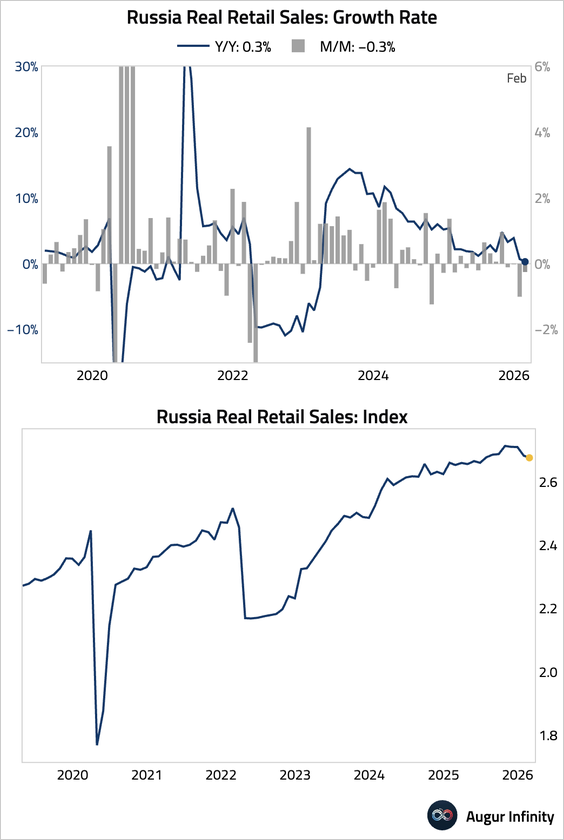
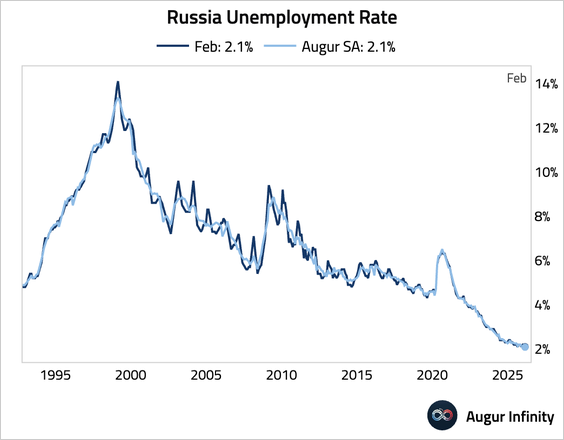
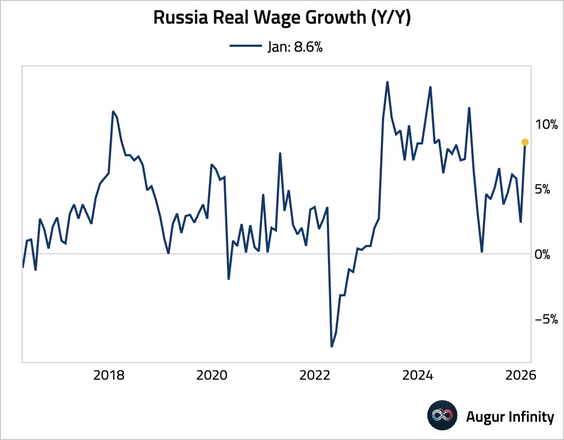
4. Next, let’s step through some data from Russia.
• GDP growth remained in contraction.
• Retail sales fell for the fourth consecutive month.
• The unemployment rate, which has to be taken with a grain of salt, declined to a secularly low level.
• Wage growth accelerated.
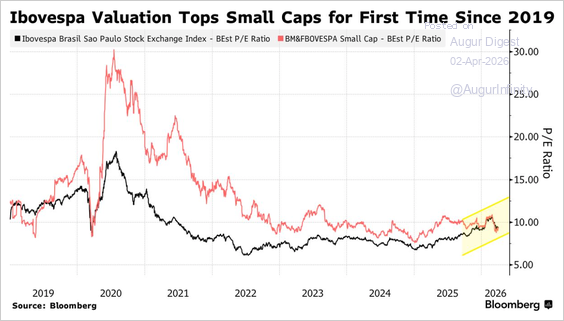
5. Brazilian small caps are trading at their cheapest relative to large caps in over six years, losing their typical valuation premium after heavy foreign inflows favored blue chips.
Source: @markets Read full article
Equities
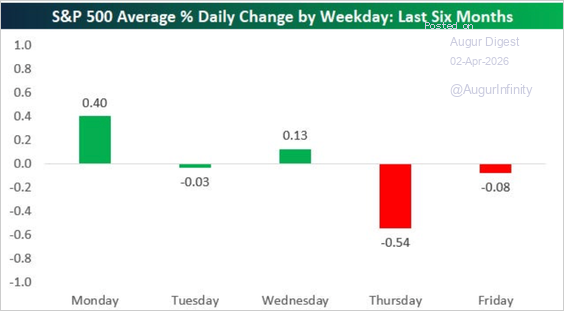
1. The S&P 500 bounced back into the positive today. Although, over the past six months, the S&P 500 has averaged a decline of 0.54% on Thursdays, which is by far the worst of any weekday.
Source: @bespokeinvest
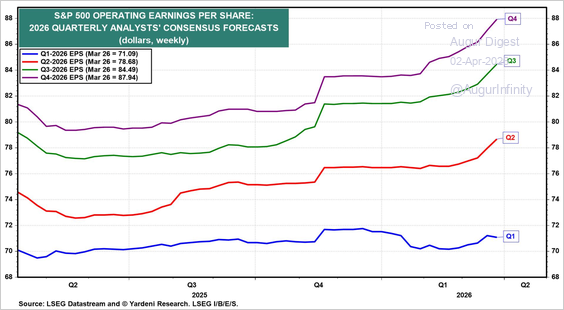
2. Let’s begin with our weekly updates on earnings and valuation.
• Analysts revised Q1 EPS down slightly, but continued to revise up EPS forecasts for the rest of the year.
Source: Yardeni Research
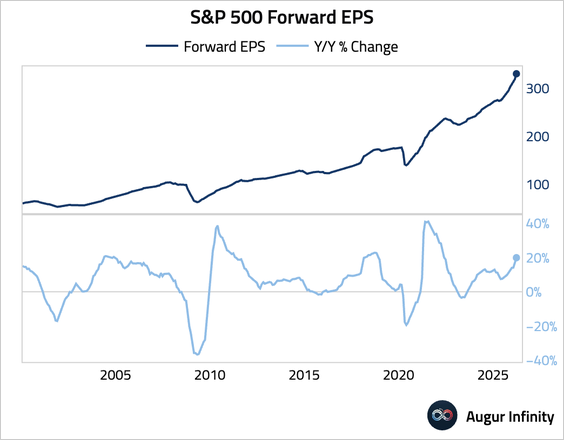
• Growth in forward EPS has been accelerating.
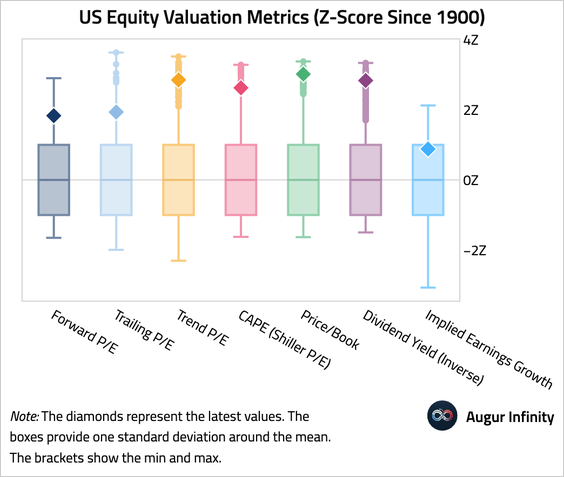
• This chart summarizes US equity valuation metrics since 1900. Nearly all measures are near or over two standard deviations away from the long-term mean.
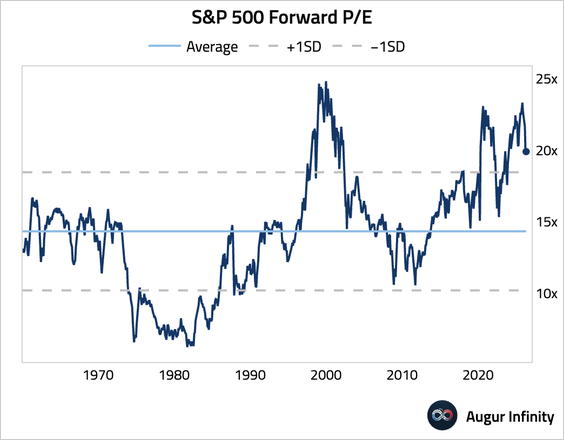
• S&P 500 forward P/E has declined, but remains elevated.
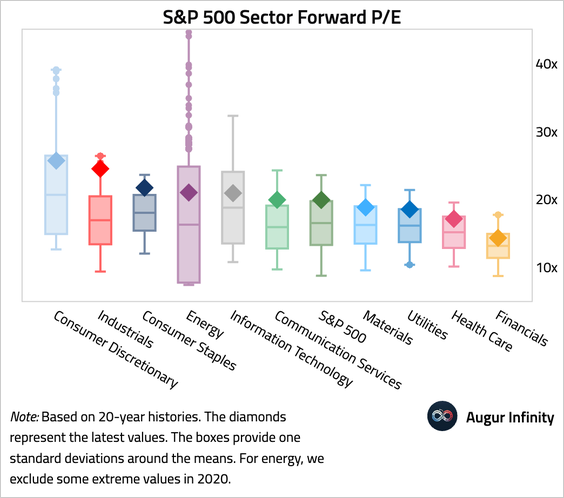
• Here’s an overview of S&P 500 sector forward P/Es, summarized over the past 20 years.
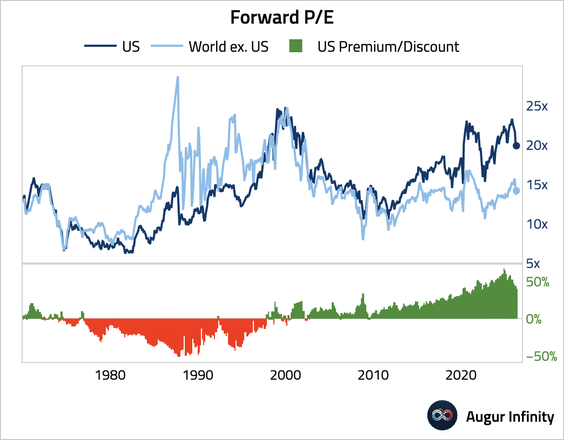
• US equities are trading at a 40% premium relative to the rest of the world.
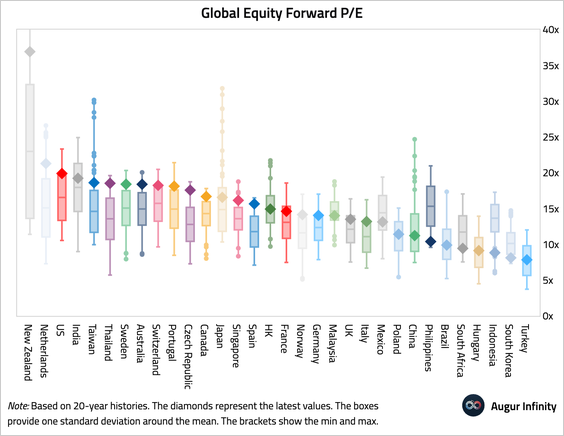
• Here’s global equity valuation by country.
3. Here is a look at valuation metrics for both the cap-weighted and equal-weighted S&P 500.
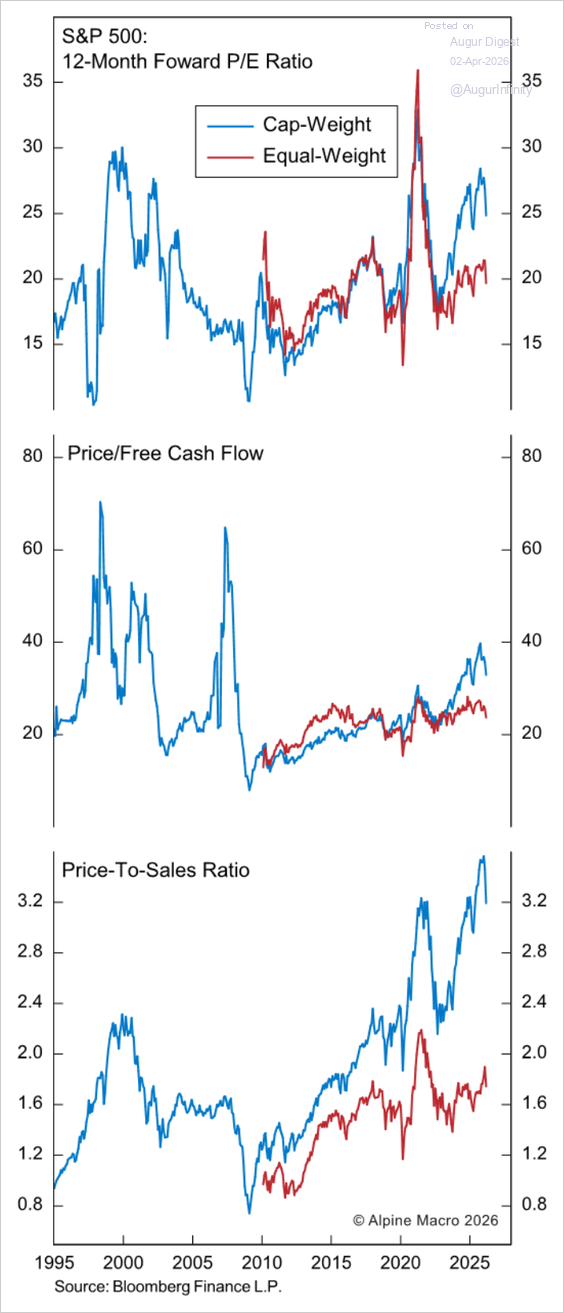
Source: Alpine Macro
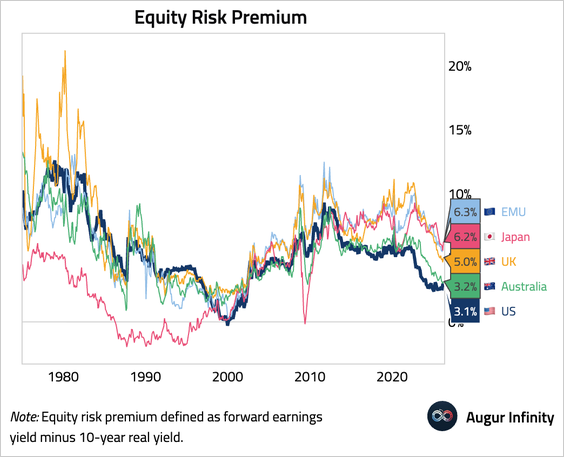
4. The US has the lowest equity risk premium among major developed economies.
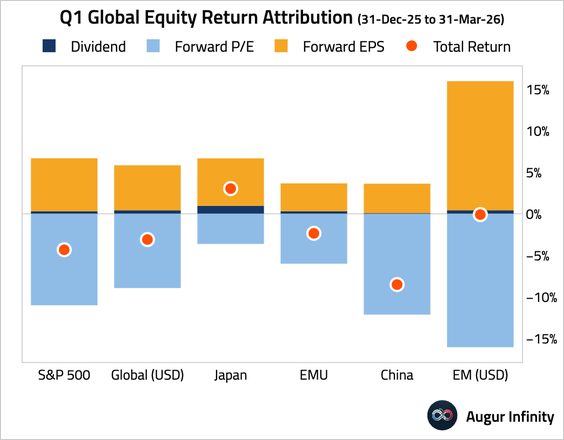
5. Forward EPS rose across regions in Q1, while valuation multiples contracted everywhere.
6. Long-only funds have added exposure to energy, while reducing exposure to utilities.
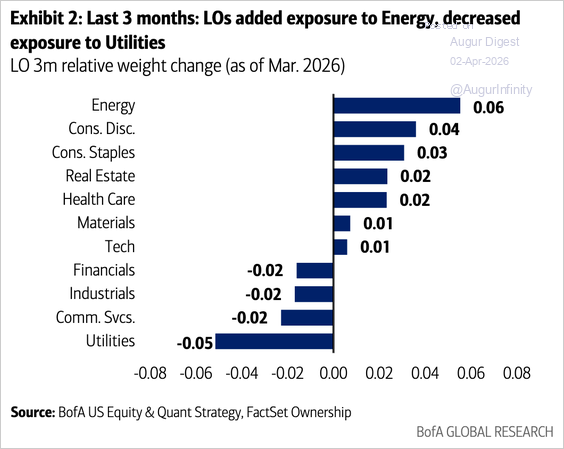
Source: BofA Global Research
• Even so, utilities remain the most overweight relative to history, while financials and energy are the most underweight.
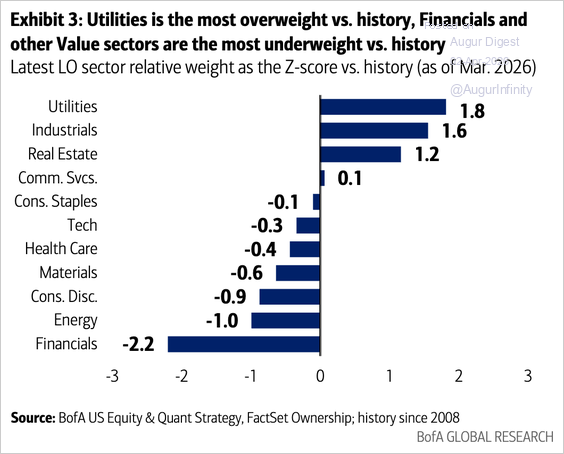
Source: BofA Global Research
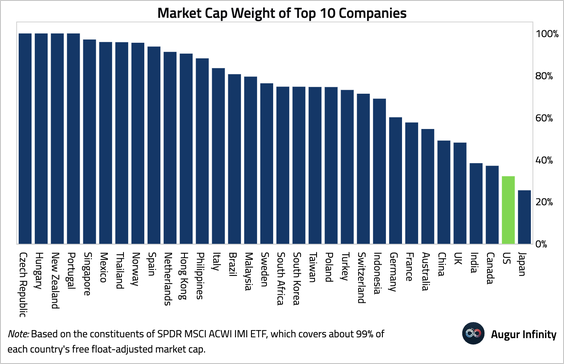
7. The top 10 companies account for a smaller share of total market capitalization in the US than in most other countries.
8. Global equities lost $12 trillion in March, marking the largest monthly dollar decline on record.
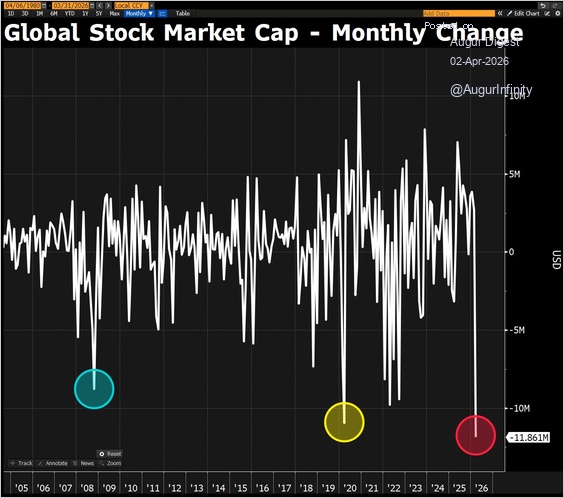
Source: @DavidInglesTV
9. Over the past century, equities have delivered strong aggregate returns, but wealth creation has been highly concentrated in a small minority of stocks, with most individual names underperforming Treasury bills and the median stock generating negative returns.
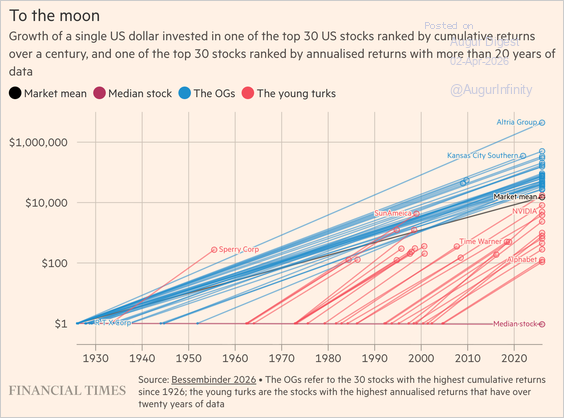
Source: @financialtimes Read full article
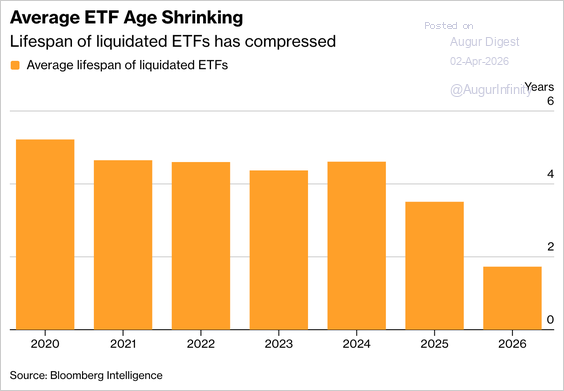
10. The average lifespan of liquidated ETFs has fallen to about one year and nine months in 2026—down sharply from prior years—as intensifying competition and record product launches prompt issuers to shut underperforming funds more quickly and focus on scaling winners.
Source: @markets Read full article
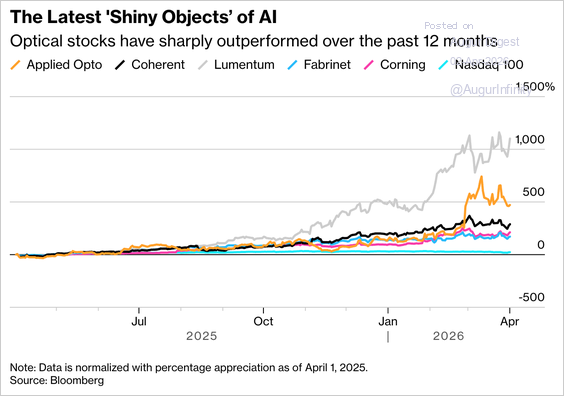
11. Optical component makers are surging on AI-driven data center demand and heavy hyperscaler capex.
Source: @markets Read full article
Rates
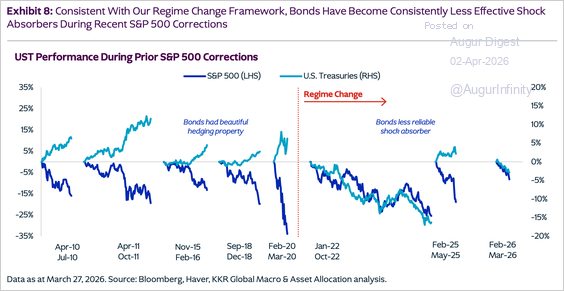
1. Bonds have become less reliable as shock absorbers.
Source: KKR
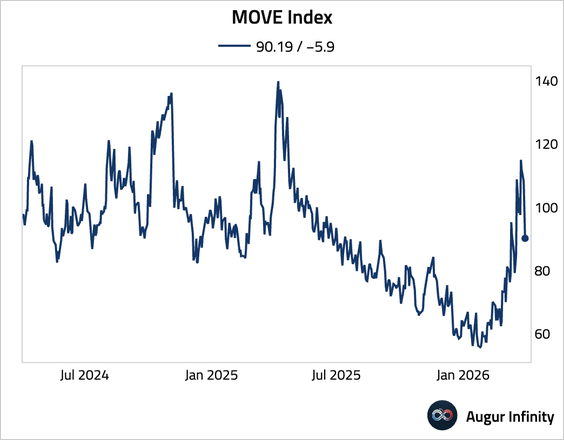
2. The MOVE index fell below 100.
Credit
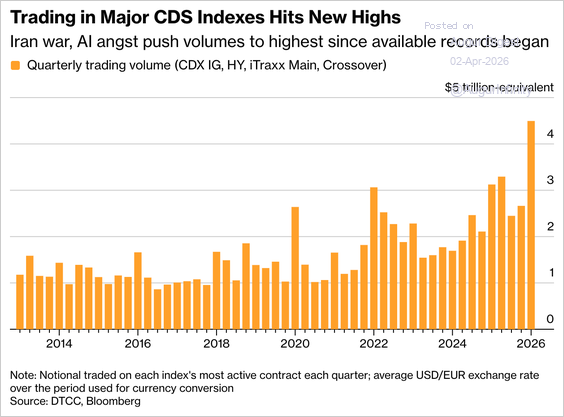
Credit-derivative trading volumes have surged to record highs.
Source: @markets Read full article
1. Blue Owl Capital capped redemptions at 5% across two private credit funds after investors sought to withdraw up to 41% of assets, underscoring intensifying liquidity pressures and investor unease in the private credit market.

Source: @markets Read full article
Energy
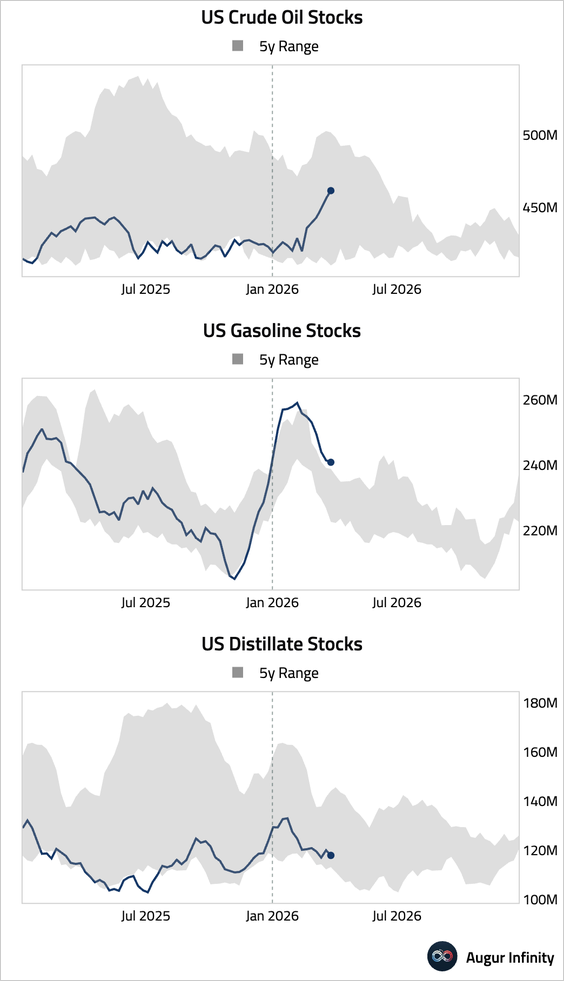
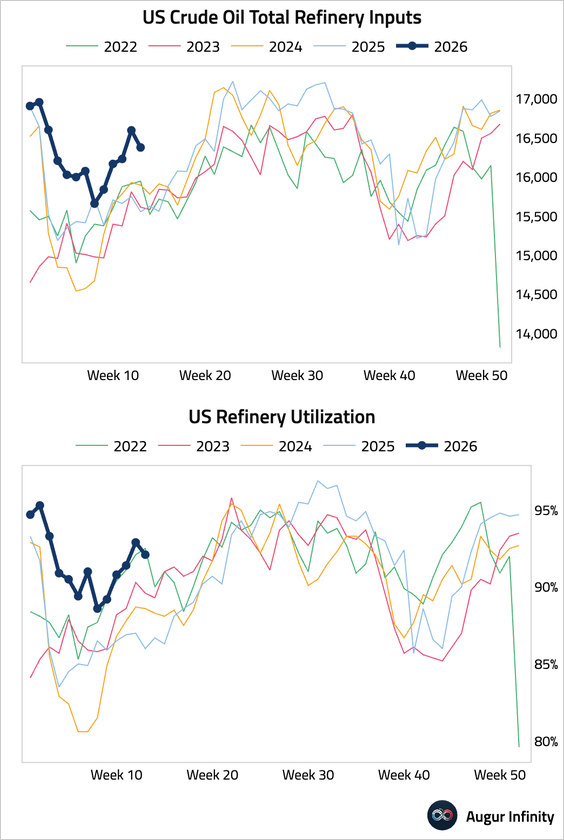
1. US commercial crude oil inventories posted larger-than-expected builds last week. In contrast, both gasoline and distillate inventories declined.
– Weekly changes:
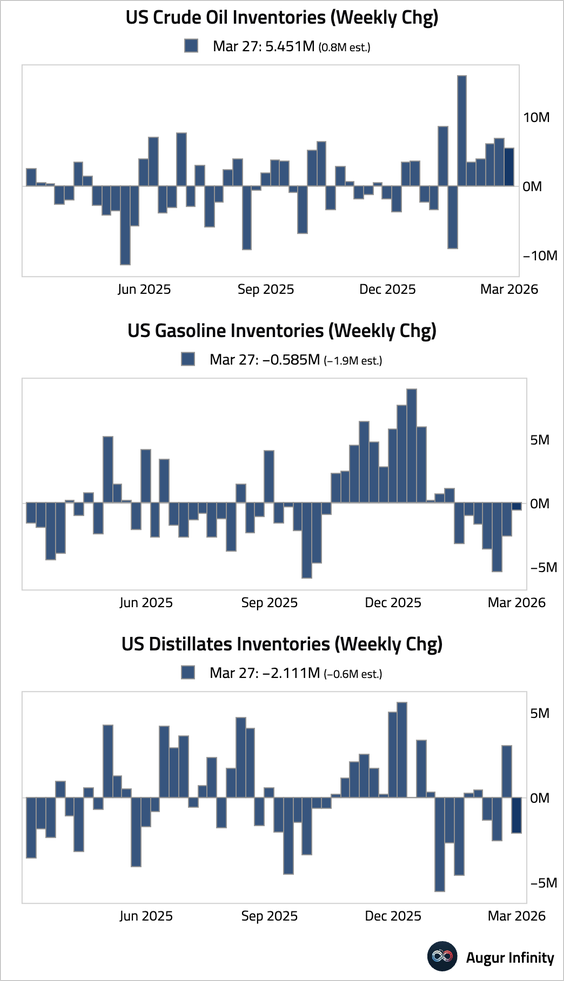
– Levels:
• Refinery utilization eased.
2. Here’s a long-term look at real crude oil prices.
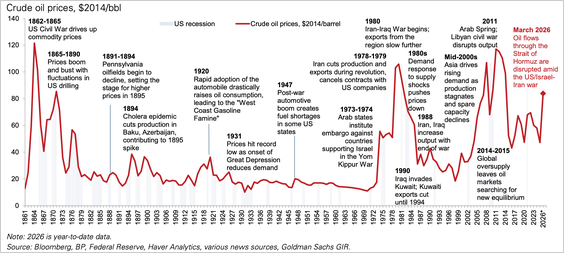
Source: Goldman Sachs
3. Investors poured a record $977 million into the inverse oil ETF in March, signaling aggressive bets on a sharp crude reversal.
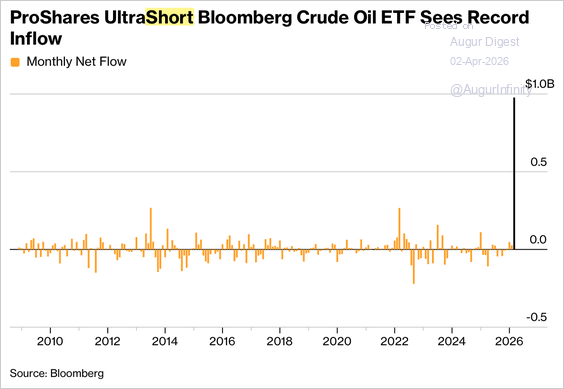
Source: Bloomberg via Daily Chartbook
4. Countries across Asia have imported less oil since the Iran conflict began.
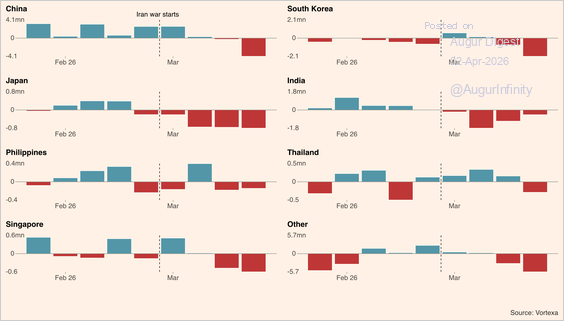
Source: @financialtimes Read full article
5. Funds and other speculators boosted their net long positions in European natural gas to a record high.
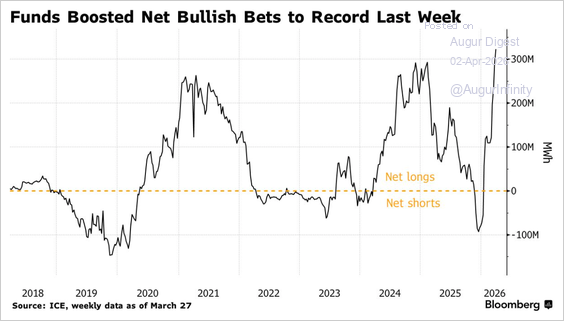
Source: @markets Read full article
6. Dated Brent, the price of shipments bought and sold in the North Sea and the most important price for real-world oil barrels, surged above levels seen when Russia invaded Ukraine.
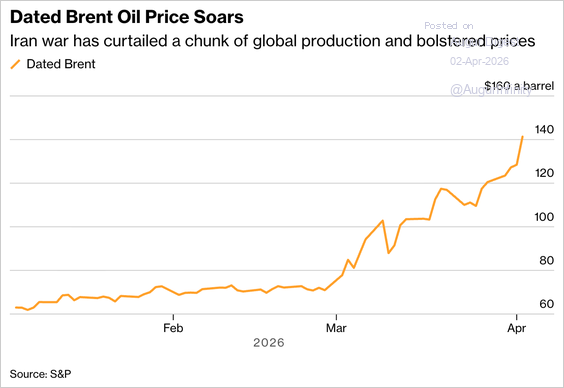
Source: Bloomberg Read full article
Commodities
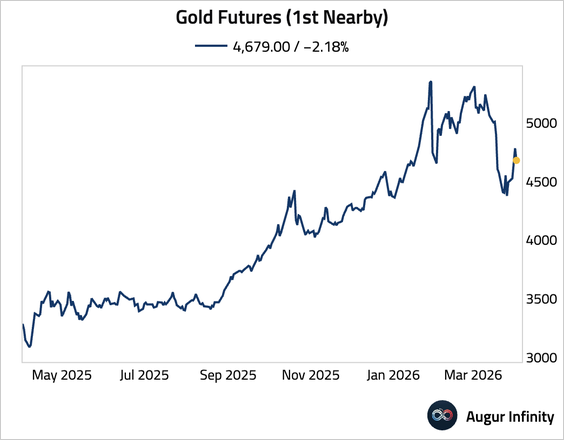
1. Bullion is on track to break a four-day rally.
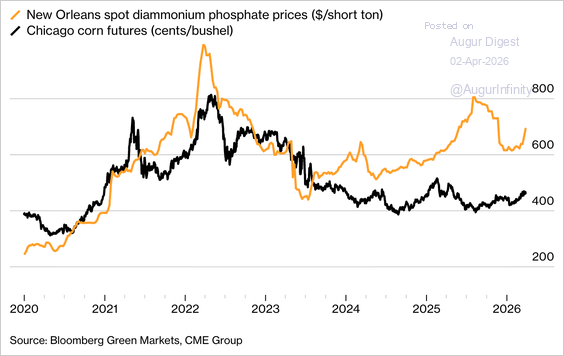
2. Phosphate fertilizer prices have risen sharply relative to corn prices, worsening farmers’ input-cost-to-output-price ratio.
Source: @markets Read full article
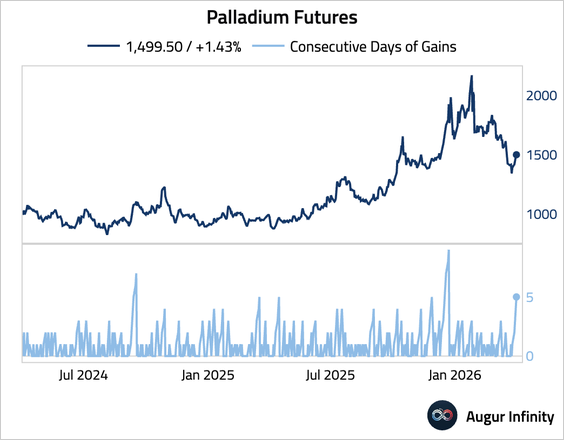
3. Palladium has gained for five consecutive days.
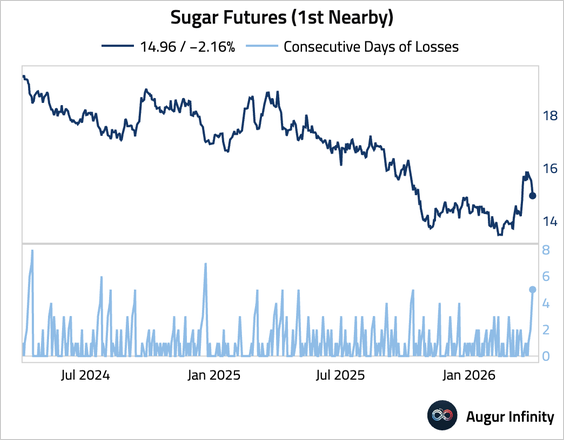
4. Sugar fell for five consecutive days.
Alternatives
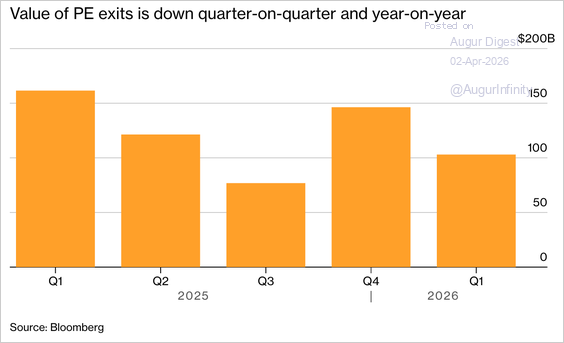
1. Private equity exits fell 36% year over year in Q1. Elevated entry valuations, higher financing costs, AI-driven tech weakness, and geopolitical risks are constraining dealmaking.
Source: @markets Read full article
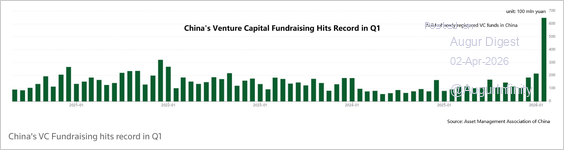
2. China’s venture capital fundraising hit a quarterly record in Q1 2026, driven overwhelmingly by state-backed funds targeting strategic technologies such as AI, robotics, and quantum computing, raising concerns about market distortions and valuation bubbles.
Source: Reuters Read full article
3. OpenAI now commands a $852 billion valuation. This chart puts that in context.
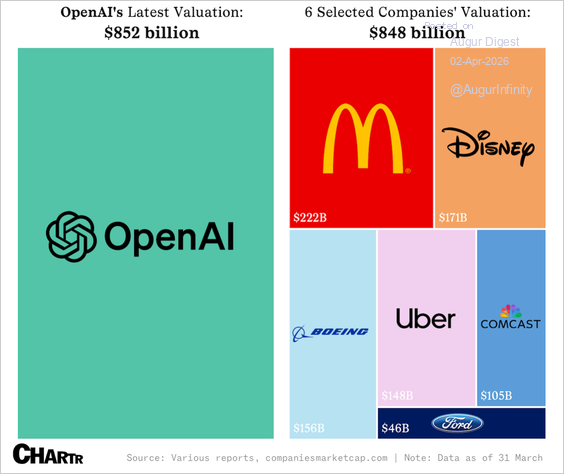
Source: Sherwood Read full article
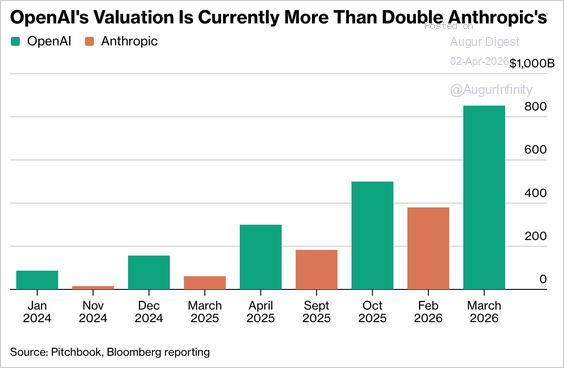
• Demand for OpenAI shares has weakened sharply on the secondary market, with sellers struggling to find buyers, while investors increasingly favor Anthropic—viewed as offering a more attractive risk-reward profile and stronger growth potential at half the valuation.

Source: Bloomberg Read full article