In Focus
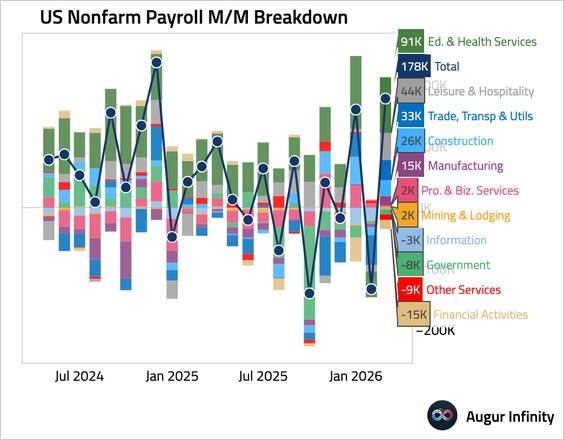
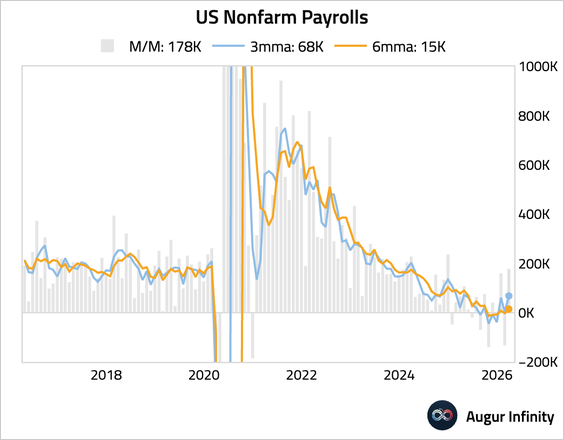
1. Nonfarm payrolls jumped by 178,000 in March, almost triple the consensus estimate.
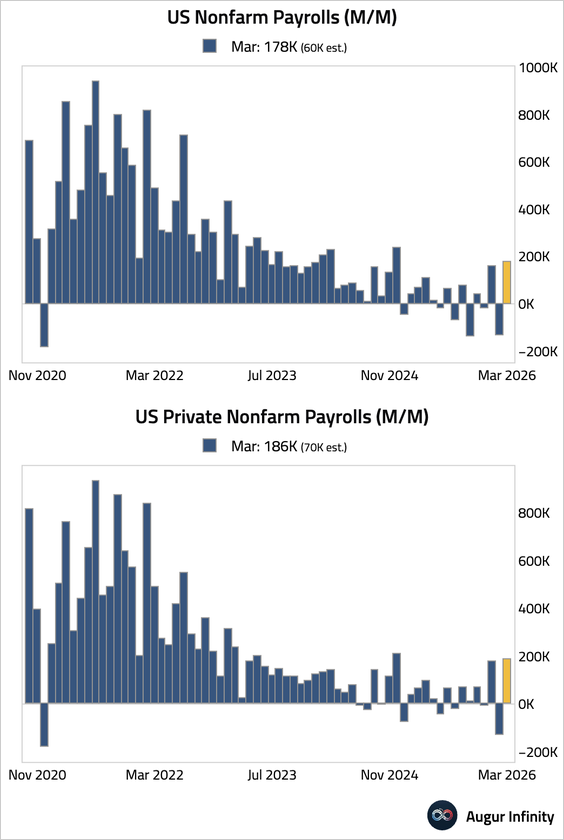
• Education and health services led the rebound, partially reflecting the end of the strike by healthcare professionals at Kaiser Permanente, which added back about 32,000 jobs. Leisure and hospitality employment also jumped, thanks to the return of more normal weather.
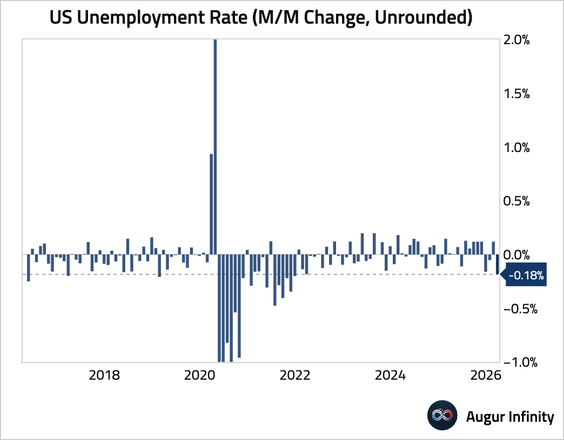
2. The unemployment rate unexpectedly dipped by 10 basis points to 4.3%, below consensus.
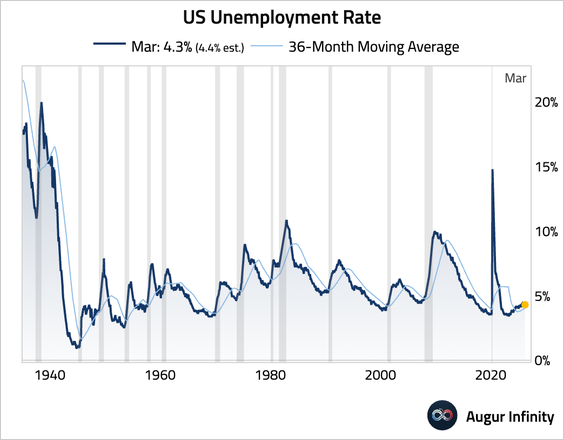
• On an unrounded basis, the one-month decline in the unemployment rate was the largest since December 2021.
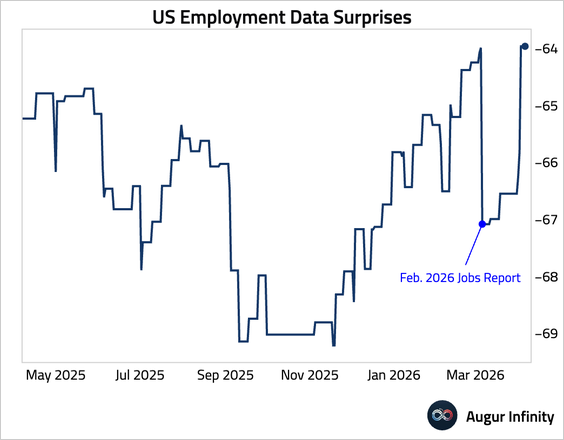
3. The strong report pushed our employment data surprise index sharply higher.
4. While the labor market has shown ample signs of stabilization, the strong headline figures above likely overstate the underlying momentum.
• When smoothed for month-over-month volatility, job growth has decelerated significantly, with recent data stabilizing at much lower levels.
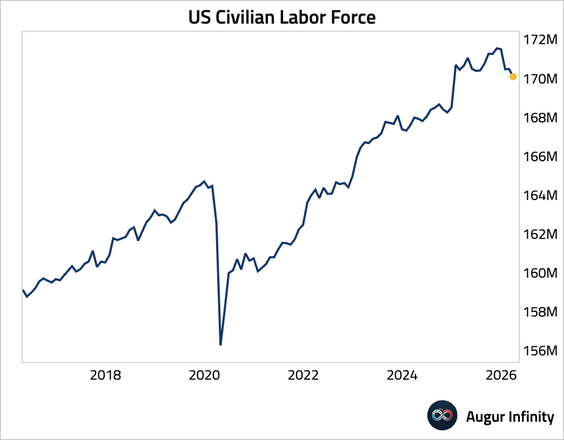
• The decrease in the unemployment rate was primarily driven by a decline in the labor force.
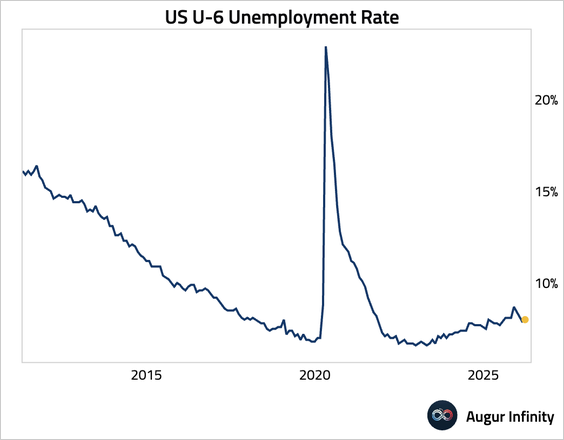
– The <b>under</b>employment rate (U6) actually ticked up.
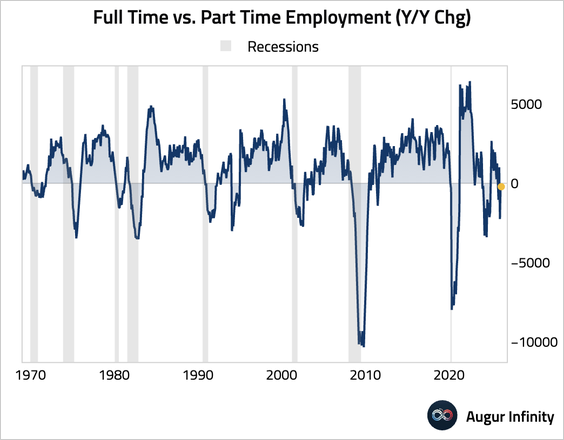
• The spread between the year-over-year changes in full-time and part-time employment, which tended to fall below zero around recessions, has been negative for three consecutive months.
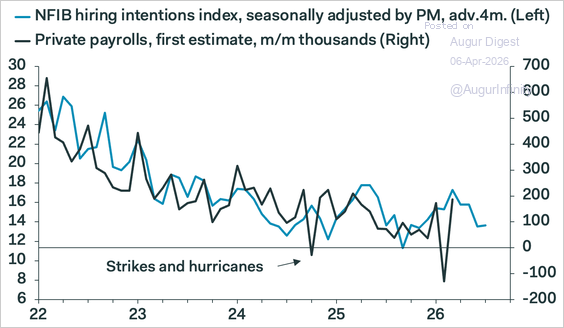
5. Looking ahead, job growth is likely to remain subdued, with NFIB hiring intentions having declined.
Source: Pantheon Macroeconomics
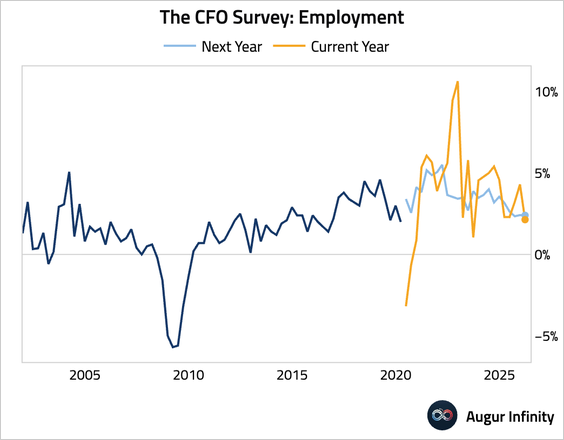
– The employment component of the CFO survey also points to more modest job growth ahead.
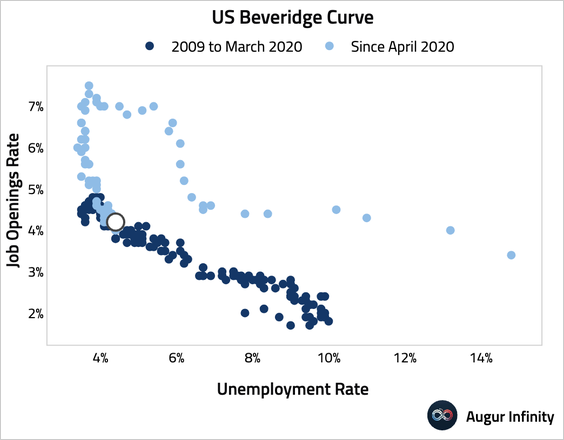
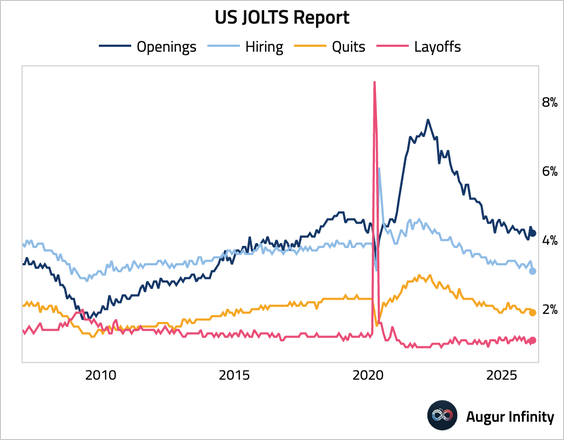
• Job openings eased according to JOLTS, and the more timely data from Indeed suggest further moderation is likely.
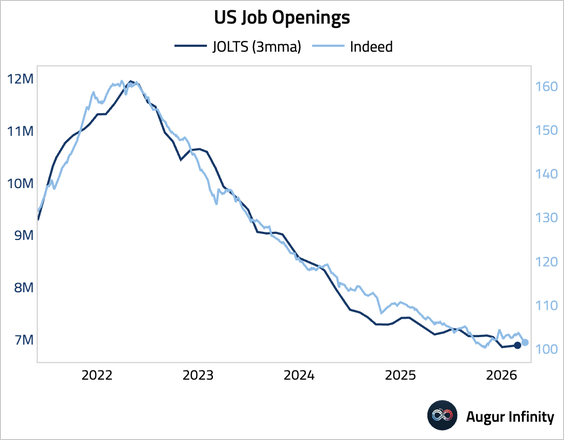
– As we mentioned <a href="https://thedailyshot.com/2026/04/01/oil-falls-on-optimism-that-the-iran-conflict-may-soon-end/">recently</a>, the economy has reached the “kink” in the Beveridge curve. A further decline in the job openings rate is likely to push up the unemployment rate.
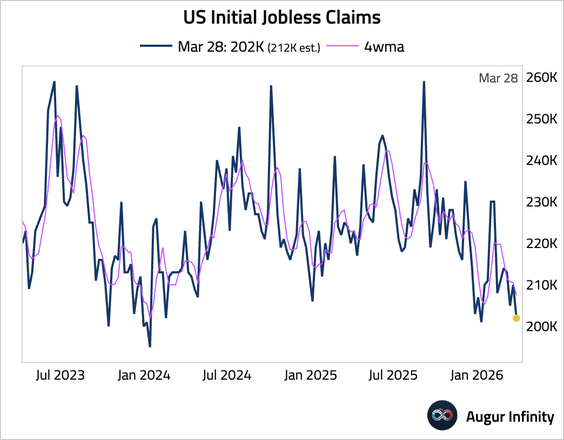
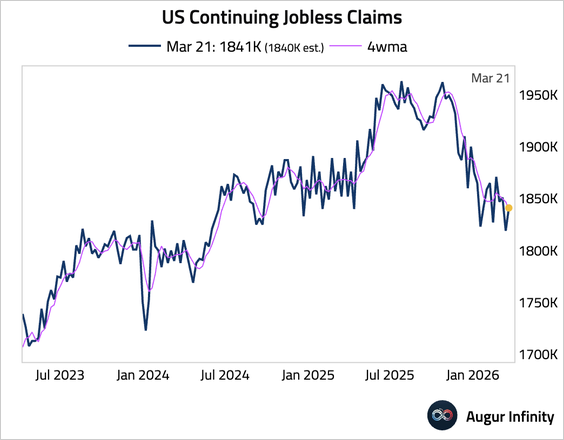
6. While hiring has been muted, there have not been many firings either. Initial jobless claims fell to 202,000, below consensus and near a two-year low, signaling limited layoffs.
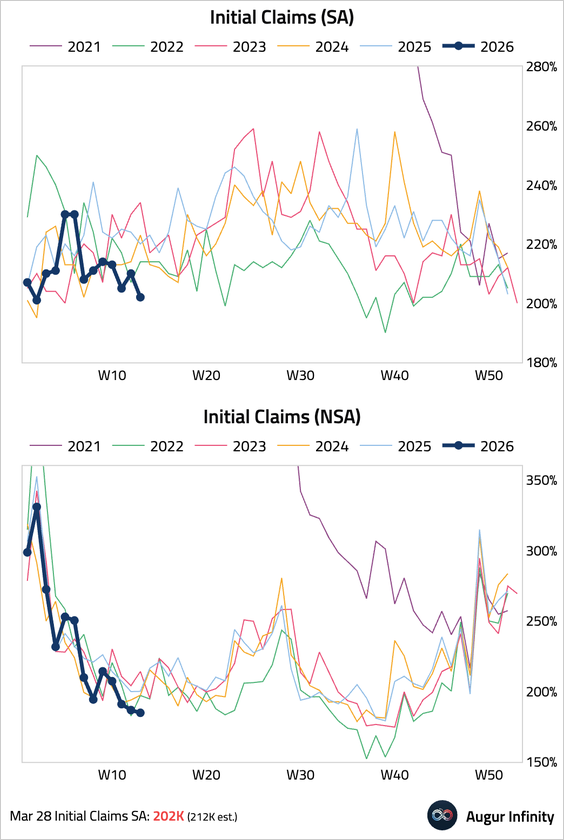
– The four-week moving average fell for a sixth consecutive week.
• Continuing claims edged up, but remained lower than the same period last year.
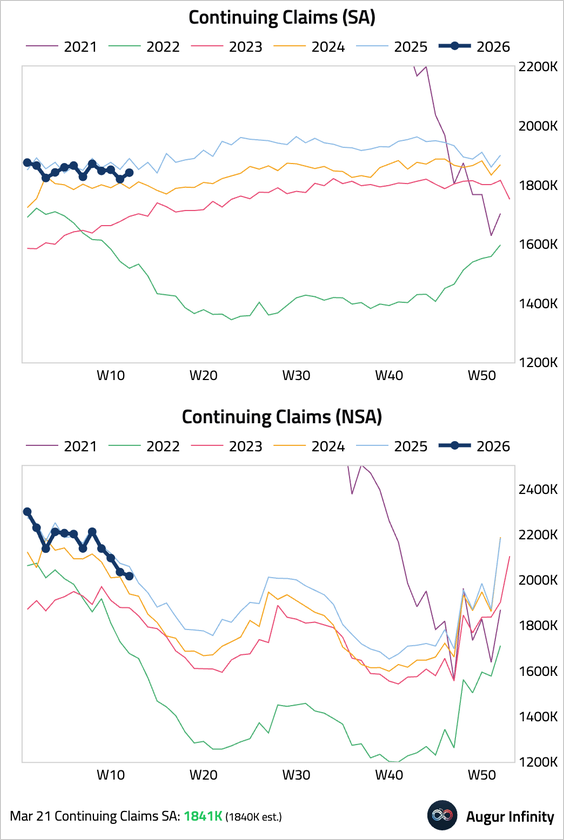
– The four-week moving average continues to decline as well.
7. <b>Putting these pieces together, the labor market remains in the “low hire, low fire” mode.</b> The silver lining is that such low job growth might be more tolerable than before, as breakeven employment growth has declined, according to Fed estimates.
• Federal Reserve:
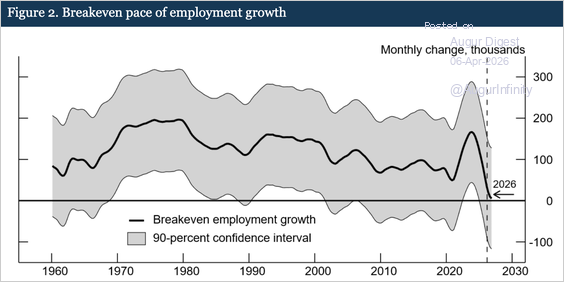
Source: Federal Reserve
• Dallas Fed:
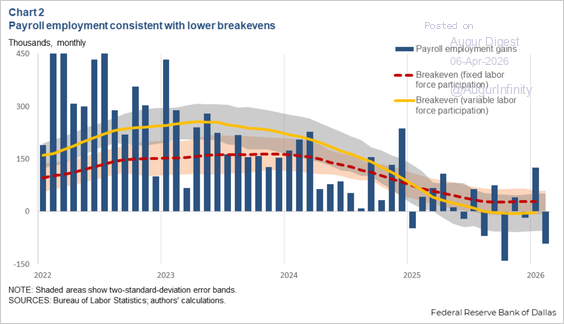
Source: Federal Reserve Bank of Dallas
8. At this point in the cycle, labor supply and demand are roughly in balance.
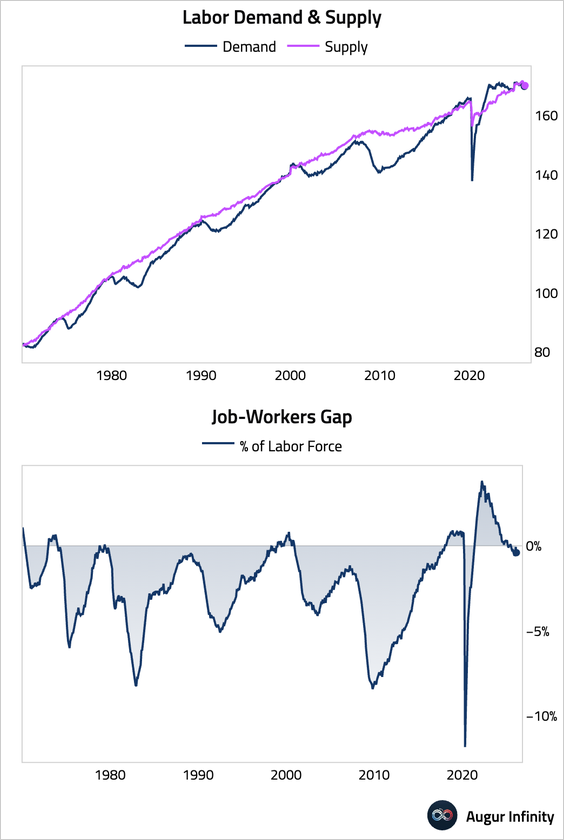
• However, falling openings, hiring, and voluntary quits, paired with an uptick in layoffs, suggest that the balance of power is shifting toward employers.
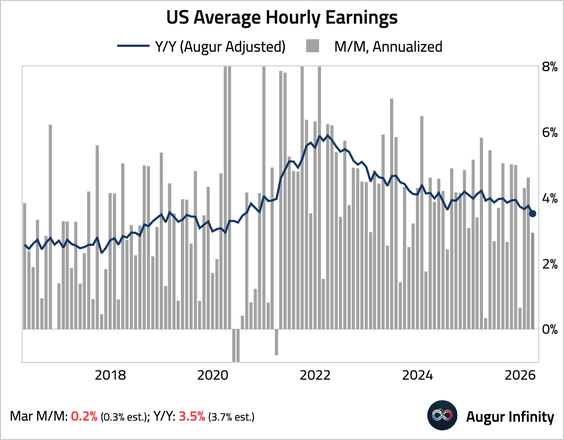
• Wages—the price that clears the supply and demand for labor—continue to moderate.
9. Finally, here are a few more employment-related charts that caught our eye.
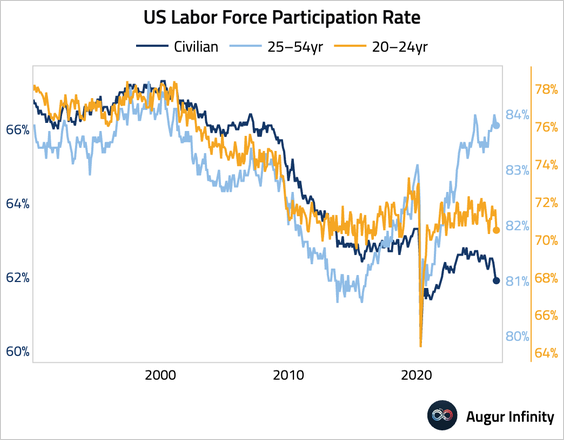
• The participation rate declined across age groups, but was particularly pronounced among 20–24-year-olds.
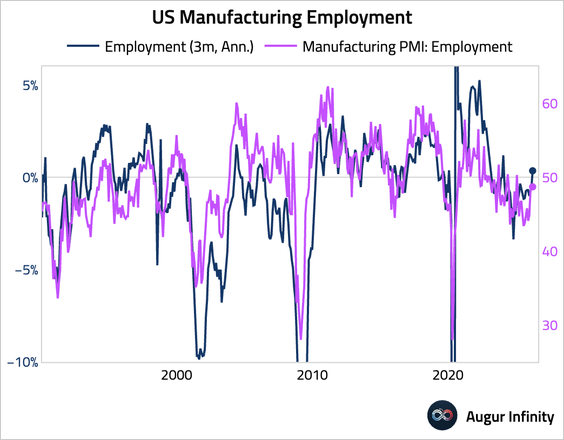
• Manufacturing employment has improved.
• Employment in the information sector continues to slide, with the cyclical peak coinciding with the release of ChatGPT.
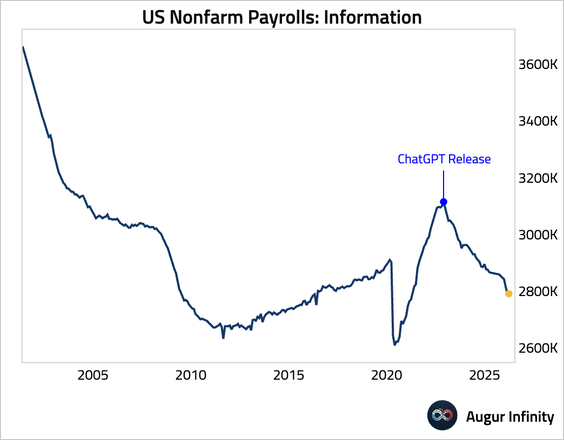
h/t @KevRGordon
• Wage growth for education and health services has fallen much more than that for the overall private sector.
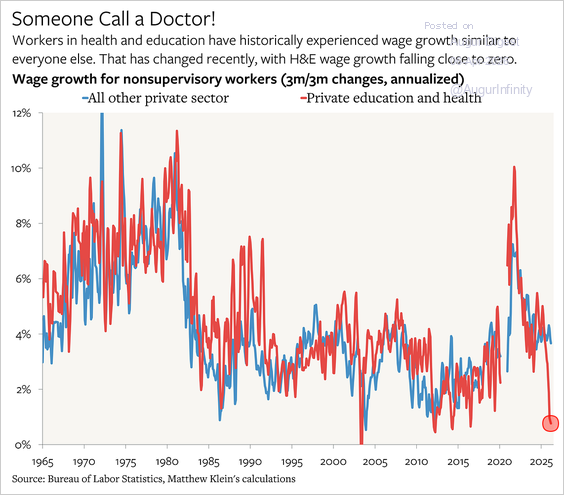
Source: The Overshoot
The United States
1. The service-sector growth slowed more than expected.
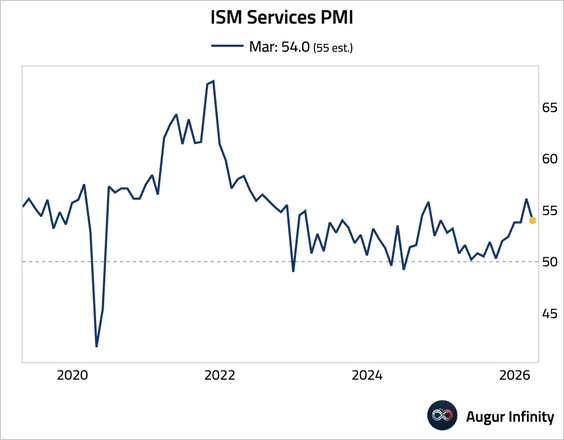

Source: Reuters Read full article
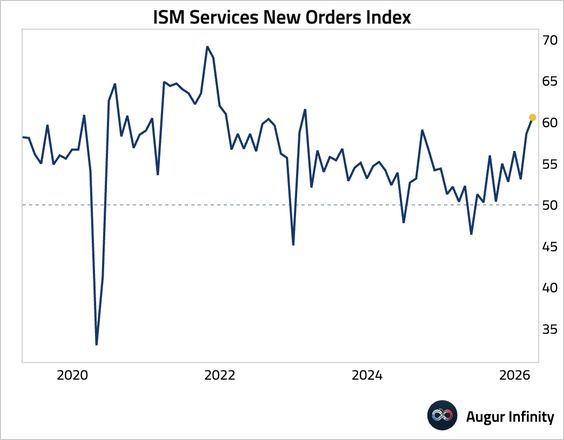
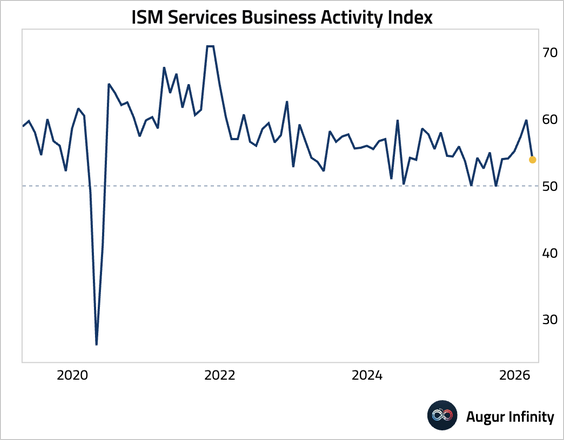
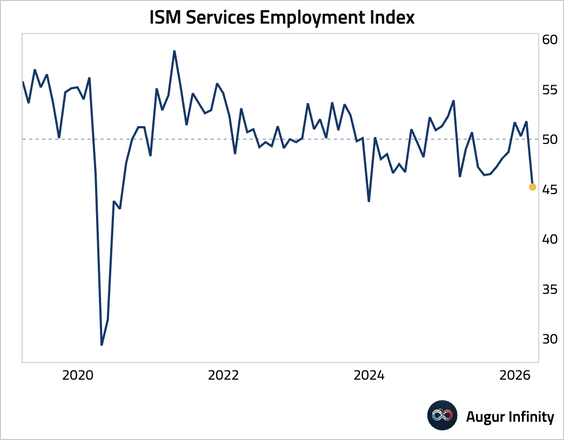
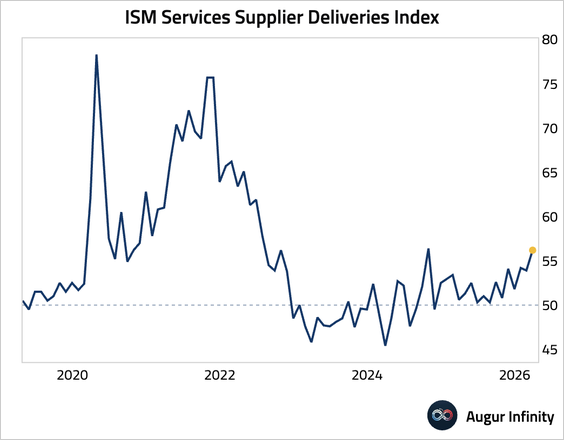
– Here’s a look at the contribution of each component.
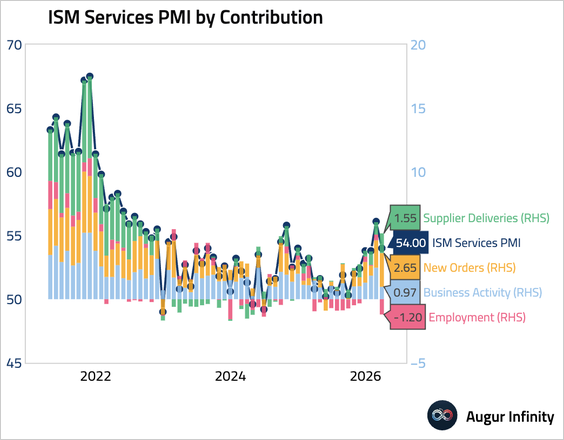
• The new orders component, the lone bright spot of the release, climbed to a three-year high, signaling some resilience in the demand pipeline.
• Other components generally weakened.
– The business activity index fell to a six-month low.
– The employment index slumped back into contractionary territory.
– The supplier deliveries component increased to its highest level since October 2024, reflecting supply disruptions linked to the Iran conflict rather than stronger demand.
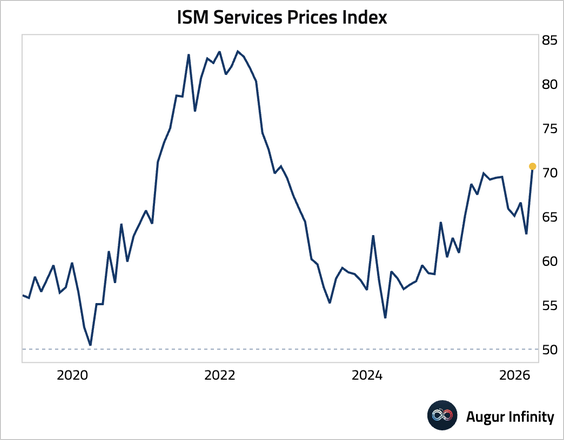
• Price pressures surged to the highest level since October 2022, with firms citing higher fuel prices and inventory building to guard against potential supply disruptions.
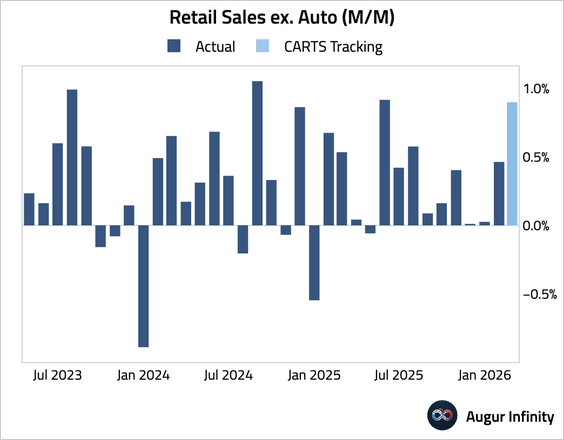
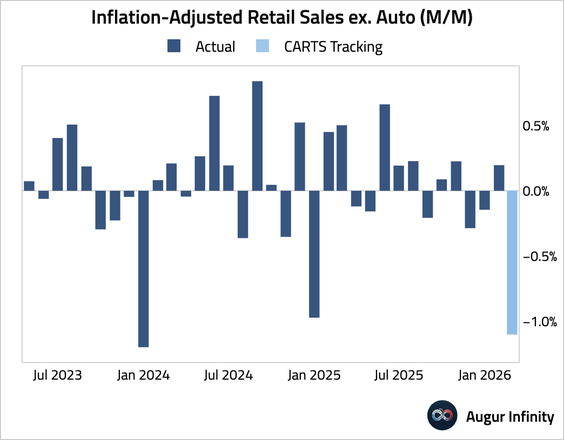
2. The Chicago Fed CARTS estimates that retail sales ex-auto for March rose by 0.9% month over month.
• However, the inflation-adjusted measure fell by 1.1%, the largest decline since January 2024.
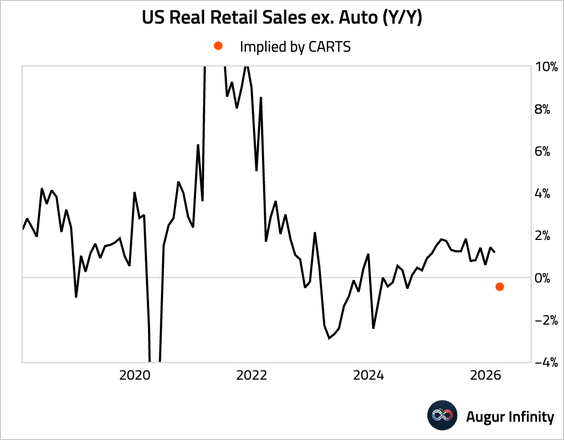
• Here are the year-over-year real growth rates, extended with the CARTS data for March. US consumption growth has weakened.
3. US trucking rates have climbed to their highest levels since 2022 as a surge in diesel prices and a shrinking driver pool push up fuel surcharges and shipping costs, adding to broader inflationary pressures.
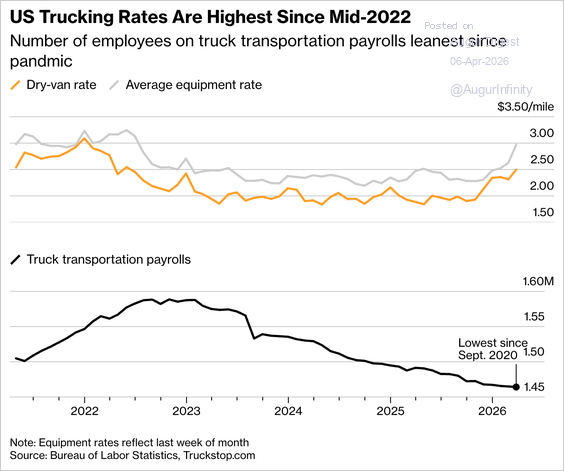
Source: @markets Read full article
Canada
1. Canada’s services sector remained in contraction in March, as Middle East–driven uncertainty weighed on demand and new business.
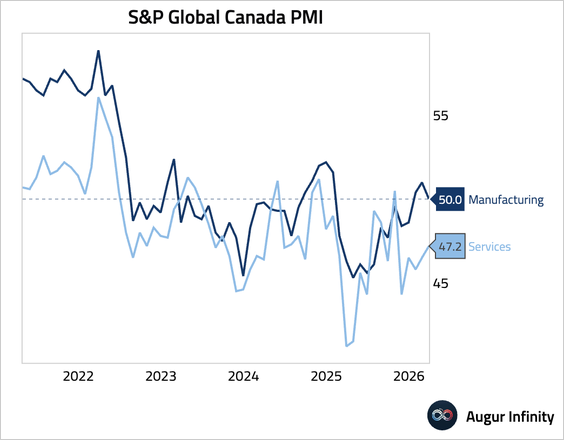
Source: S&P Global PMI
• Input prices accelerated to a nine-month high, driven by higher fuel, transportation, and labor costs amid Middle East–related disruptions.
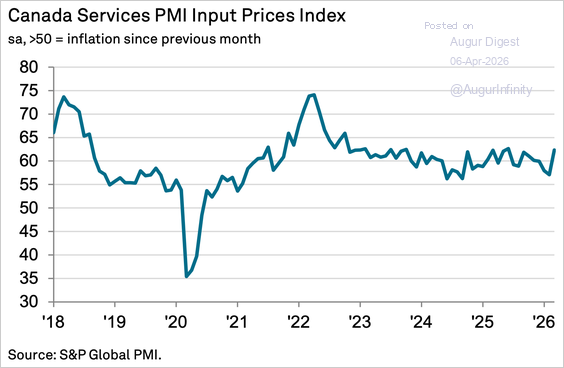
Source: S&P Global PMI
2. Consumer confidence fell to an 11-month low, as the Iran conflict exacerbated inflation concerns and labor market weakness.
Subscribe to read the rest.
Become a subscriber of Augur Digest Premium to see all 92 charts today.
Upgrade