In Focus
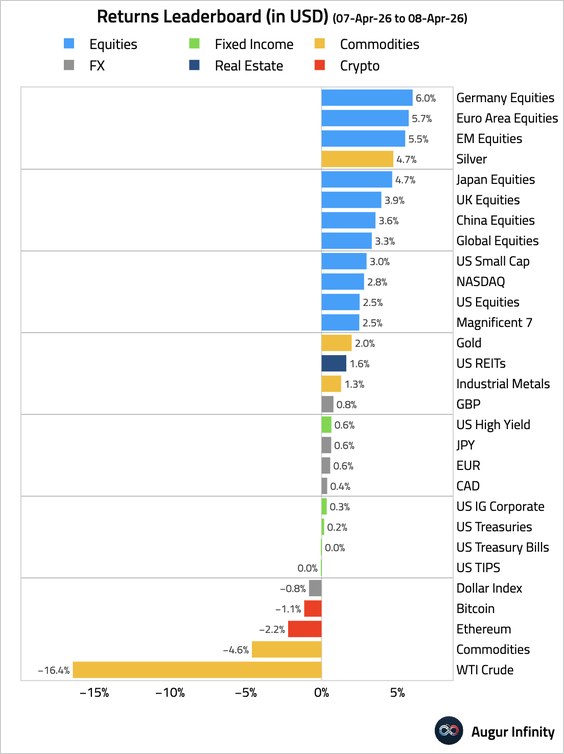
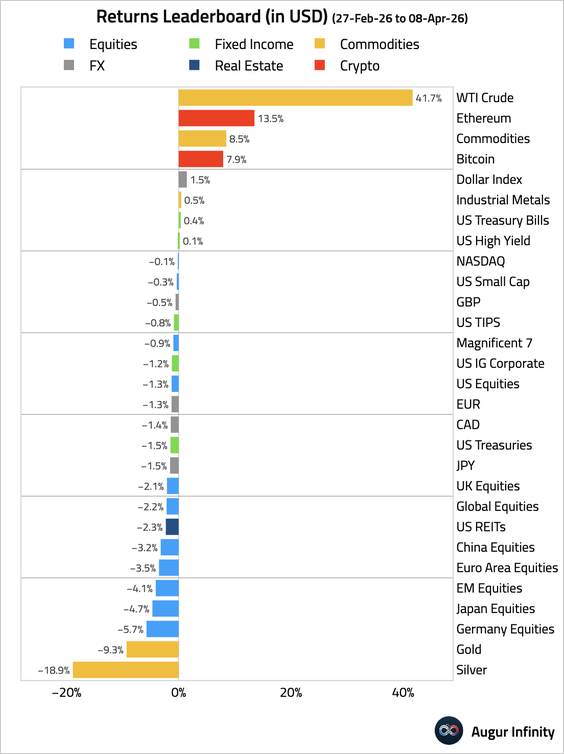
1. Global markets made big moves spurred by the two-week ceasefire agreement. Today’s In Focus takes a deep dive into how market pricing of economic conditions has shifted. To start, let’s look at some performance summaries.
– Yesterday:
– Since the Iran conflict began:
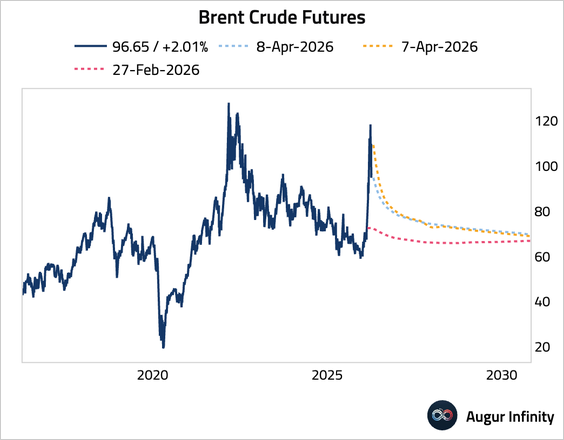
2. Oil prices fell sharply yesterday, with the decline concentrated at the front end of the futures curve. The term structure remains in deep backwardation, but prices are higher than pre-conflict levels across the curve.
3. Analysts slowed the pace of their upward earnings revisions but seem unconcerned about the impact of the energy shock on earnings.
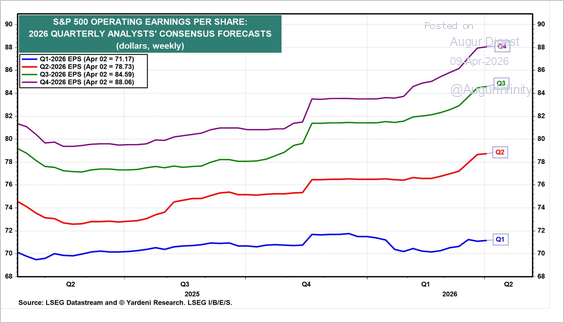
Source: Yardeni Research
– Consensus one-year-ahead revenue and earnings growth expectations are near multiyear highs, while long-term earnings growth has also remained elevated.
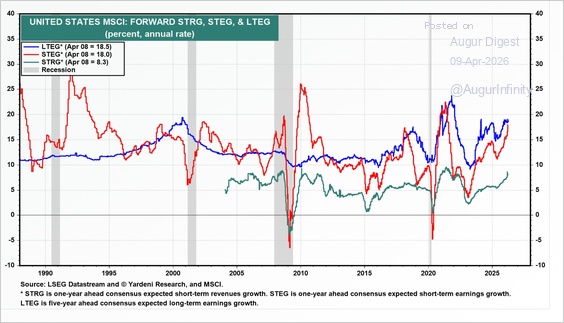
Source: Yardeni Research
• We can also evaluate the evolution of growth implied by markets. One way to tease that out is to look at the relative performance of risk-matched stocks and bonds. By this measure, markets are now pricing in <i>more</i> growth than just before the Iran conflict began.
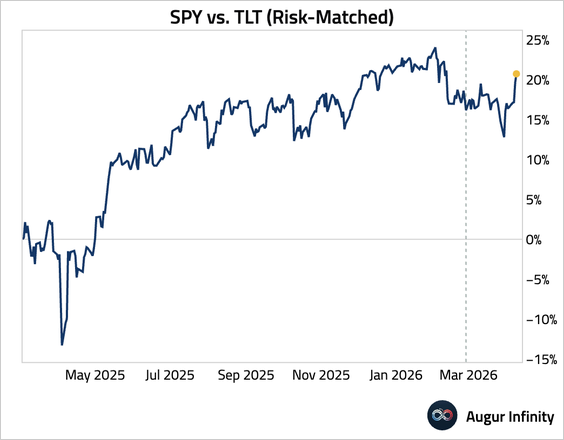
Source: h/t Bob Elliott Read full article
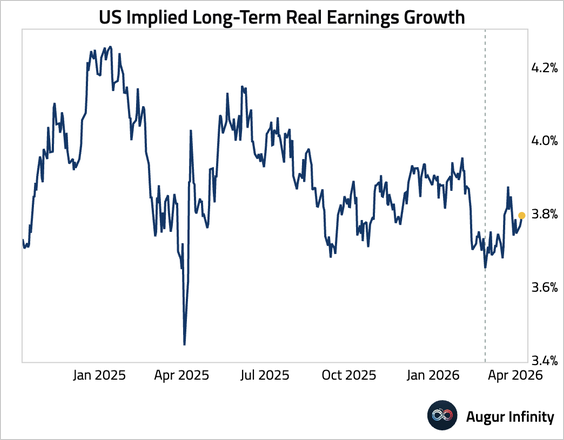
– The market’s implied long-term earnings growth, backed out using a simple dividend discount model, has also strengthened.
4. Turning to inflation, this chart shows the year-over-year CPI inflation implied by the fixings market for the rest of the year. Peak inflation (in May) is discounted to be 90 bps higher at 3.8%, while year-end inflation is priced to be 60 bps higher at 3.1%.
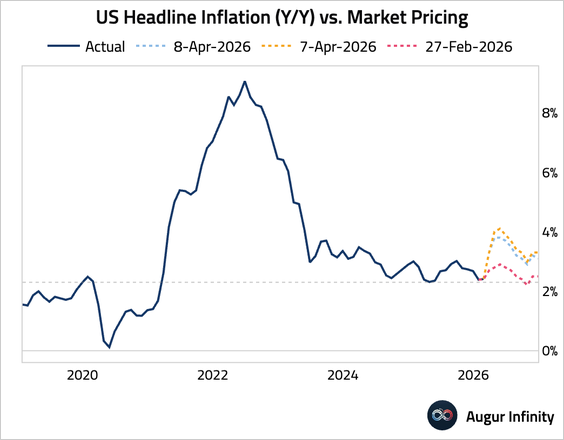
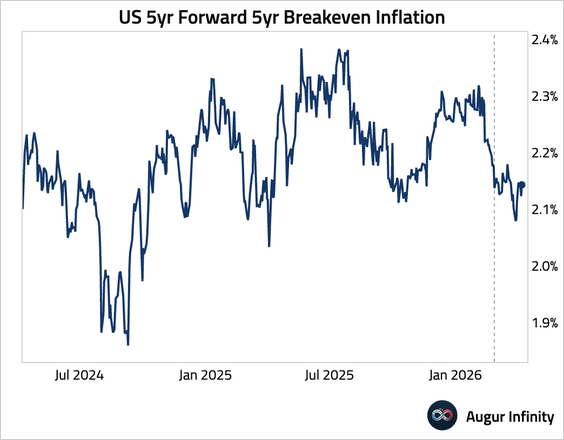
• This jump in inflation is discounted to be transitory, with longer-term inflation expectations little changed since the conflict began.
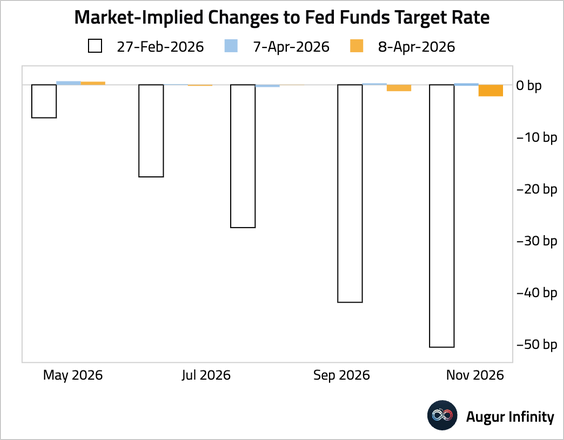
5. In terms of monetary policy, short-rate expectations have shifted dramatically from 50 bps of cuts to roughly no change in policy rates this year.
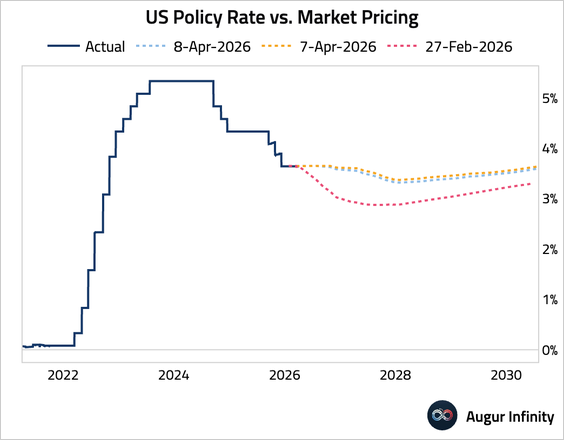
– The next chart shows the level of policy rates priced in over a longer horizon. Fed policy is discounted to be stable except for a negligible amount of easing baked into 2027 forward rates.
6. Putting it together, the markets are simultaneously pricing in 1) higher oil prices, 2) higher-than-pre-conflict growth, 3) higher near-term inflation that can be managed by the Fed remaining on hold, and 4) stable long-term inflation achieved via a small amount of easing that ends with a higher level of rates. What stands out the most is that the more restrictive rates and higher oil prices are discounted to coincide with stronger growth. One or more markets appear mispriced.
The United States
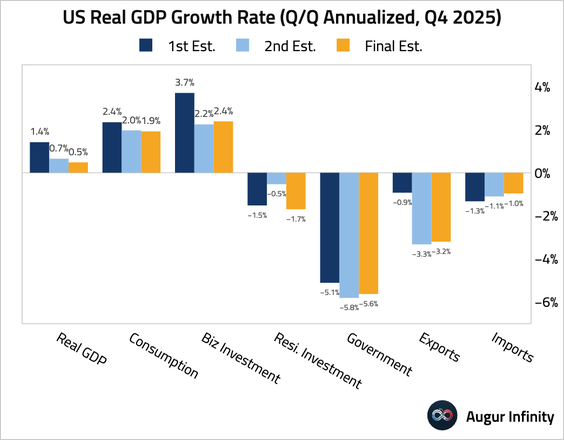
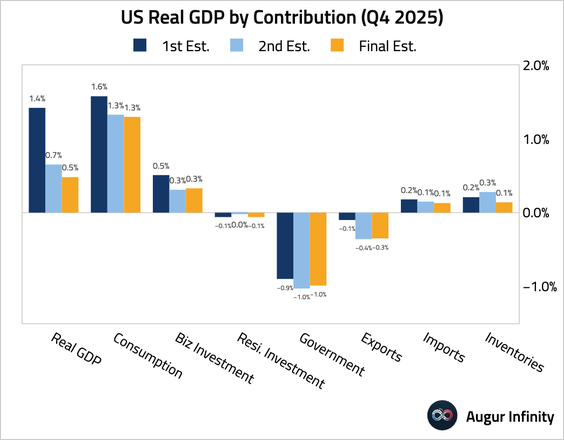
1. The Q4 GDP growth rate was revised down further to 0.5% (Q/Q SAAR) from an initial estimate of 1.4% and a second estimate of 0.7%.
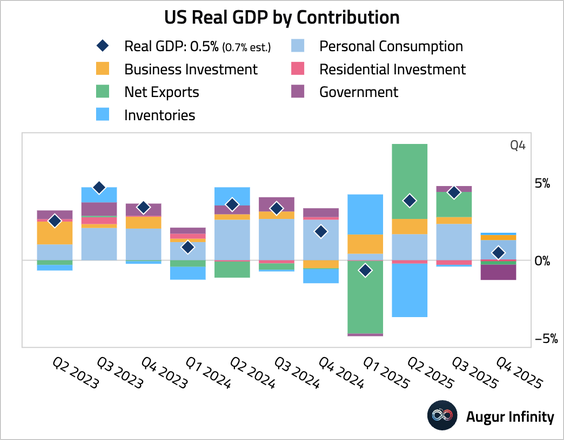
– The downgrade was driven by further downward revisions to consumer spending, residential investment, and inventory accumulation.
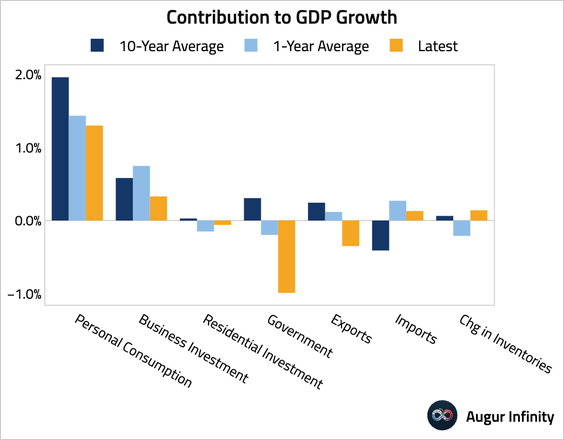
– This chart compares the contribution of each component to the trailing one-year and ten-year averages.
– Stripping out government spending, net trade, and inventories, real final sales to private domestic purchasers still saw robust expansion but were revised down 10 bps to 1.8%.
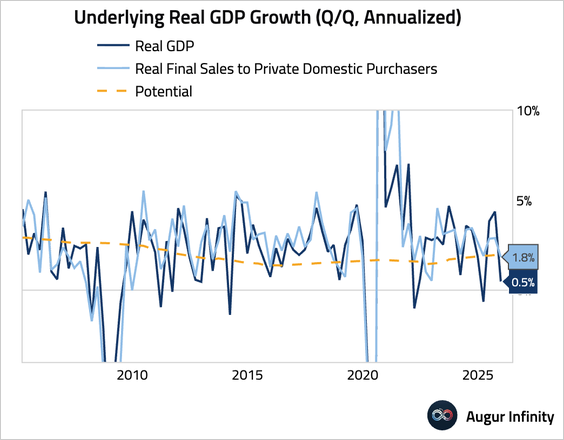
• Looking beyond Q4, the Atlanta Fed’s latest Q1 GDPNow reading is 1.3%.
Subscribe to read the rest.
Become a subscriber of Augur Digest Premium to see all 92 charts today.
Upgrade