In Focus
1. Private credit, or non-bank lending, has grown significantly over the past decade. Preqin data show global private credit AUM at $1.78 trillion as of the first half of 2025, with $1.28 trillion having been deployed.
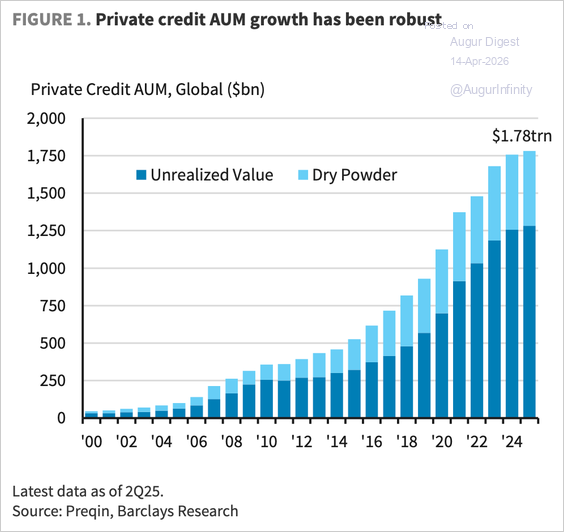
Source: Preqin via Barclays Research
– $767 billion of the deployed capital is in North America.
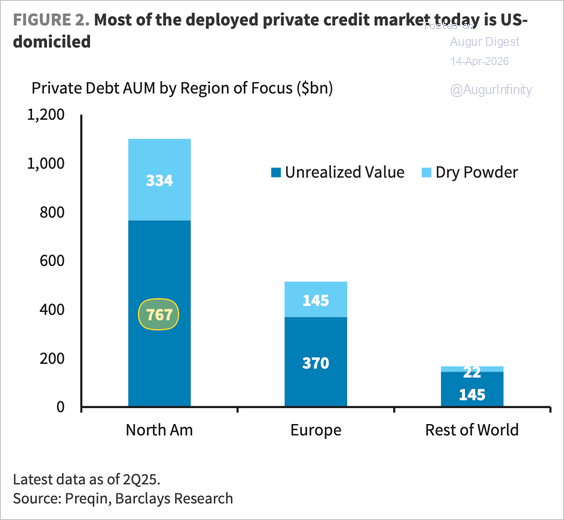
Source: Preqin via Barclays Research
• These estimates, however, exclude Business Development Companies (BDCs). When BDCs—whose AUM has grown to $530 billion—are added, <b>the size of the deployed private credit market is closer to $1.3 trillion in the US</b>. For comparison, the US high-yield bond and leveraged loan markets are <i>each</i> about $1.5 trillion in size.
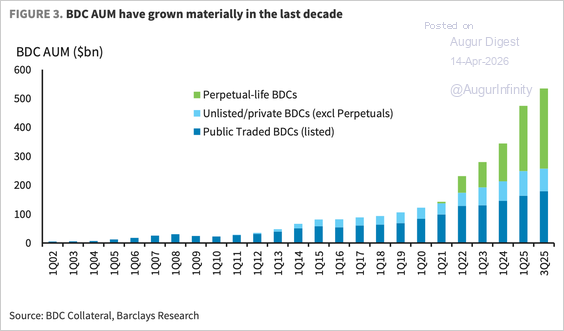
Source: Barclays Research
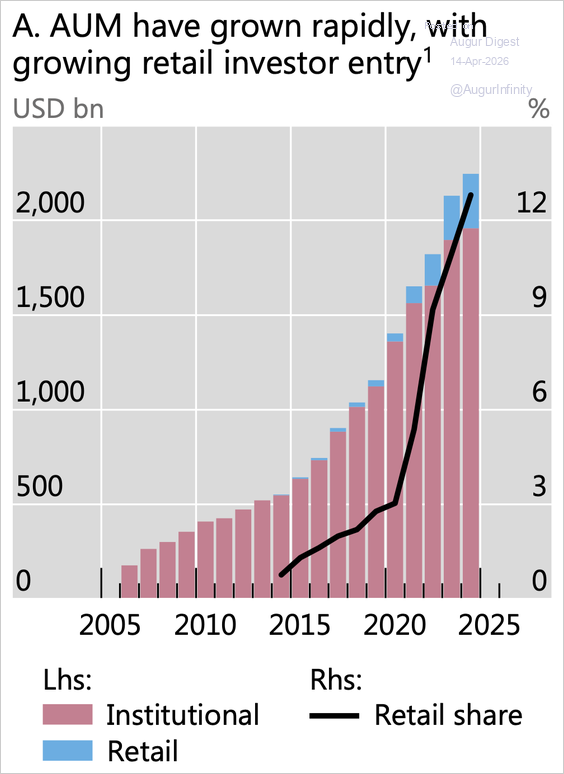
2. Traditionally, private credit funds operate mostly as closed-end structures that lock in institutional capital for the entire life cycle, underwriting loans meant to be held to maturity (four to eight years). The end exposure of these funds tends to be long-term asset allocators, who expect to be compensated with an excess return over public markets. Pensions, endowments, and foundations had over $500 billion in exposure to private credit at the end of 2024 and intended to add more in 2025, according to Barclays.
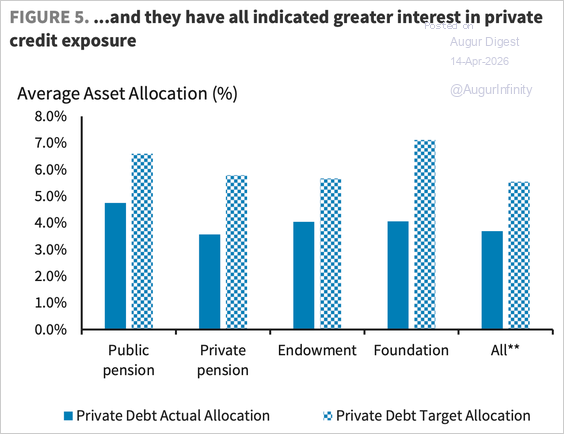
Source: Barclays Research
• More recently, the share of retail investor participation has risen to almost 13%, mainly through BDCs and private credit ETFs (note that the chart below is for global private credit and includes dry powder).
Source: BIS Read full article
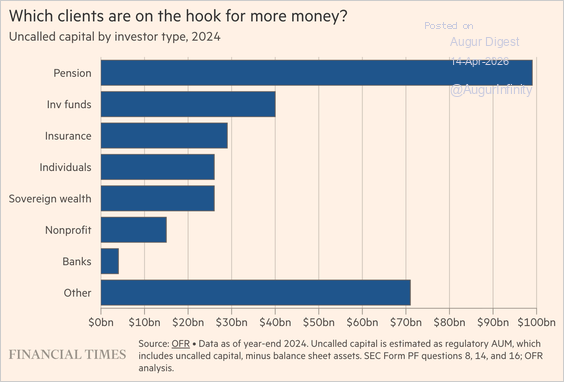
• The Office of Financial Research (OFR) estimates that private credit funds have around $310 billion in uncalled capital commitments from investors.
Source: OFR via @financialtimes Read full article
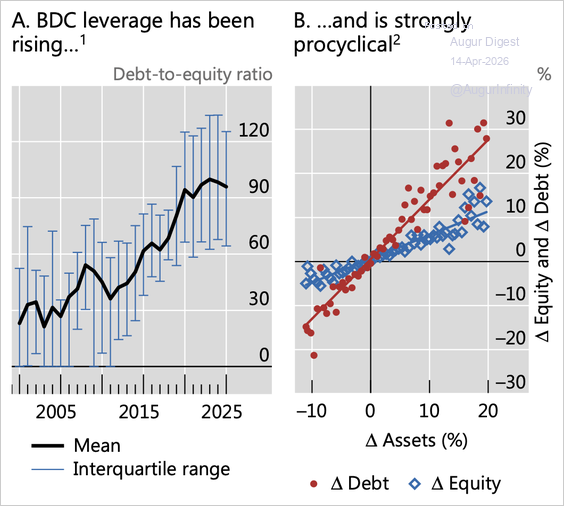
3. Private credit funds are mostly unlevered or relatively lightly levered (and significantly overcollateralized) pools of capital. Even so, the average BDC debt-to-equity ratio has tripled over the past 15 years.
4. The private credit market is currently navigating a period of stress driven by challenges associated with the software sector, concerns about underwriting standards, and a surge in retail redemption requests.

Source: @markets Read full article
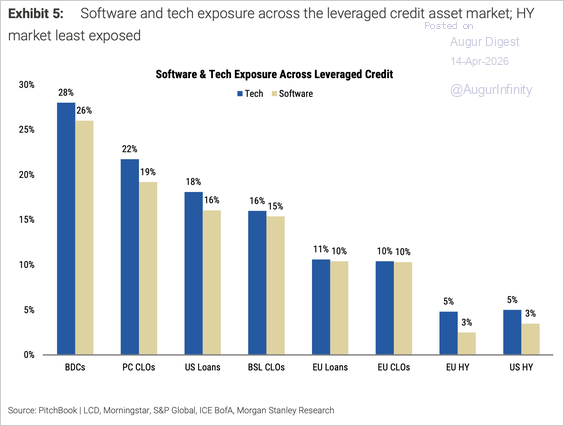
• Many private credit funds have become highly concentrated in a handful of sectors, particularly software.
Source: Morgan Stanley Research
• Redemption requests surged in Q1, …
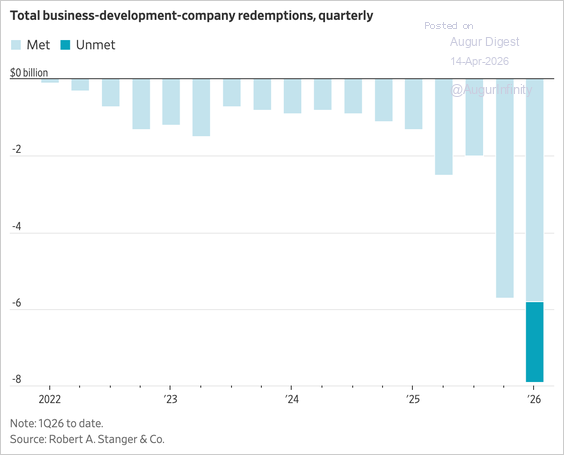
Source: @WSJ Read full article
… causing a growing number of funds to cap withdrawals.
Source: @financialtimes Read full article
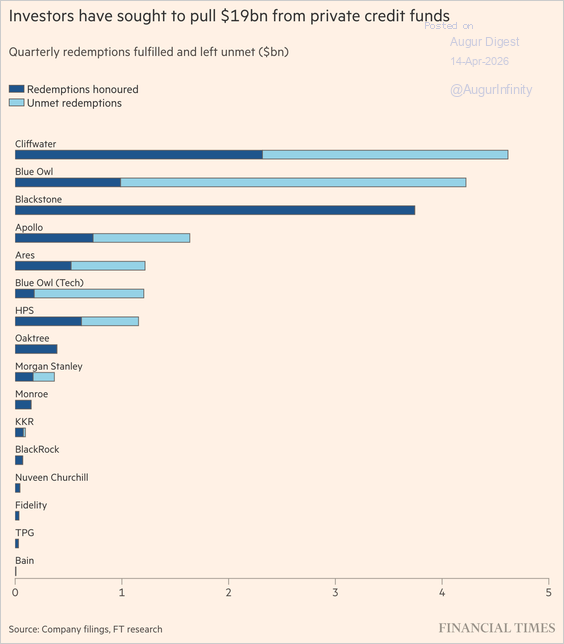
– Here is a look at the trends in redemption requests at major funds.
Source: @markets Read full article
• Publicly traded BDCs are trading at significant discounts to their net asset values.
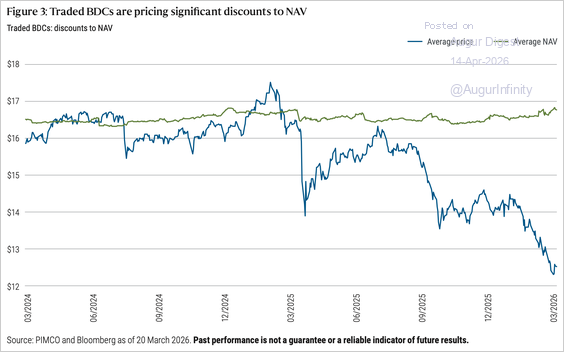
Source: PIMCO Read full article
– BDC spreads have widened sharply, significantly underperforming investment-grade credit, and are now trading wider than both investment-grade and BB high-yield comparables.
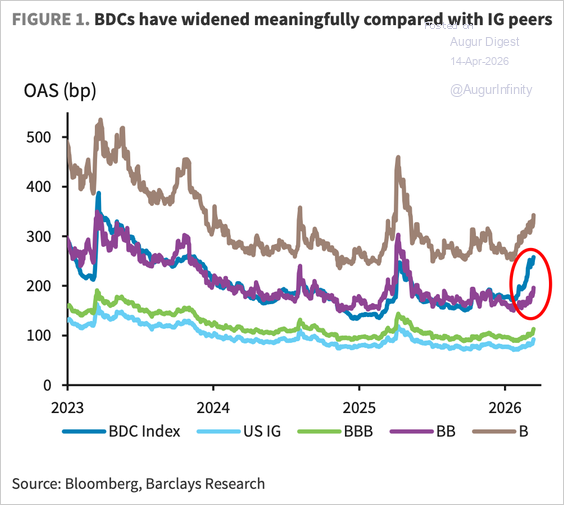
Source: Barclays Research
• The default rate depends on whether we include selective defaults, such as distressed exchanges, maturity extensions, and the substitution of payment-in-kind for cash interest (i.e., paying interest with additional debt). Excluding selective defaults, the trailing-12-month default rate is low (about 1%) and in line with the leveraged loan market (after applying the same exclusion). Including selective defaults, the default rate is elevated relative to history.
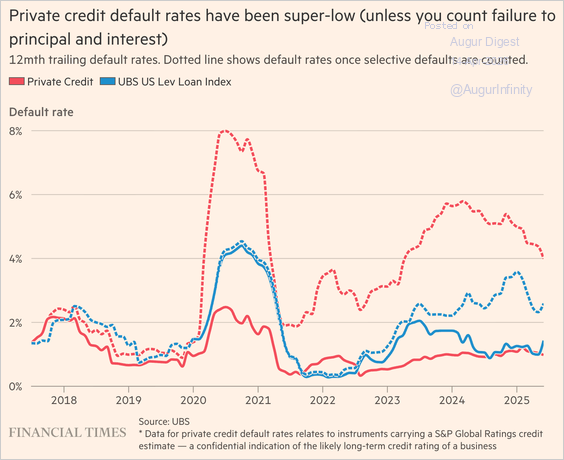
Source: @financialtimes Read full article
5. The key question is whether the private credit sector poses a systemic risk.
• US bank direct exposure to private credit providers is about $300 billion (1.5% of total bank assets) and most of the exposure is via first-lien senior secured loans, giving banks priority in the event of default.
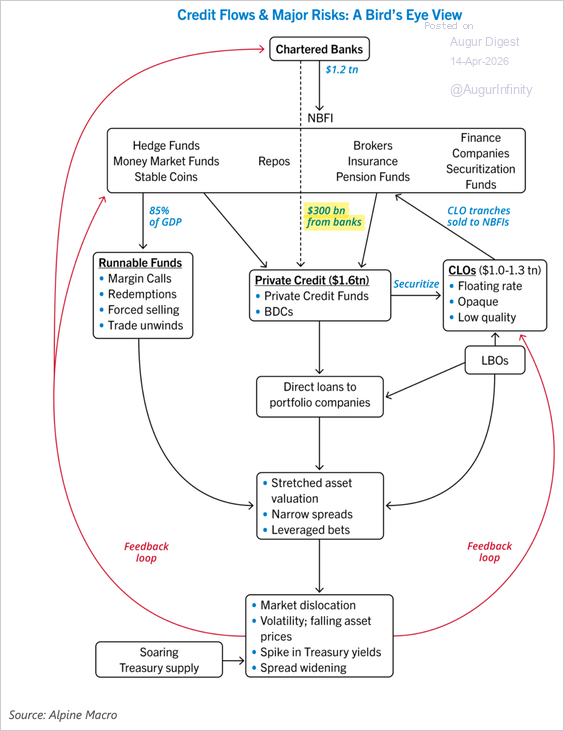
Source: Alpine Macro
– Unutilized bank lending commitments, needed to manage outflows or create new private loans, are potentially a larger issue, with the IMF estimating 15% of US banks facing liquidity stress in a worst-case scenario. While that is unsettling to markets, it is unlikely to trigger a banking crisis, according to Alpine Macro.
• The OFR’s highest estimate for private-credit counterparty exposure is $540 billion.
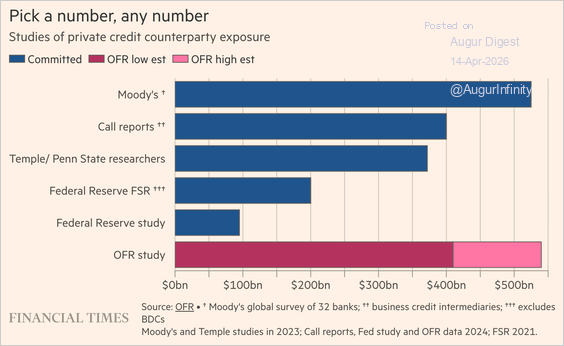
Source: @financialtimes Read full article
– This chart puts that number ($540 billion) into perspective (the red dot).
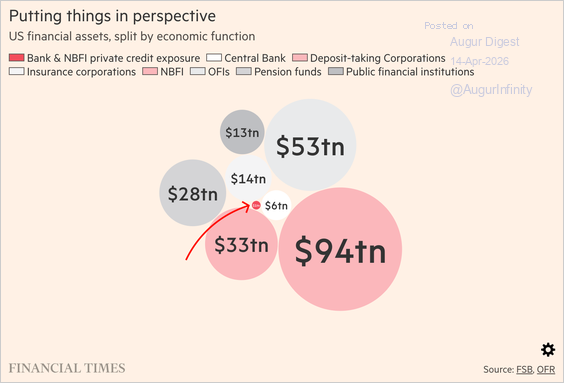
Source: @financialtimes Read full article
6. <b>Overall, the private credit market does not appear to pose a systemic risk. However, stress in the sector could still weigh on growth, directly as deal activity declines and indirectly as banks tighten lending standards.</b>
• It’s also worth mentioning that the subprime mortgage sector was modest in size prior to the global financial crisis—not to mention that there could be hidden linkages that are sometimes only obvious with the benefit of hindsight.
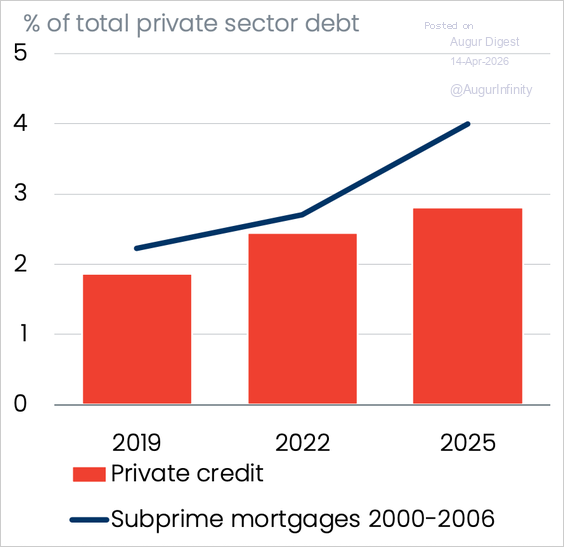
Source: Oxford Economics
The United States
1. March headline PPI rose 0.51% month over month, while core PPI inflation was even tamer at 0.09%, both well below consensus.
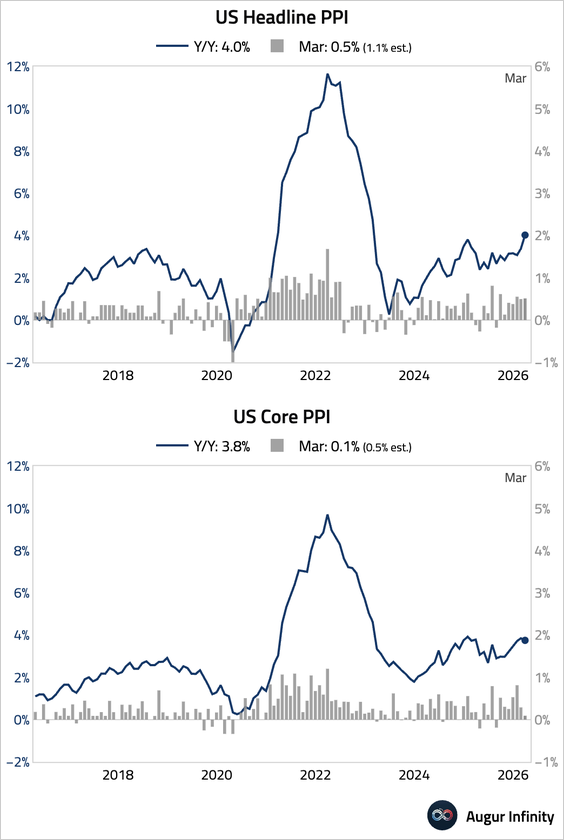
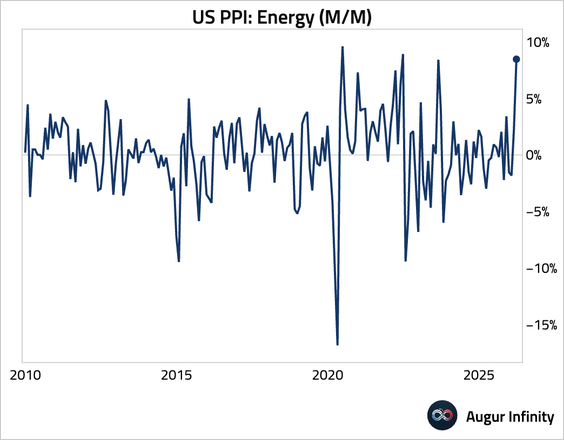
• Energy prices surged, led by gasoline prices, as expected.
• Excluding energy and food, core goods prices rose by a soft 0.2%, while core services prices were nearly unchanged.
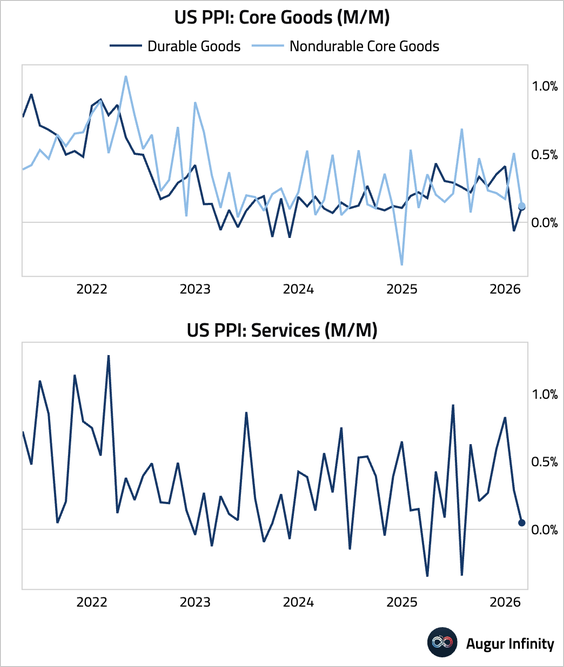
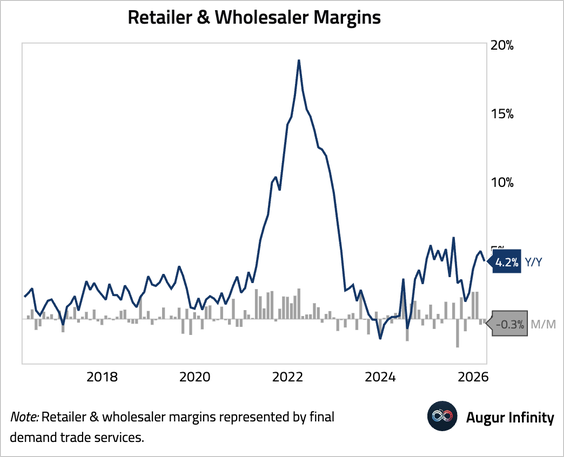
• Business markups fell for a second consecutive month.
• Incorporating the PPI data, Nomura forecasts that core PCE moderated to 0.259% month over month in March.
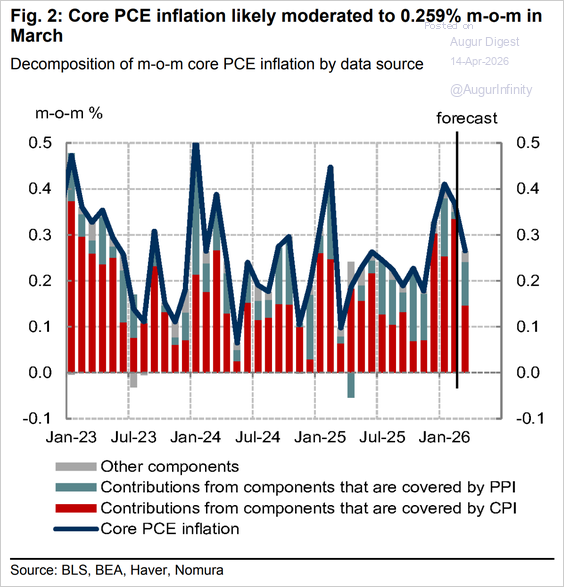
Source: Nomura Securities
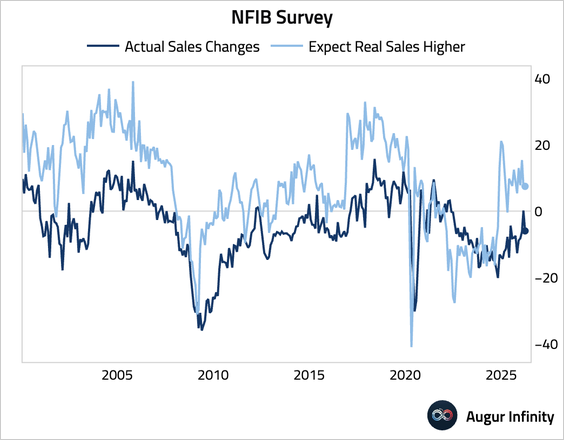
2. The NFIB Small Business Optimism Index fell for the third consecutive month to the lowest level in nearly a year.
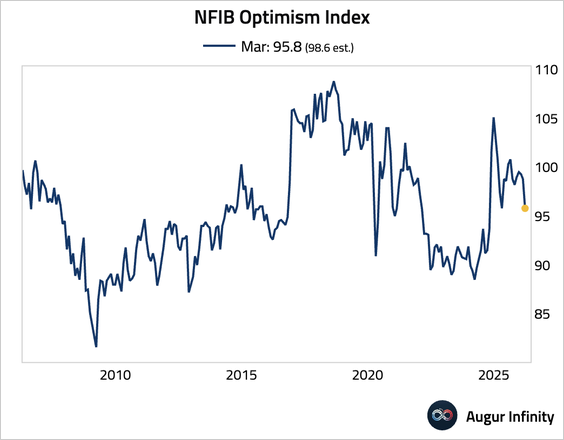
• Sales (worsened):
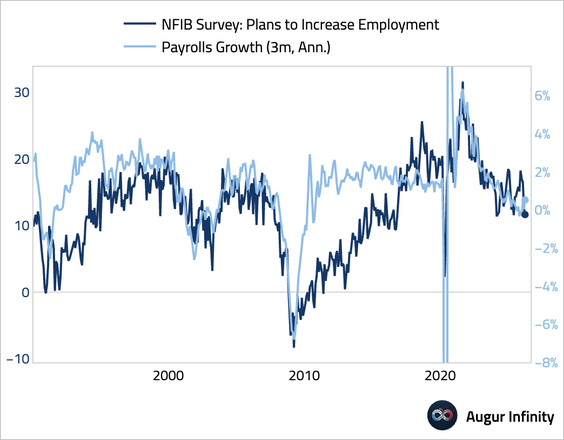
• Hiring intentions (stable after falling for three months and around the low end of the post-pandemic range):
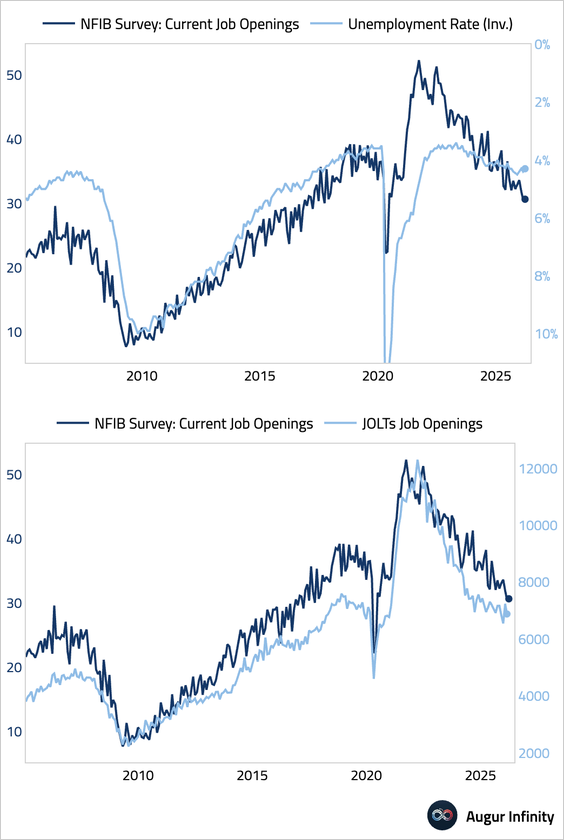
• Job openings (also near the lowest level since the pandemic):
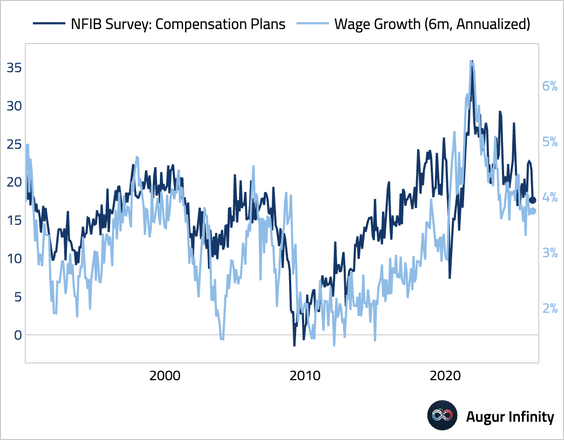
• Wage plans (fell):
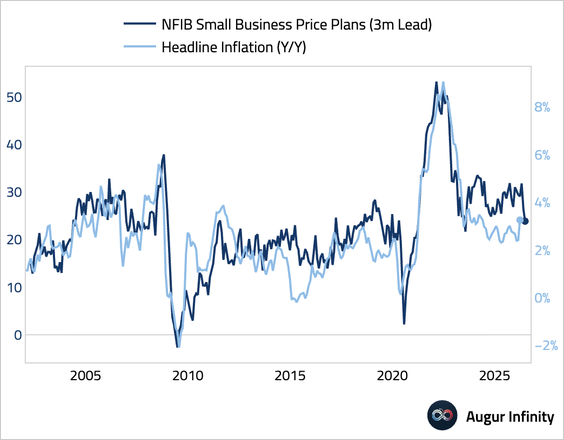
• Price plans (eased):
• Capex intentions (worsened and depressed relative to history):
Subscribe to read the rest.
Become a subscriber of Augur Digest Premium to see all 101 charts today.
Upgrade