The United States
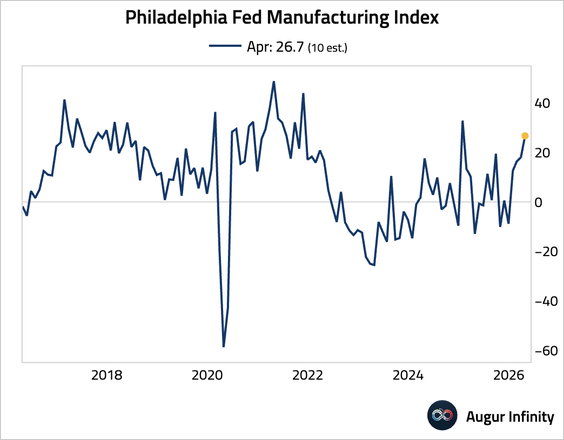
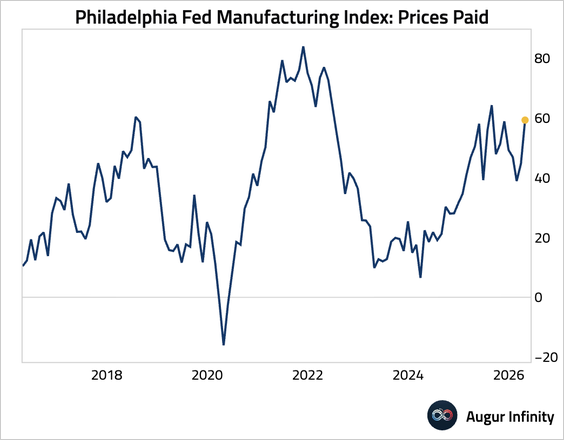
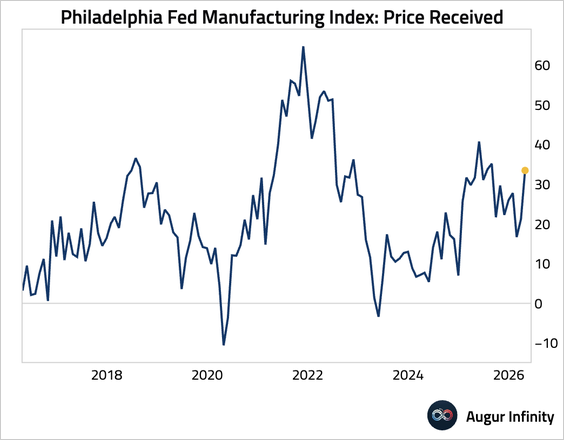
1. The Philadelphia Fed’s manufacturing index surged, crushing expectations.
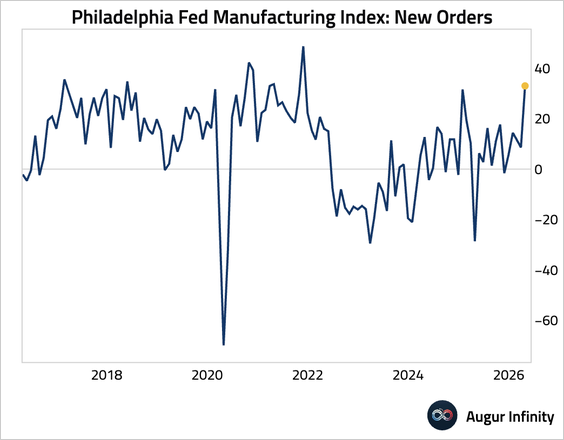
• Shipments hit the highest level since late 2021, …
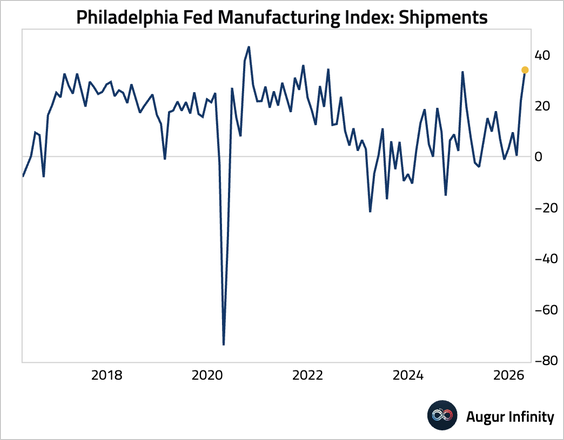
… so did new orders.
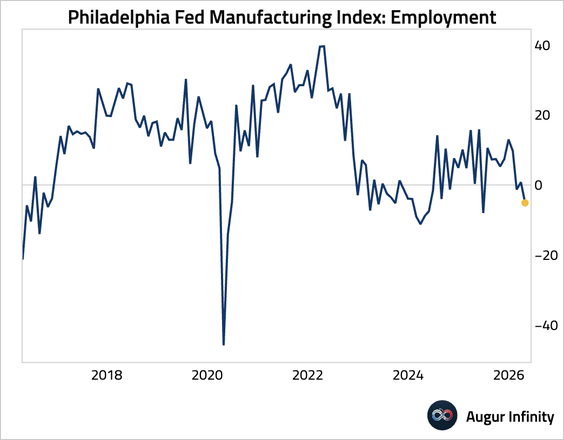
• The employment component fell back into contractionary territory.
• Price pressures jumped.
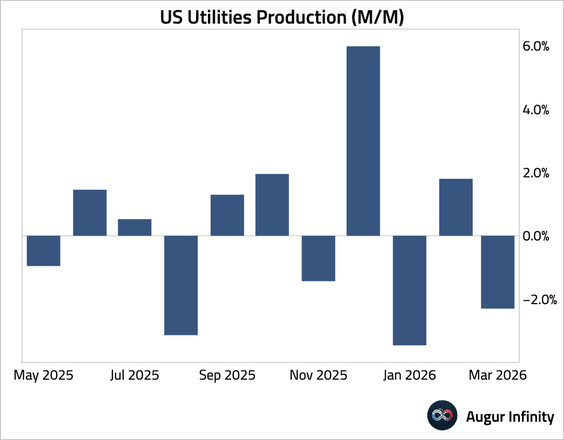
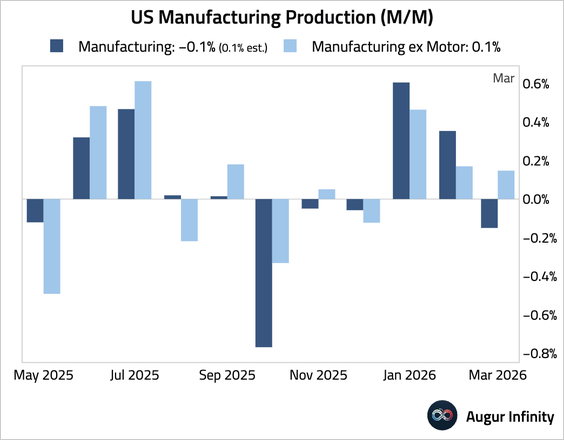
2. The first industrial production report covering the US–Iran conflict period showed that output unexpectedly contracted.
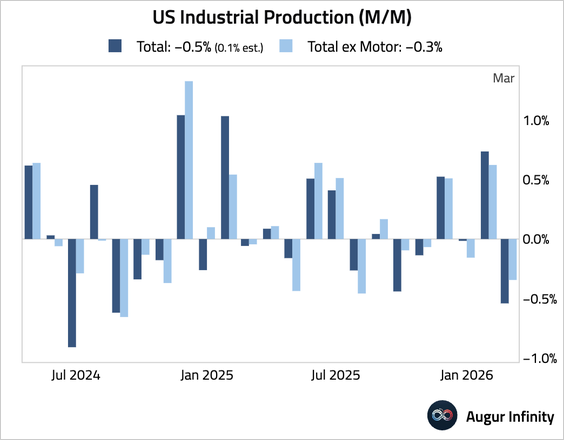
– The drop was driven by a fall in utilities, perhaps due to unusually warm weather.
• Manufacturing output also dipped due to weakness in the volatile motor vehicle sector. Manufacturing excluding motor vehicles edged up.
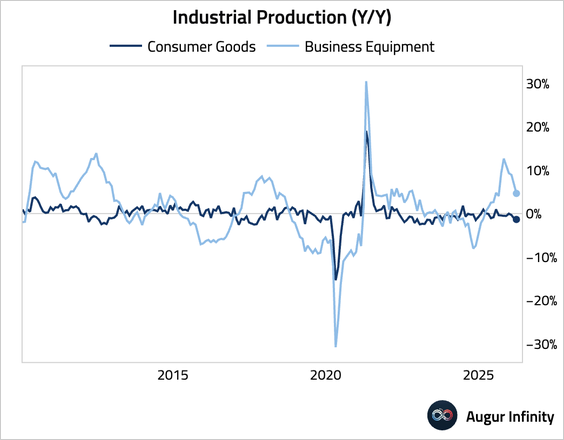
• Production of consumer goods continues to contract year over year, while the output of business equipment has also eased.
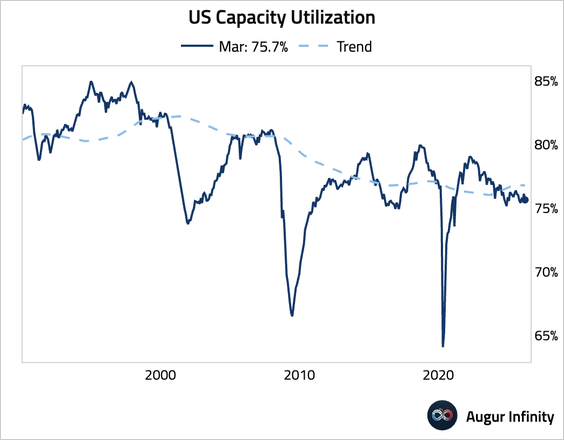
• Capacity utilization ticked down.
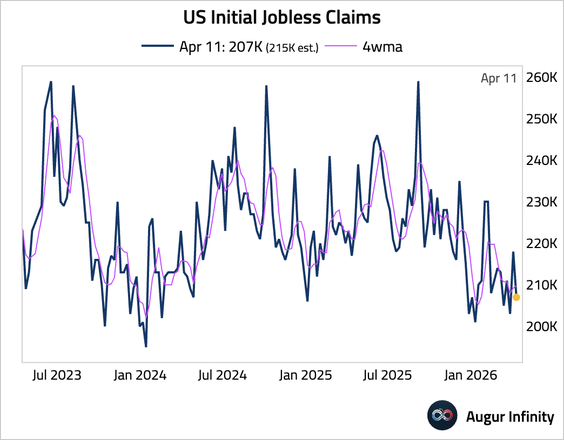
3. Initial jobless claims fell to 207K, below consensus.
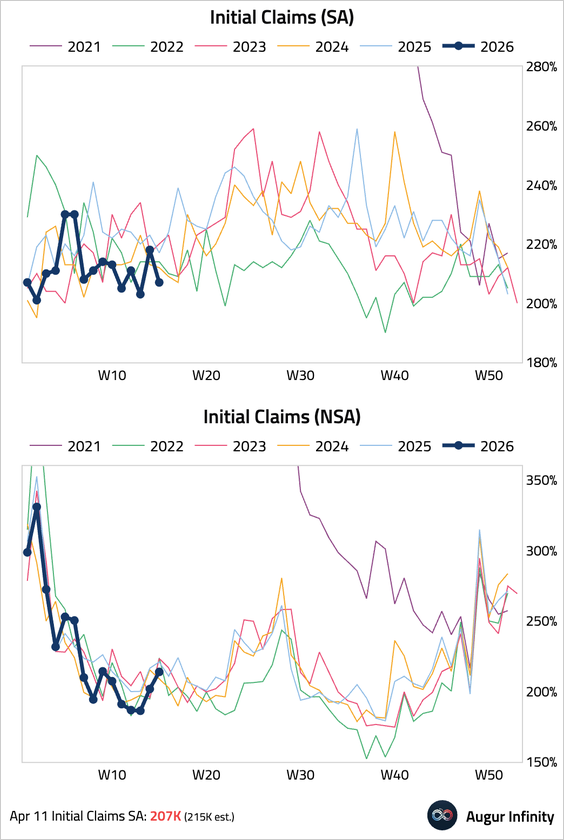
– The four-week moving average was stable and near a two-year low, signaling limited layoffs.
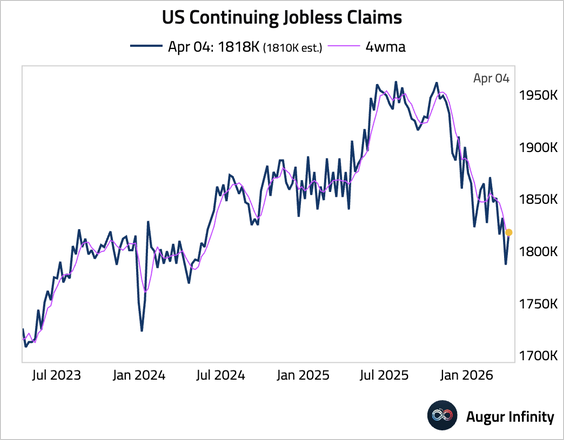
• Continuing claims edged up, but remained lower than the same period last year.
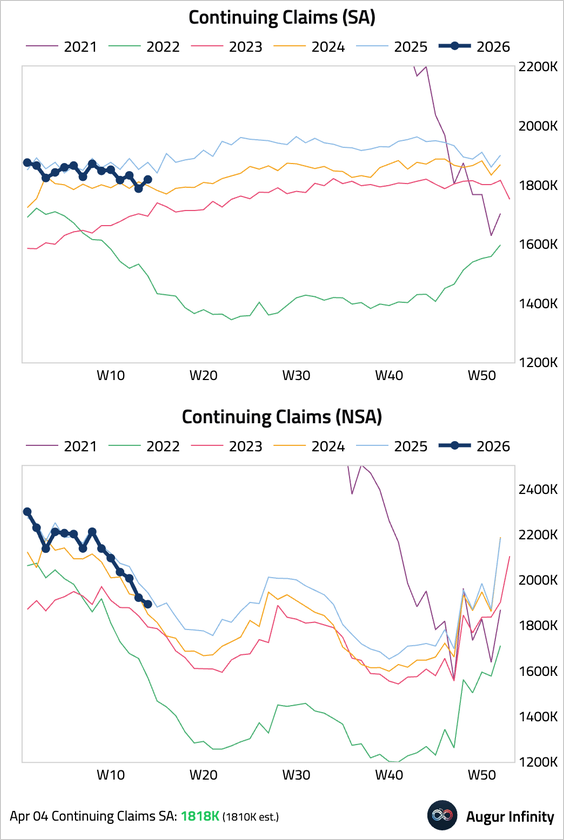
– The four-week moving average continues to decline.
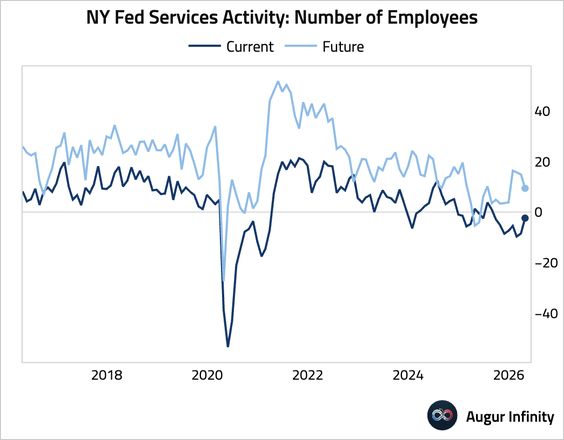
4. New York-area service activity remained in contraction, though the pace of decline eased.
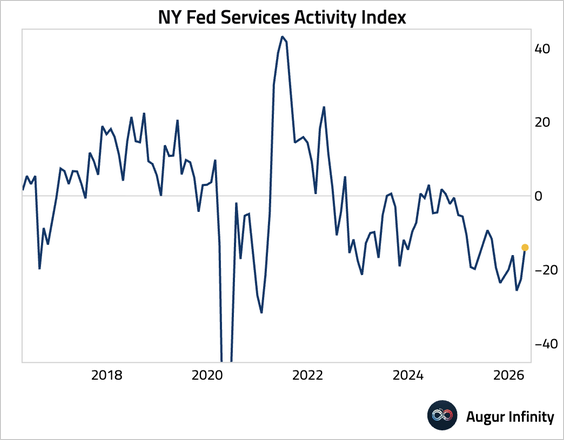
• Employment contracted at a slower pace, while future expectations moderated.
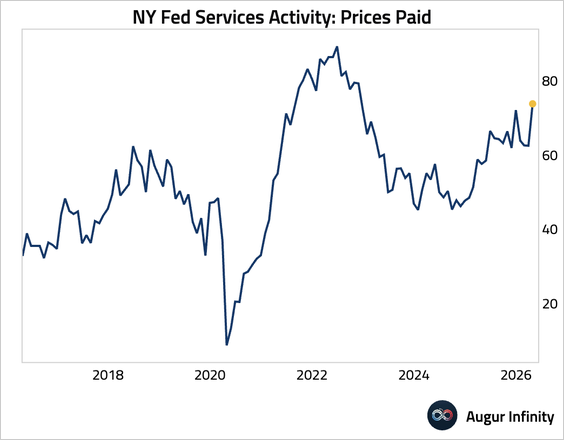
• Input cost pressures intensified.
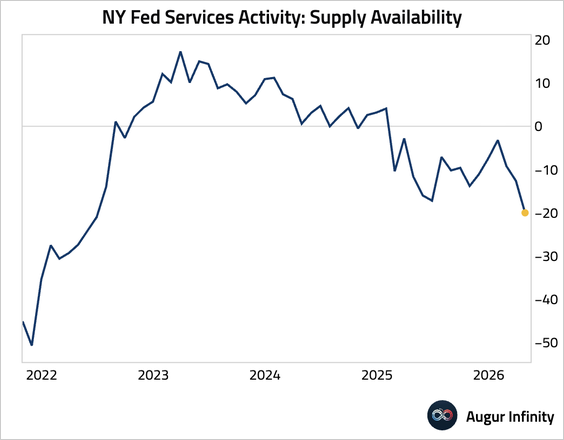
• Supply availability worsened considerably.
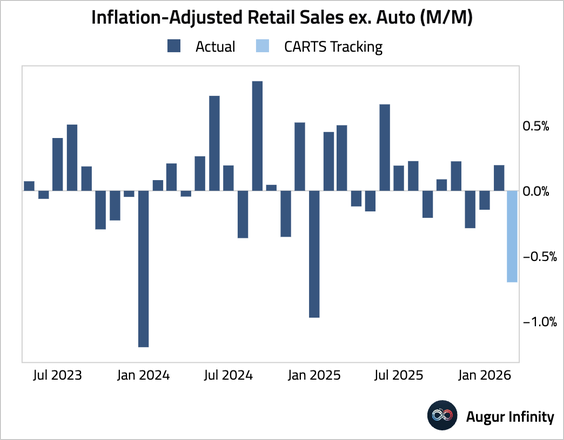
5. The Chicago Fed CARTS estimate for March retail sales excluding autos was revised up from 0.9% to 1.3%.
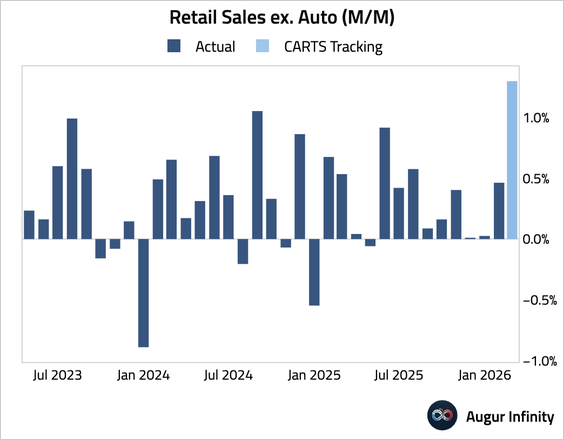
• However, the entire gain was driven by rising prices. The inflation-adjusted measure fell by −0.7% (better than the previous estimate of −1.1%).
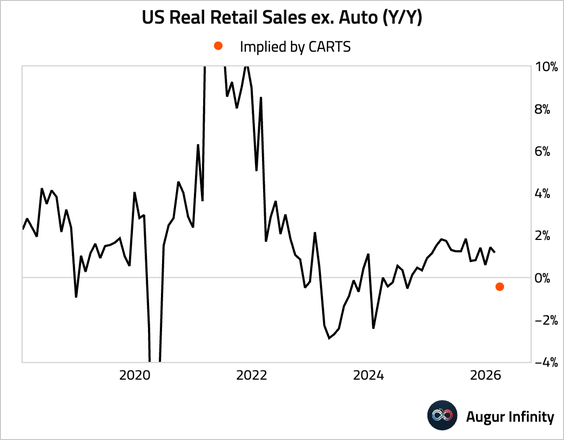
• Here are the year-over-year real growth rates.
6. Aggregated credit and debit card data from Bank of America show a surge in gasoline spending per small business client in March.
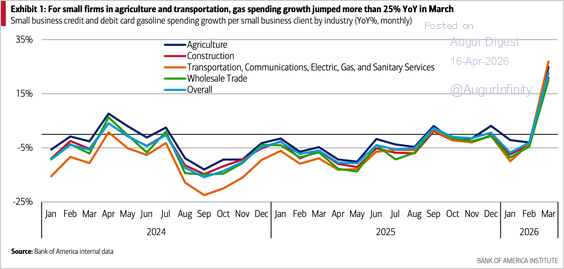
Source: Bank of America Institute
• For clients that pay directly, tariff costs in March were almost 95% higher than the 2024 average.
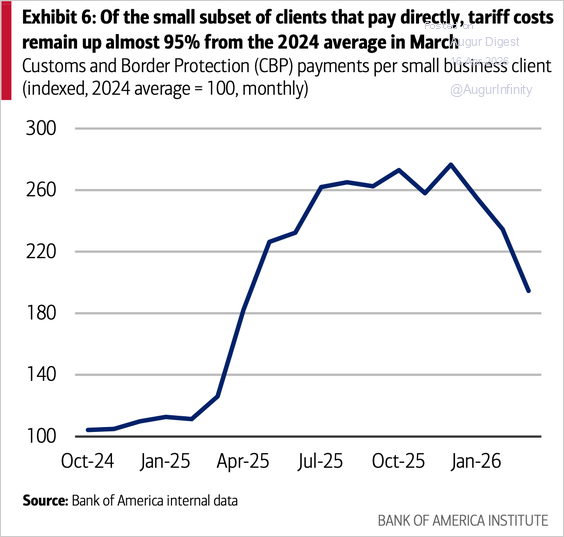
Source: Bank of America Institute
• Small business payroll growth continues to fall, although hiring payments turned positive for the first time in a year.
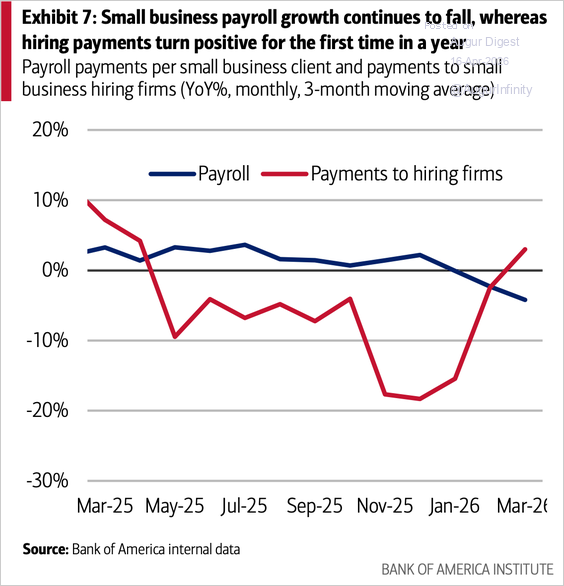
Source: Bank of America Institute
Canada
Subscribe to read the rest.
Become a subscriber of Augur Digest Premium to see all 95 charts today.
Upgrade