The United States
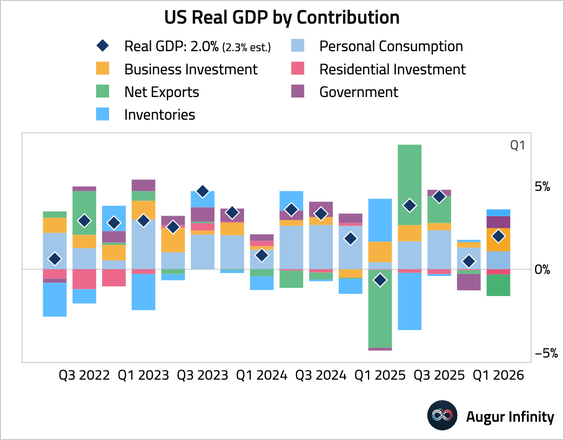
1. Q1 GDP expanded at a 2% annualized rate, below the 2.3% consensus estimate, driven by a boom in AI-related investment.
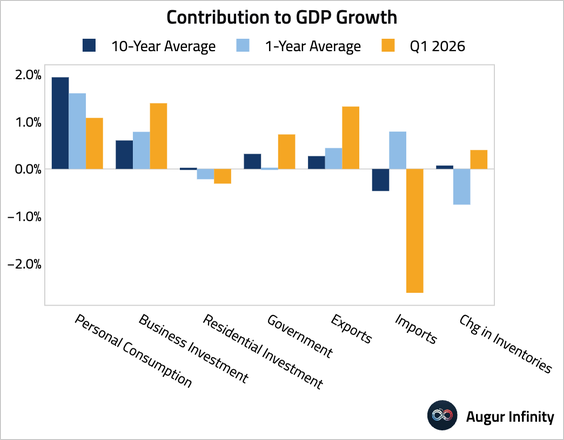
– This chart compares the contribution of each component to the trailing 1- and 10-year averages.
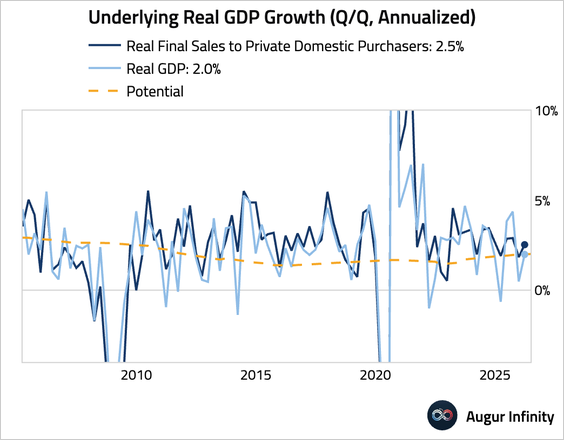
– Stripping out government spending, net trade, and inventories, real final sales to private domestic purchasers rose a solid 2.5%.
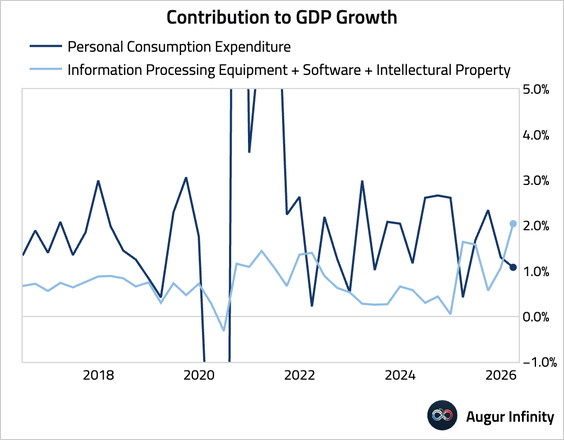
– AI-related contributions, proxied by information processing equipment, software, and intellectual property, accelerated.
• Looking beyond Q1, the Atlanta Fed’s initial Q2 GDPNow reading is 3.7%.
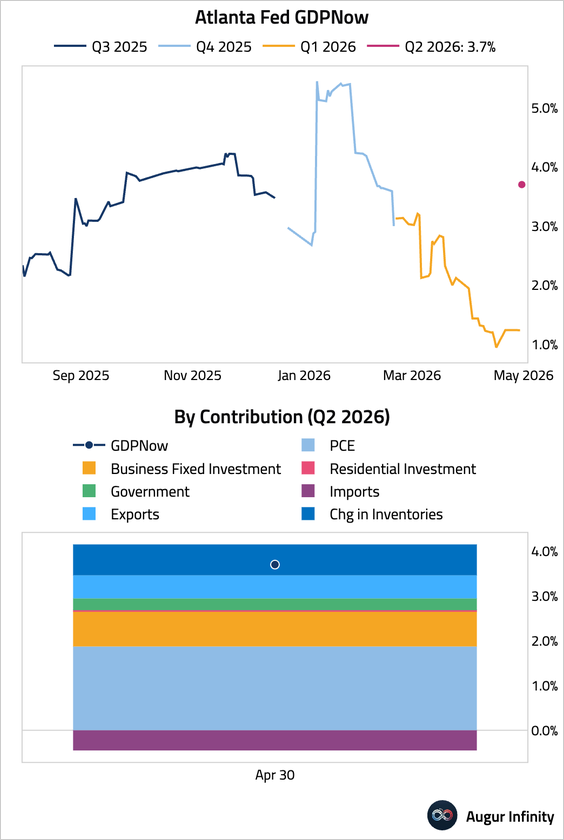
– Pantheon Macroeconomics, however, expects GDP growth to decelerate sharply in Q2.
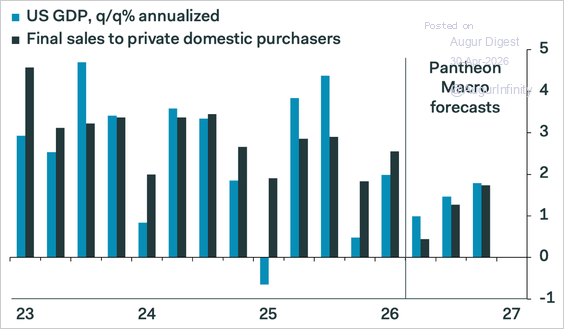
Source: Pantheon Macroeconomics
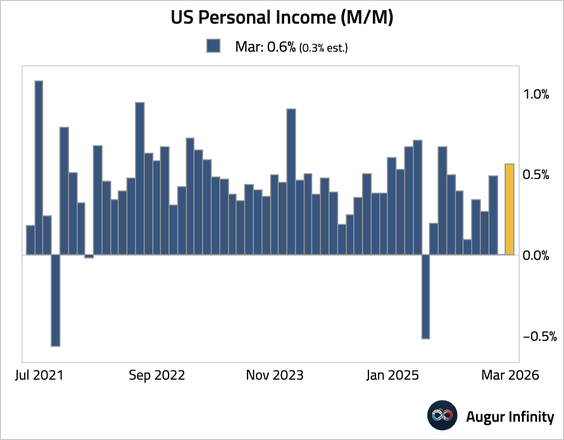
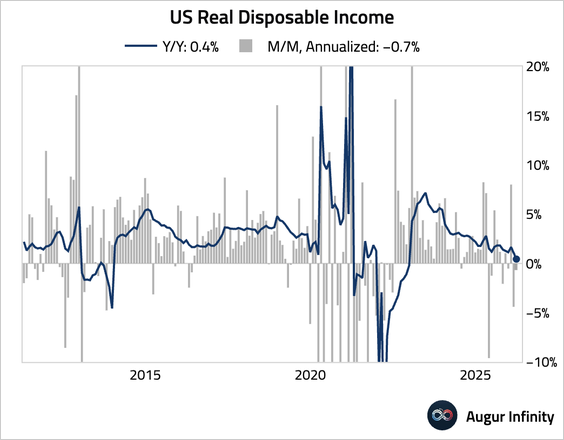
2. Personal income growth beat expectations. About 40% of the increase can be attributed to higher farm proprietors’ income, reflecting payments from the Farm Bridge Assistance program.
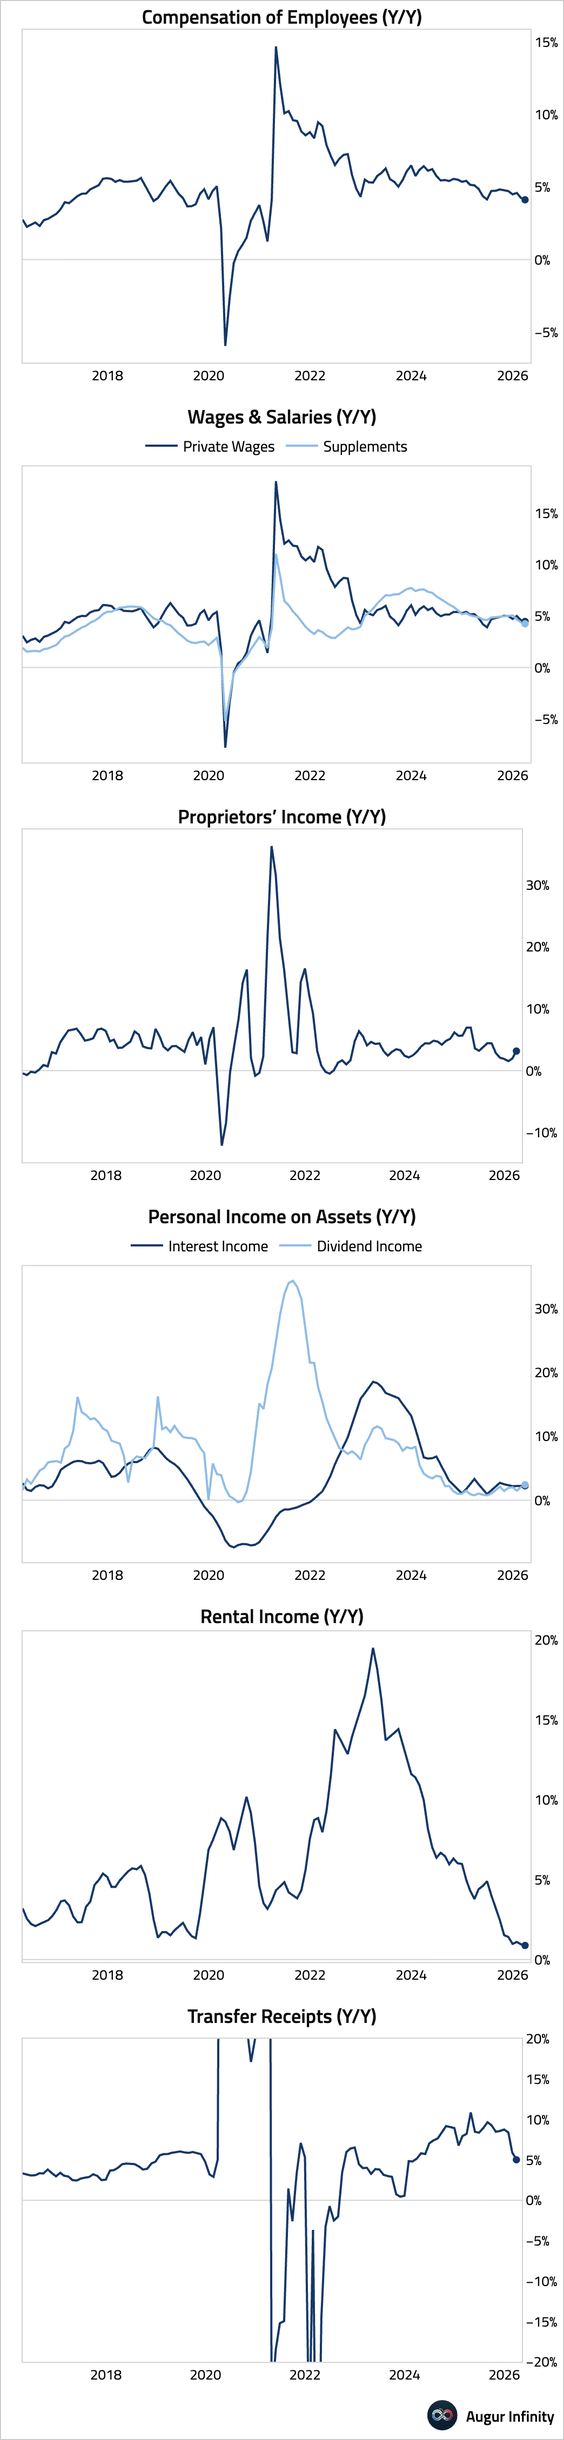
– Here are the year-over-year income growth rates by source.
– Real disposable income growth weakened further.
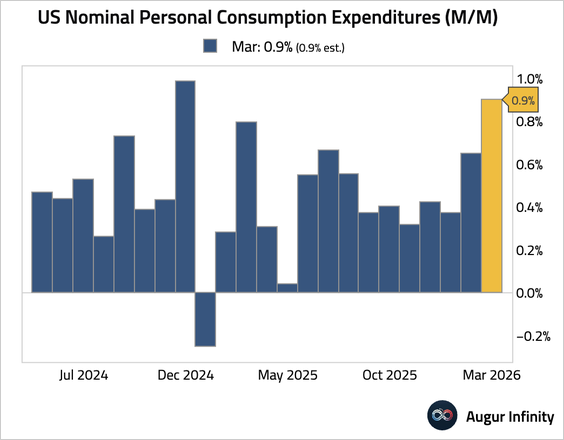
• Nominal personal spending jumped, in line with consensus expectations, but real spending was softer.
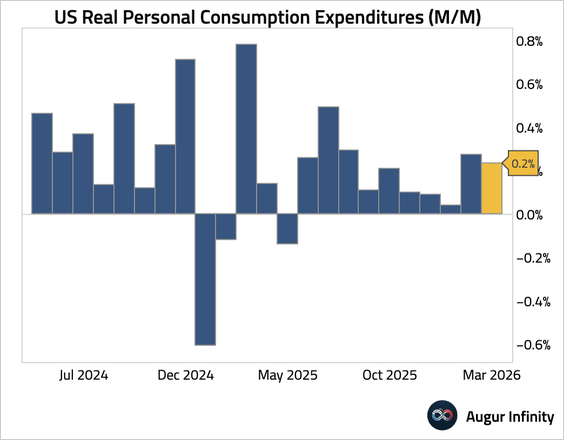
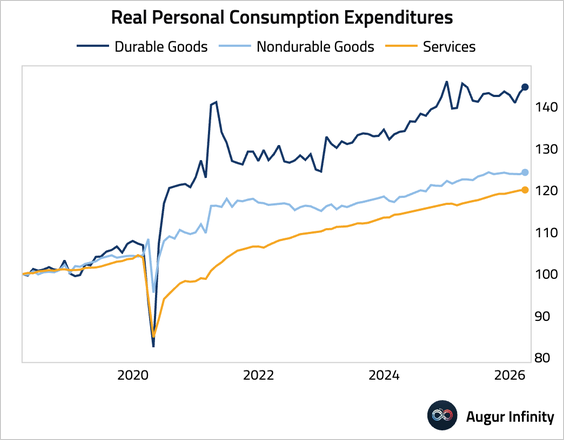
– Real goods consumption improved by 0.6%, while services spending was little changed (+0.1%).
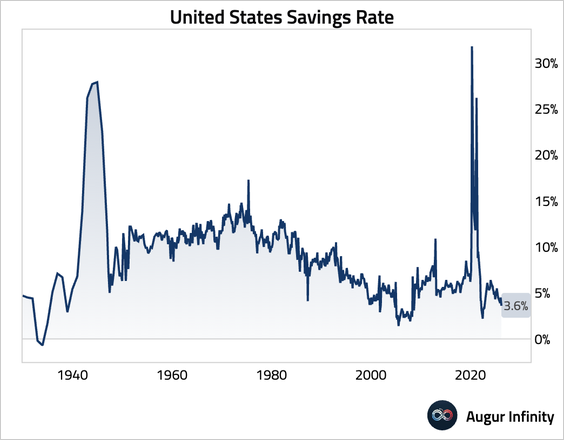
• Consumer spending still <a href="https://thedailyshot.com/2026/04/20/us-consumer-spending-is-losing-momentum/" target="_blank">rests on shaky foundations</a> and the savings rate fell further.
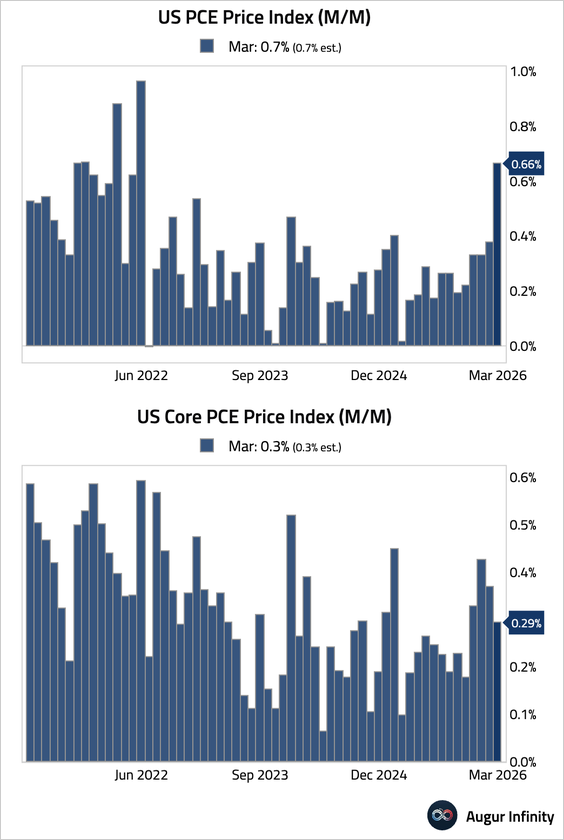
3. The core PCE price index rose by 0.29% month over month, in line with expectations.
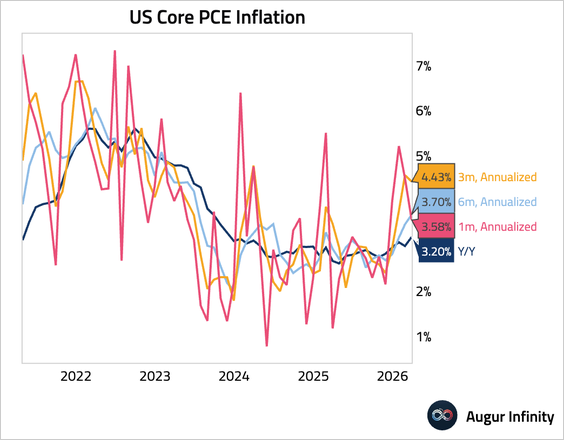
• Here’s annualized core PCE inflation over different trailing periods.
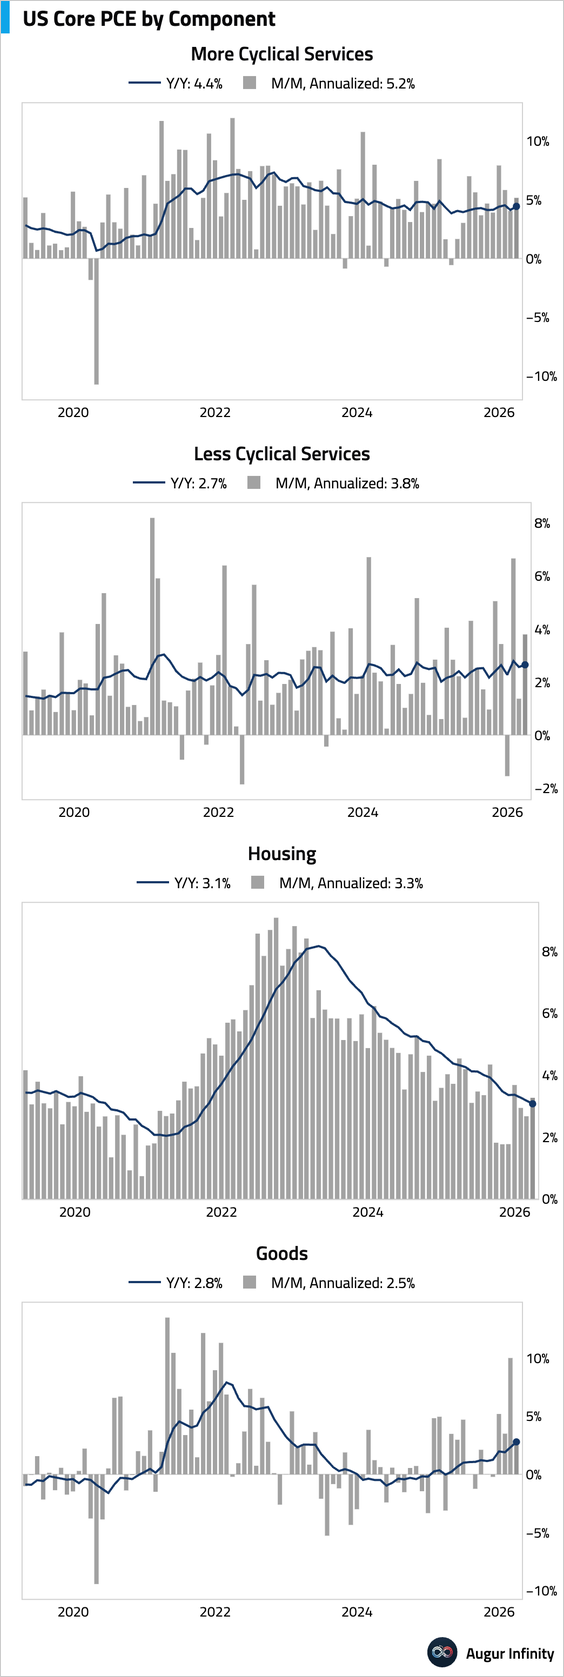
• The next set of charts shows our aggregation of major core PCE drivers.
4. Initial jobless claims fell sharply to 189K, well below consensus, reaching their lowest level since September 1969.
Subscribe to read the rest.
Become a subscriber of Augur Digest Premium to see all 108 charts today.
Upgrade