
The United States
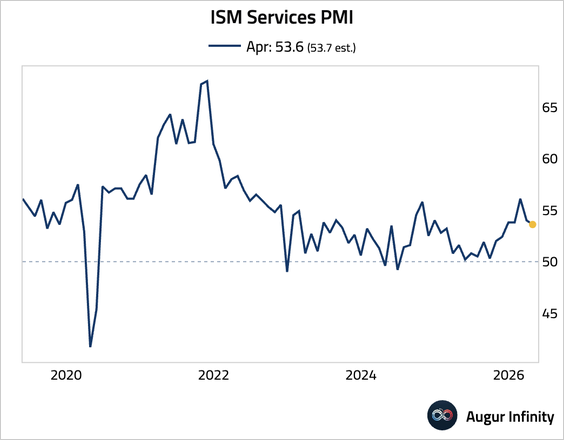
1. US services activity continued to expand, but the momentum softened.
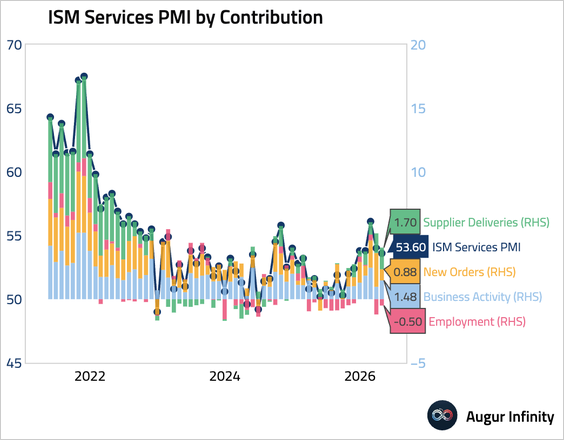
– Here’s a look at the contributions of individual components.
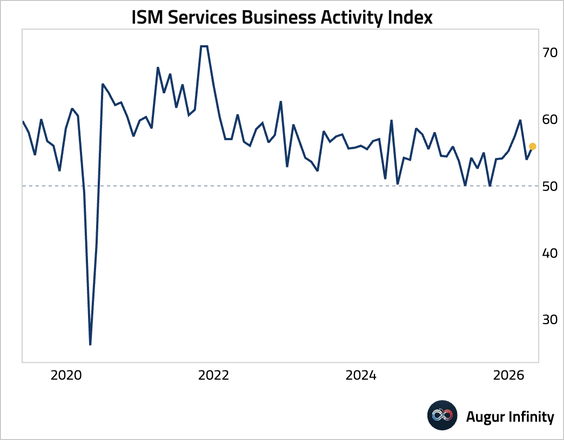
• The business activity index firmed, …
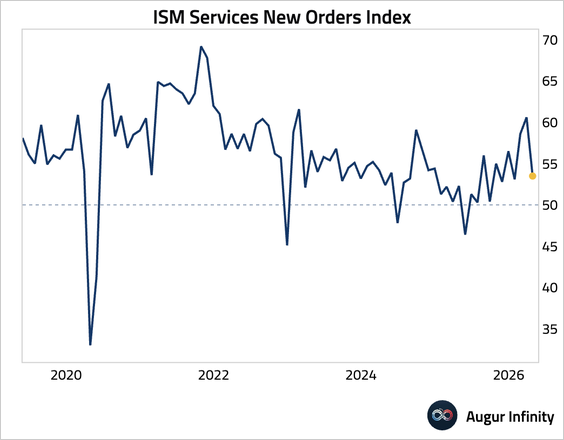
… but the new orders component fell sharply, signaling emerging demand softness.
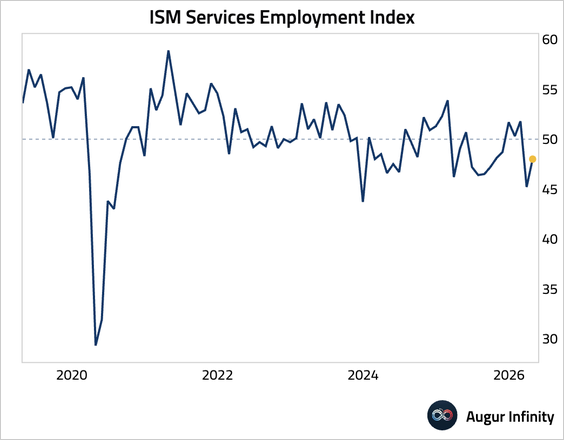
• The employment index improved but remained in contraction.
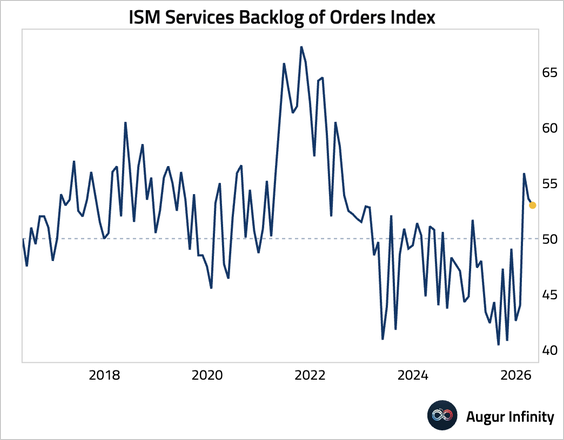
• The Backlog of Orders Index eased.
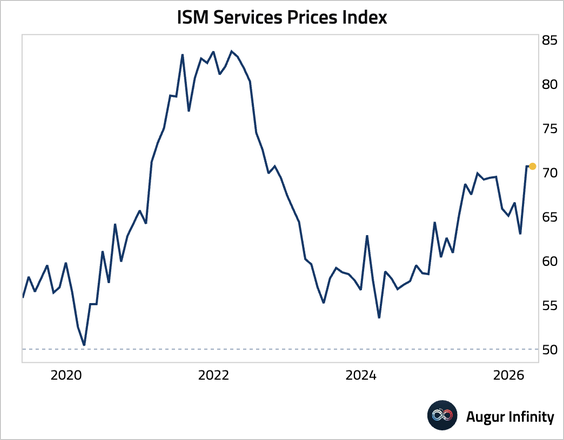
• Input cost pressures remained elevated.
2. Let’s look at some updates about the labor market.
• Job openings edged down but topped expectations.
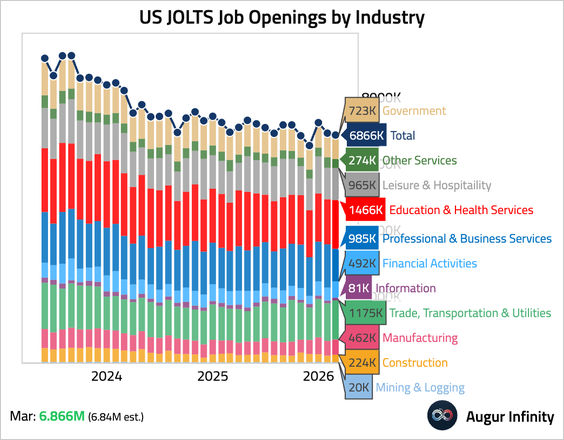
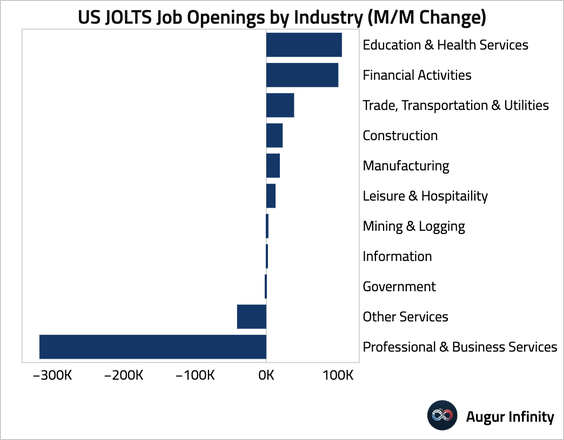
– This chart shows the March changes in job openings by industry.
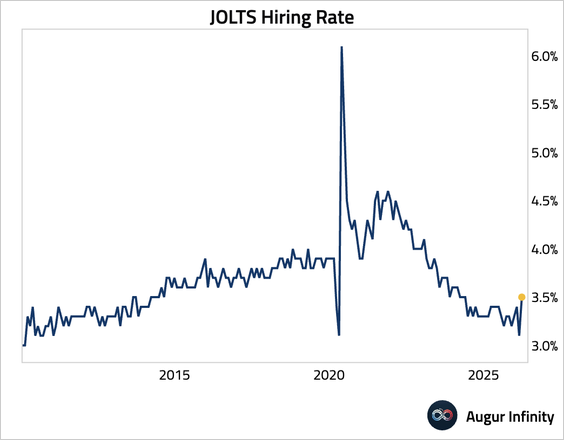
– The hiring rate rebounded.
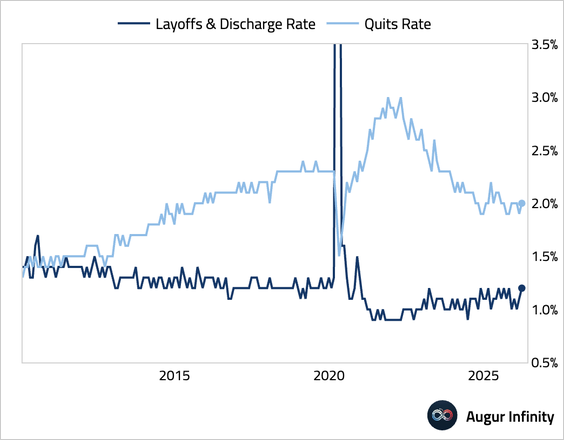
Layoffs and quits also edged up.
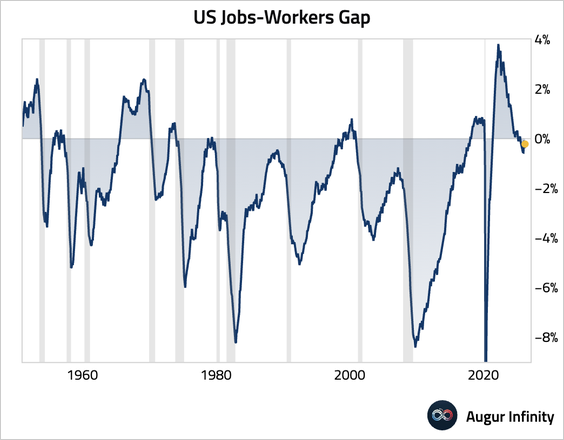
– The jobs-workers gap, which measures the difference between labor supply and labor demand, edged up and remained close to equilibrium.
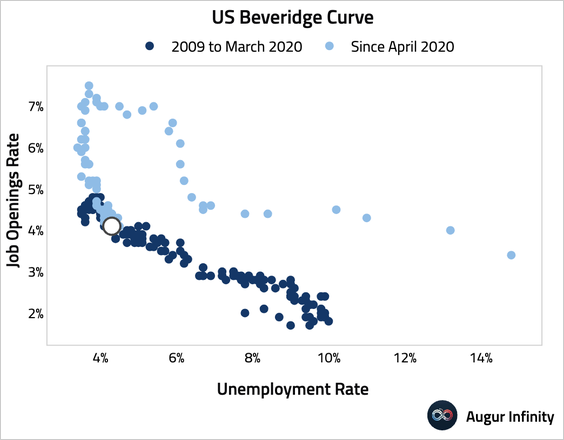
– The economy has reached the “kink” in the Beveridge curve. A further decline in the job openings rate is likely to lead to a rising unemployment rate.
• The unemployment rate for recent college graduates has changed little and remains elevated.
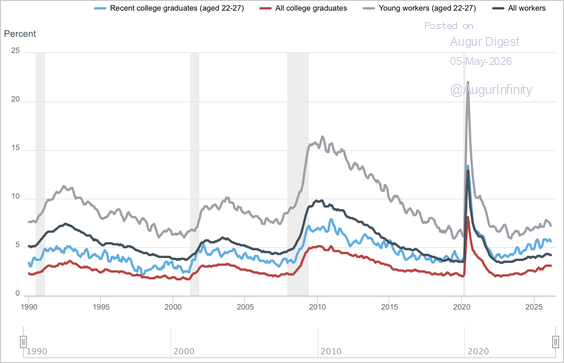
Source: Federal Reserve Bank of New York
• Small business employment growth accelerated for a second straight month in April.
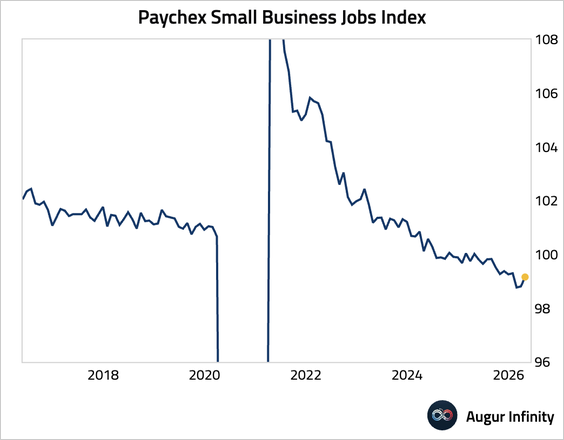
Source: Paychex
– Wage growth remained subdued at below 3%, and hours worked edged higher.
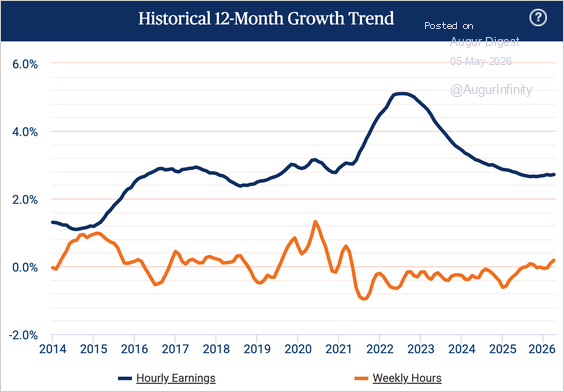
Source: Paychex
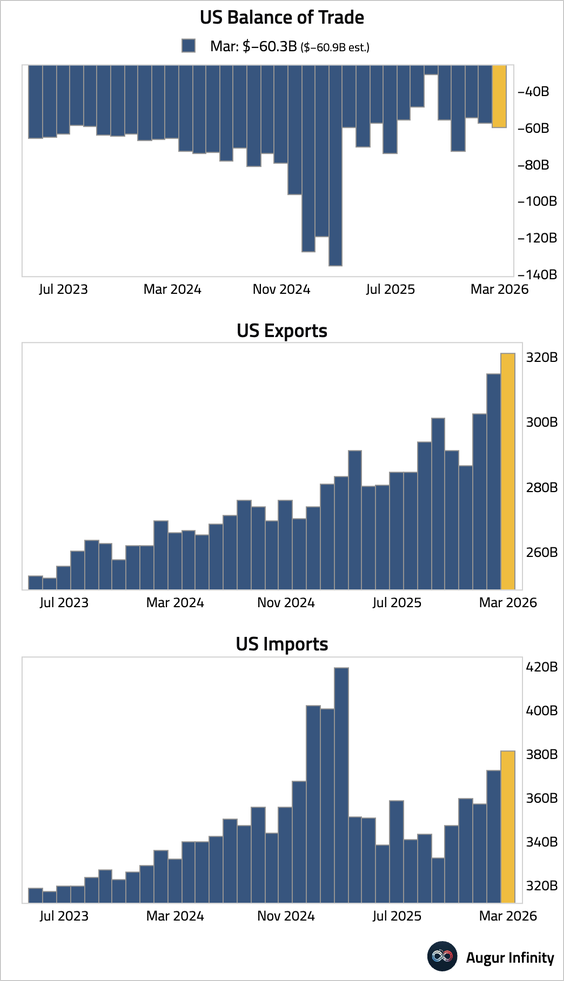
3. The goods and services trade deficit widened in March, as a surge in imports outpaced record-high exports.
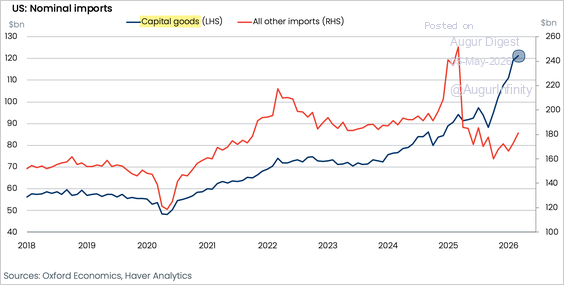
• The surge in imports was largely driven by persistent demand for capital goods related to AI hardware and data centers.
Source: Oxford Economics
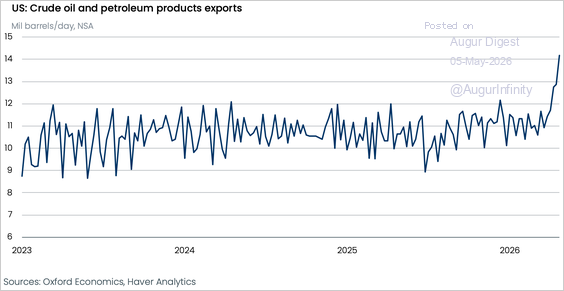
• High-frequency data suggest that exports of crude oil and petroleum surged in April, which should contribute to a narrower trade deficit in the next report.
Source: Oxford Economics
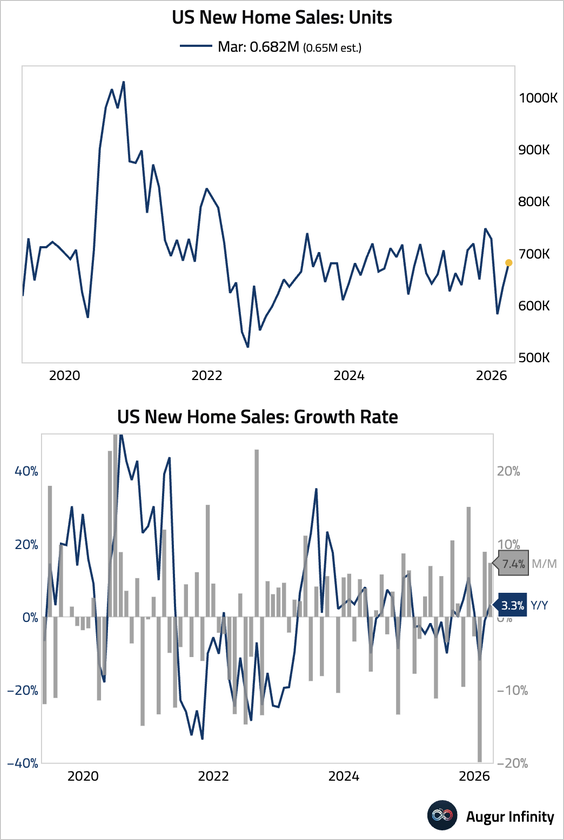
4. New home sales rebounded in February and March after earlier weather-related weakness, but elevated inventory, declining prices, and pressure from higher rates and gasoline costs suggest limited near-term upside.
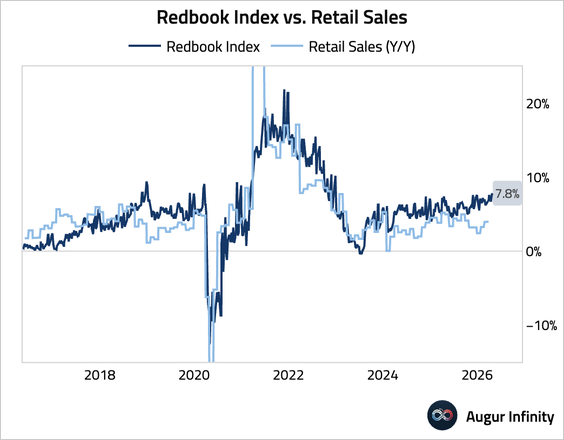
5. The Redbook index of same-store sales remained strong.
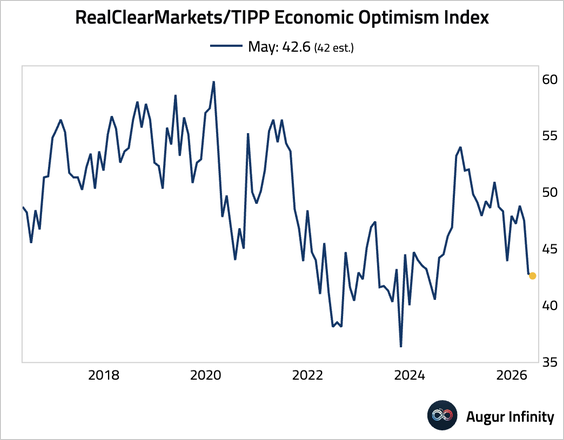
6. The RCM/TIPP Economic Optimism Index edged down, remaining deeply pessimistic.
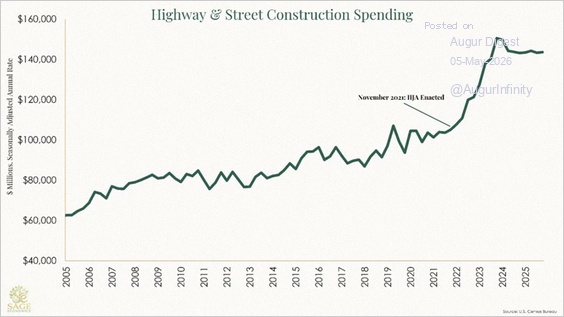
7. Highway and street construction spending surged after the bipartisan Infrastructure Investment and Jobs Act was passed in November 2021.
Source: Sage Economics
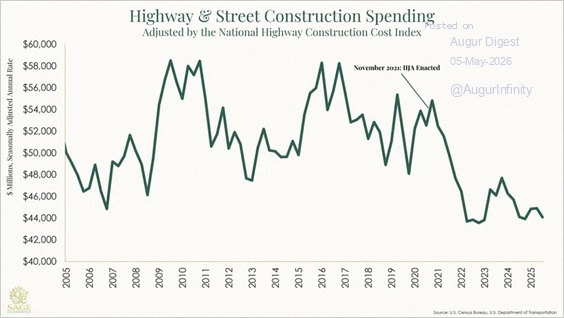
• Adjusted for the cost of building new highways, spending in the category is down.
Source: Sage Economics
Canada
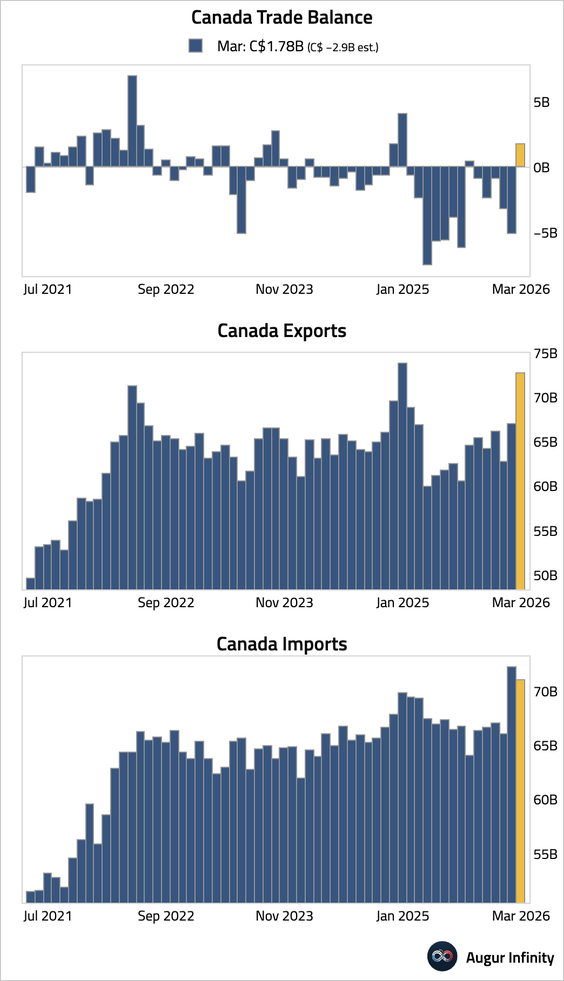
1. The trade balance swung to a surplus, as higher crude prices and strong gold demand boosted exports while imports declined.
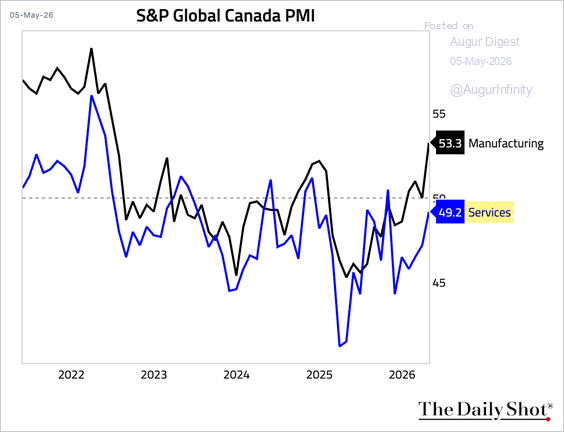
2. Canada’s services sector contraction eased in April, with marginal growth in new business, improved sentiment, and a return to hiring.
Source: S&P Global PMI
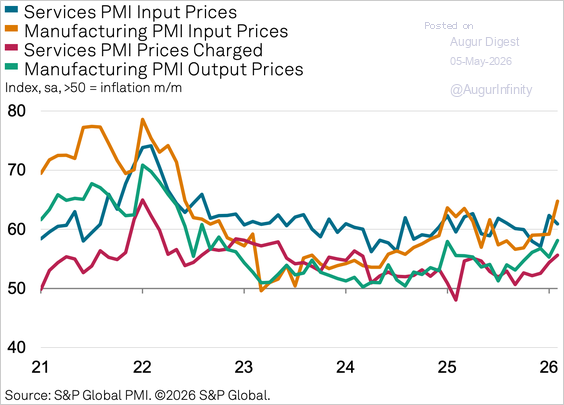
• Firms face persistent cost pressures amid tariffs and geopolitical risks.
Source: S&P Global PMI
The United Kingdom
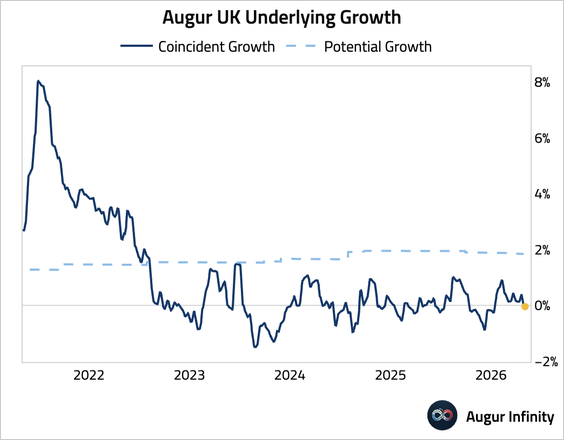
1. Our real-time tracking suggests UK growth has dipped below zero.

Subscribe to read the rest.
Become a subscriber of Augur Digest Premium to see all 79 charts today.
Upgrade