
Global Developments
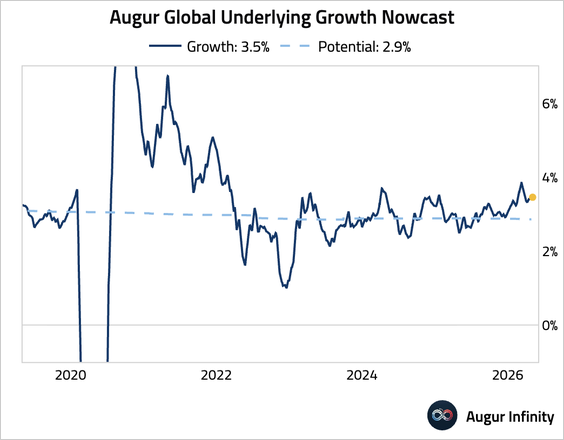
1. Our real-time estimate of global growth remains solid, above potential growth.
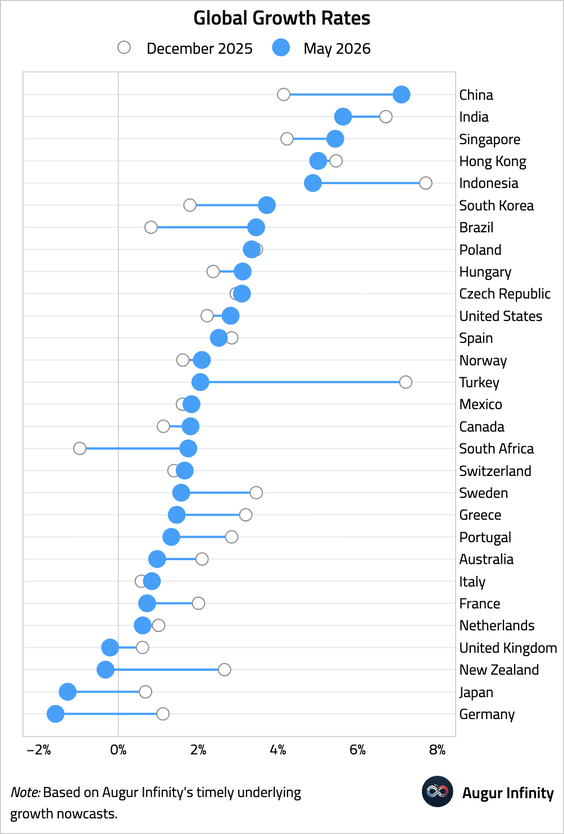
– Here’s how growth has shifted by country since the start of the year.
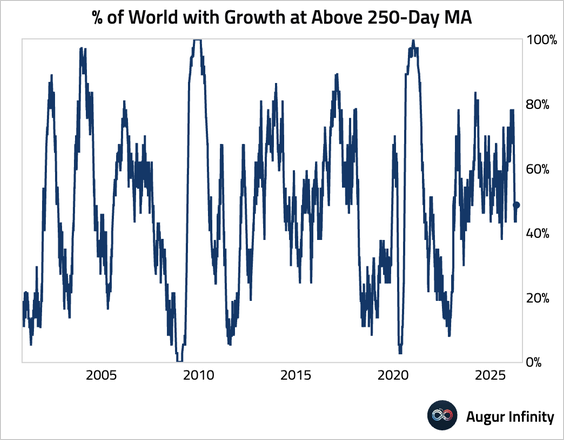
• The breadth of global growth has narrowed, with less than half of the economies we track growing at above one-year average levels.
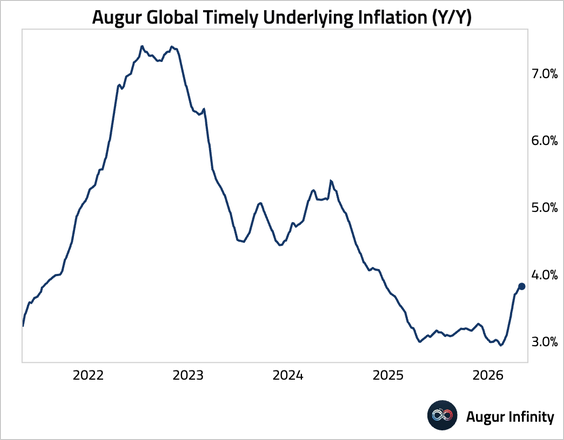
2. Global inflation has firmed, based on our tracking.
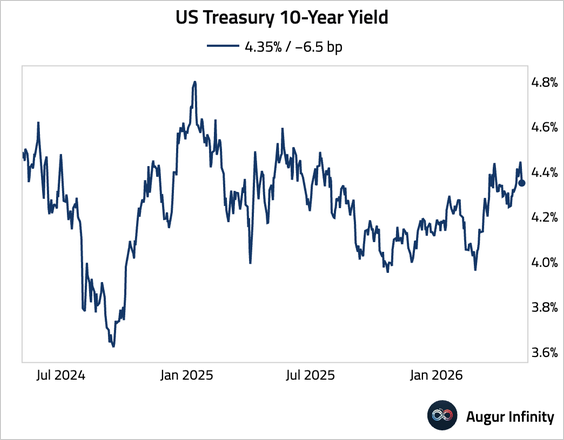
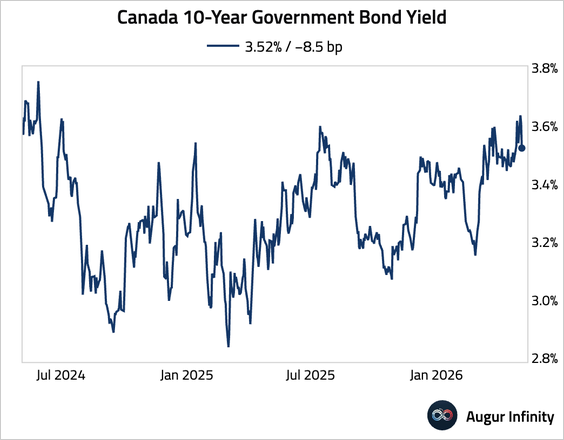
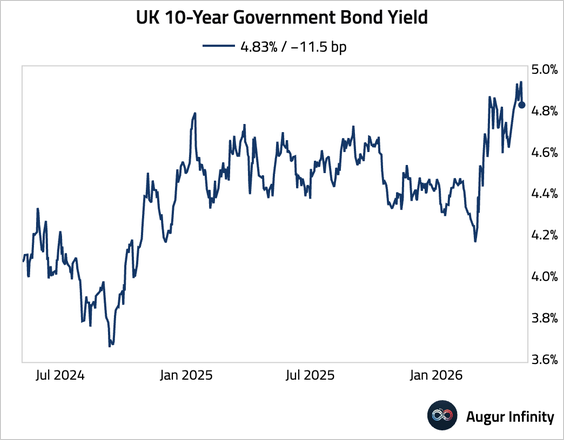
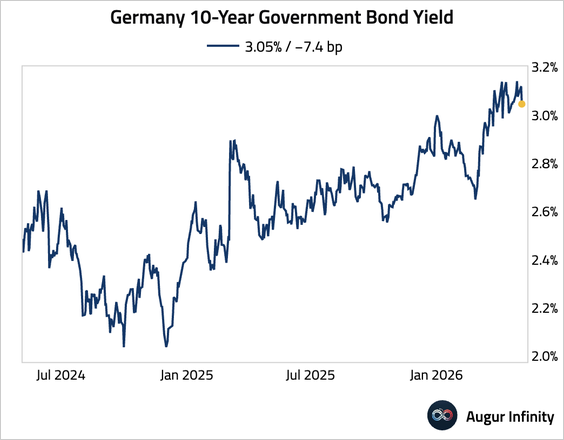
3. Global bonds rallied.
• United States:
• Canada:
• United Kingdom:
• Germany:
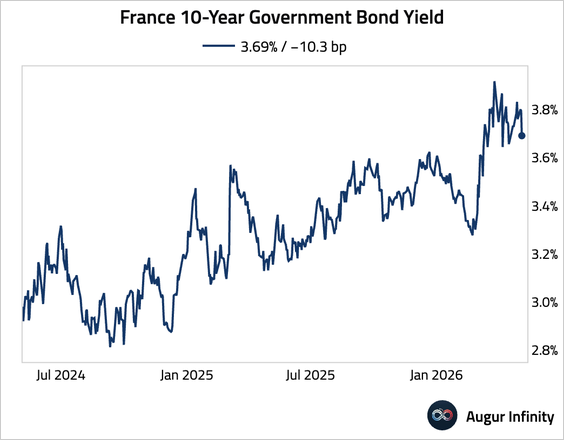
• France:
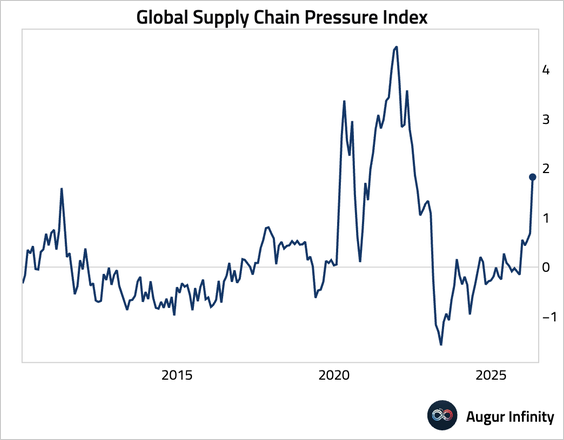
4. The Global Supply Chain Pressure Index surged.
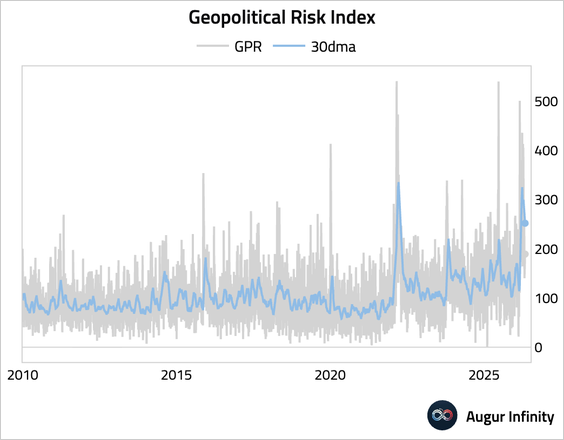
5. The geopolitical risk index has peaked.
The United States
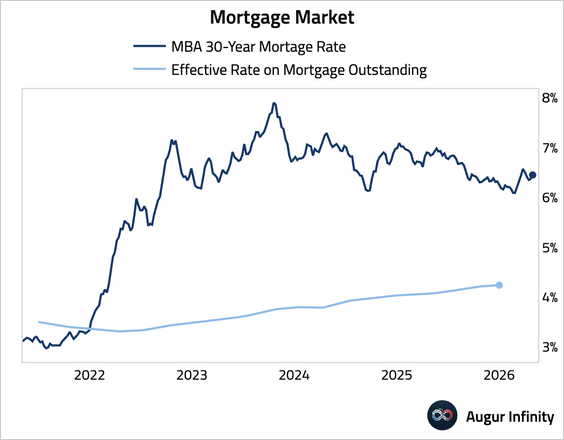
1. Mortgage applications fell as the 30-year fixed mortgage rate ticked up.
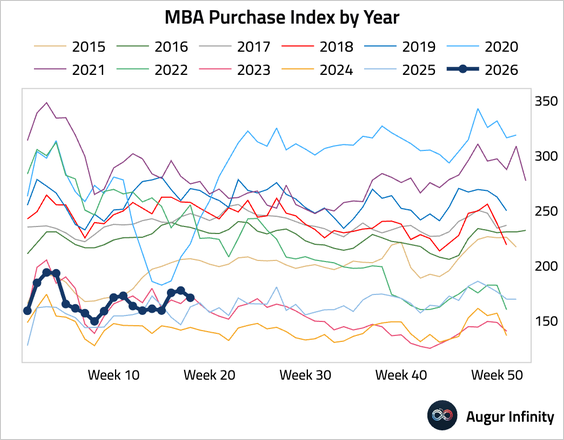
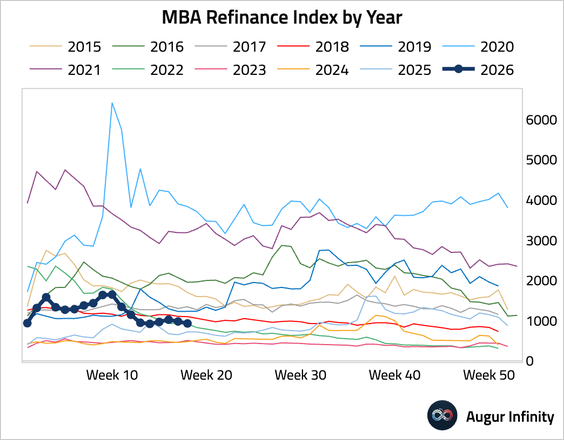
• Refinancing activity also declined.
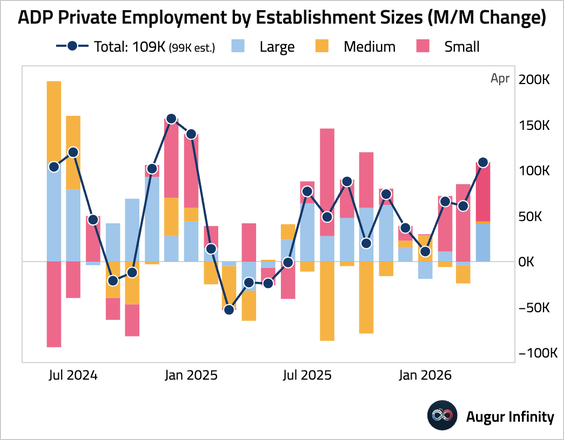
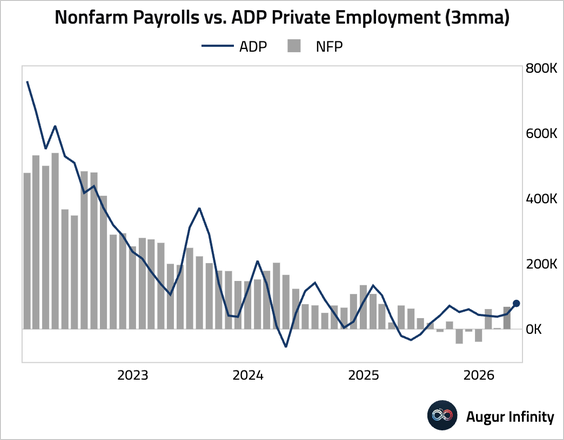
2. ADP private payrolls rose by 109,000 in April, topping expectations.
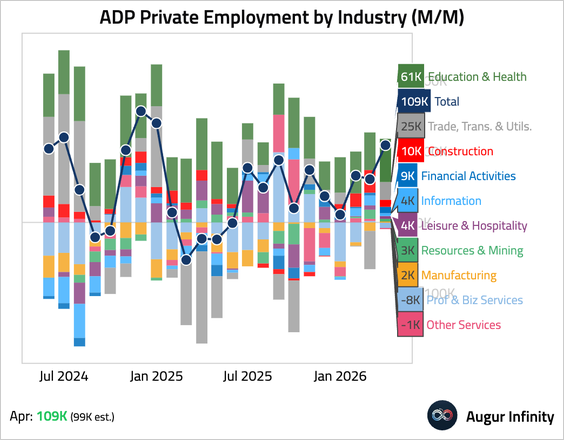
• Here is a breakdown by industry.
• Smoothed on a rolling three-month basis, the ADP report shows the labor market is potentially warming.

Subscribe to read the rest.
Become a subscriber of Augur Digest Premium to see all 100 charts today.
Upgrade