
The United States
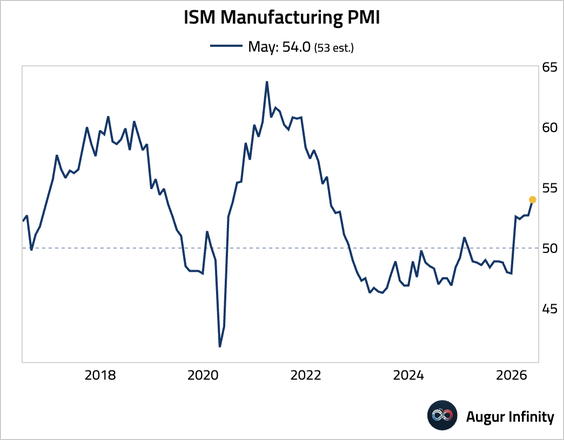
1. The ISM manufacturing PMI rose to a four-year high.
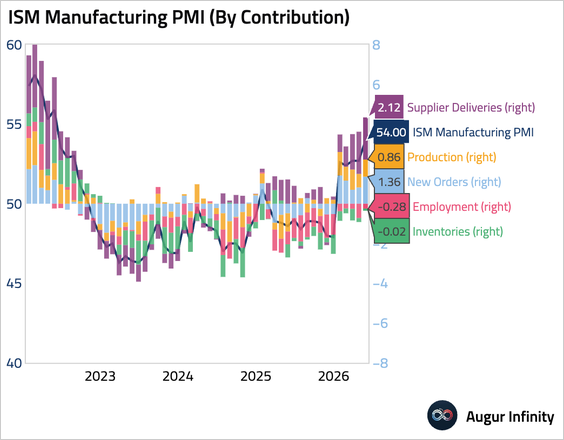
– This chart shows the contribution of each component to the headline figure.
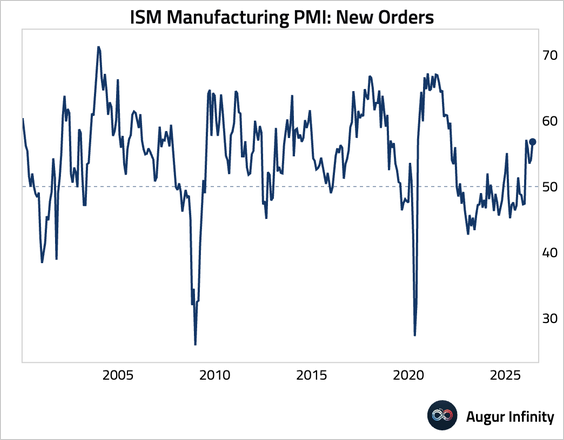
• Firms boosted orders …
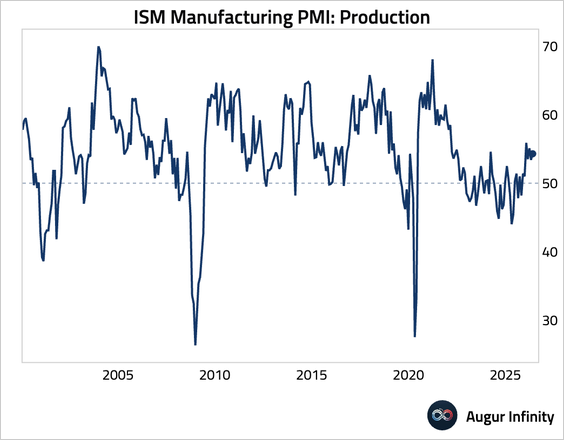
… and production amid supply chain disruptions.
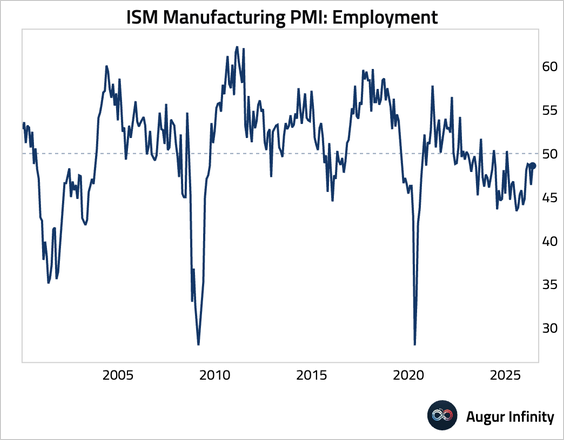
• Employment remained in contraction, but the pace of contraction eased.
• The price index inched down but remained elevated, indicating some stubbornness in price pressures.

• Despite the strong print, the gap between PMI and the ratio of cyclical versus defensive equities remains large.

2. Construction spending increased in April, surpassing consensus estimates, …
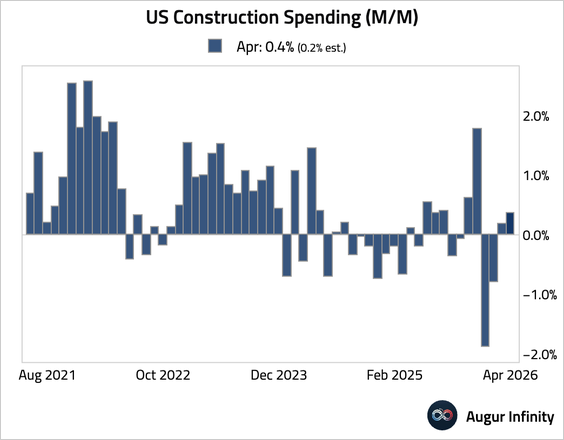
… driven by strength in private residential construction, which offset a pullback in non-residential activity.
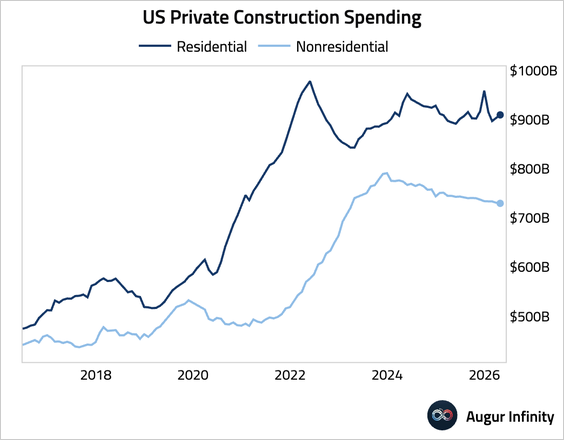
• Data center construction spending remains strong, widening the lead over general office construction.

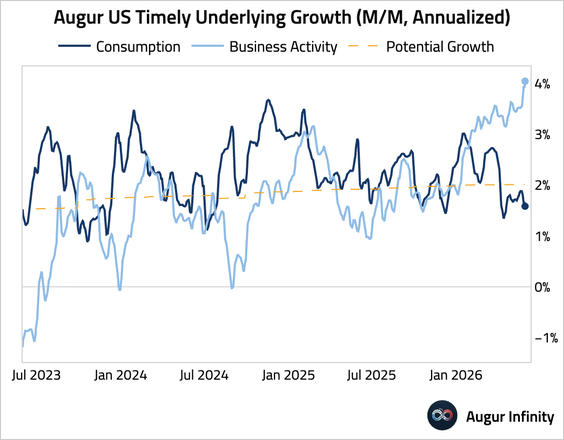
3. Our timely underlying growth remains solid, tracking growth at around 3.0%.
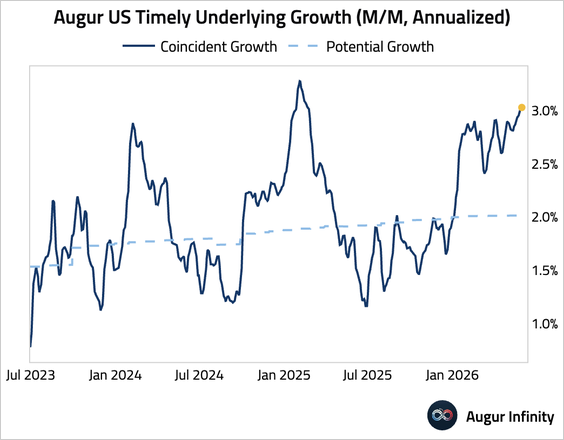
• Strength in business activity has offset the moderation in consumer activity.
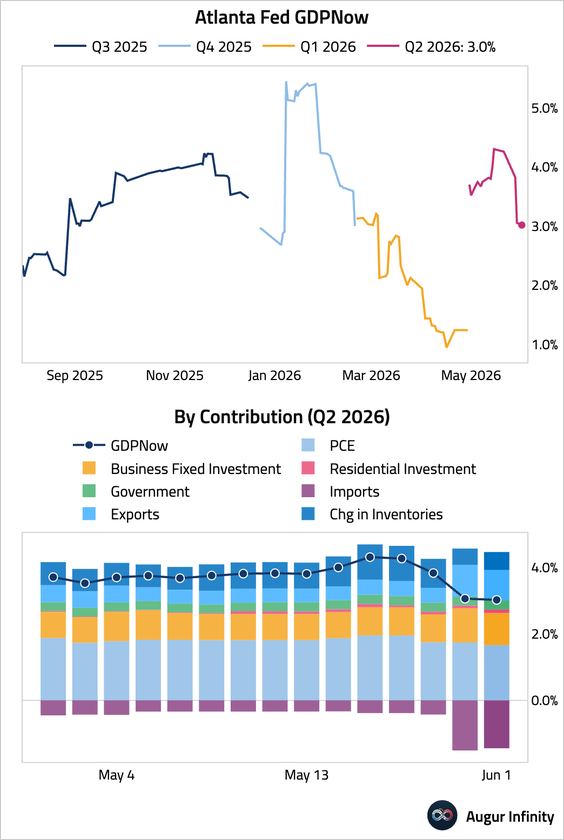
4. The Atlanta Fed’s GDPNow model is now tracking Q1 GDP at 3%.
Canada
1. Canada’s manufacturing PMI eased but still indicated a solid expansion. While output, new orders, and employment all increased, growth was undermined by surging cost pressures and supply chain issues.
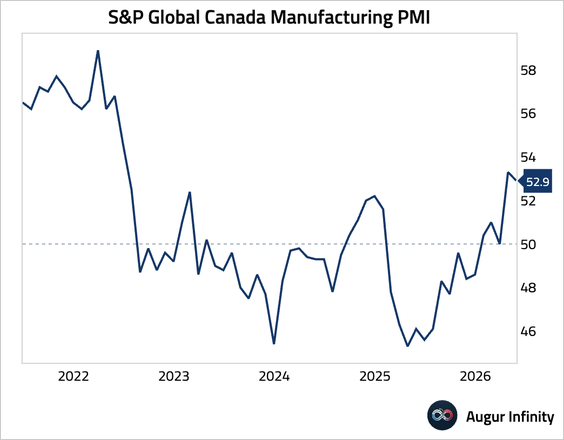
Source: S&P Global PMI
Euro Area

Subscribe to read the rest.
Become a subscriber of Augur Digest Premium to see all 82 charts today.
Upgrade