The United States
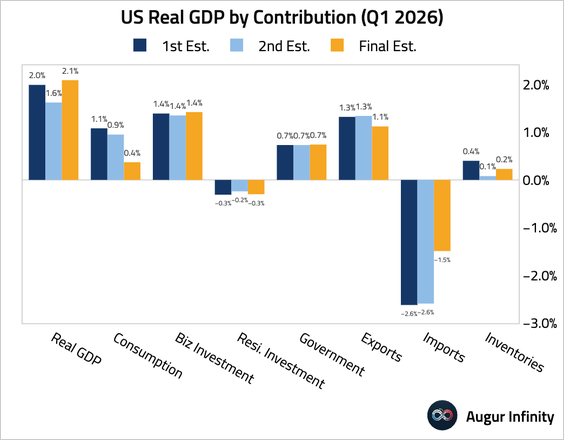
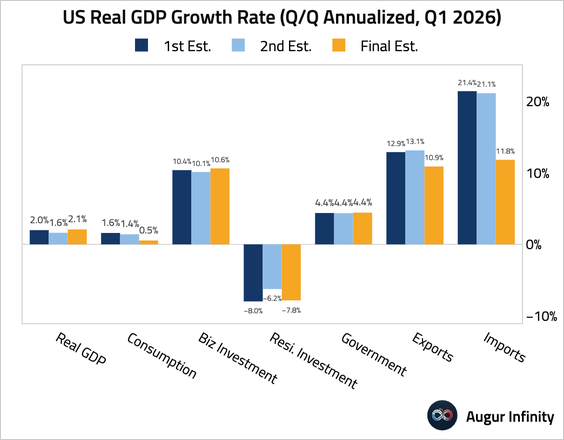
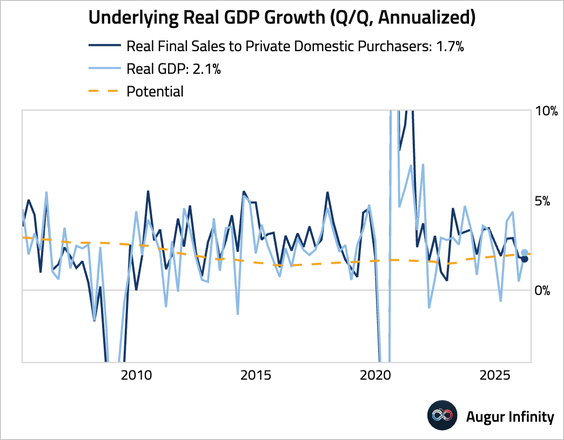
1. The Q1 GDP growth rate was revised up to 2.1% (Q/Q SAAR) from a second estimate of 1.6%.
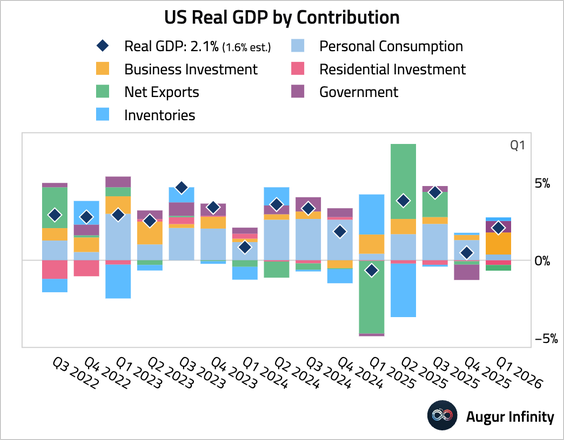
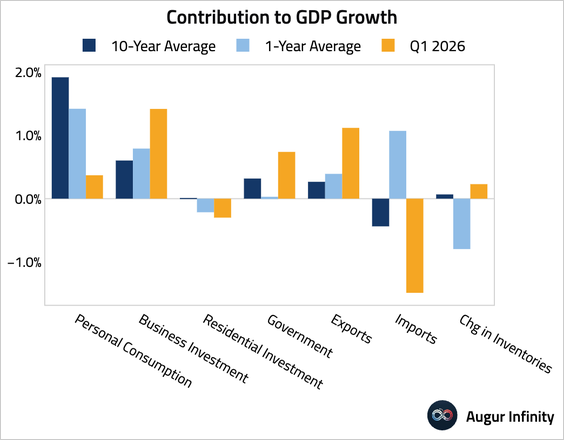
• The upward revision, however, was driven by a smaller drag from net trade, while consumer spending was revised sharply lower.
• This chart compares the contribution of each component to the trailing one- and 10-year averages.
• Stripping out government spending, net trade, and inventories, real final sales to private domestic purchasers were revised down from 2.4% to 1.7%.
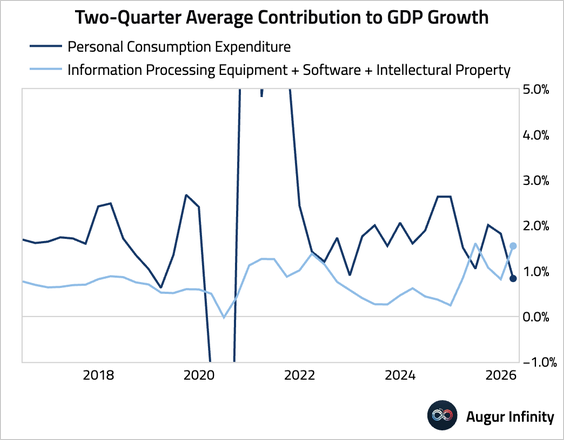
• AI-related contributions, proxied by information processing equipment, software, and intellectual property, remained the highlight.
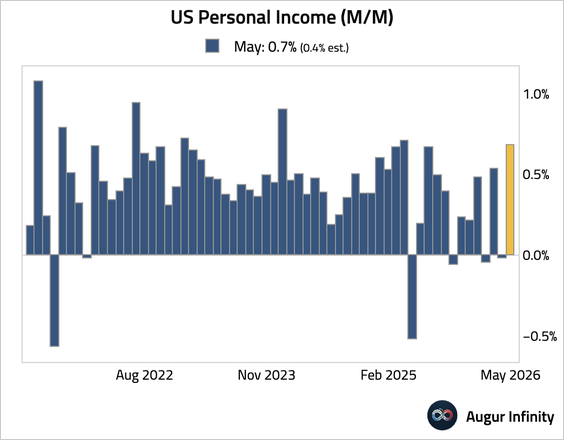
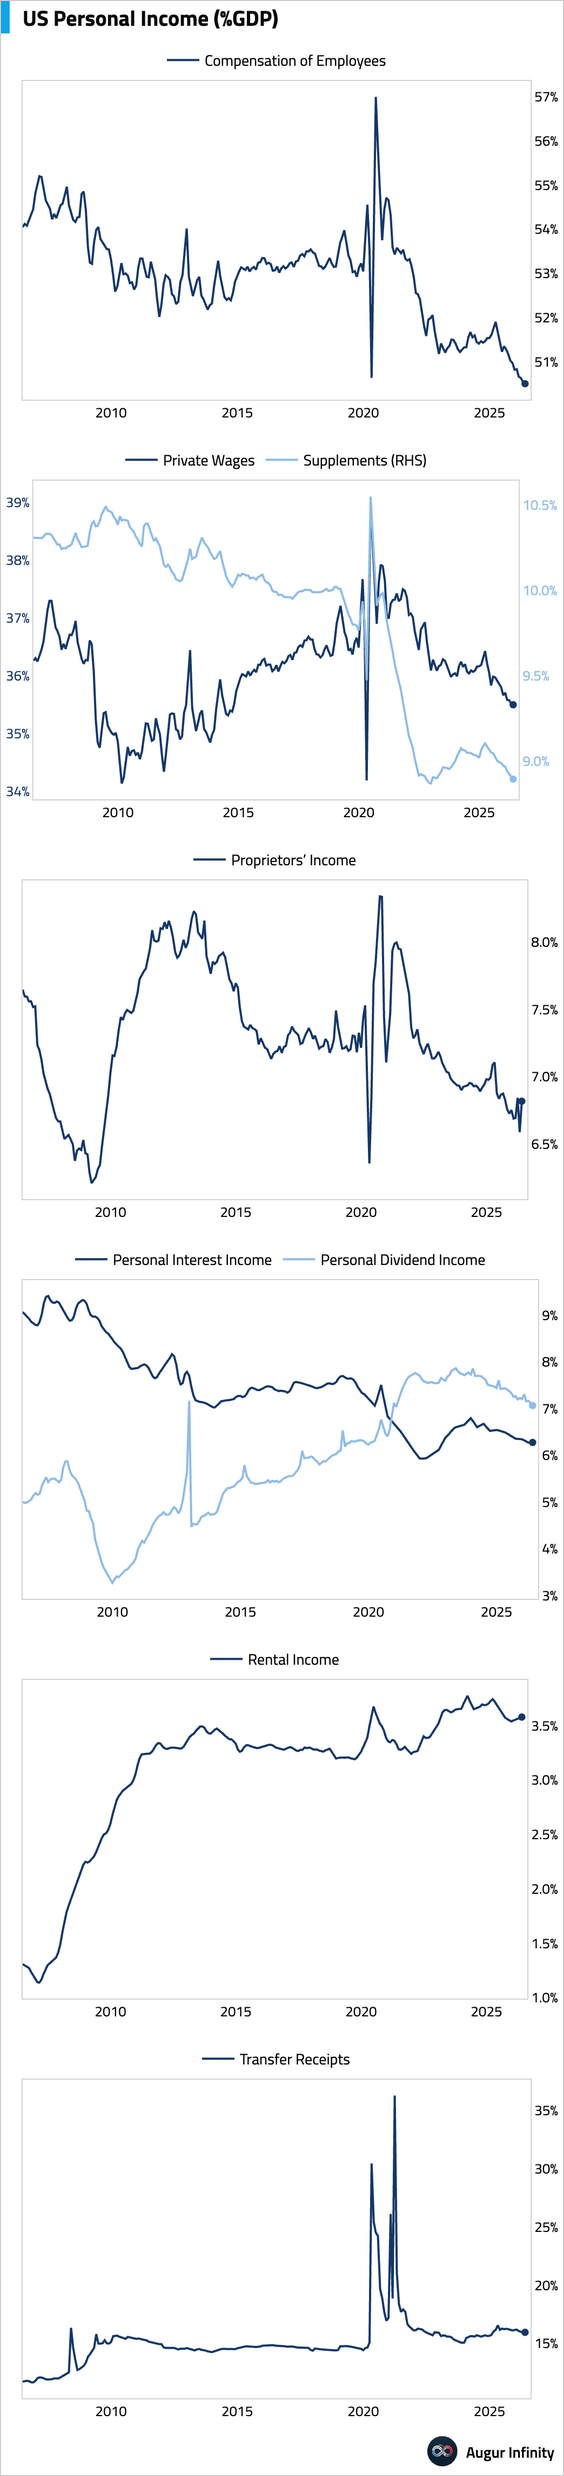
2. Now let’s turn to more timely data. Personal income growth rebounded sharply in May, partially reflecting a 0.2-percentage-point boost from a second round of payments from the Farmer Bridge Assistance Program.
– Here’s a look at the components of personal income as percentages of GDP.
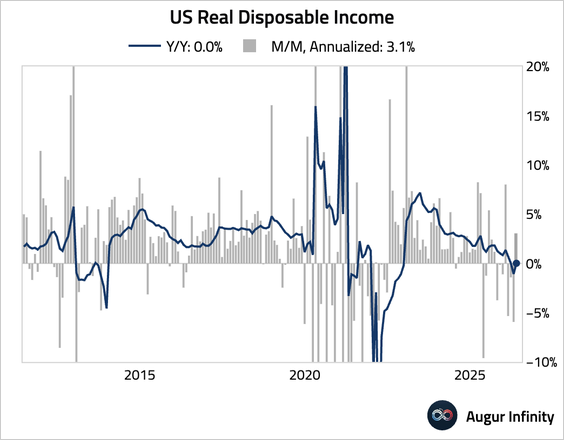
– Real disposable income growth also rebounded sequentially, but the year-over-year growth was stagnant.
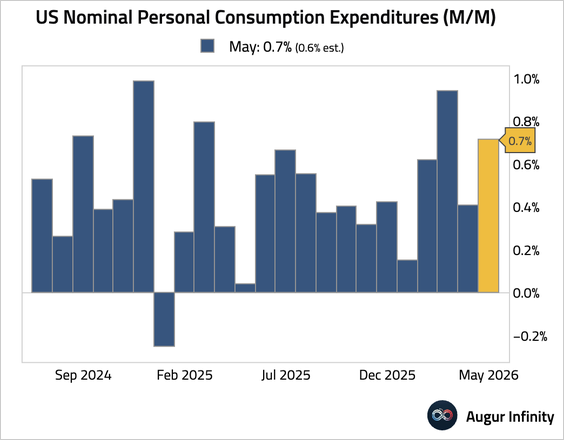
• Nominal personal spending was solid and a touch better than expected.
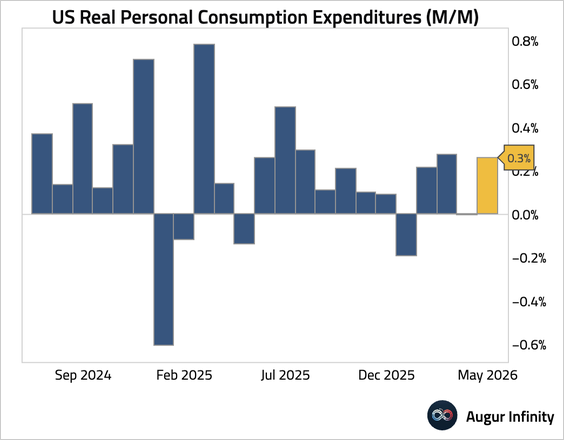
– Real spending growth was much more modest at 0.3% month over month, while the reading for April was revised down to 0%.
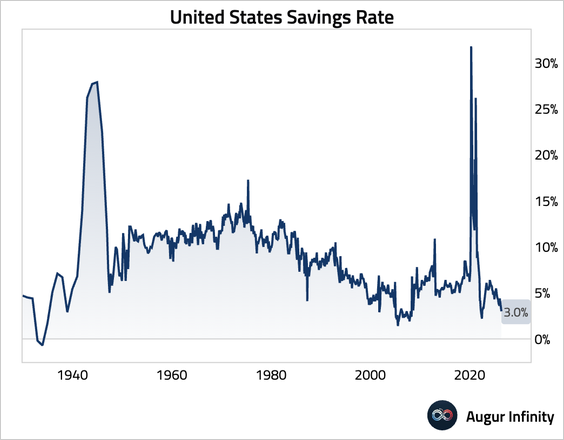
• With weak income growth, consumers continued to dip into savings to fund purchases. The savings rate remained near secularly low levels, limiting further support for household spending.
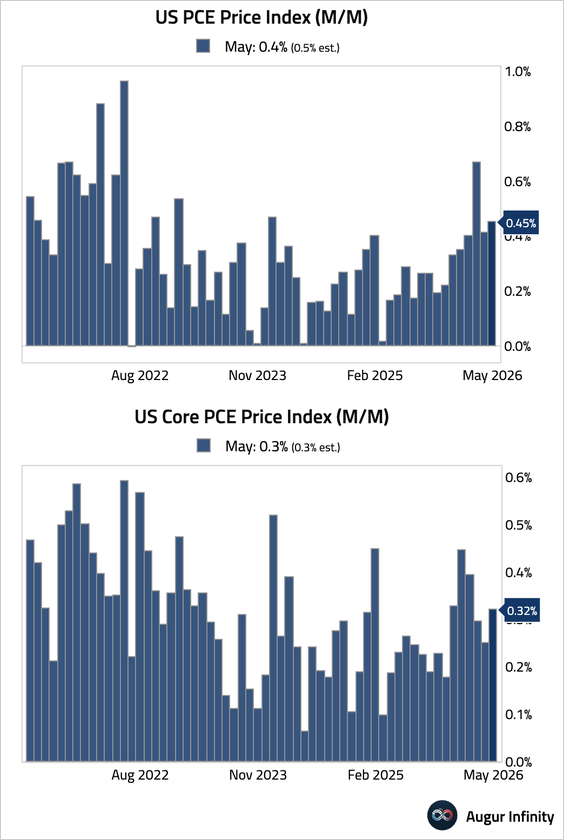
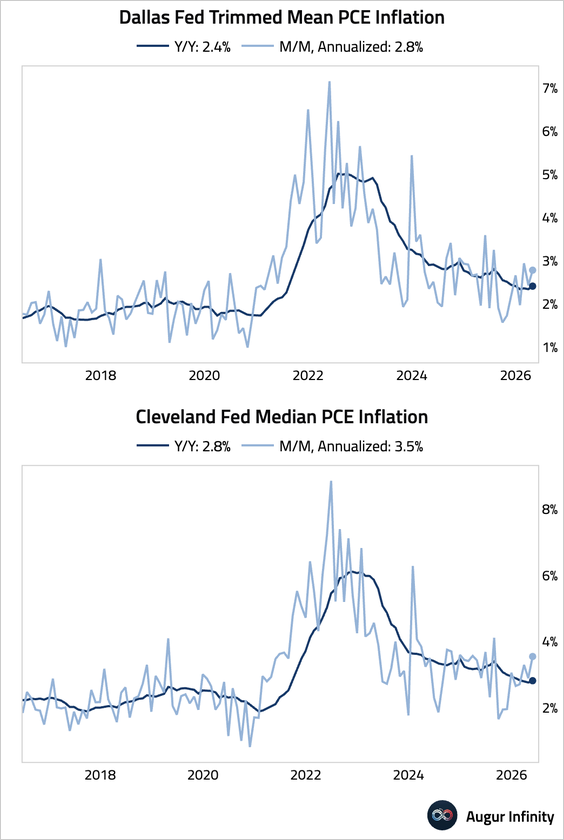
3. The core PCE price index rose by 0.32% month over month in May, in line with expectations.
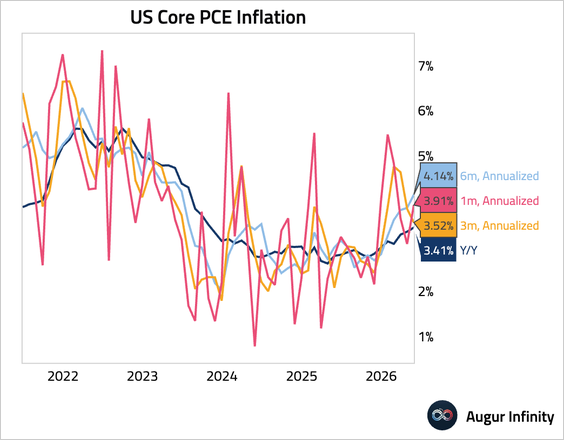
• Here’s annualized core PCE inflation over different trailing periods.
• The next set of charts shows our aggregation of major core PCE drivers.
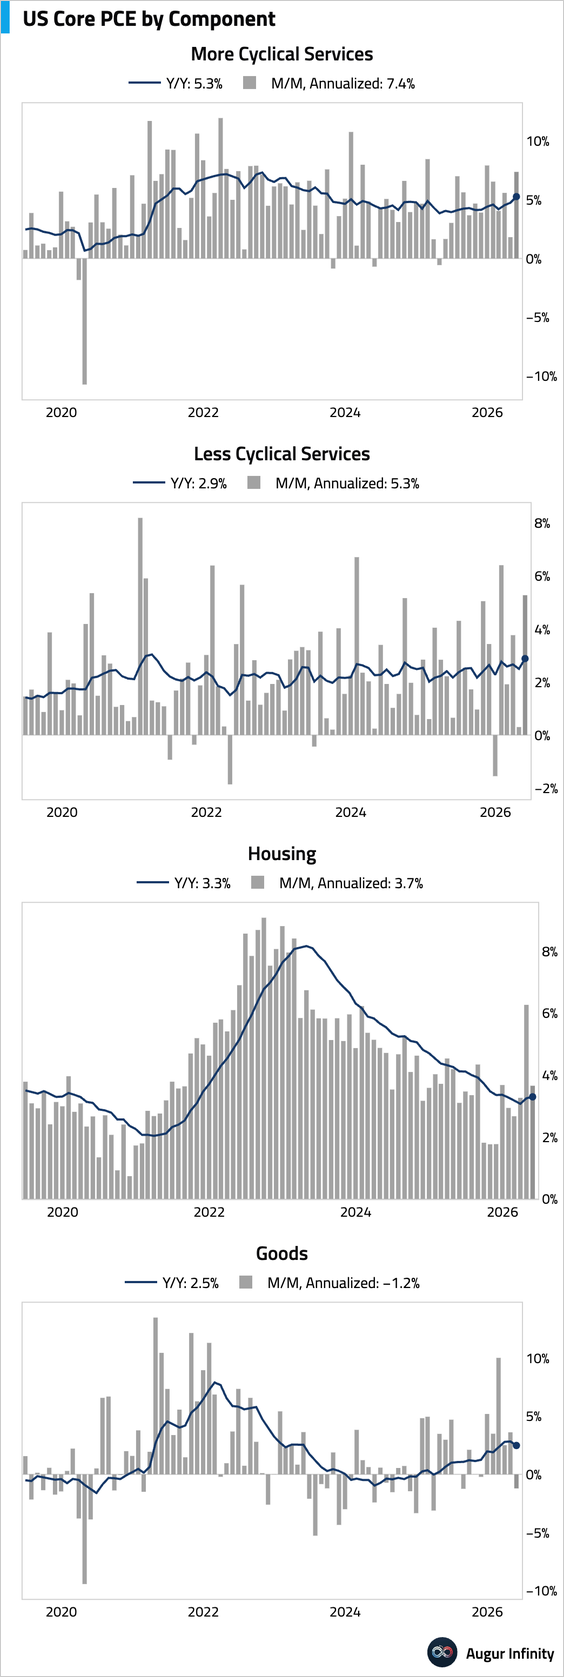
• Trimmed-mean and median PCE inflation accelerated.
/pay
4. Durable goods orders slumped, largely reflecting a decline in commercial aircraft orders following a large increase in April.
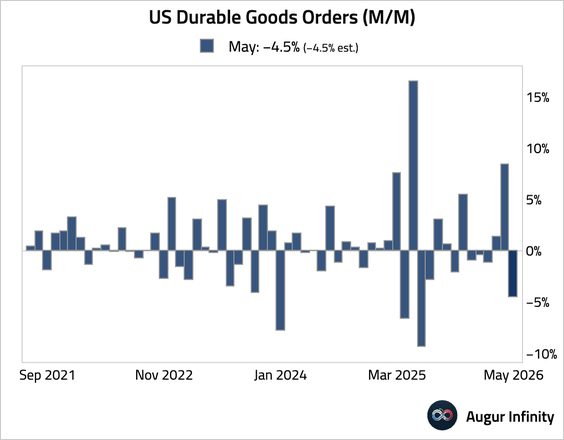
– Stripping out transportation, orders rose by a solid 1.3%, well above consensus.
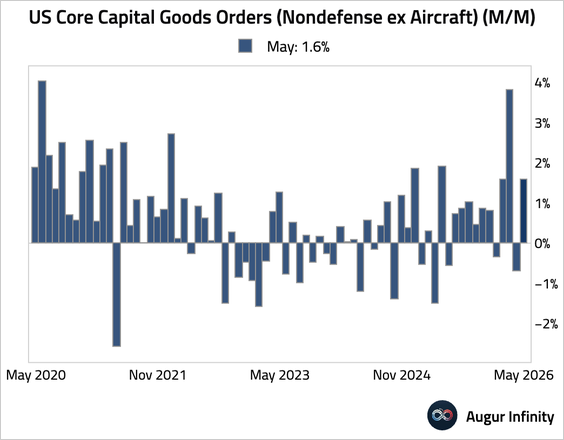
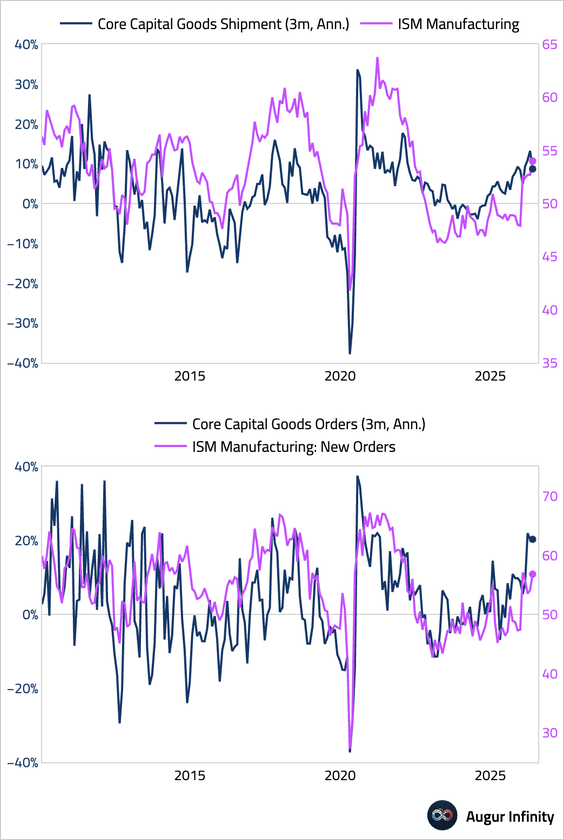
– Core capital goods orders jumped, signaling solid underlying momentum for business investment.
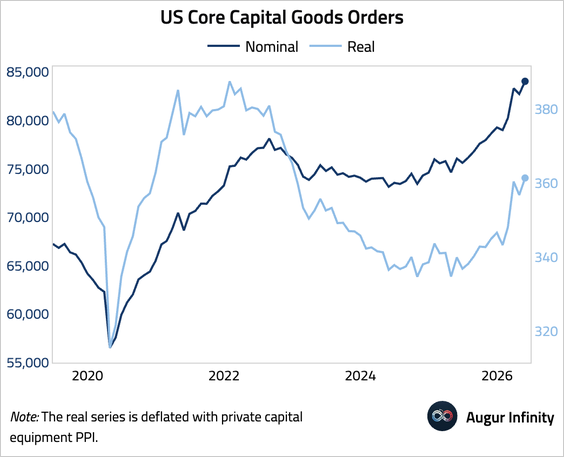
– Here is a look at nominal and real capital goods orders (levels).
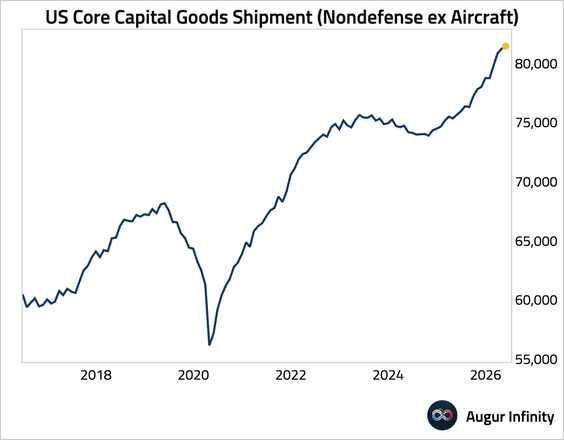
• Core capital goods shipments remained firm.
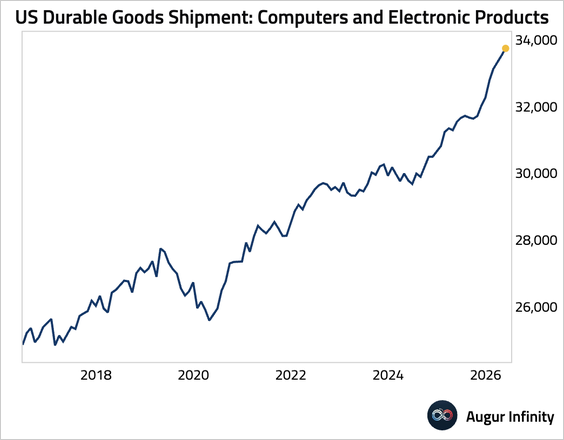
– Shipments of computers and electronic products continued their solid expansion.
• Timely surveys are also consistent with solid business investment.
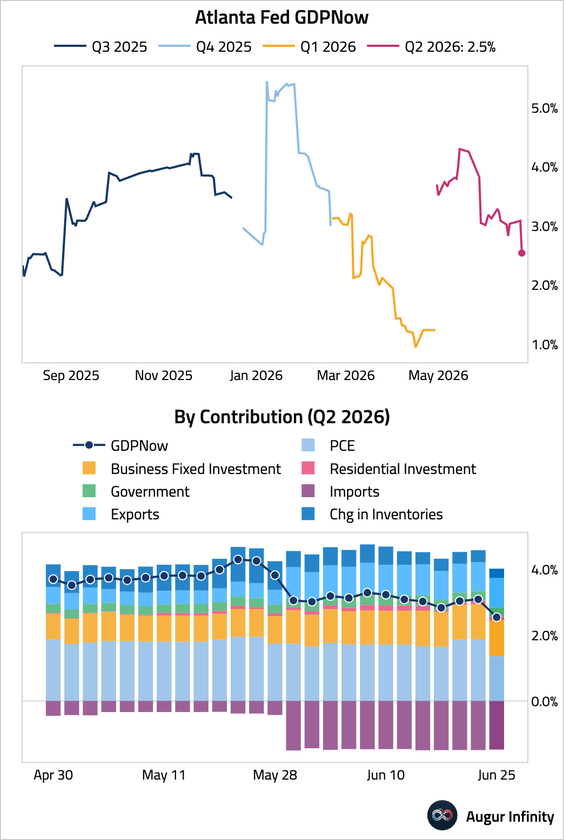
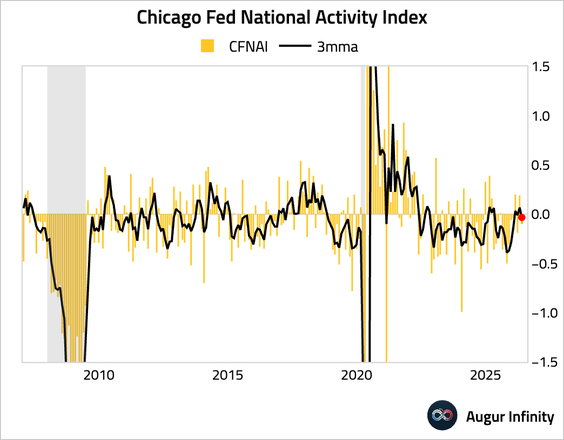
5. The Atlanta Fed’s GDPNow model is now tracking Q2 GDP at 2.5%, down from 3% a week ago.
• The Chicago Fed National Activity Index fell, pulling the three-month moving average back to negative territory and suggesting economic growth was slightly below trend.
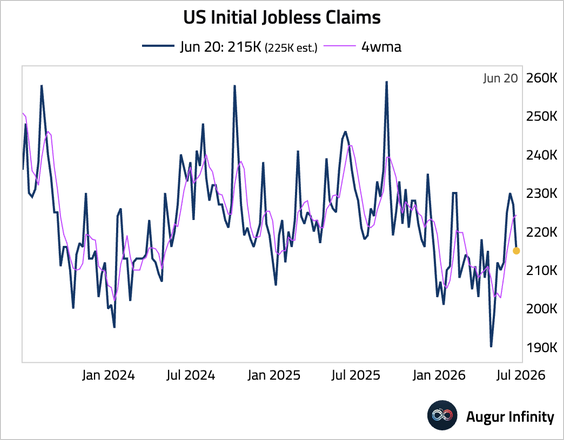
6. Initial jobless claims fell to 215,000, below consensus and signaling limited layoffs.
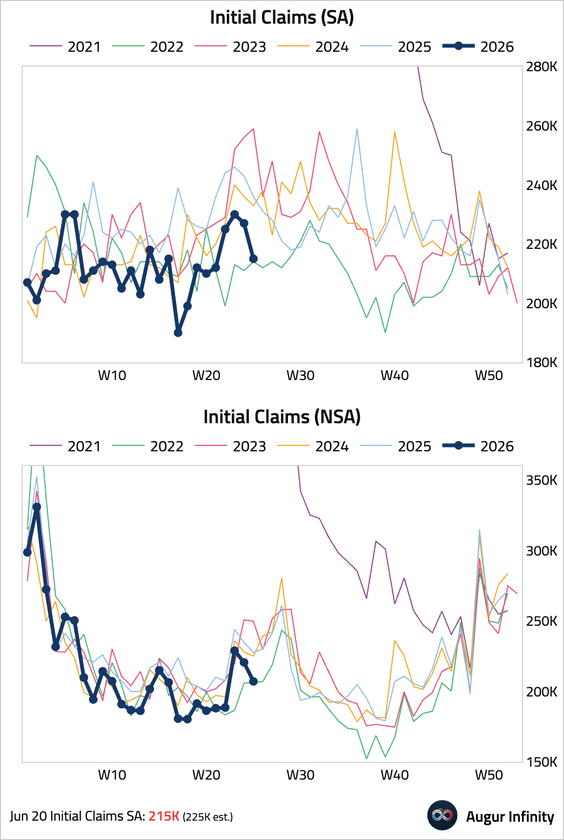
– The four-week moving average edged up.
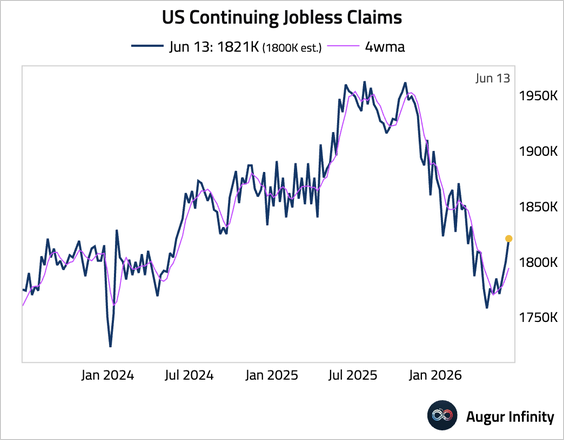
• Continuing claims ticked up, but remained lower than the same period last year.
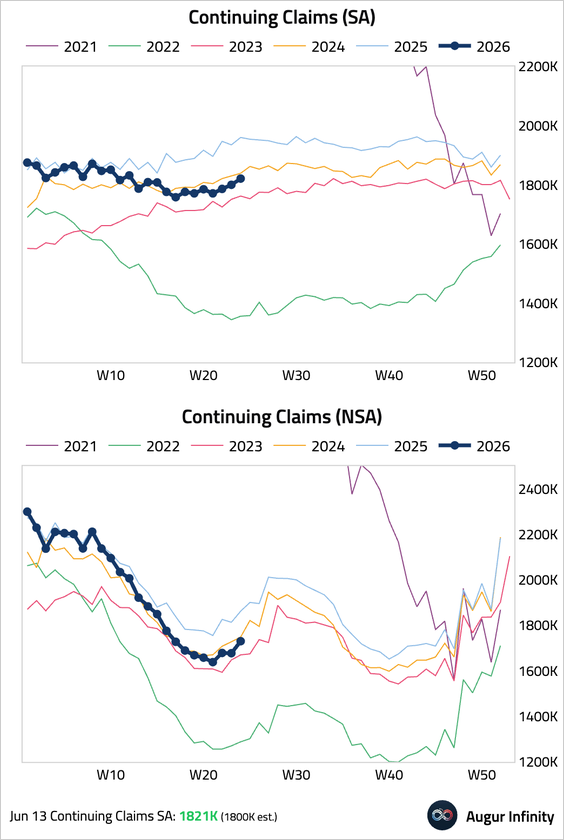
– The four-week moving average rose slightly.
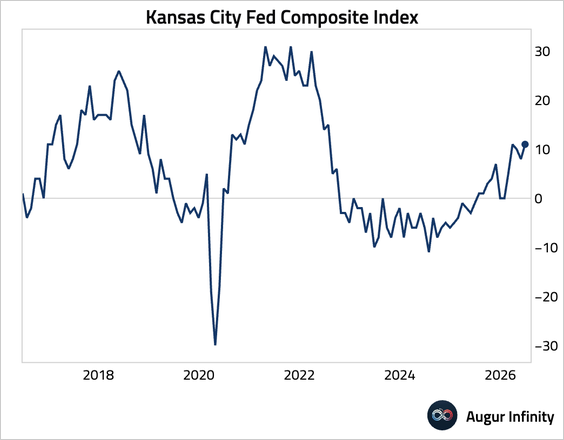
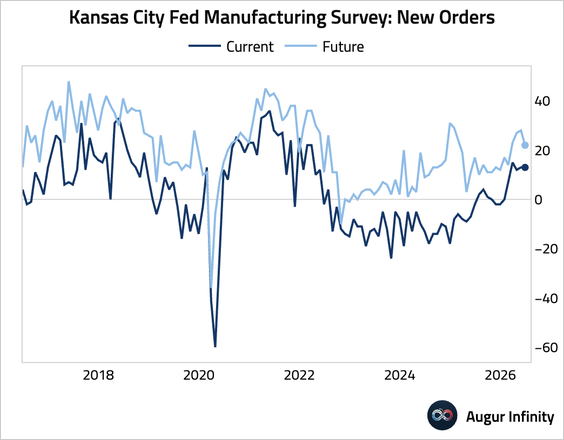
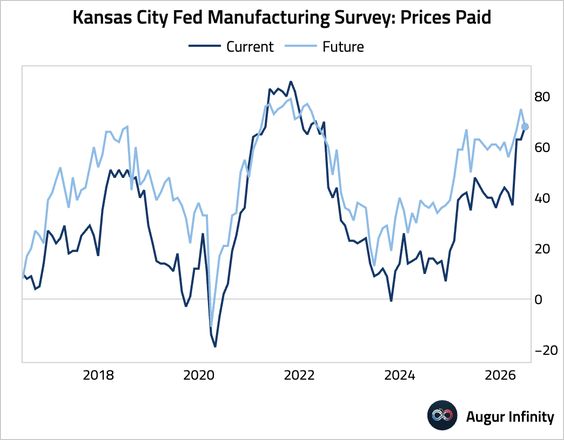
7. The Kansas City Fed’s composite manufacturing index rose.
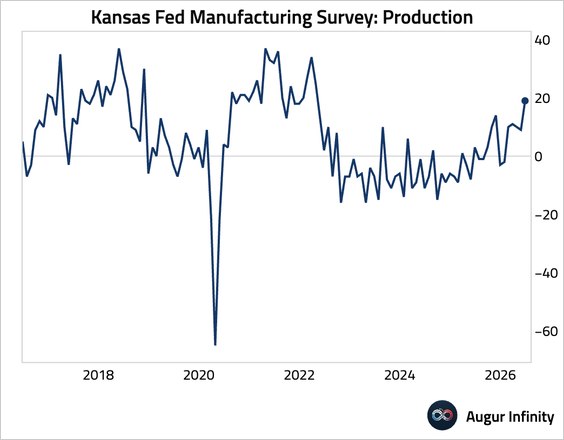
• Production (surged):
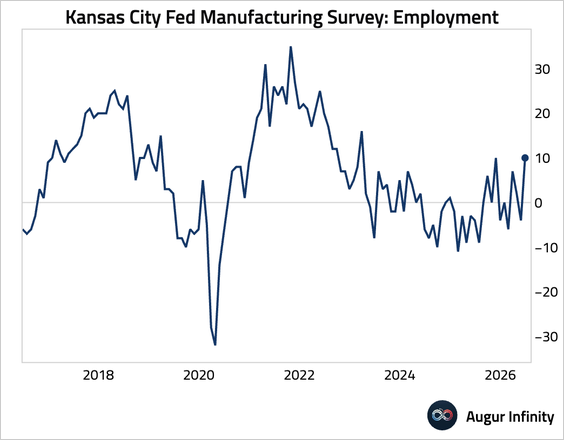
• Employment (jumped back into expansionary territory):
• New orders (stable):
• Price pressure (elevated):
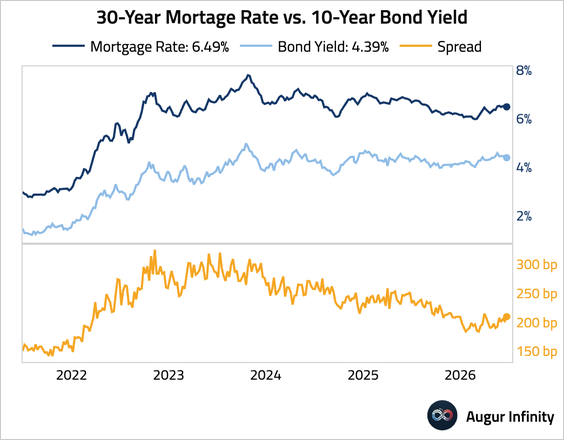
8. Mortgage rates edged up to 6.49% this week, continuing to restrain the US housing market.
Canada
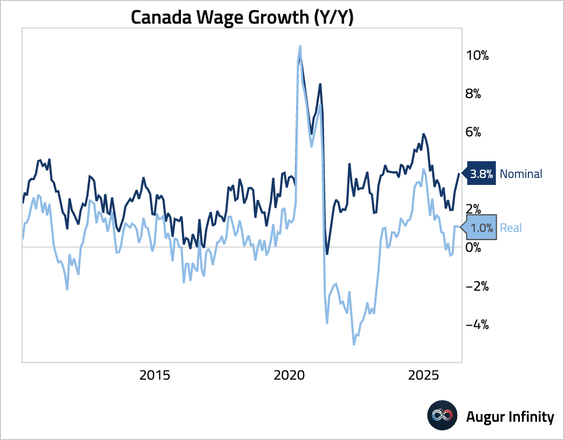
1. Nominal weekly earnings growth accelerated to the fastest pace in over a year. Adjusted for inflation, however, real wage growth edged down.
The United Kingdom
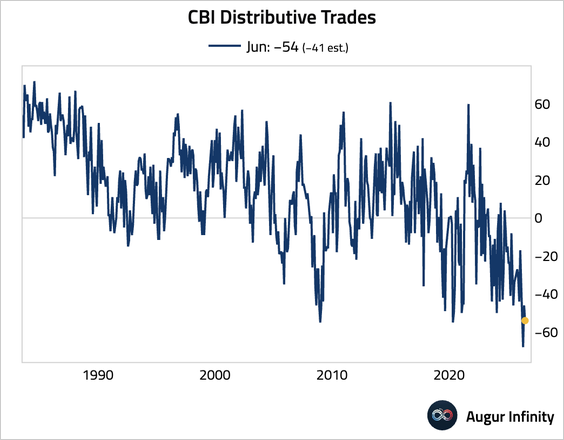
1. The CBI distributive trades balance deteriorated, signaling persistent weakness in the retail sector.
Euro Area
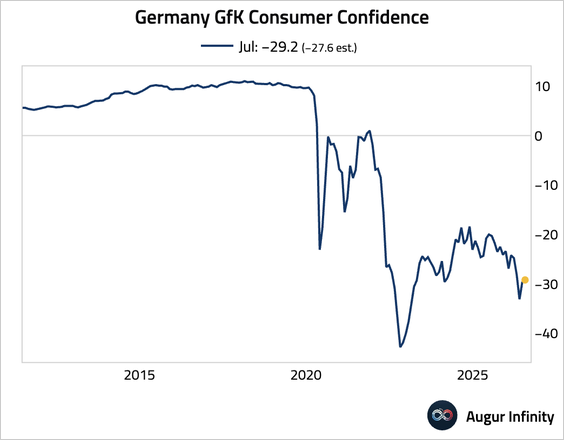
The GfK consumer confidence improved slightly to −29.2 from −29.7. The muted improvement came despite falling oil prices, partly because a temporary fuel duty cut is expiring.
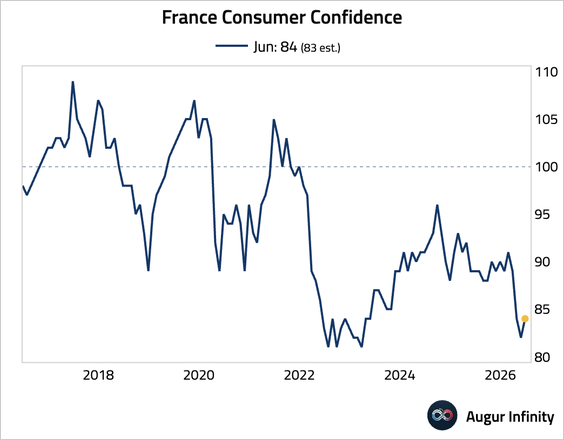
1. French consumer confidence rebounded, driven by easing energy prices, which lowered inflation fears and improved households’ financial outlooks.
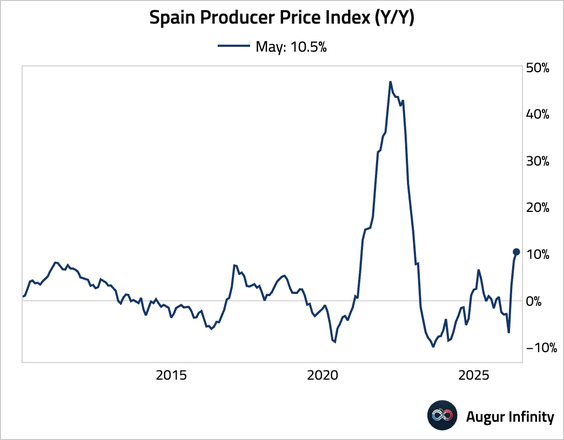
2. Spanish producer price inflation accelerated to the highest reading since December 2022, signaling renewed pipeline price pressures.
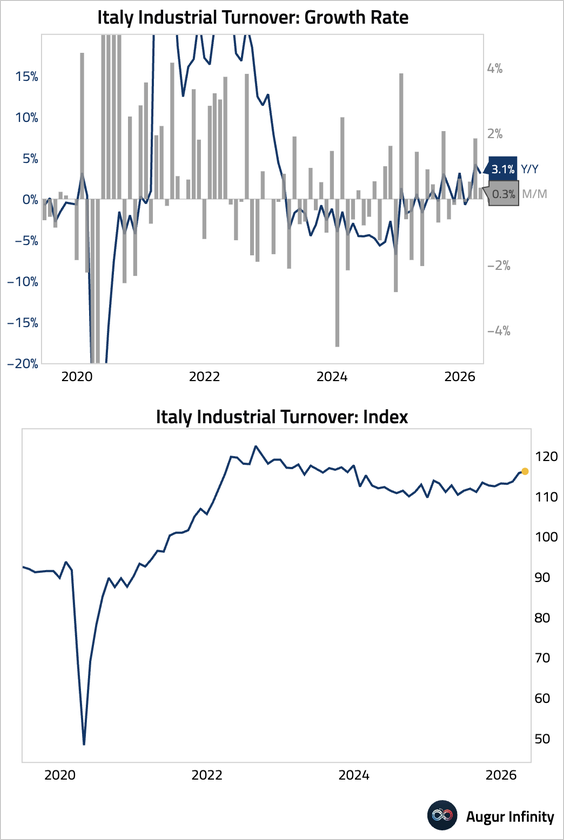
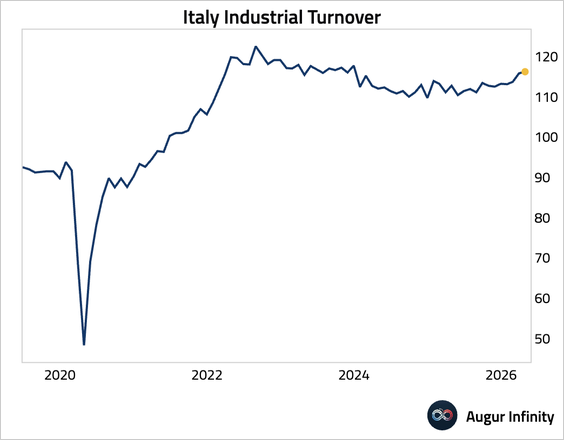
3. Italian industrial sales growth moderated in April.
Europe
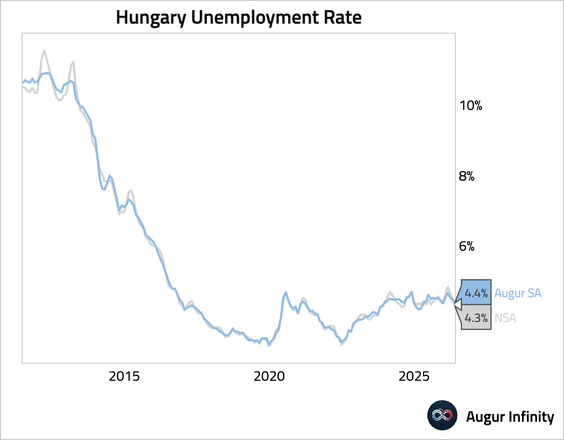
1. Hungary’s unemployment rate fell.
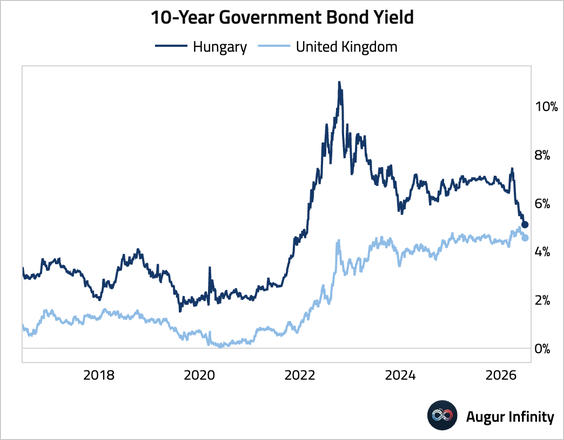
• Hungary’s government bond yields are approaching those of the UK.
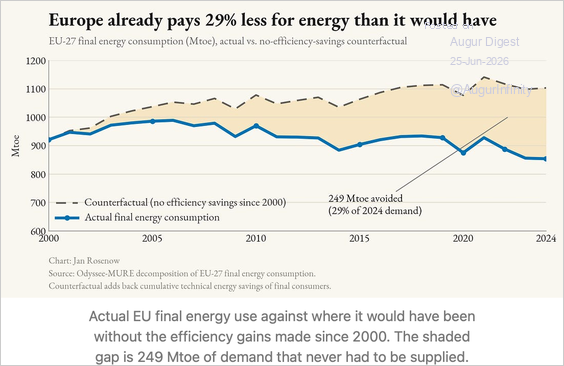
2. Europe’s energy efficiency gains since 2000 have reduced final energy consumption by 29%.
Source: Bright Spots Read full article
Japan
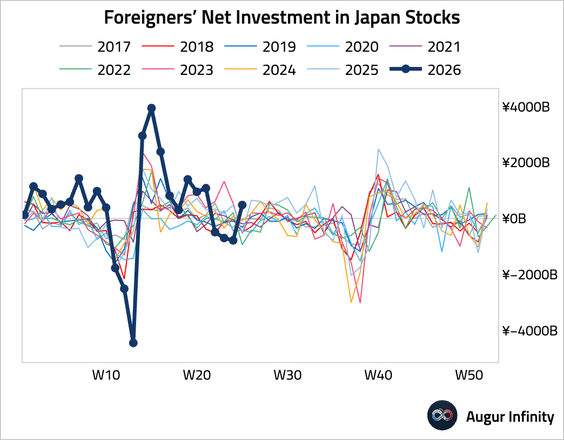
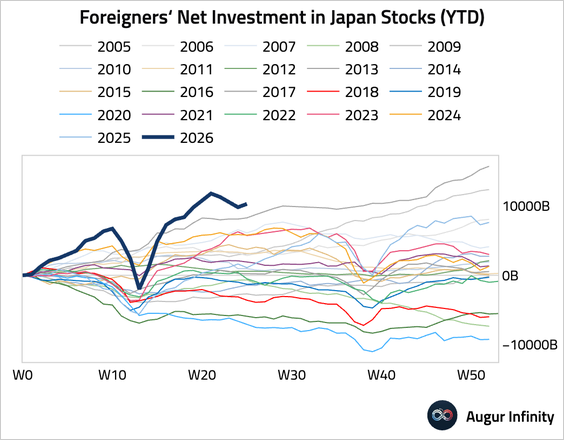
1. Foreign investors returned to Japanese equities.
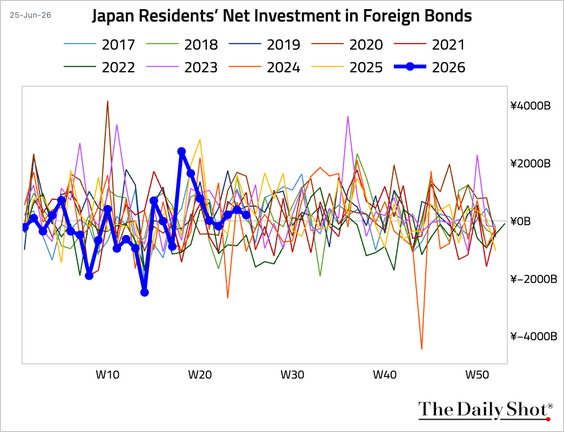
• Japanese investors also resumed buying foreign stocks, …
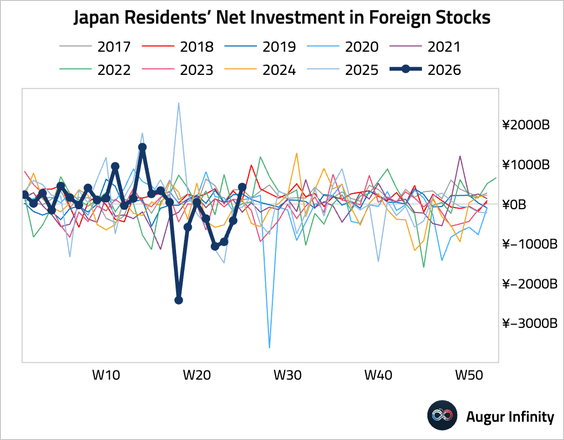
… while continuing to purchase foreign bonds, though at a slower pace than the previous week.
2. Buybacks and dividends have surged mainly due to corporate reforms.
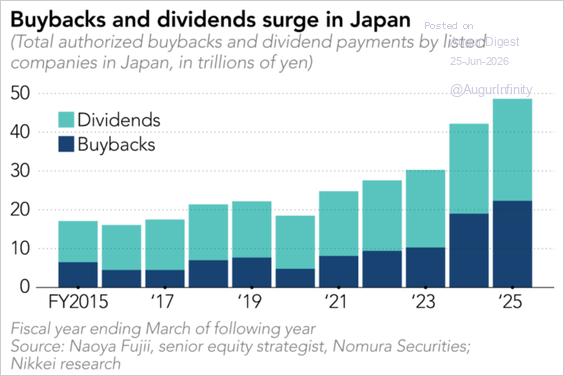
Source: Nikkei Asia Read full article
• Activist campaigns have targeted larger companies in recent years.
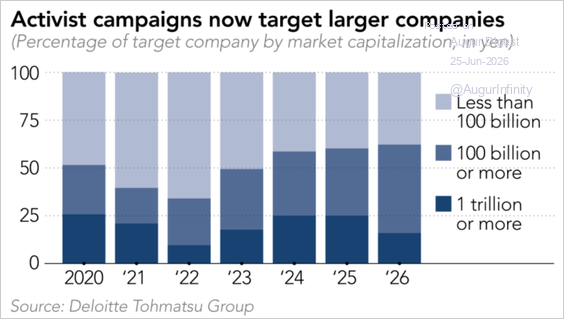
Source: Nikkei Asia Read full article
Asia-Pacific
1. Australia’s labor market remained resilient, with employment rebounding more than expected, although the gain was concentrated in part-time jobs.
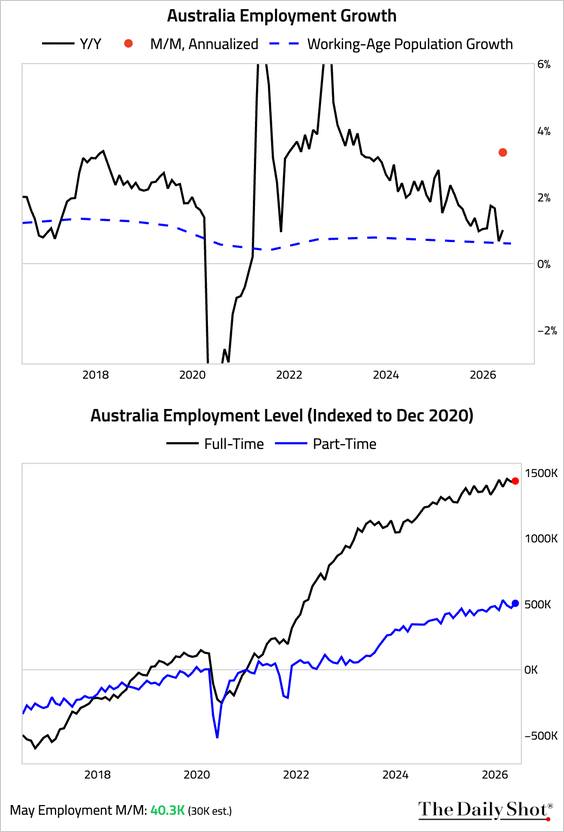
– The unemployment rate ticked down.
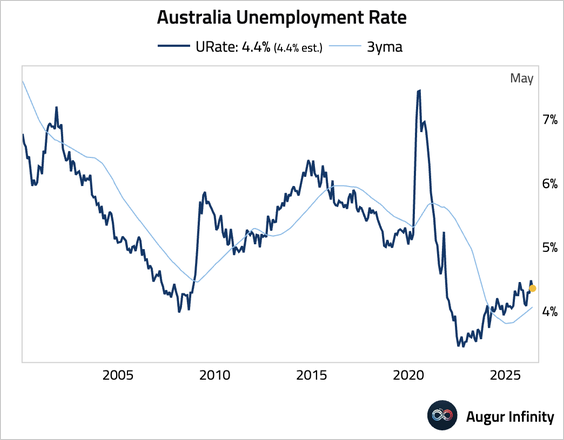
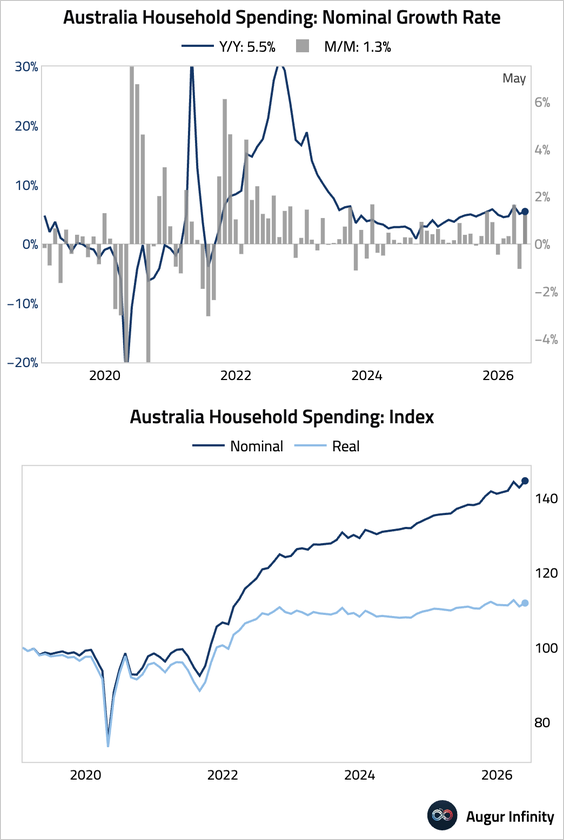
• Household spending jumped, driven by a strong rebound in discretionary spending.
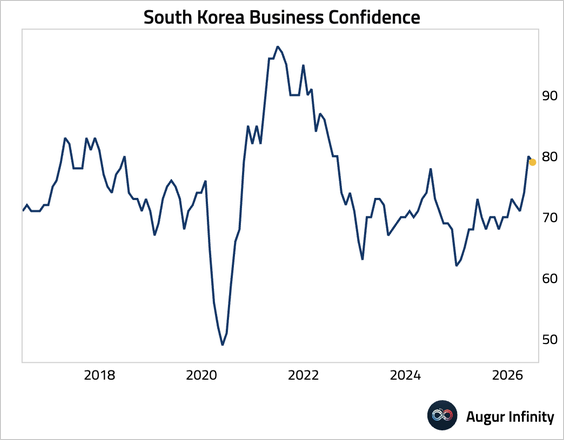
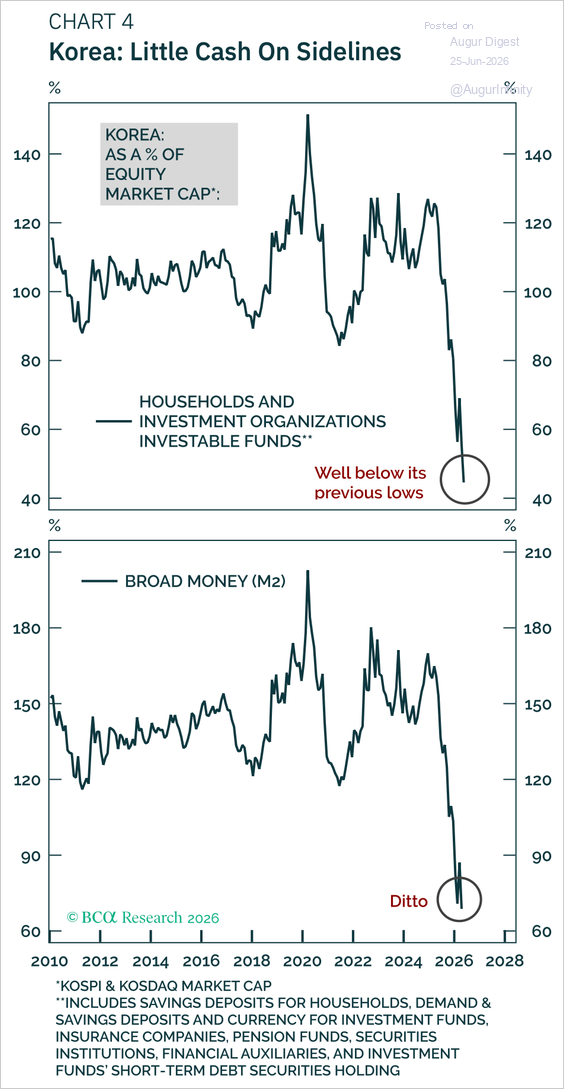
2. South Korean business confidence edged down.
• Korean retail investors have been buying foreign stocks—particularly US equities—in recent years. Since late last year, they have also poured money into local stocks, offsetting outflows from foreign investors.
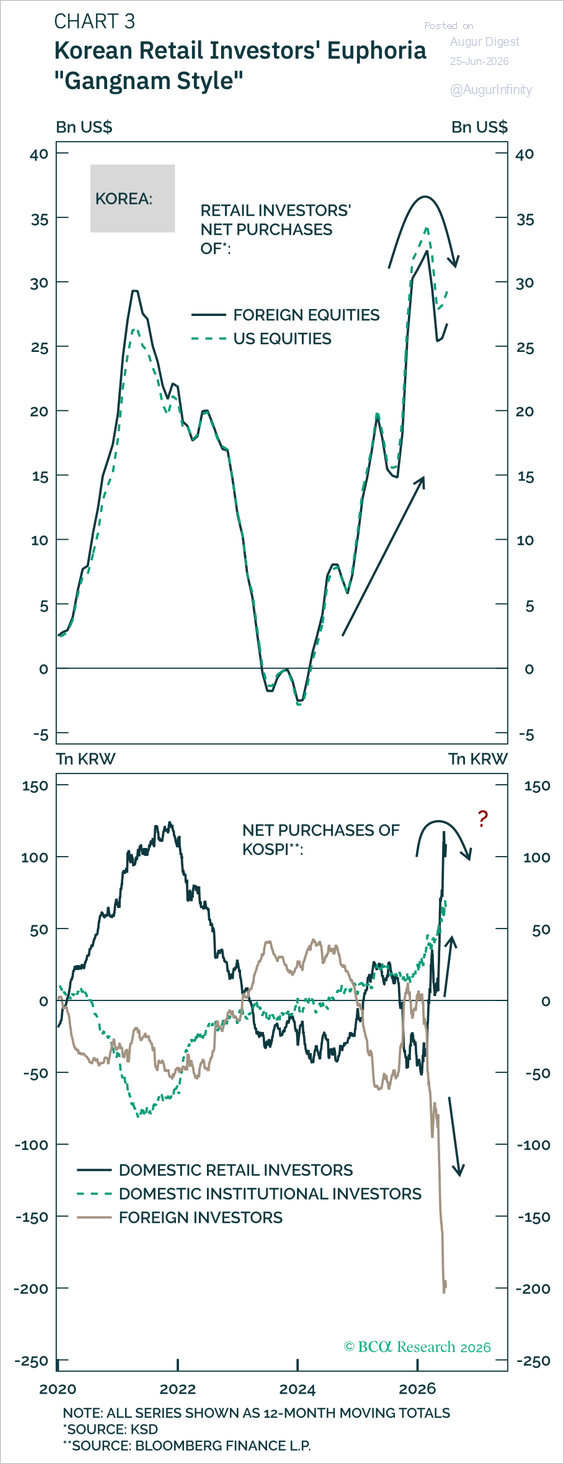
Source: Arthur Budaghyan, BCA Research
– Korea’s cash on the sidelines relative to equity market capitalization has fallen to a record low, suggesting limited liquidity to absorb selling pressure and leaving the equity market increasingly vulnerable to a correction, according to BCA research.
Source: Arthur Budaghyan, BCA Research
Emerging Markets
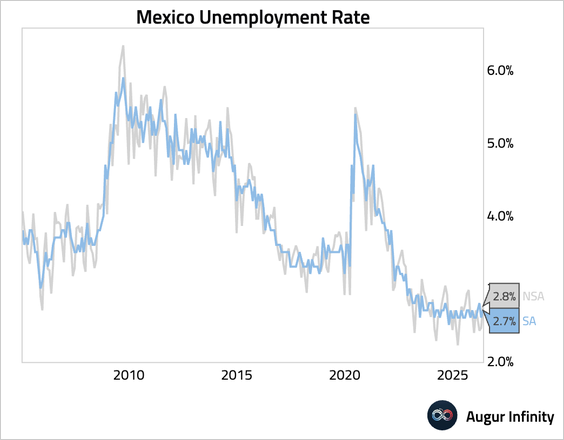
1. Mexico’s unemployment rate remained low, indicating still-tight labor market conditions.
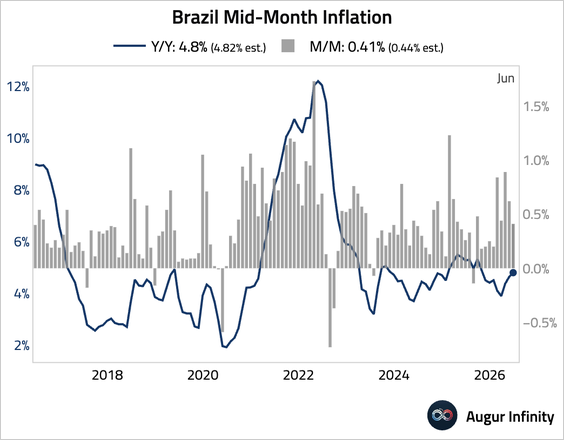
2. Brazil’s mid-month inflation was slightly lower than expected. The month-over-month increase was the largest for a June in four years, driven by food and housing costs.
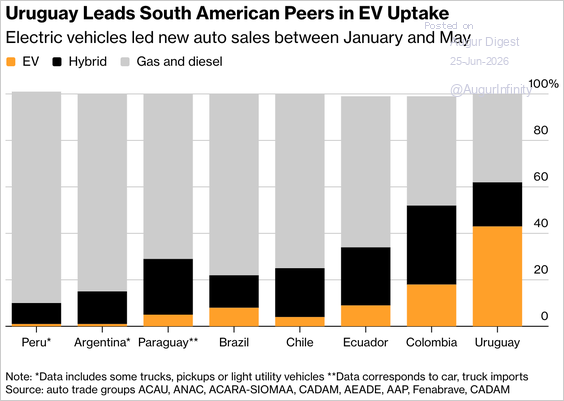
3. Uruguay’s EV sales have overtaken gasoline and diesel vehicle sales for the first time, driven by Latin America’s highest fuel prices and generous tax incentives.
Source: Bloomberg Read full article
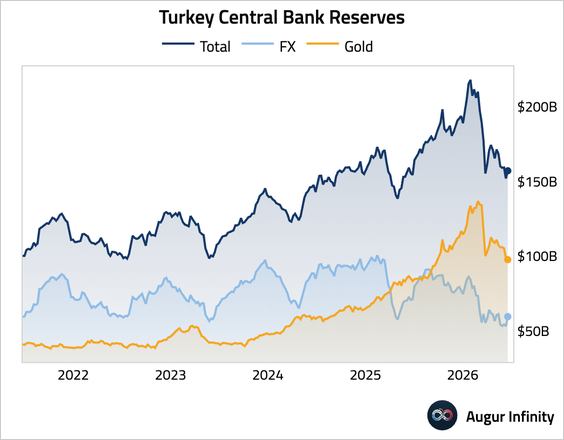
4. Turkey’s central bank reserves rebounded.
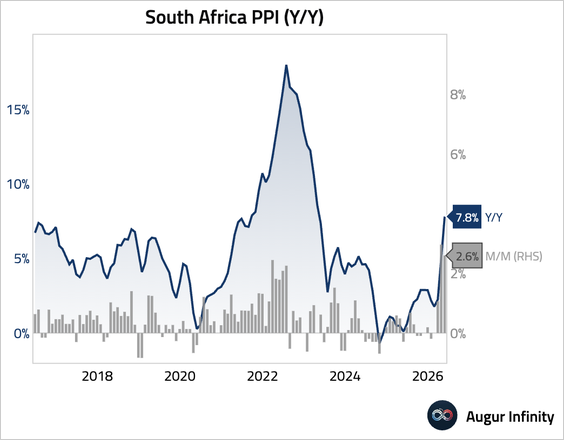
5. South Africa’s producer price inflation surged to the highest level in over three years, pointing to persistent pipeline price pressures.
6. Argentina’s sovereign spread relative to US Treasuries has fallen to about 430 bps, improving market access and increasing expectations that the government could soon return to international debt markets.
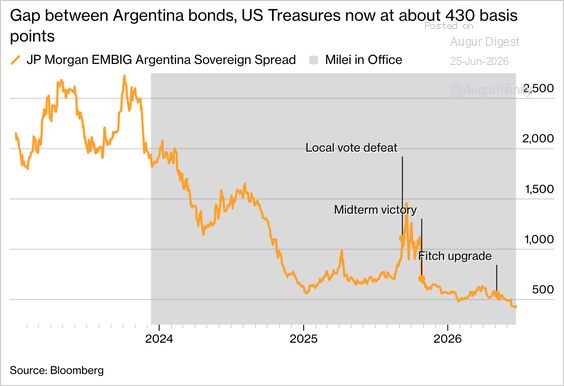
Source: Bloomberg Read full article
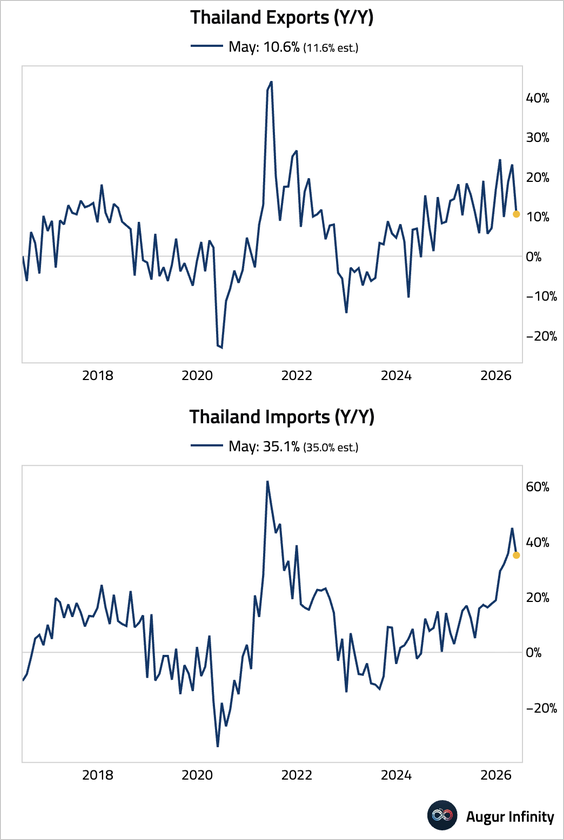
7. Thailand’s trade deficit remained much wider than last year.
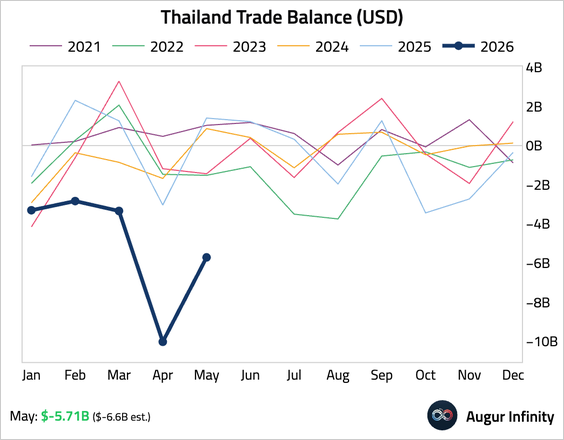
• Export growth fell sharply, while import growth also eased.
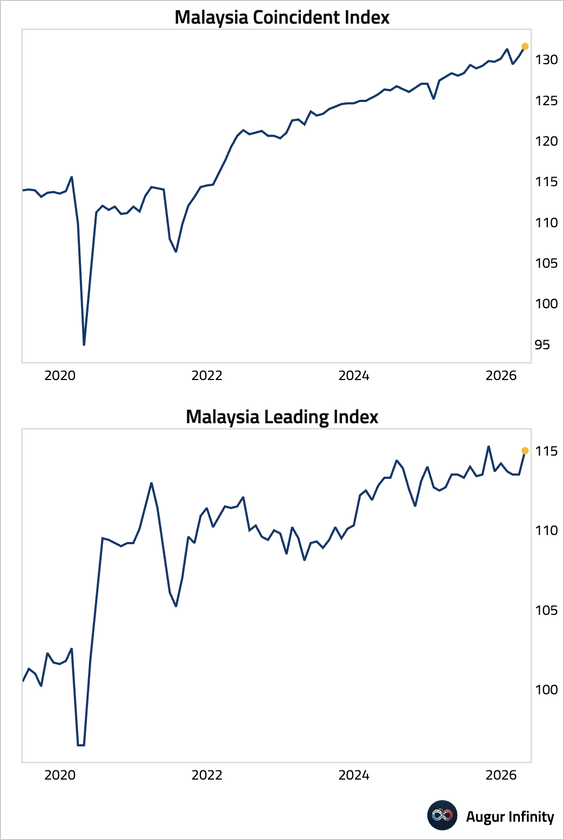
8. Malaysia’s coincident and leading indices both accelerated, pointing to an improving economic outlook.
9. Russia’s industrial output unexpectedly contracted in May.
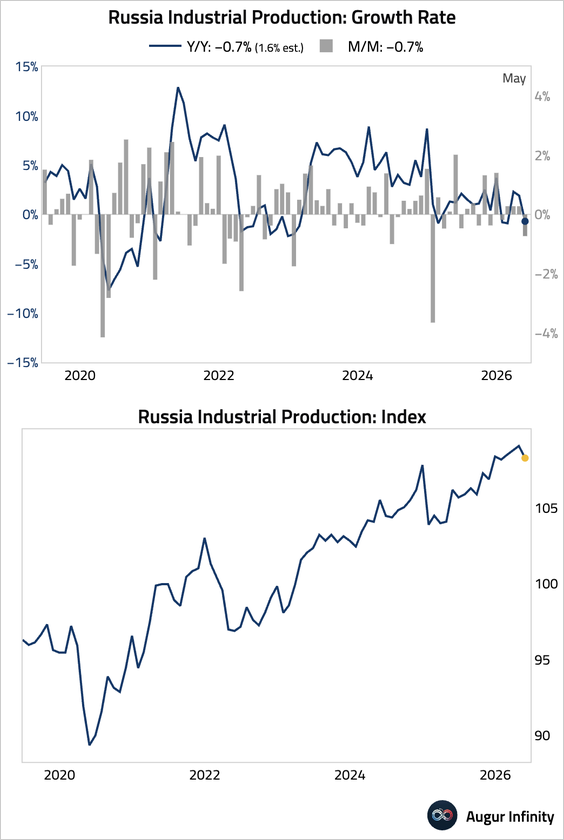
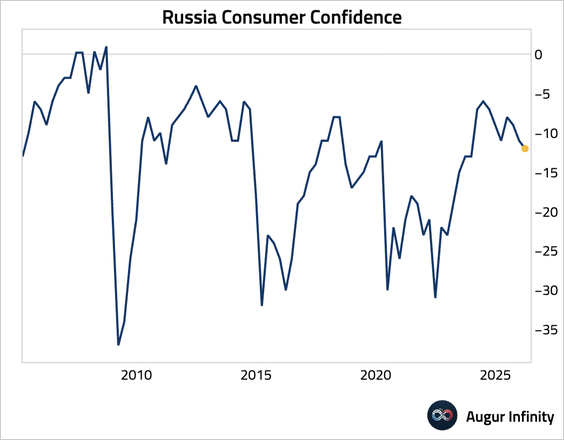
• Consumer confidence slipped in Q2.
Equities
1. Let’s begin with some updates on earnings and valuation.
• Analysts continue to revise up EPS forecasts for the rest of 2026.
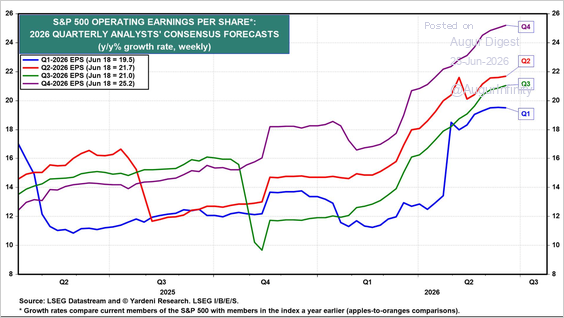
Source: Yardeni Research
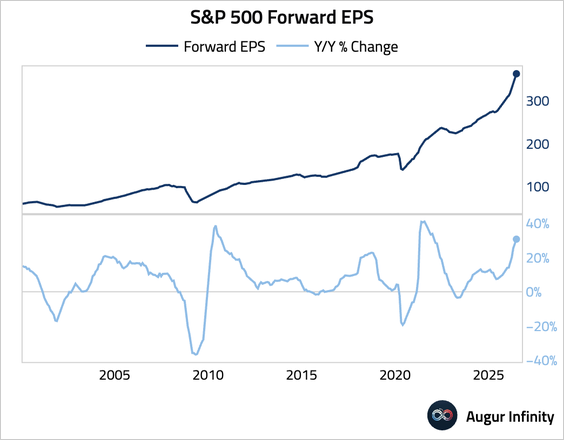
• Growth in forward EPS has been accelerating.
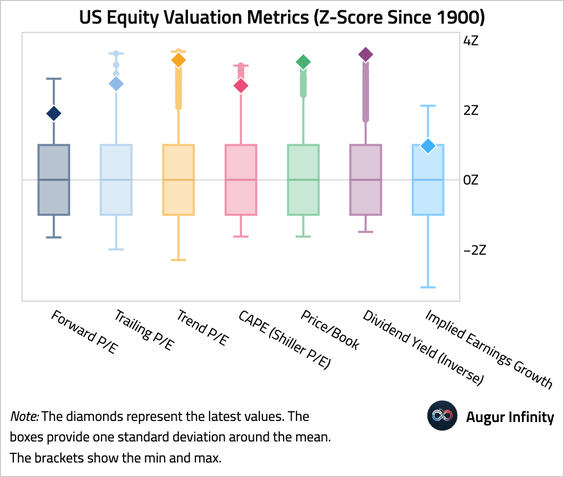
• This chart summarizes US equity valuation metrics since 1900. Nearly all measures are near or over two standard deviations away from the long-term mean.
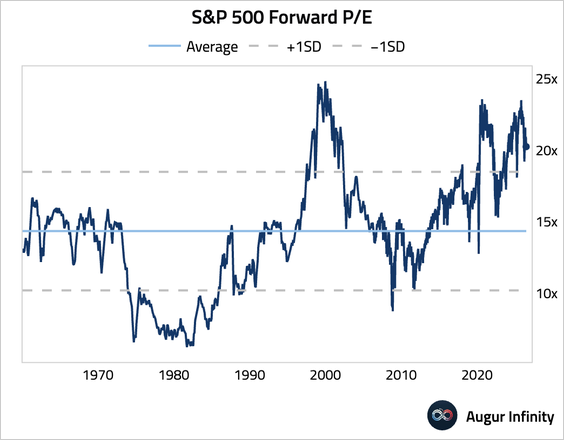
• S&P 500 forward P/E has declined this month but remains elevated.
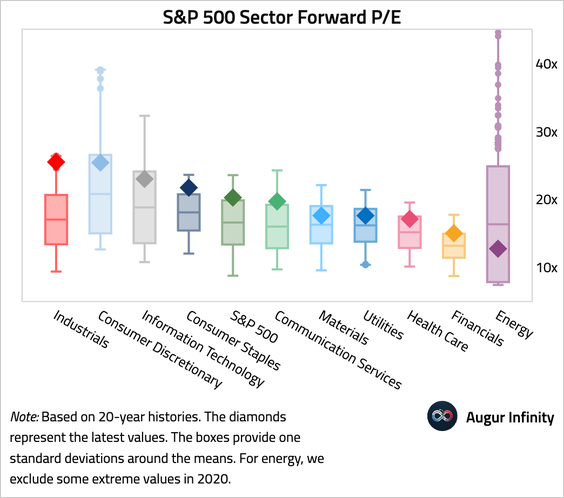
• Here’s an overview of S&P 500 sector forward P/Es, summarized over the past 20 years.
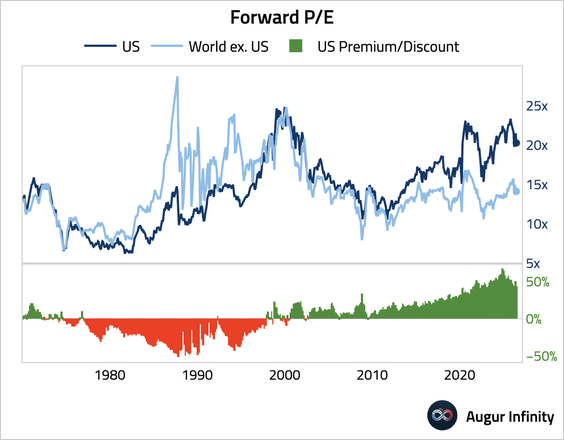
• US equities are trading at a 43% premium relative to the rest of the world.
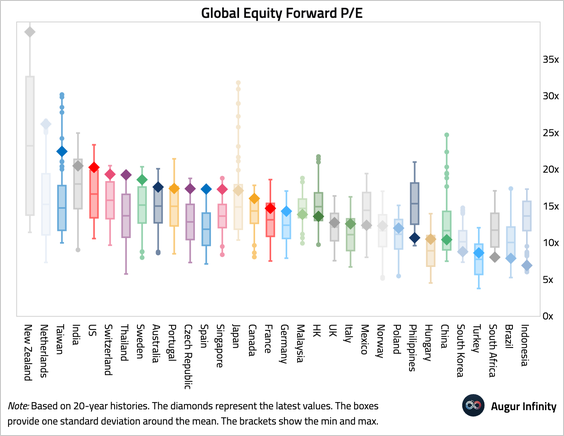
• Here’s global equity valuation by country.
2. Next, let’s scan through some sector developments.
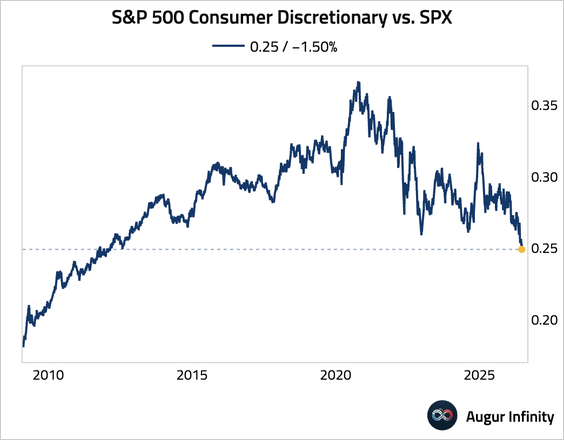
• The ratio of the consumer discretionary sector to S&P 500 is at the lowest level since August 2012.
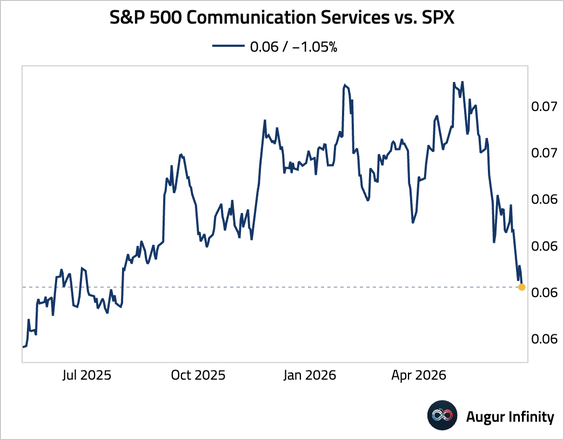
• Communication services continued to slump relative to the broader market.
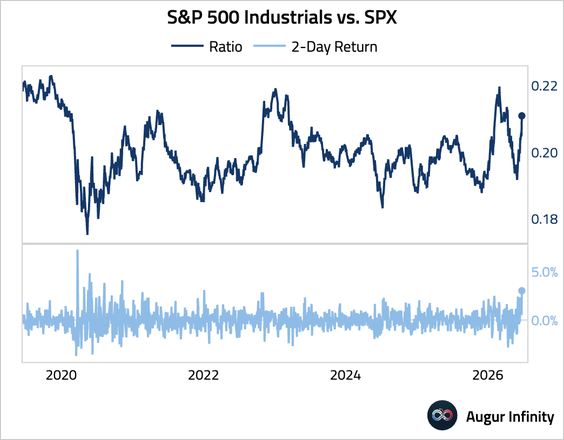
• The industrials sector outperformed the S&P 500 over the past two days by the widest margin since November 2020.
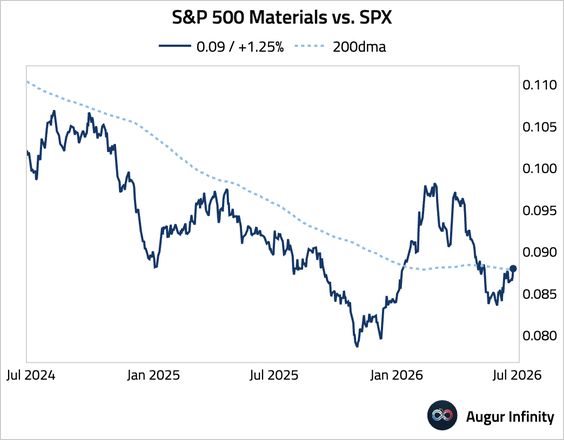
• The ratio of the materials sector to the S&P 500 broke above its 200-day moving average.
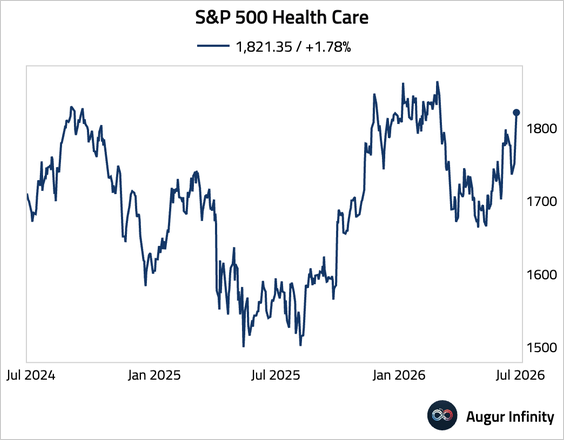
• The health care sector has rebounded to the highest level since March 2026.
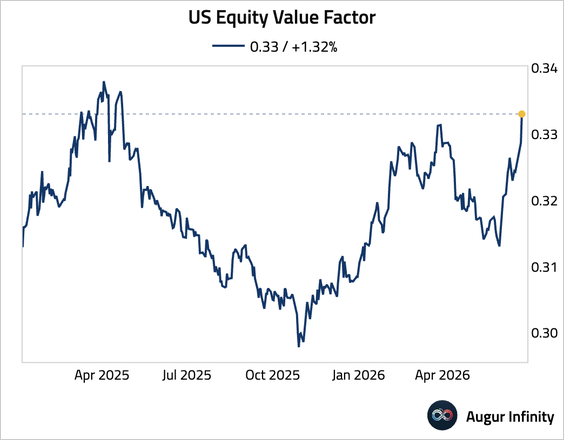
3. The US equity growth factor has slumped to the lowest level since April 2025, …
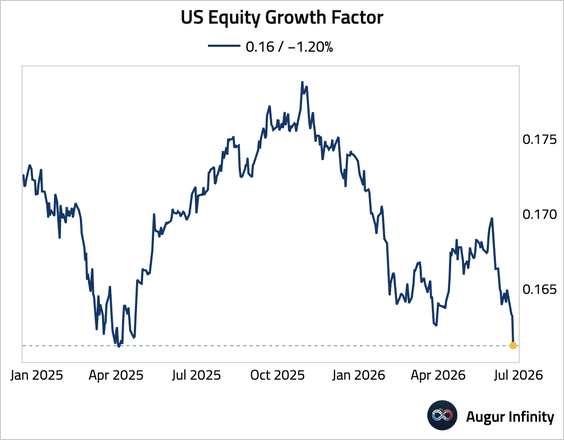
… while the value factor is trading at the highest level since April 2025.
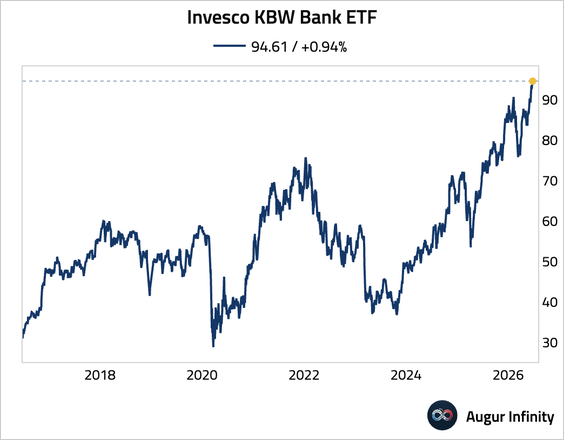
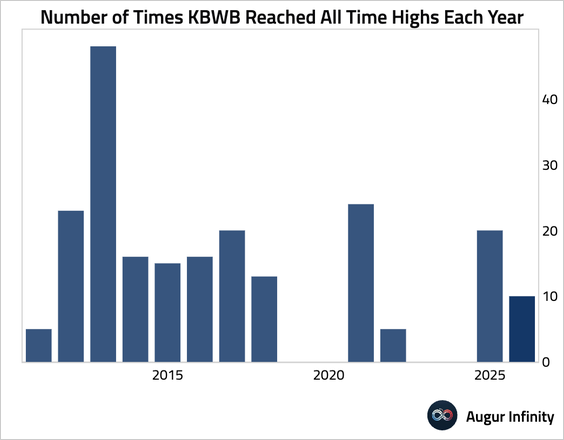
4. The Invesco KBW Bank ETF has reached its 10th record high this year.
5. Airline stocks have rebounded as oil prices eased.
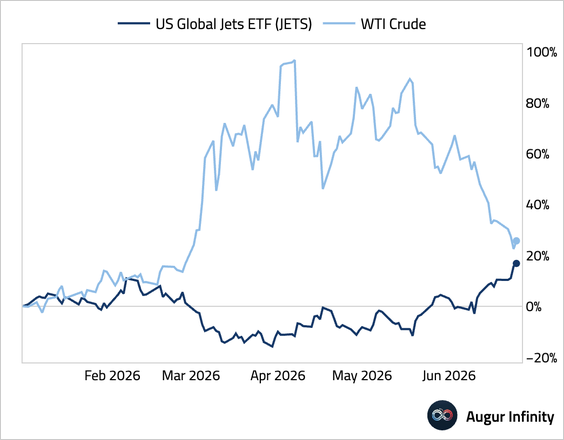
Source: h/t @markets Read full article
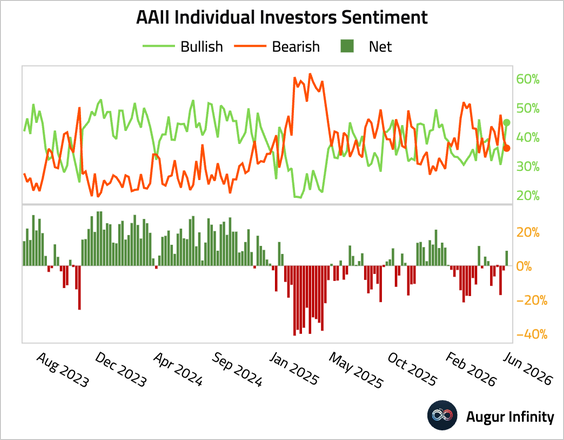
6. The AAII Bull–Bear spread (retail investor sentiment) turned positive for the first time in a month and a half.
7. Based on the Herfindahl-Hirschman Index (HHI), US equity market concentration has surpassed dot-com-era highs at both the sector and sub-industry levels, reflecting increasingly narrow market leadership.
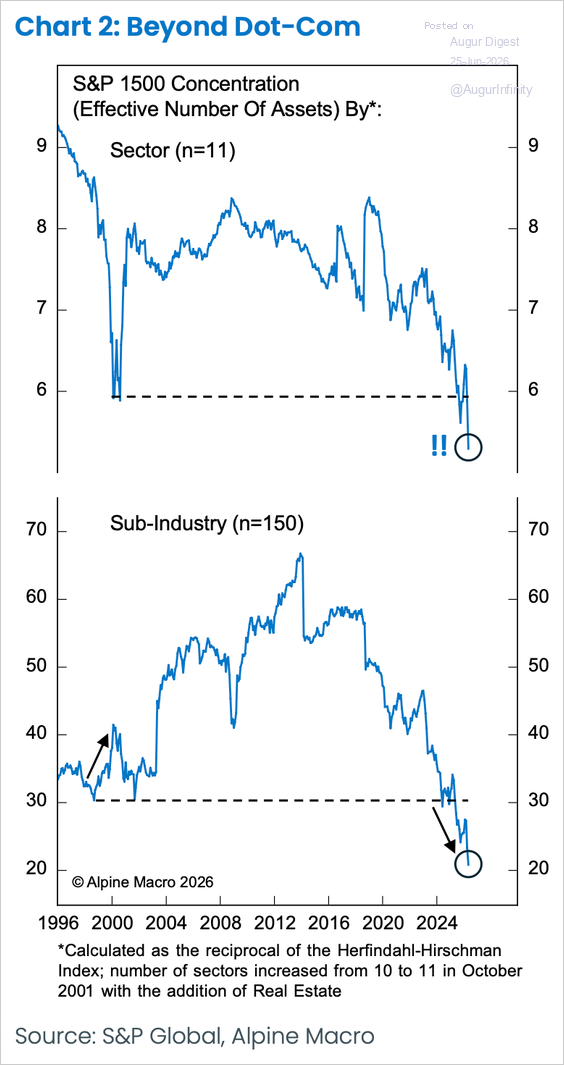
Source: Alpine Macro
• A century-long measure of US equity market concentration shows today’s concentration is elevated but not unprecedented, with comparable peaks occurring in the late 1920s and late 1950s.
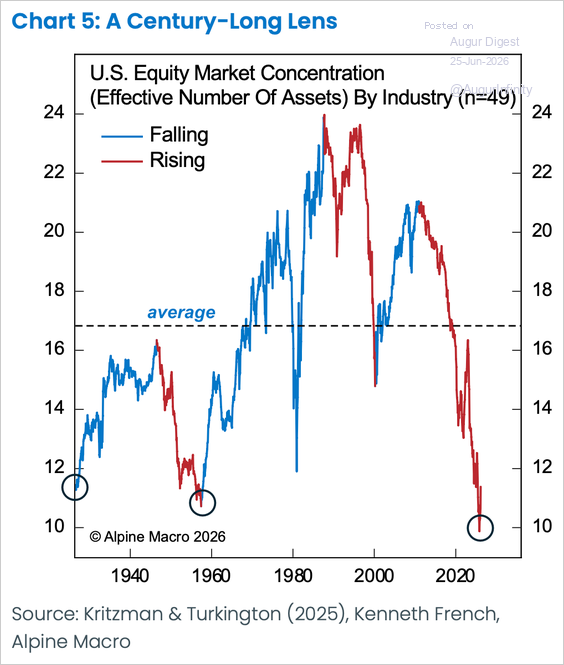
Source: Alpine Macro
Rates
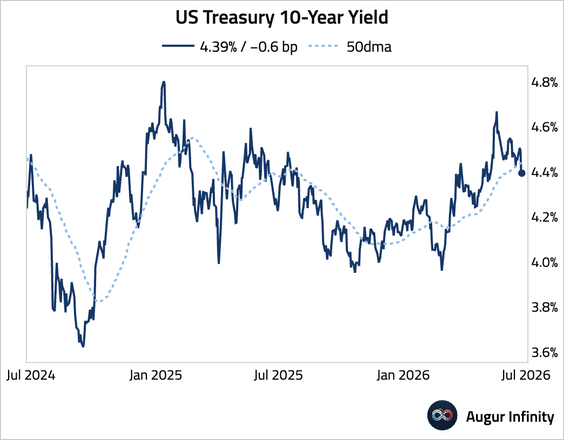
1. The US Treasury 10-year yield edged down today after bouncing in the previous session.
2. Fed research shows that hedge funds’ Treasury exposure has doubled since 2023, with the cash-futures basis trade now accounting for about $830 billion. The research warned that the combination of high leverage and concentrated positions could amplify systemic risks during periods of market stress.
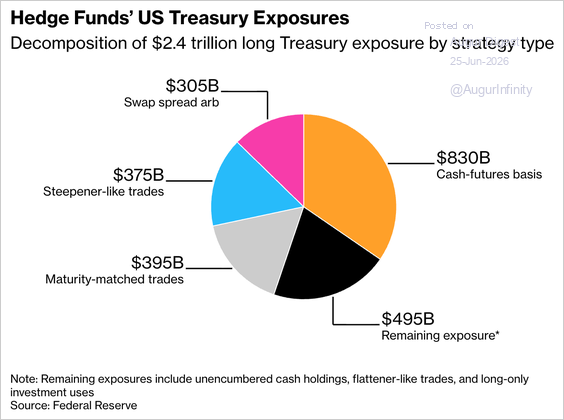
Source: @economics Read full article
Credit
1. US investment-grade bond issuance reached a record June volume, driven by $25 billion offerings from Nvidia and SpaceX.
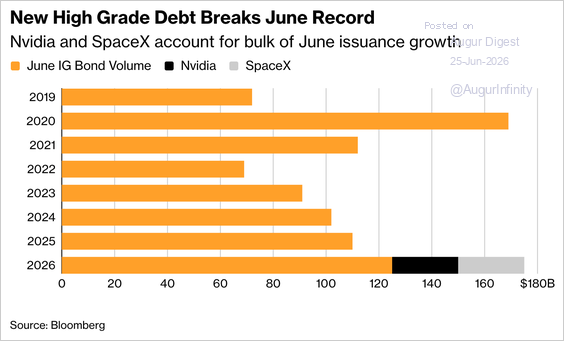
Source: @markets Read full article
2. European loan spreads have reached their tightest levels since 2017 as record CLO demand outpaces supply. Borrowers have taken advantage of this dynamic, aggressively cutting their debt costs, according to PitchBook.
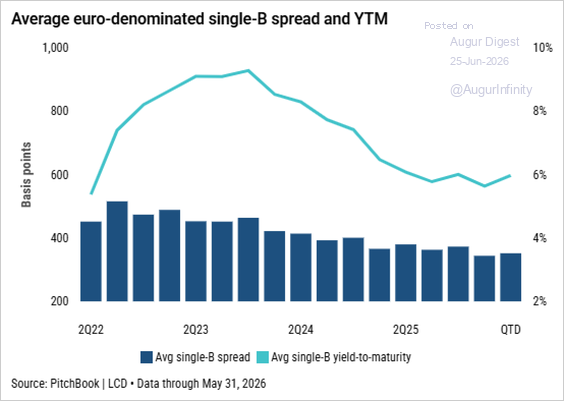
Source: PitchBook
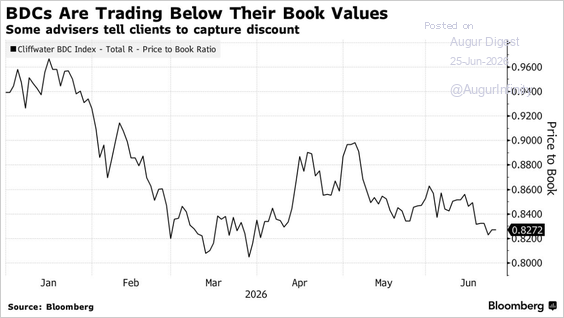
3. With BDCs trading below book values, some advisers are recommending that investors redeem non-traded private credit BDCs at net asset value and reinvest in comparable publicly traded BDCs, although differences in portfolio composition, leverage, and fees make the arbitrage less straightforward than it appears.
Source: @markets Read full article
Energy
1. Insiders are starting to buy energy stocks again.
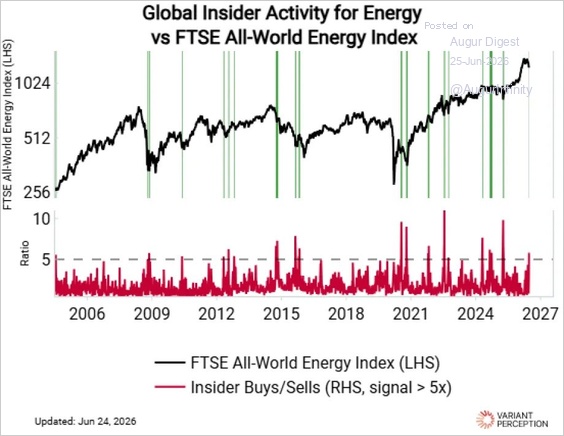
Source: Variant Perception
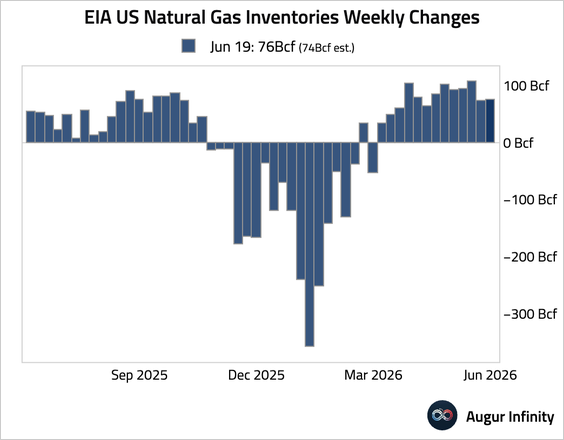
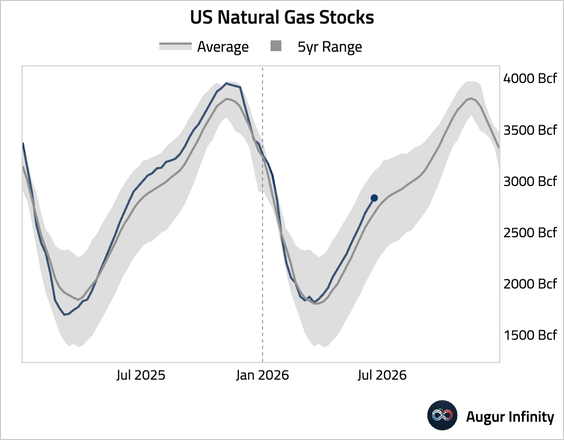
2. US natural gas stocks posted a stronger-than-expected build.
Commodities
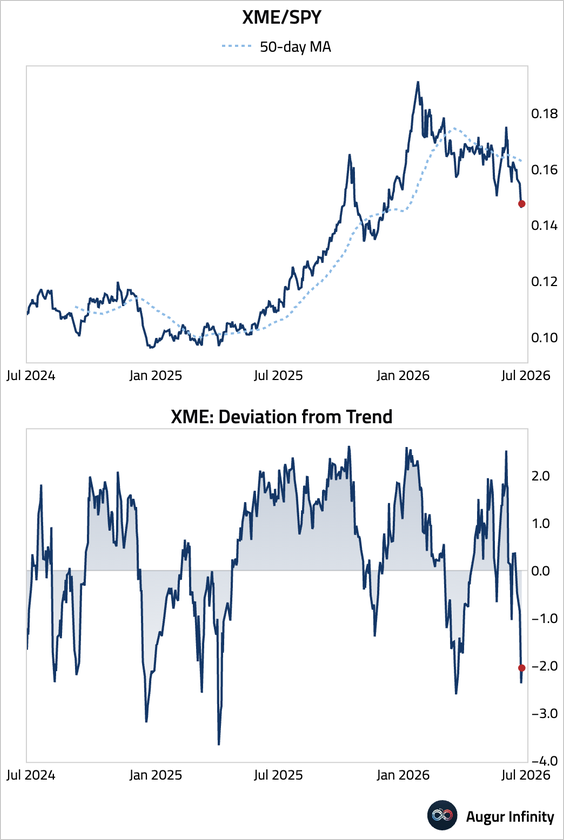
1. The SPDR Metals & Mining ETF (XME) appears oversold after lagging the S&P 500.
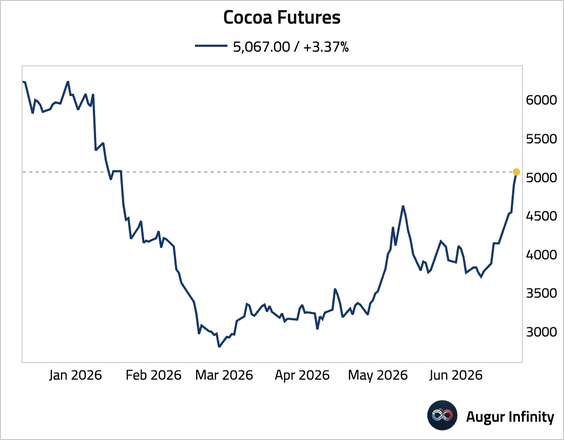
2. Cocoa has jumped to the highest level since January.
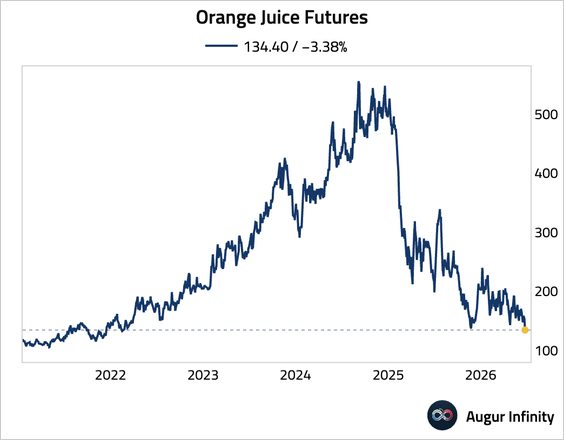
3. Orange juice fell to the lowest level since February 2022.
Global Developments
1. Monetary policy has been driving the recent uplift in the dollar.
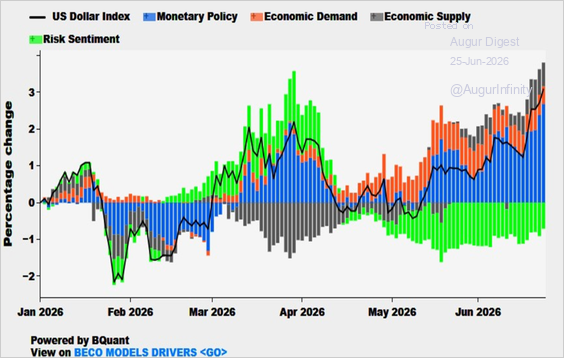
Source: Bloomberg
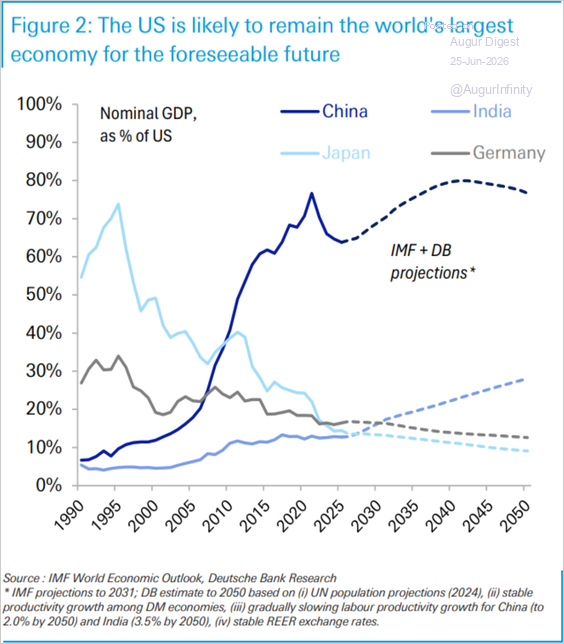
2. The US has consistently outpaced its rivals over the past two and a half centuries …
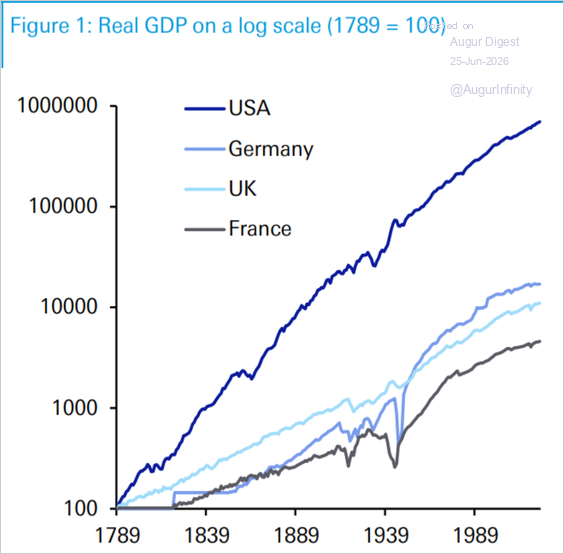
Source: Deutsche Bank Research
… and its dominance is projected to endure over the coming decades.