
The United States
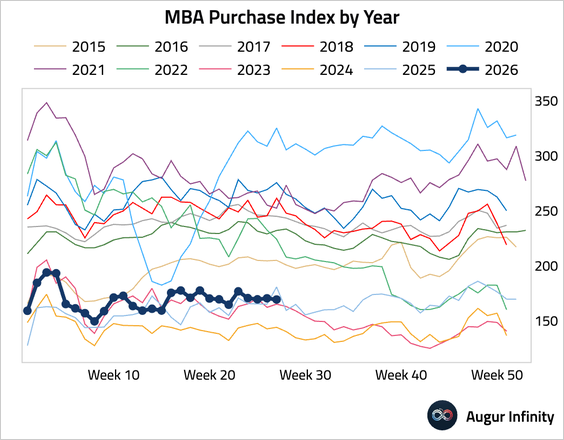
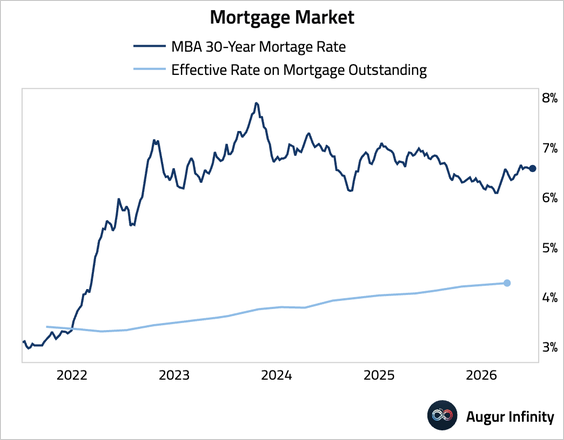
1. Mortgage applications fell as the 30-year fixed mortgage rate ticked up.
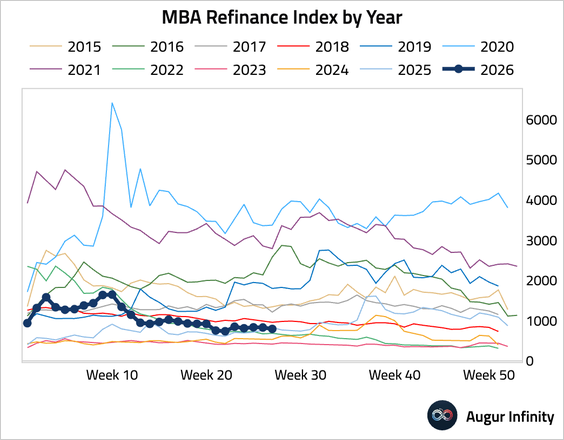
• Refinancing activity also declined.
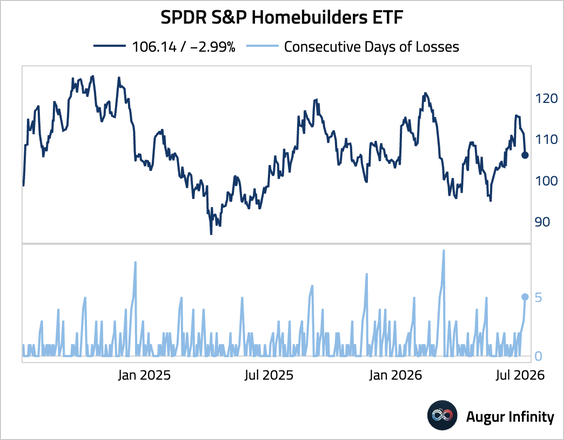
• The Homebuilders ETF fell for five consecutive days, marking the worst five-day return since April 2025.
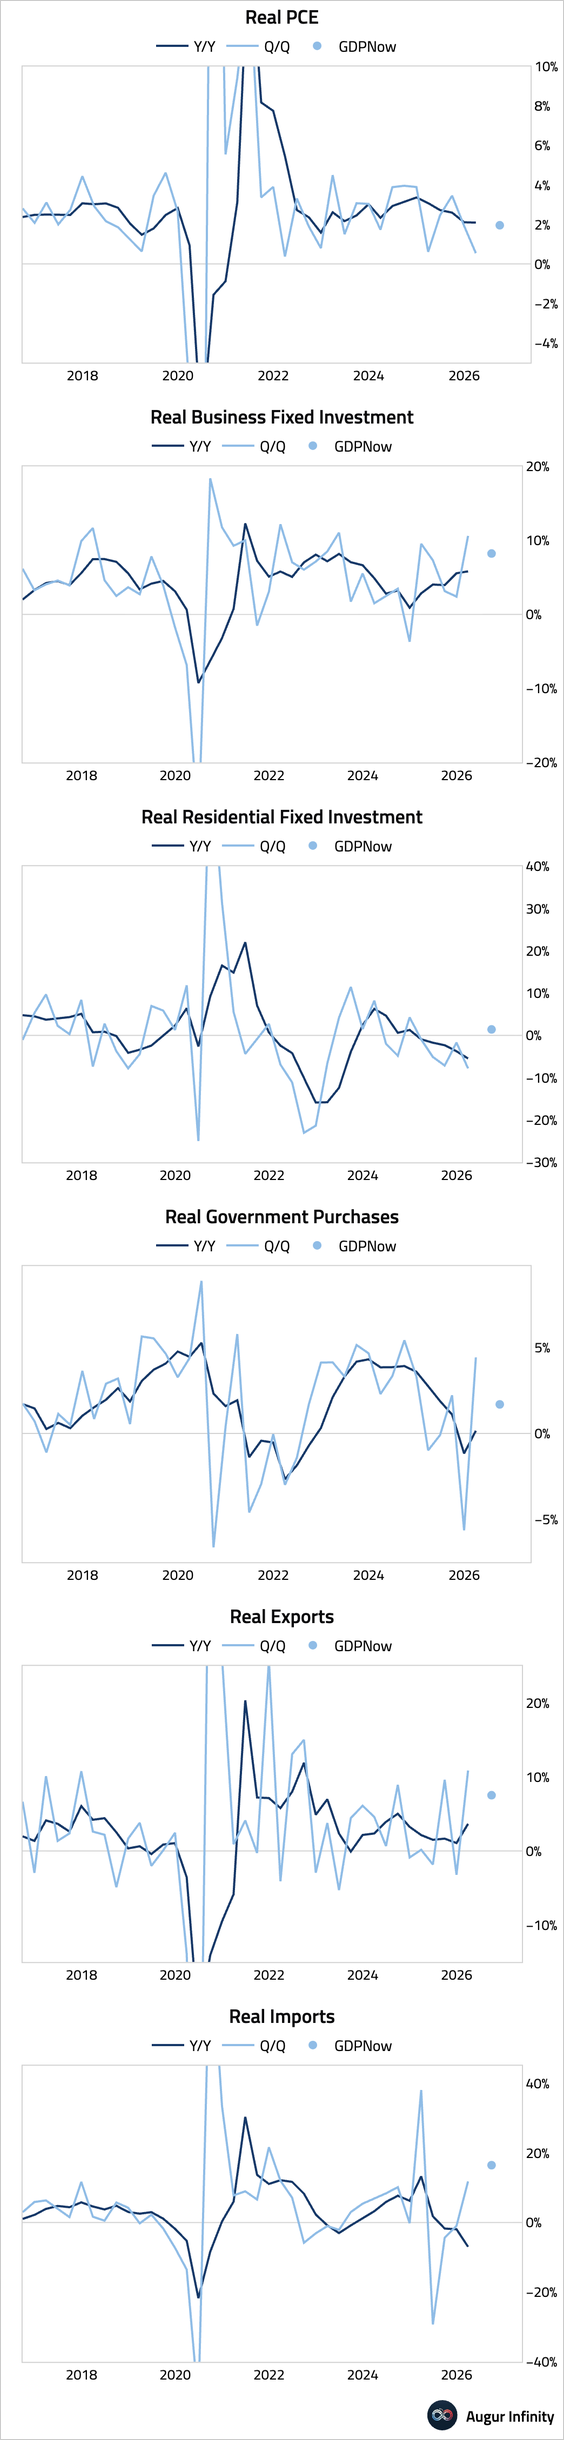
2. Here is an updated look at what the Atlanta Fed’s GDPNow model is saying about each component of GDP in Q2 2026.
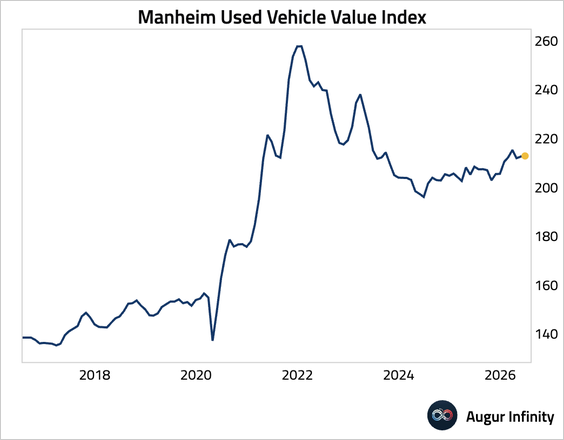
3. Used-car price inflation edged up.
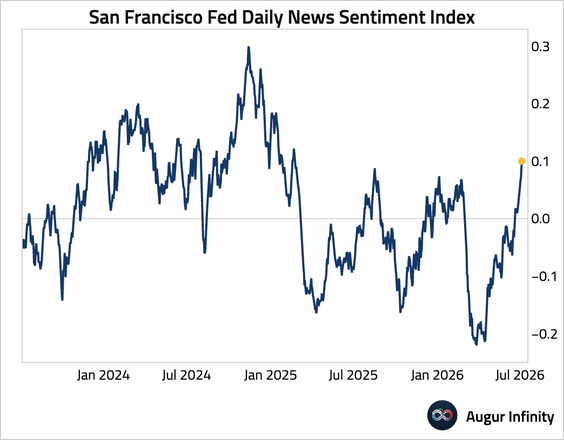
4. The Dallas Fed’s Daily News Sentiment Index, ending on July 5, has surged.
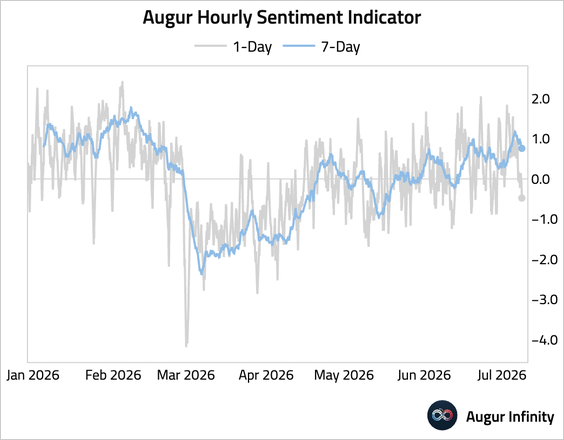
• Our high-frequency sentiment indicator has turned down as the US–Iran ceasefire unraveled.
5. Oxford Economics expects AI-related investment to remain a key driver of US growth.
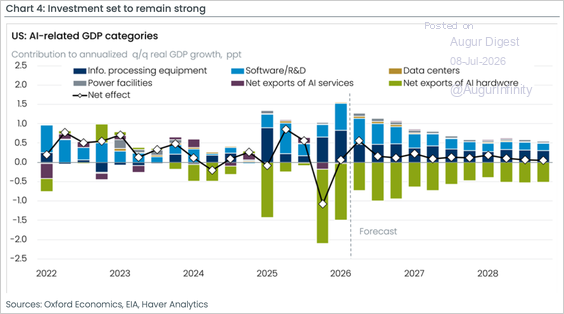
Source: Oxford Economics

Subscribe to read the rest.
Become a subscriber of Augur Digest Premium to see all 81 charts today.
Upgrade