
The United States
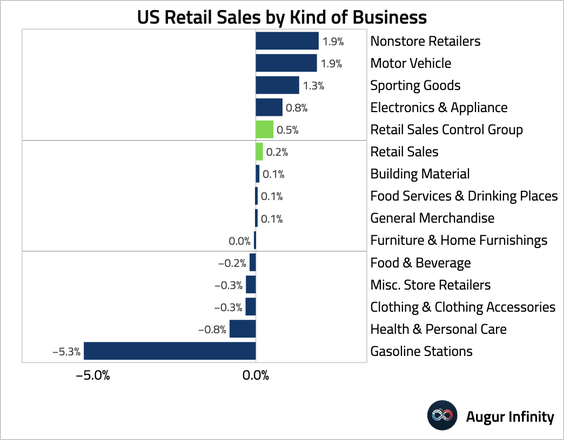
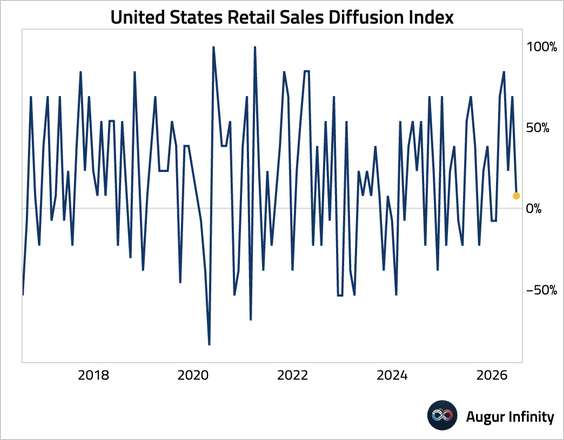
1. Headline retail sales growth slowed, driven by a steep drop in gasoline station spending from lower prices. However, the key “control group”—a direct input for GDP—posted solid gains, …

… due to strong gains in autos and nonstore retail. The jump in nonstore sales could be attributed to Amazon Prime Day, which fell in late June this year rather than the typical July.
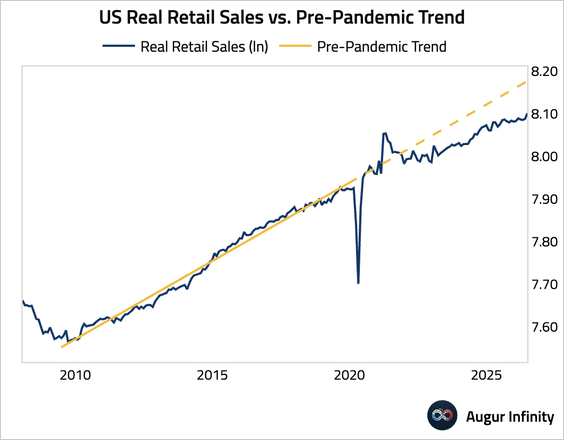
• Here are real retail sales versus the pre-pandemic trend.
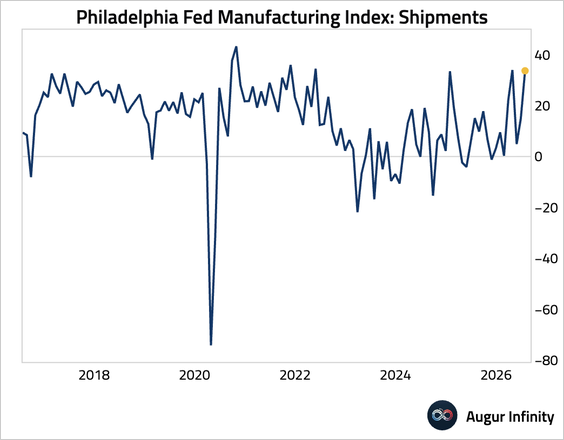
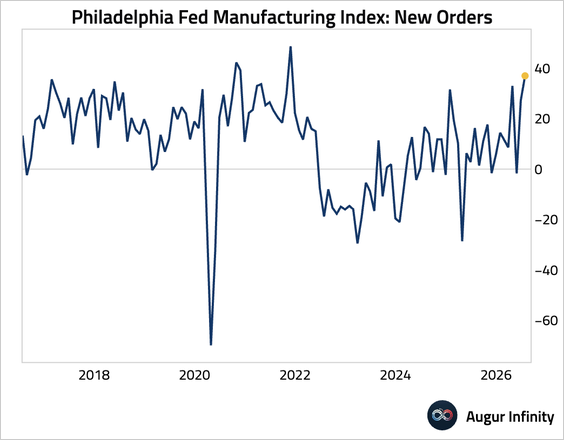
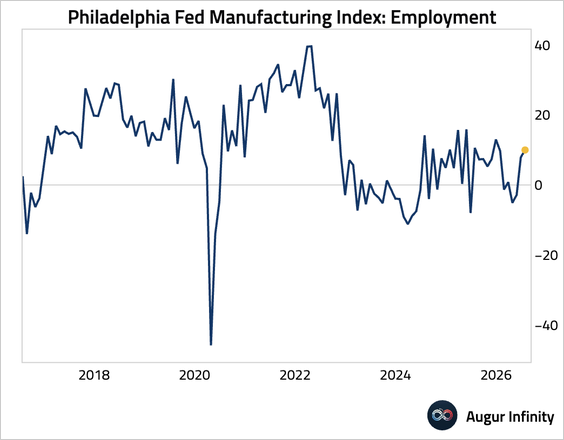
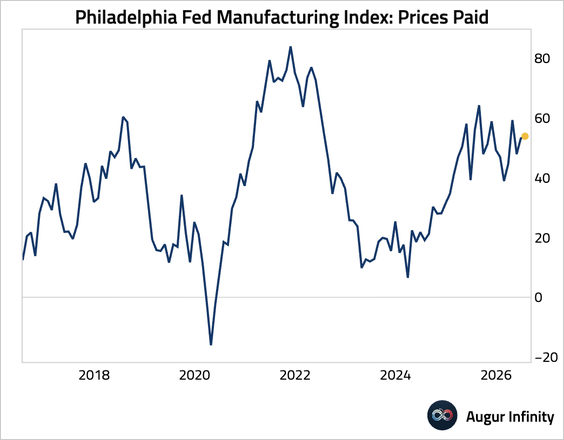
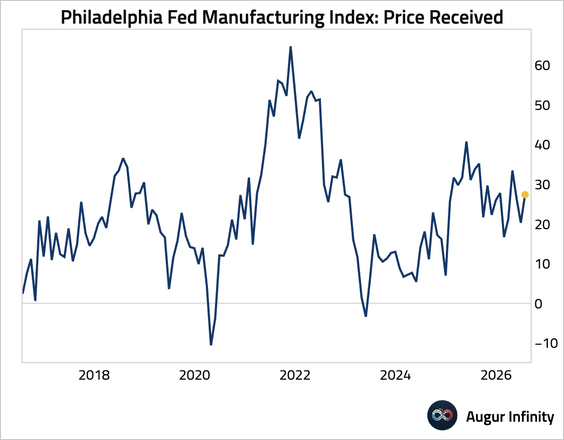
2. The Philadelphia Fed’s manufacturing index surged to its highest level since November 2021.

• Shipments increased significantly.
• New orders jumped to the highest level since late 2021.
• Employment improved.
• Price pressures also firmed.
3. The New York Fed’s services activity index jumped back into expansionary territory, reaching its highest level since May 2022, as firms grew more optimistic about the outlook.
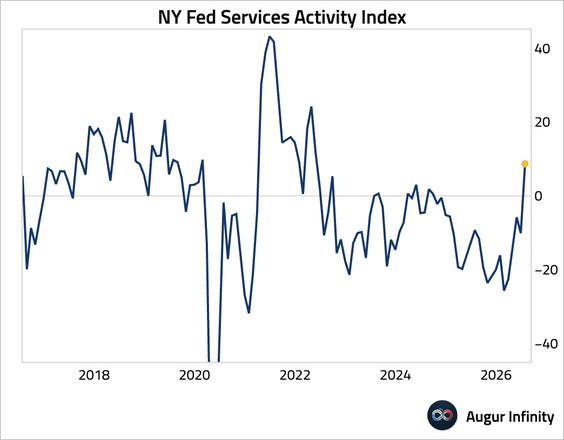
• However, the employment index moderated, …

… as did the wage index.

• Price pressures eased but remained elevated.

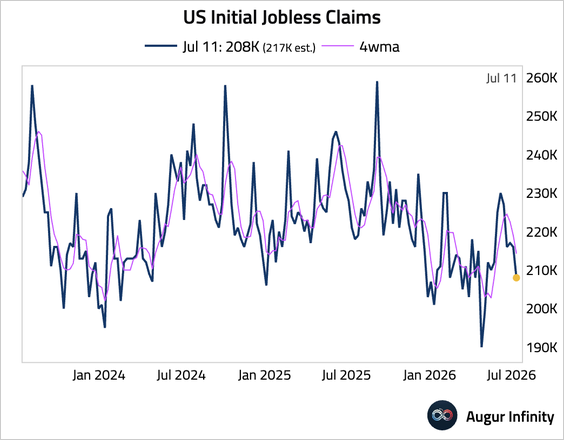
4. Initial jobless claims fell by 8,000 to 208,000, the lowest level since May and below consensus, signaling limited layoffs. The decline was amplified by smaller-than-usual summer shutdowns at auto plants, a dynamic that distorted seasonal adjustments and will likely cause noisy data in the coming weeks.

– The four-week moving average fell further.
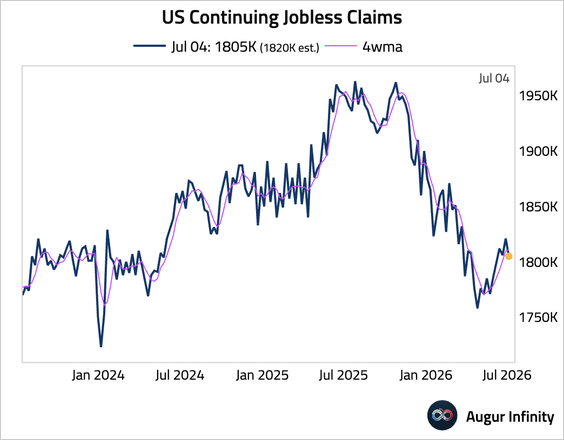
• Continuing claims also edged down and remained lower than in the same period last year.
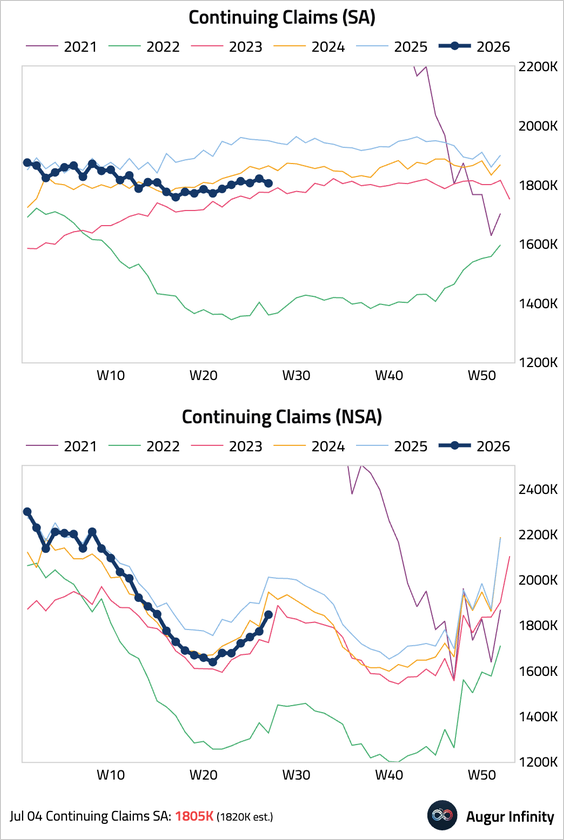
– The four-week moving average rose slightly.
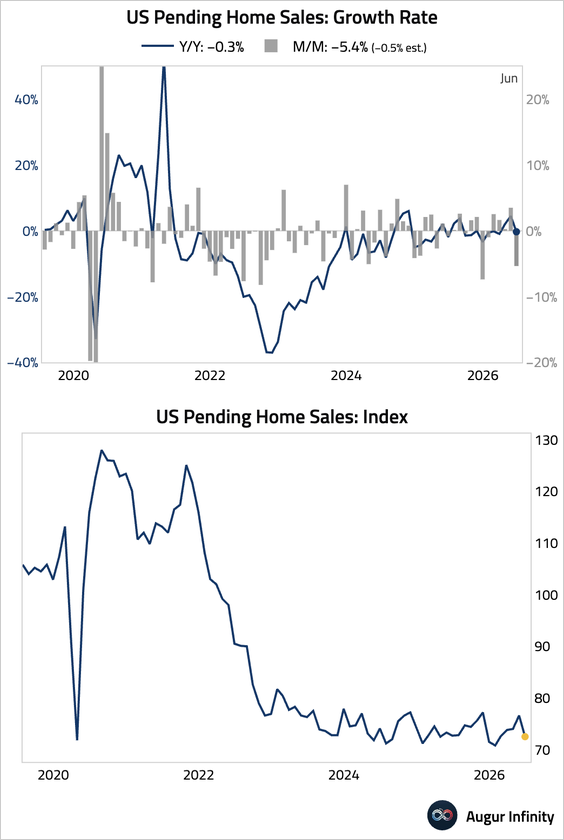
5. Housing-related data remained weak.
• Pending home sales fell sharply and missed consensus estimates by a wide margin. Activity declined across all four major regions, as elevated mortgage rates and record-high home prices continued to weigh on housing demand.
– The report does not bode well for existing home sales.
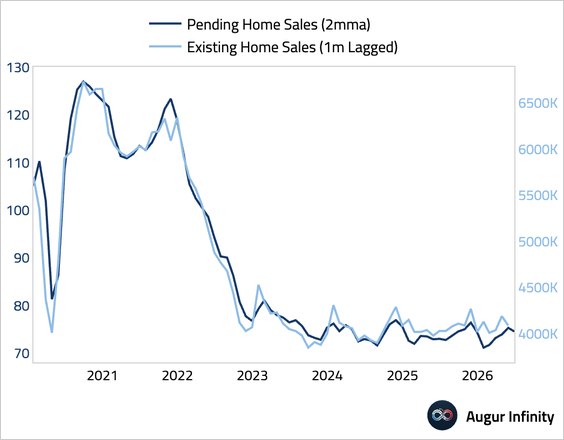
h/t @samueltombs, Pantheon Macroeconomics
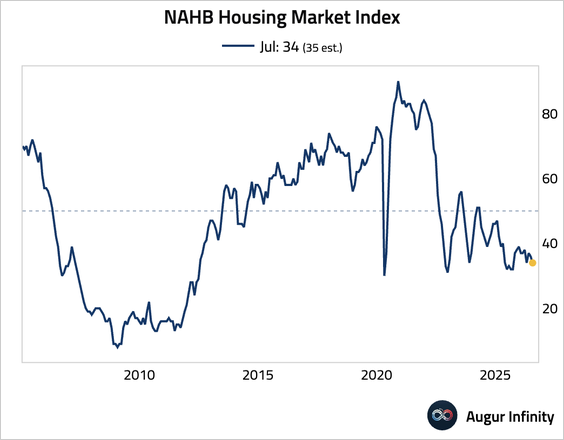
• The NAHB Housing Market Index, a measure of homebuilder confidence, declined for the second consecutive month.
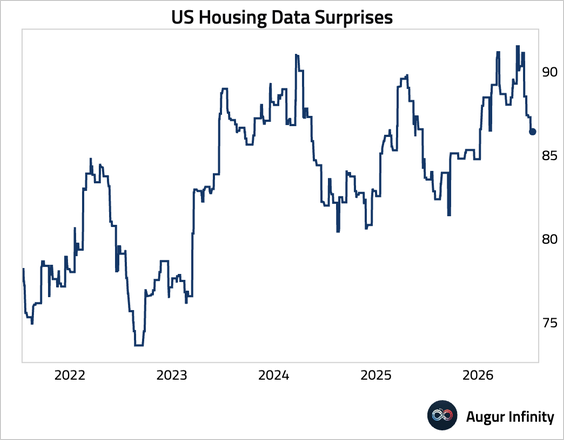
• Our housing data surprise index continues to trend lower.
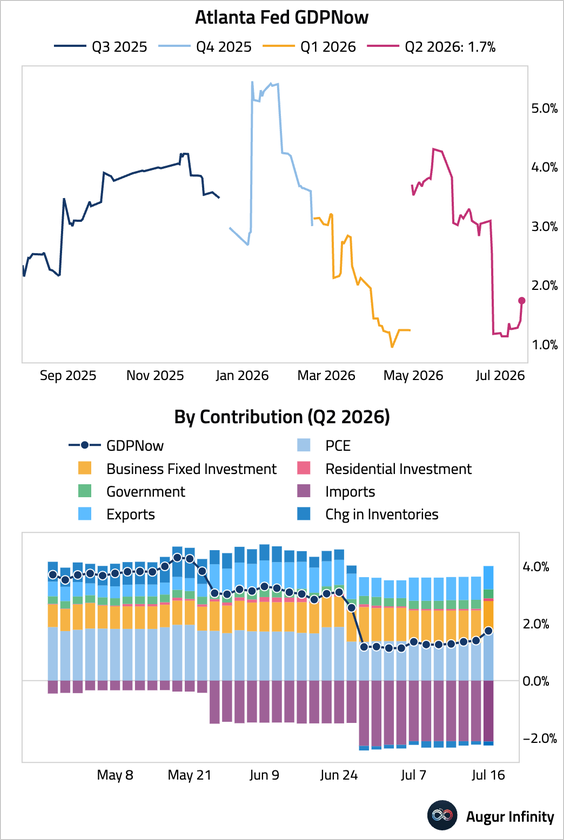
6. The Atlanta Fed’s GDPNow model is now tracking Q2 GDP at 1.7%, up from 1.3% on July 7.
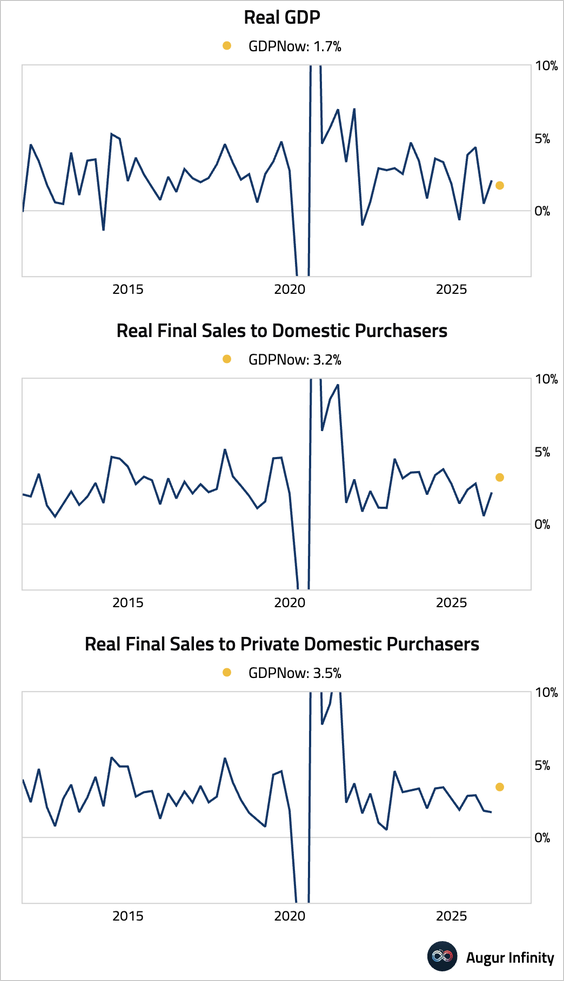
• Real final sales to domestic purchasers, which exclude volatile inventories and net trade, are even stronger at 3.2%. Excluding government spending, real final sales to private domestic purchasers are forecast at 3.5%.
7. Small-business profitability turned positive for the first time this year in June, according to Bank of America’s internal data.
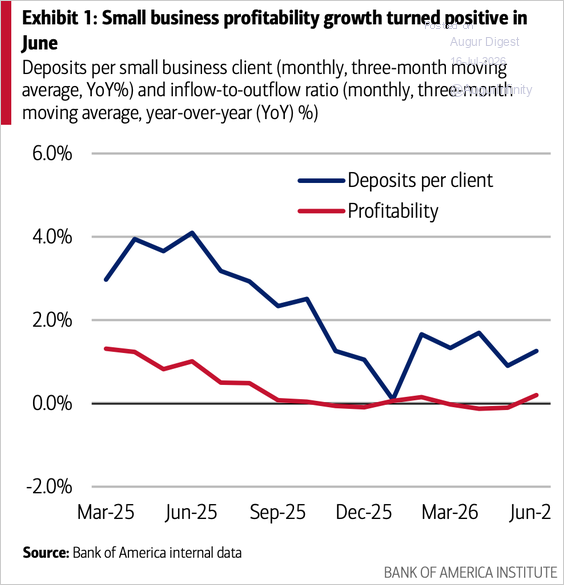
Source: Bank of America Institute Read full article
Canada
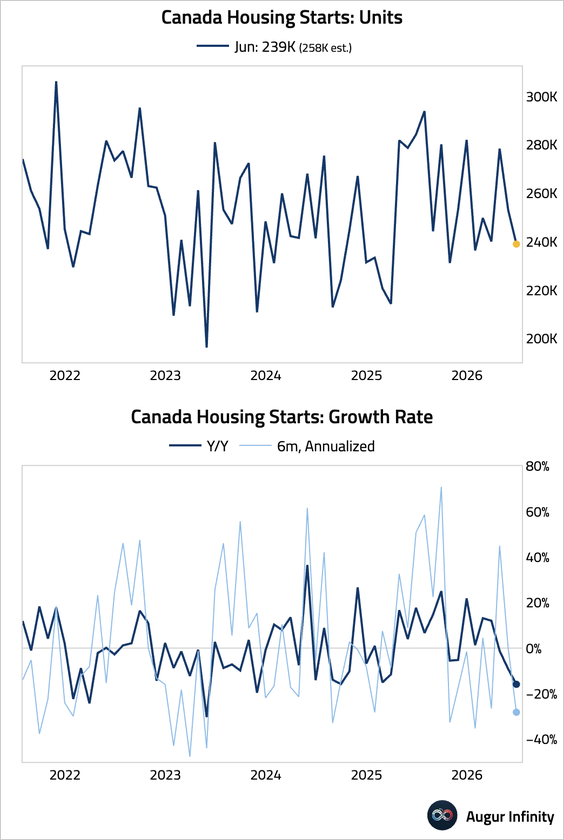
1. Housing starts slumped.
The United Kingdom
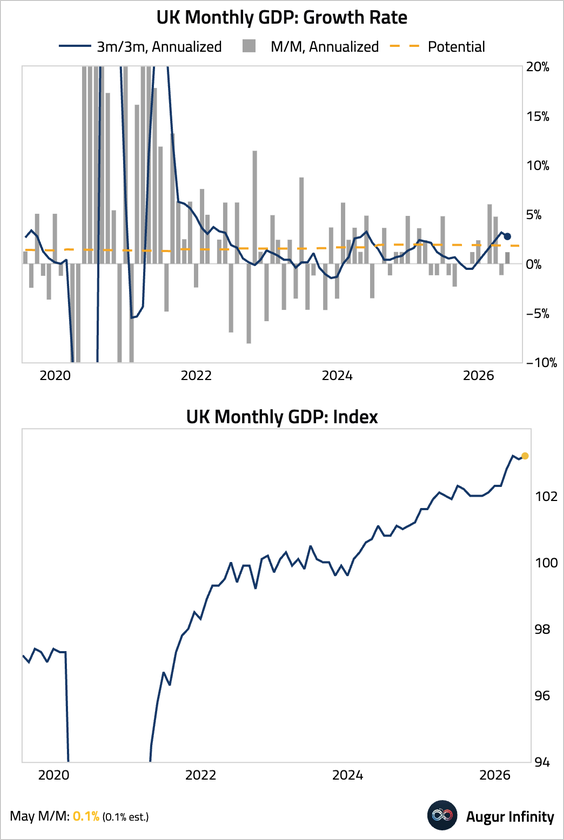
1. The UK economy rebounded in May, driven by a surge in professional services, which offset sharp declines in the construction and energy sectors. The three-month-over-three-month growth rate remains solidly above potential growth.
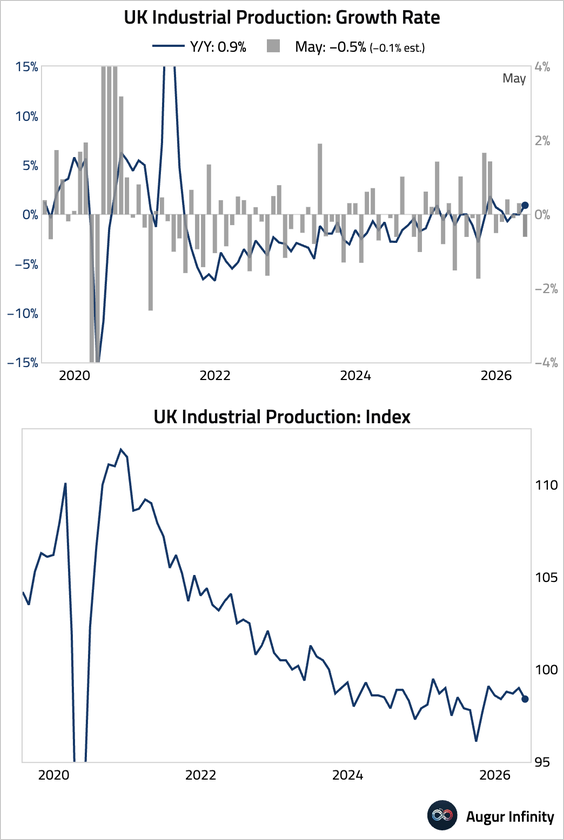
2. Industrial output fell.
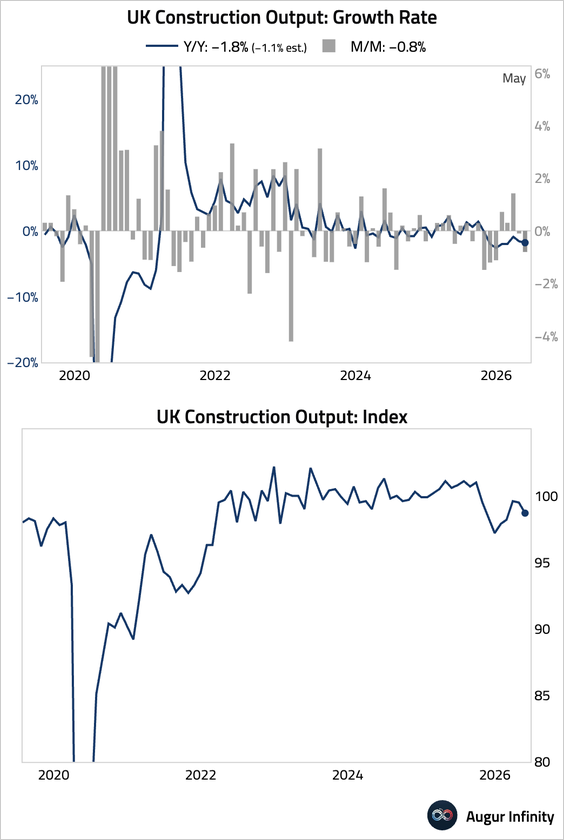
3. Construction output contracted.
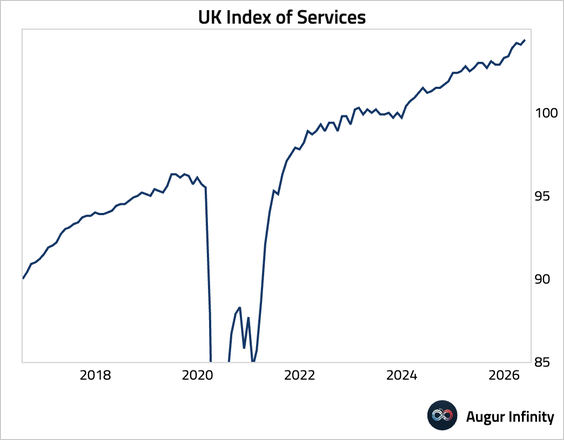
4. Services activity rose to a record high.
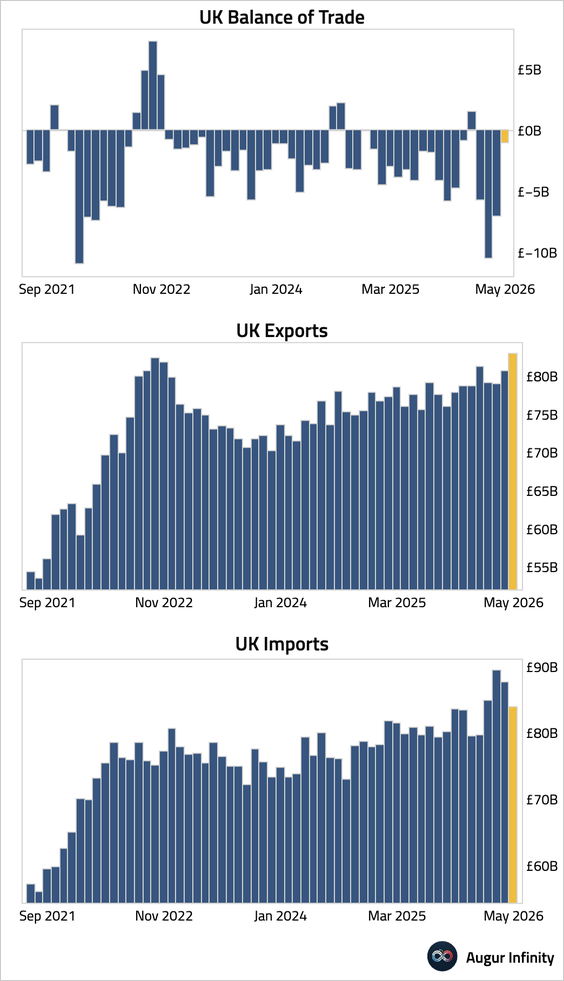
5. The trade deficit narrowed significantly, driven by rising exports and falling imports.
Euro Area
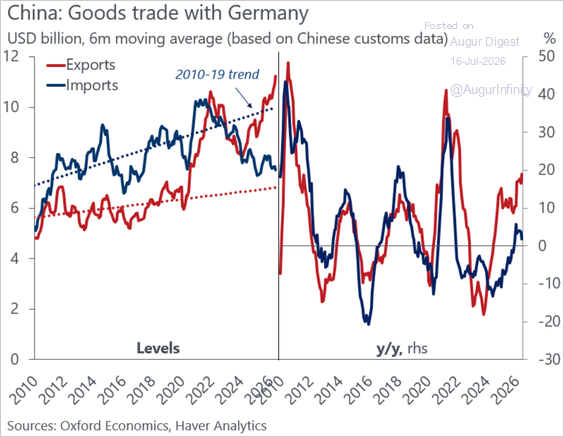
1. China’s exports to Germany surpassed the pandemic-era peak and are almost 70% above their 2010–19 trend.
Source: @DanielKral1
2. The euro area’s goods trade balance deteriorated as a sharp rise in imports, driven primarily by soaring energy costs, far outpaced a modest gain in exports.

Subscribe to read the rest.
Become a subscriber of Augur Digest Premium to see all 90 charts today.
Upgrade