
The United States
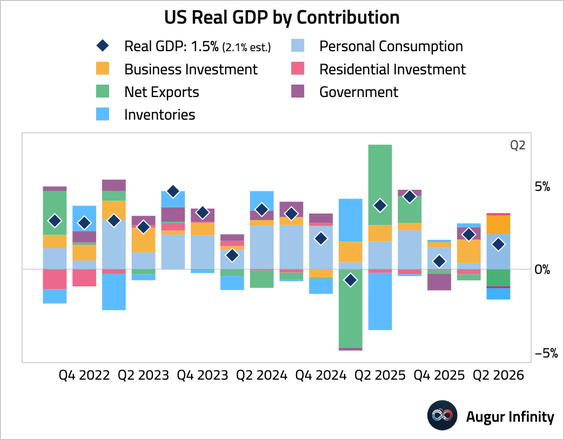
1. Q2 GDP expanded at a 1.5% annualized rate, below consensus estimates, as heavy drags from net trade and inventory destocking masked robust underlying demand.
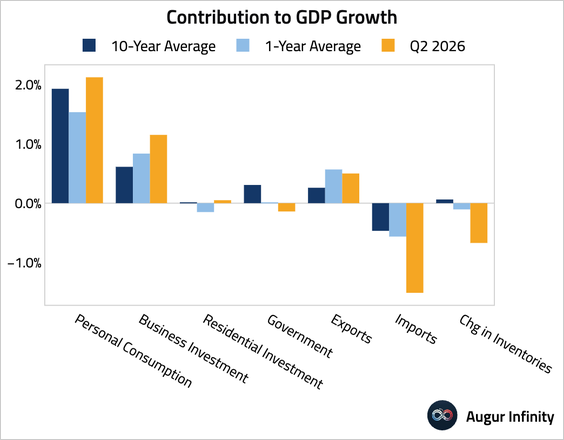
– This chart compares the contribution of each component to the trailing one- and 10-year averages.
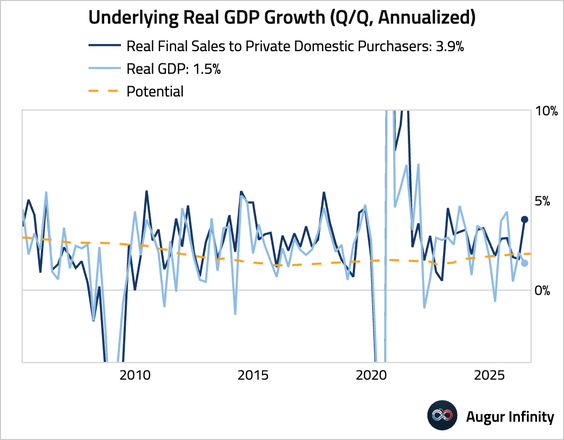
– Stripping out government spending, net trade, and inventories, real final sales to private domestic purchasers <i>surged</i>.
– Oxford Economics estimates that AI-related investment added 0.4 percentage points on net to annualized GDP growth in Q2.
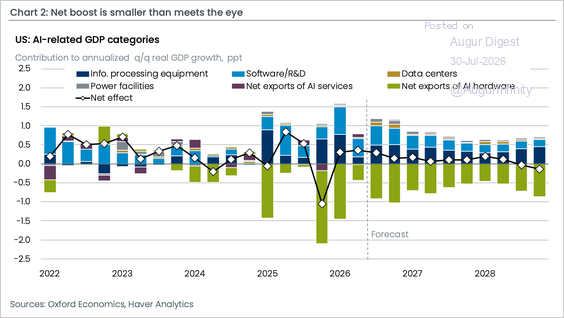
Source: Oxford Economics
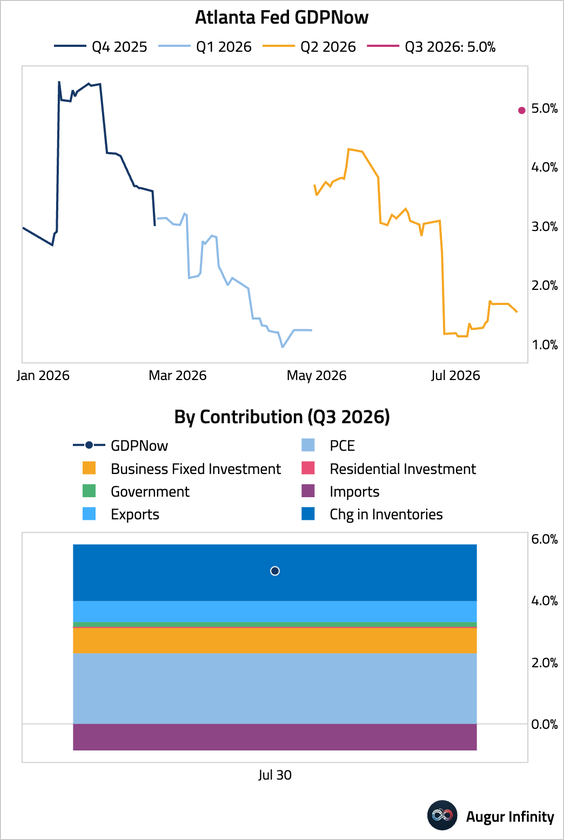
• Looking beyond Q2, the Atlanta Fed’s initial Q3 GDPNow reading is 5%.
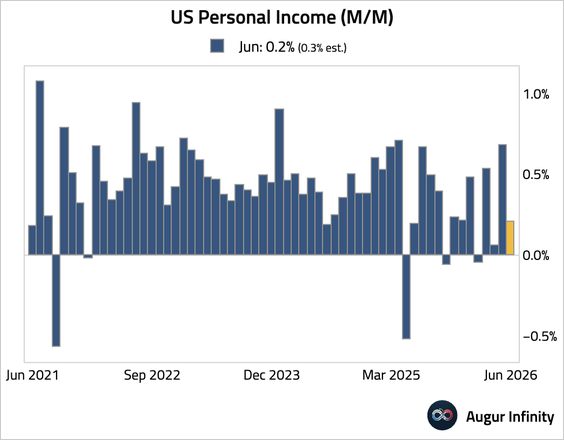
2. Personal income growth rose but fell short of consensus estimates.
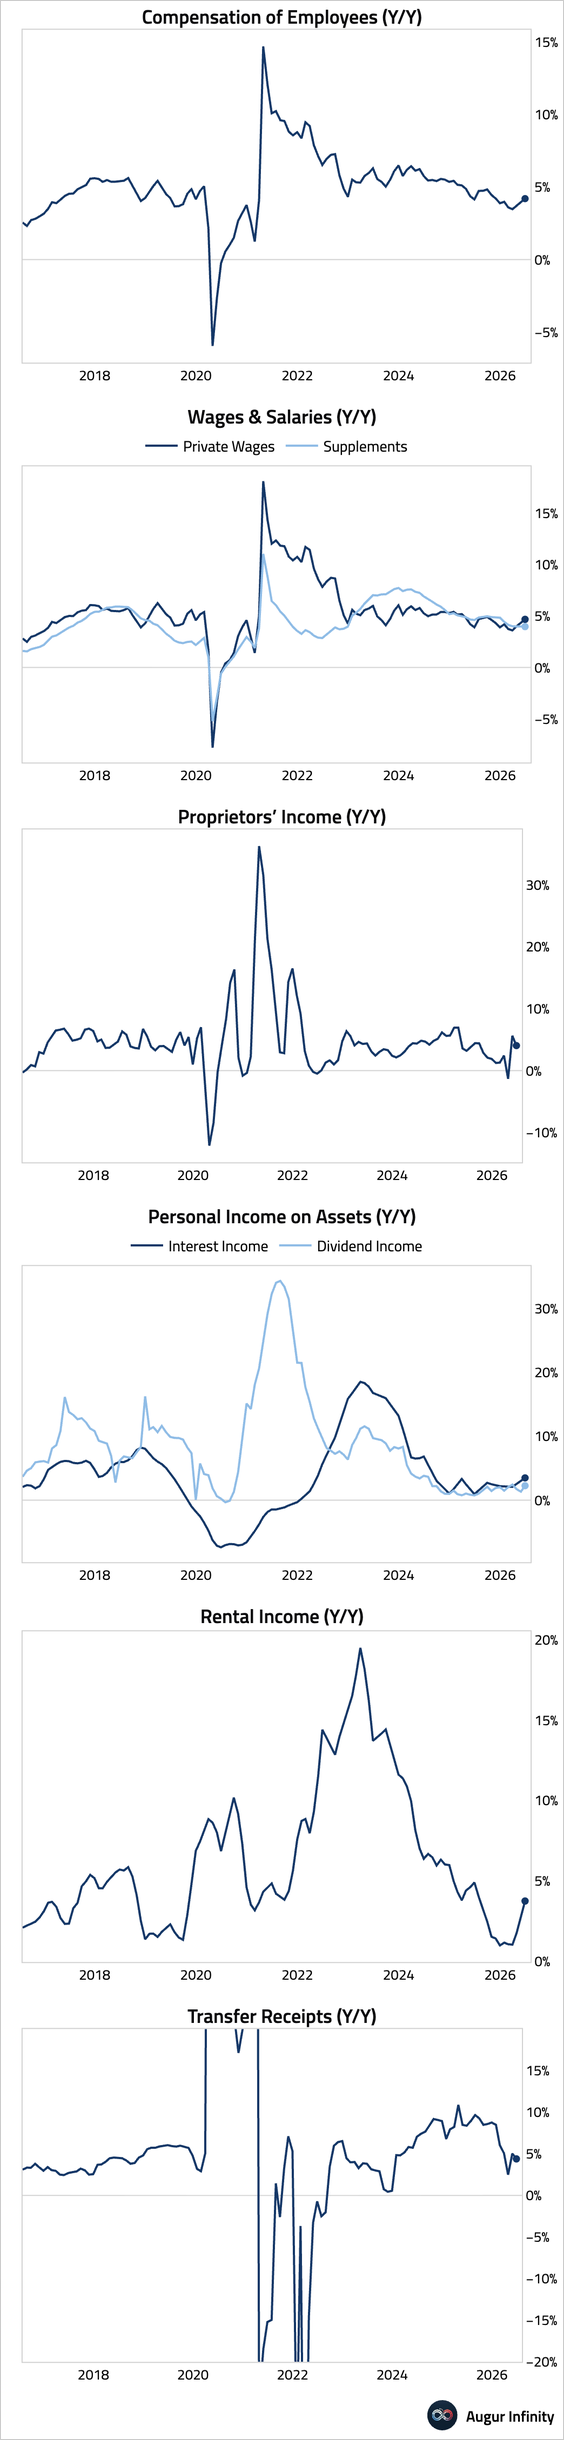
– Here are the year-over-year income growth rates by source.
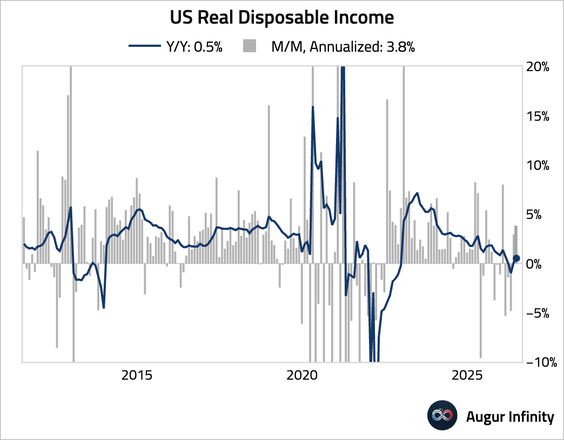
– Real disposable income growth rose.
• Personal spending grew modestly in June.
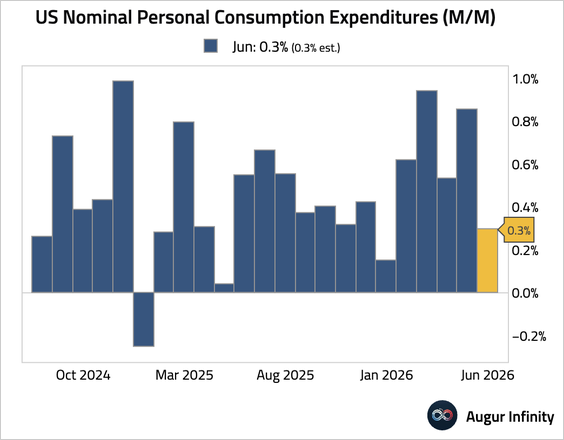
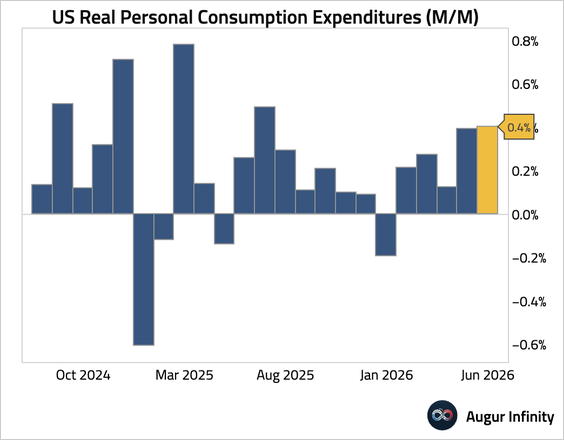
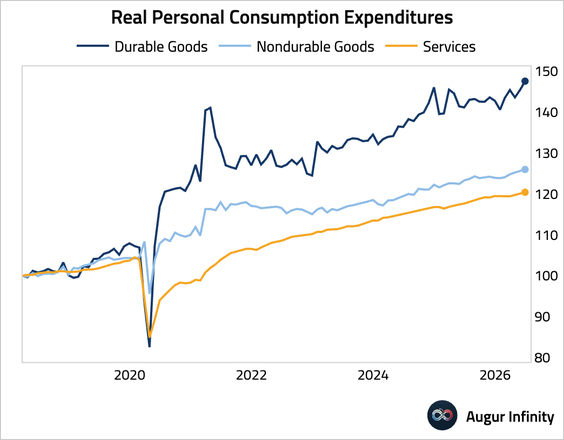
– Spending on both goods and services improved.
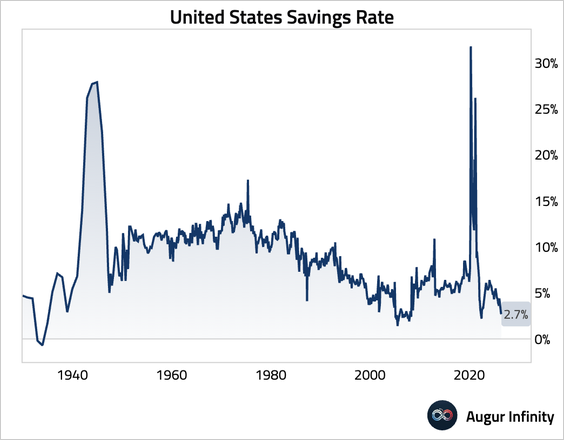
• With spending growth outpacing income growth, …
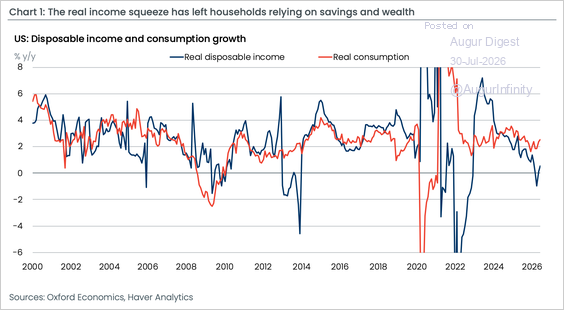
Source: Oxford Economics
… households continue to rely on savings and wealth.

Subscribe to read the rest.
Become a subscriber of Augur Digest Premium to see all 109 charts today.
Upgrade