
The United States
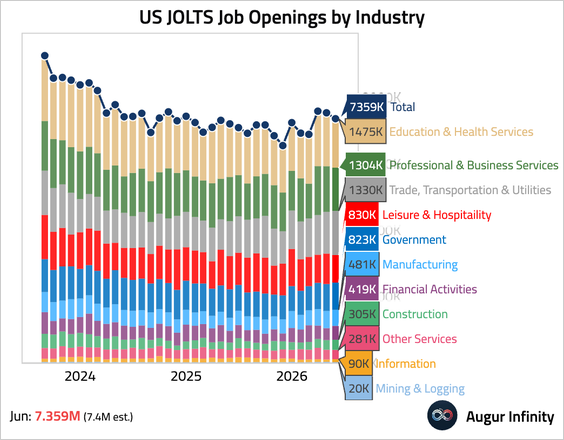
1. The June JOLTS report showed that job openings edged down.
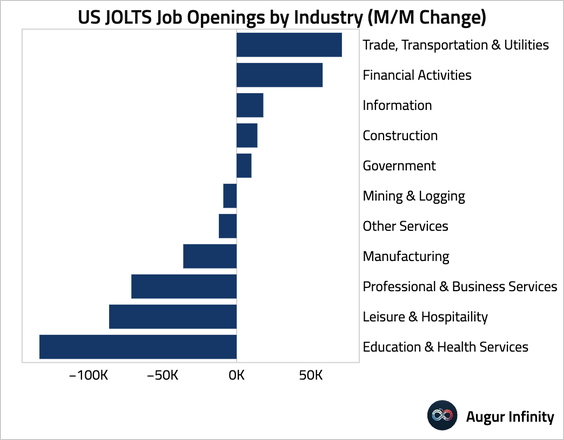
– This chart shows the June changes in job openings by industry.
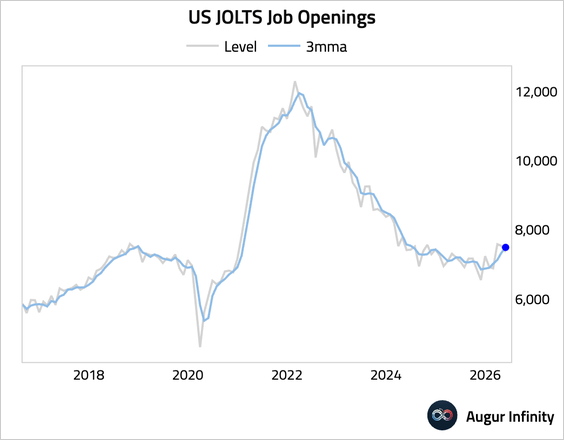
• Looking through the month-over-month noise, the three-month moving average rose further.
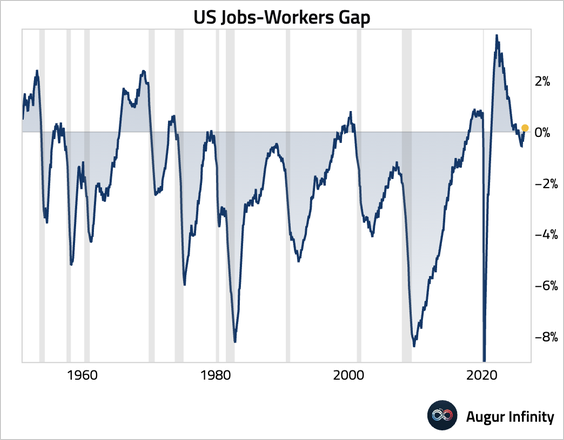
• The jobs-workers gap, which measures the difference between labor supply and labor demand, has rebounded and remained near equilibrium.
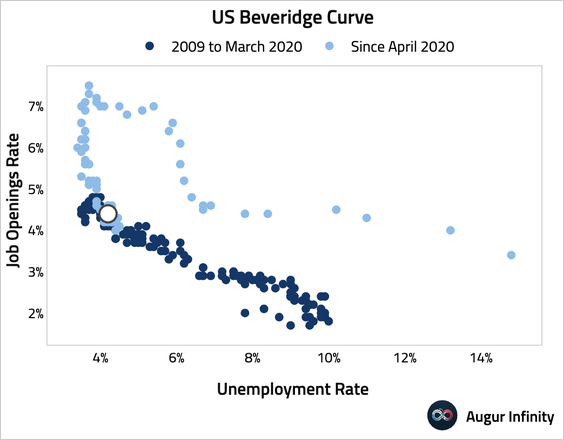
• We’ve reached the “kink” in the Beveridge curve. A further decline in the job openings rate is likely to lead to a rising unemployment rate.
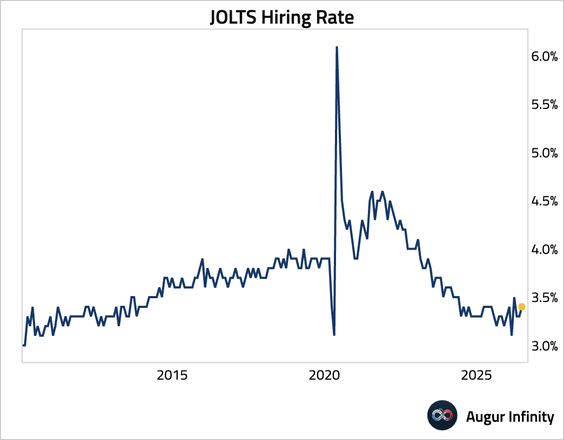
• The hiring rate rose.
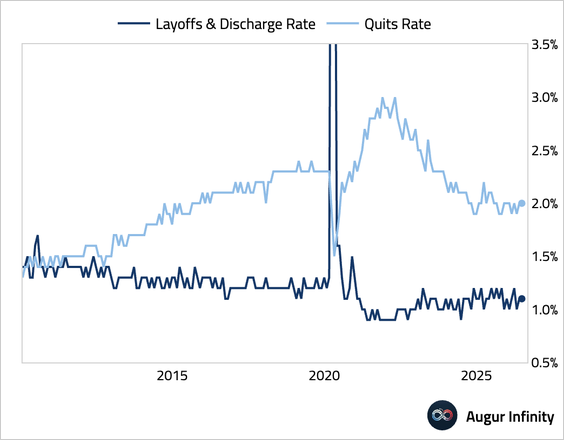
– Layoffs and quits both held steady.
• The credibility of the JOLTS report, however, is under scrutiny due to a plummeting survey response rate.
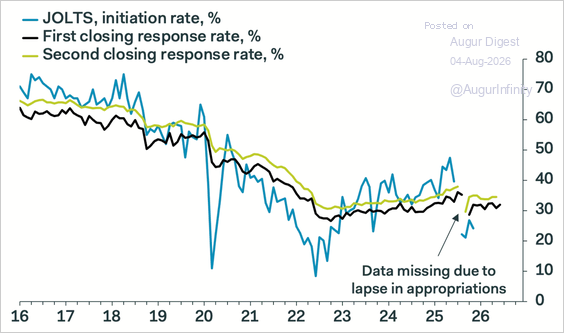
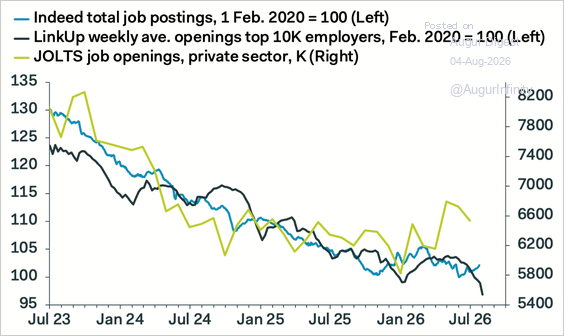
– Alternative high-frequency data from private sector sources have declined this year, painting a picture of weaker labor market demand than the official data suggest.
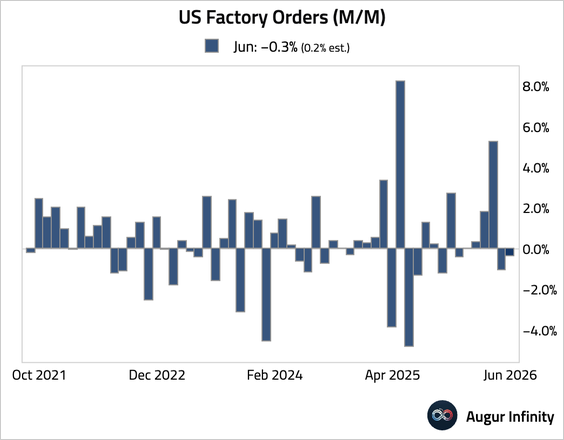
2. Factory orders unexpectedly fell in June.
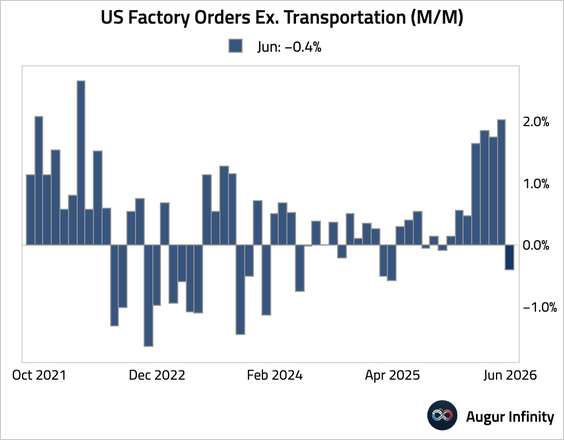
• Excluding the volatile transportation sector, orders fell as well.
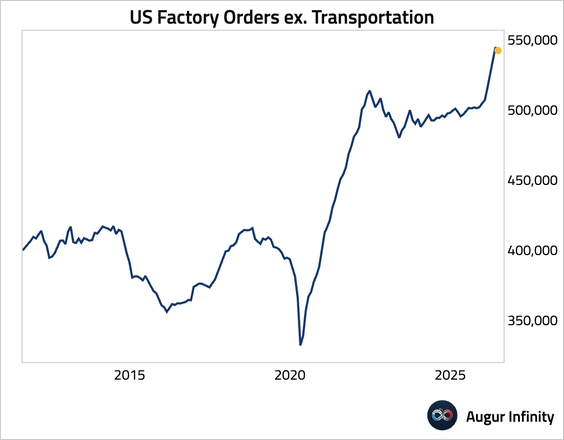
– In level terms, factory orders excluding transportation remained strong.
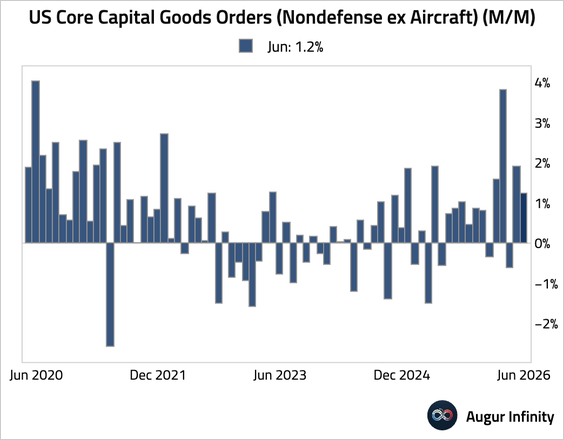
• Growth in core capital goods orders was revised upward from 0.9% to 1.2%.
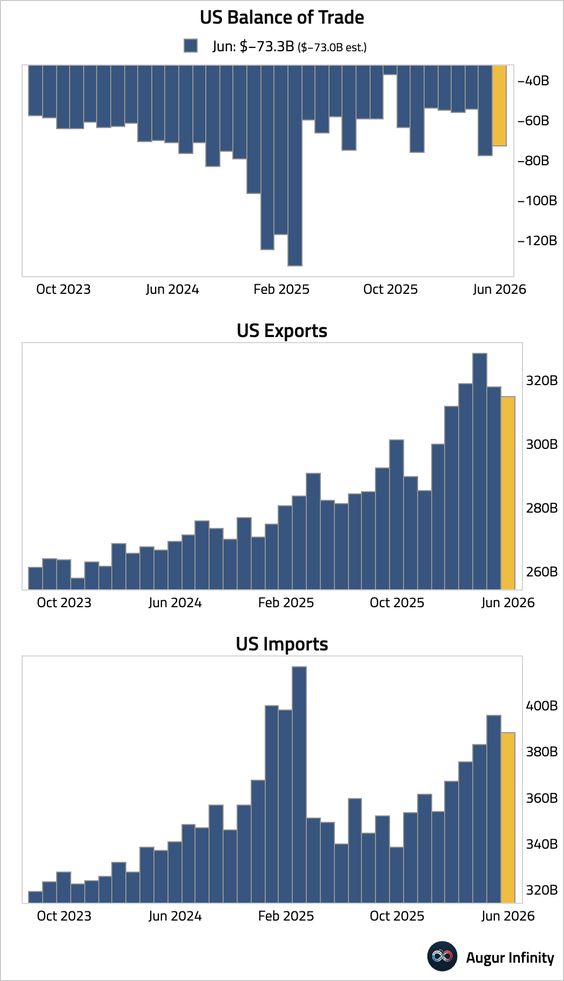
3. The trade deficit narrowed in June, driven by a larger decline in goods imports (led by computers and pharmaceutical products) relative to exports (led by energy).
• Excluding gold and the recent increase in oil exports, the trade deficit would be materially wider.
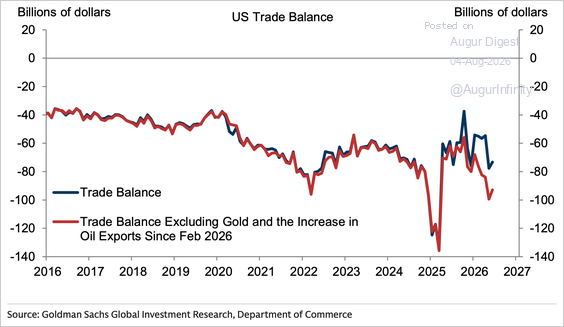
Source: Goldman Sachs
4. The Atlanta Fed’s GDPNow model is now tracking Q3 GDP at 5.9%, down from 6.2% on Monday.

Subscribe to read the rest.
Become a subscriber of Augur Digest Premium to see all 83 charts today.
Upgrade