
The United States
1. The ISM Services PMI edged up but was slightly below consensus.
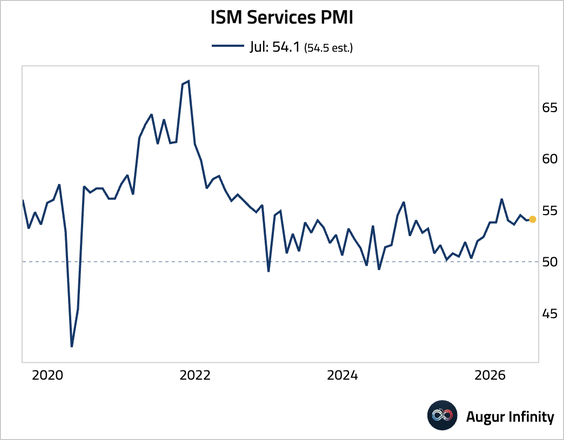
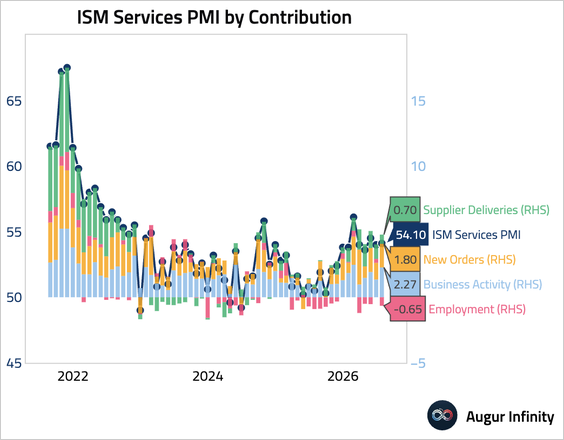
• The strength was broad-based, with most subindices in expansion.
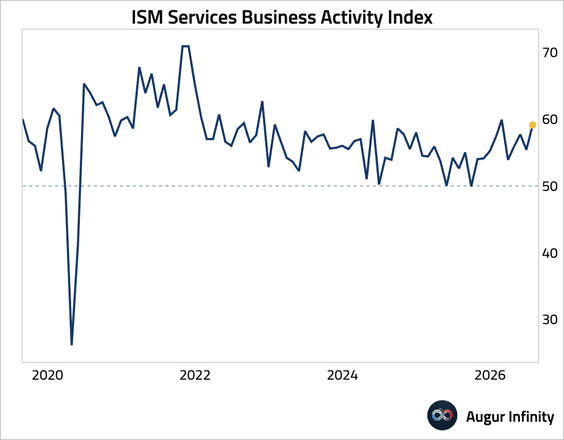
• The business activity index expanded.
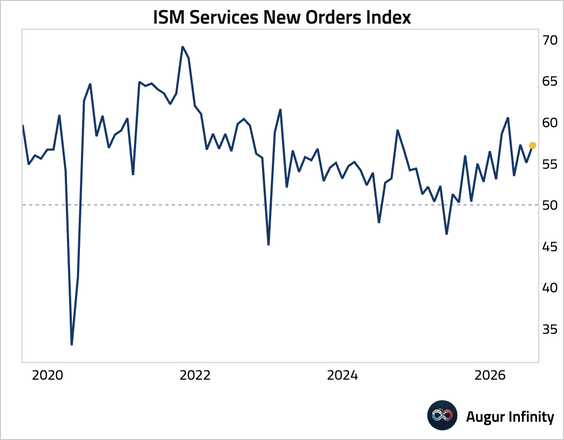
• The new orders component accelerated, signaling a robust demand pipeline.
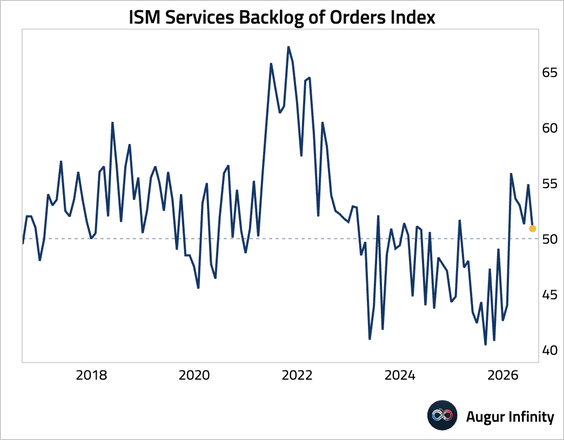
• The Backlog of Orders Index reversed sharply lower.
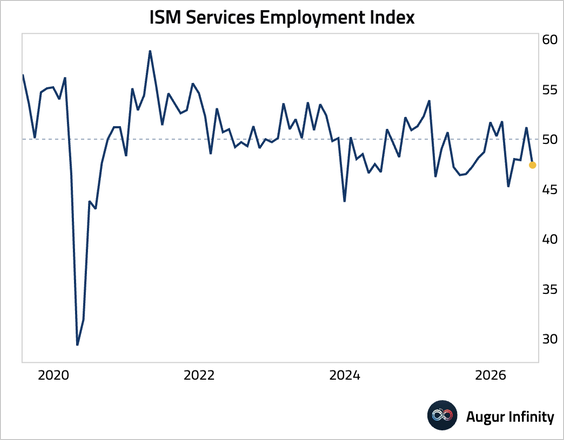
• The employment index was an outlier, falling back into contraction.
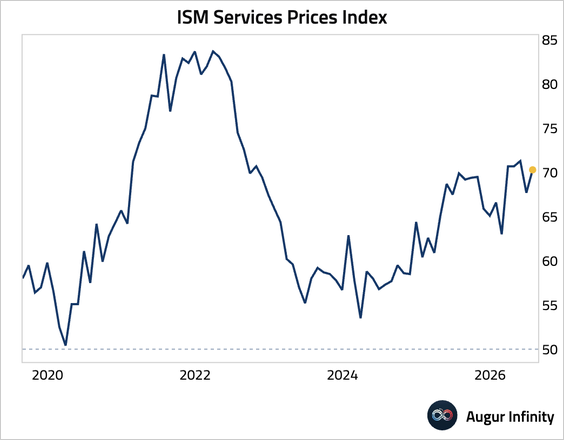
• Price pressures reaccelerated.
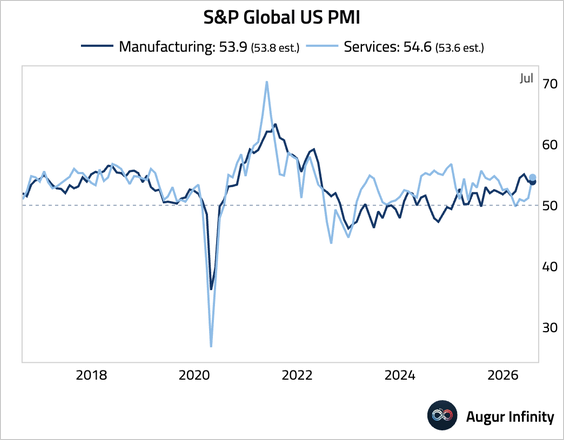
2. The final S&P Global Services PMI was revised up, marking a nine-month high. Output growth was bolstered by temporary sports and holiday events, though input costs and output prices accelerated to multi-month highs.
Source: S&P Global PMI
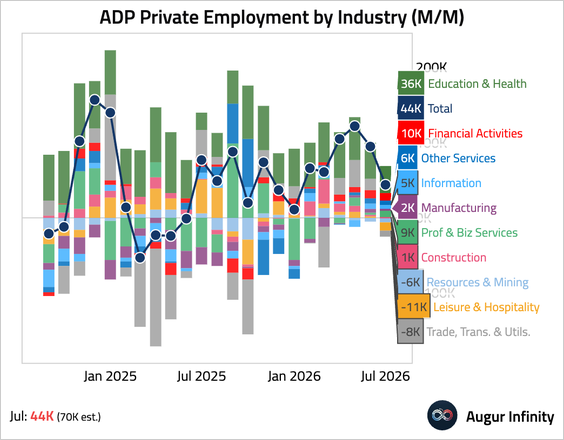
3. ADP private payrolls slowed sharply across establishment sizes, …
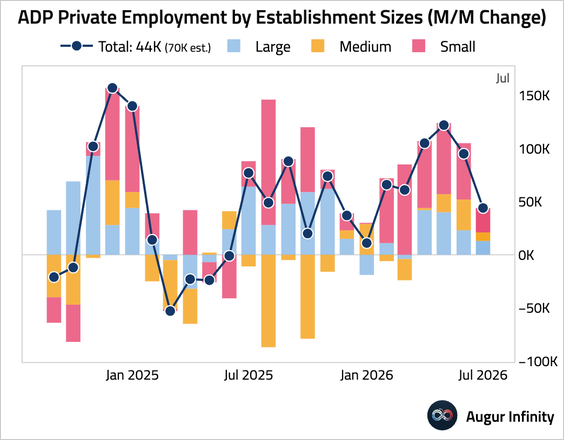
… driven by job losses in the leisure and hospitality sector.
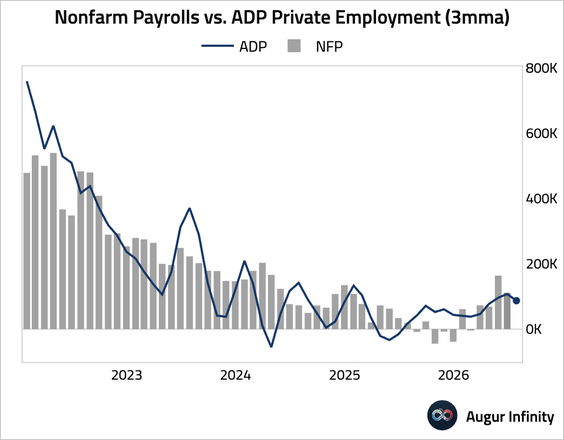
• Even smoothed on a rolling three-month basis, the ADP reports have turned down.
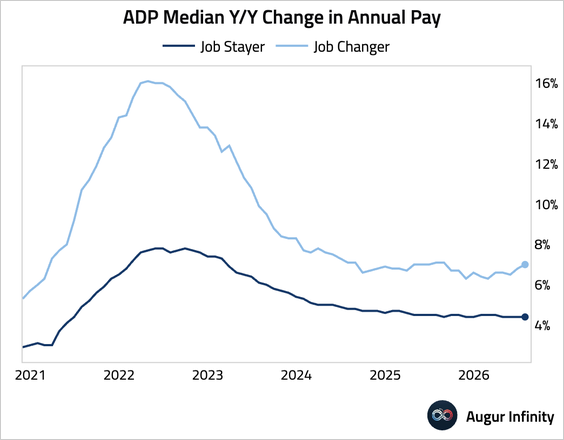
• Wage growth held steady for job stayers but picked up for job changers.
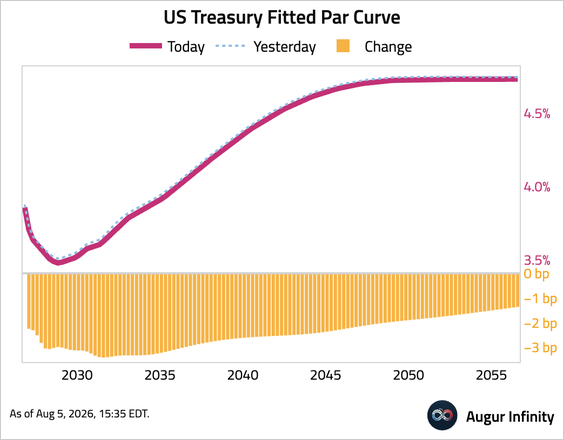
• The soft print sent bond yields lower across the curve.
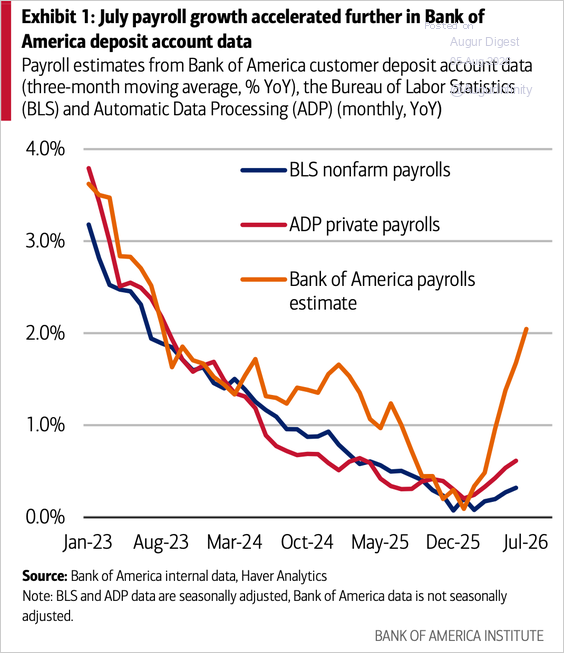
4. In contrast, Bank of America’s payroll estimate accelerated in July.
Source: Bank of America Institute Read full article
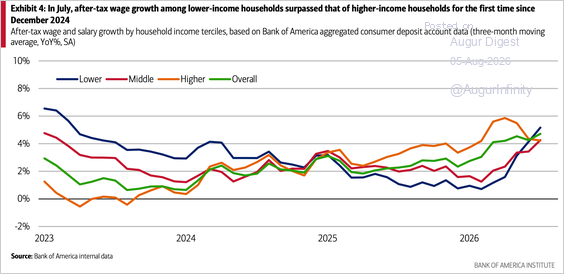
• Lower-income households’ after-tax wage growth accelerated to 5.2% year over year in July, surpassing higher-income households for the first time since December 2024 and signaling improving wage momentum at the lower end of the income distribution.
Source: Bank of America Institute Read full article
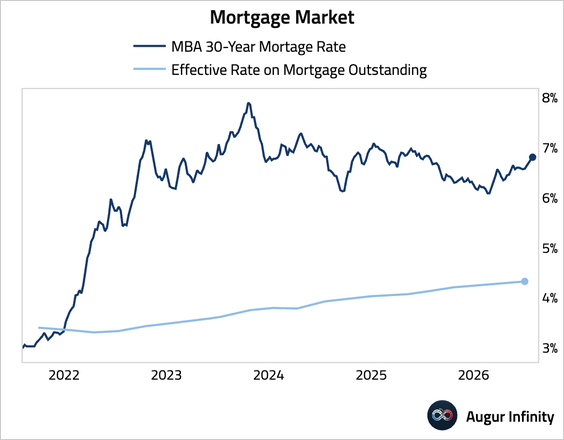
5. Mortgage applications fell as the 30-year fixed mortgage rate ticked up.
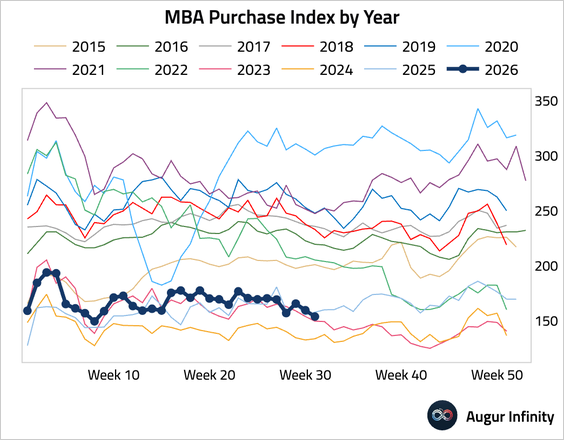
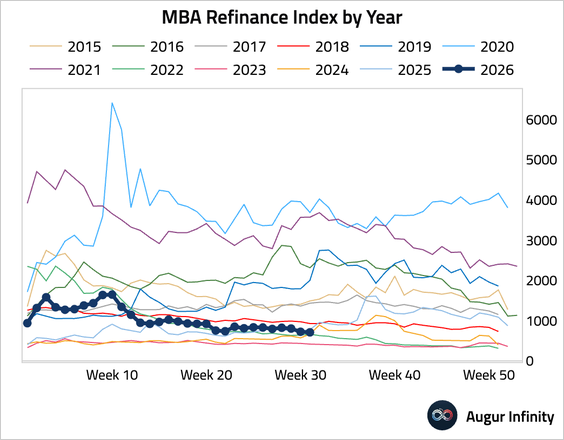
– Refinancing activity also eased.
6. Gen Z, defined as those born after 1995, has the lowest median savings-to-spending ratio relative to other generations.

Subscribe to read the rest.
Become a subscriber of Augur Digest Premium to see all 91 charts today.
Upgrade