Headlines
- The White House formally notified Mexico and the European Union of its intent to raise tariffs to 30 percent, effective August 1, if new trade agreements are not reached. Both Mexico and the EU stated they will continue negotiations.
- The United States announced it will impose secondary tariffs of up to 100 percent on Russia, beginning September 1, should Russia not agree to a ceasefire or an end to the war with Ukraine.
- The House of Representatives is expected to vote this week on stablecoin legislation that has already passed in the Senate.
Global Economics
Canada
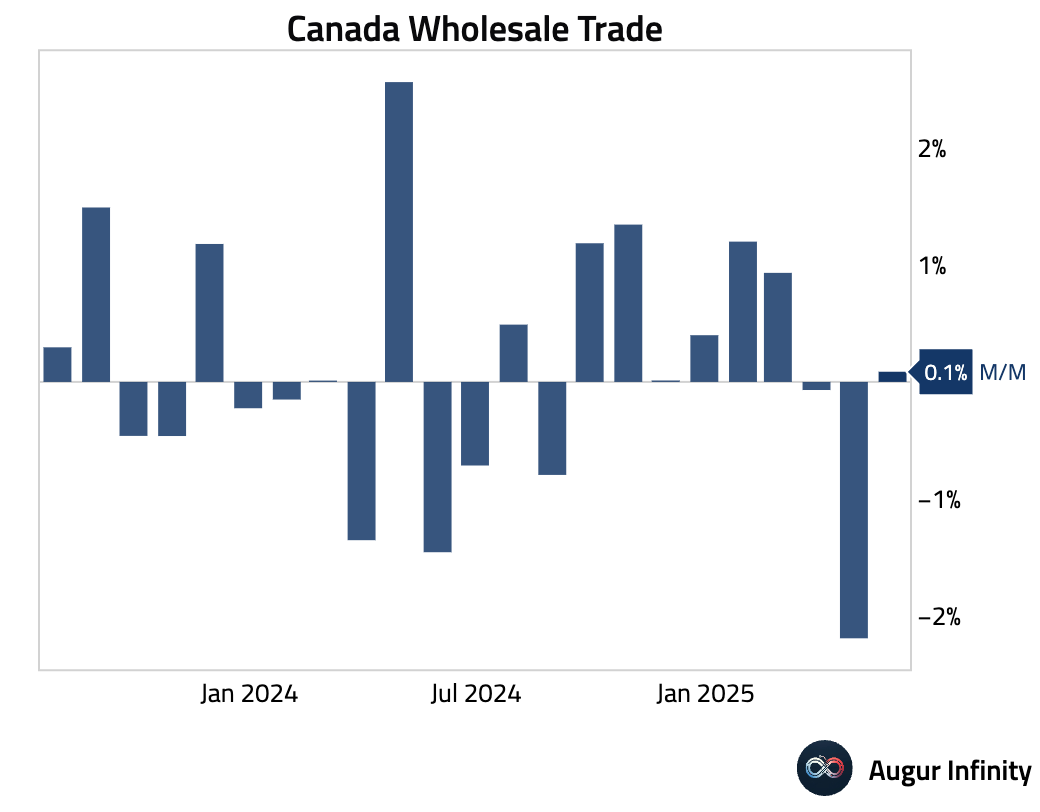
- In Canada, final May Wholesale Sales rose 0.1% M/M, rebounding from the prior −2.3% drop and significantly beating the −0.4% consensus estimate.
Europe
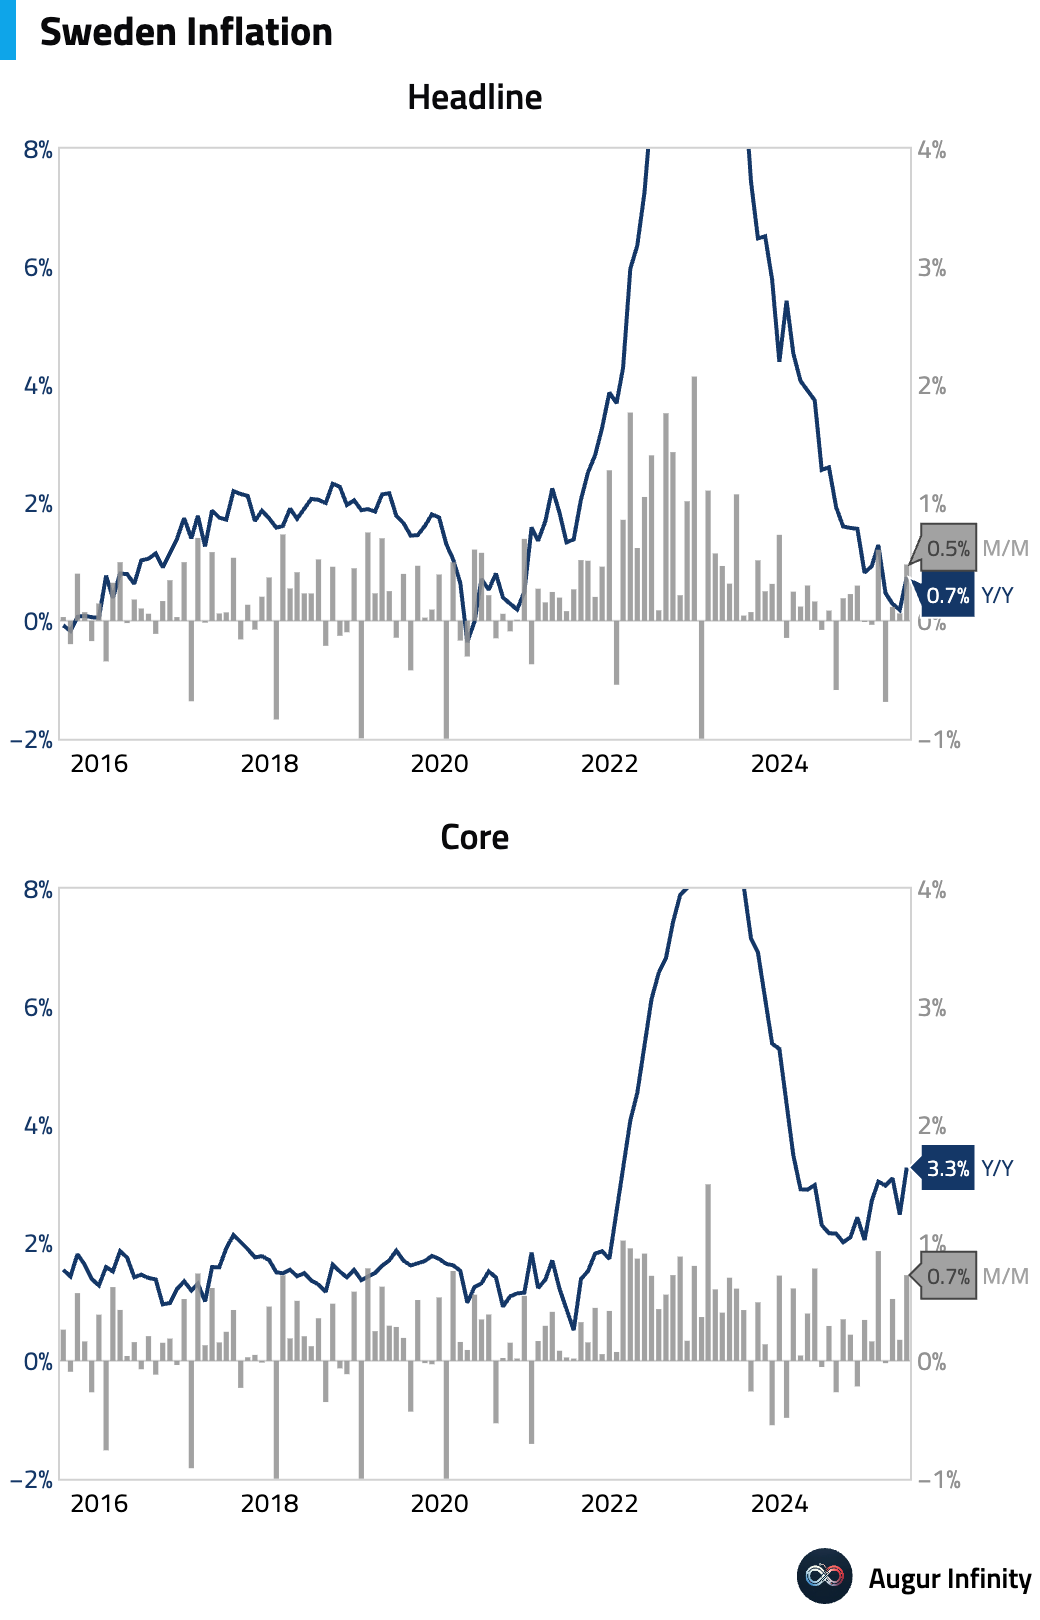
- Sweden’s June inflation data showed headline CPI rose 0.5% M/M, beating the 0.2% consensus, which pushed the Y/Y rate to 0.7%. The Riksbank’s preferred measure, CPIF, increased to 2.8% Y/Y from 2.3% previously, with the M/M figure coming in at 0.5%.
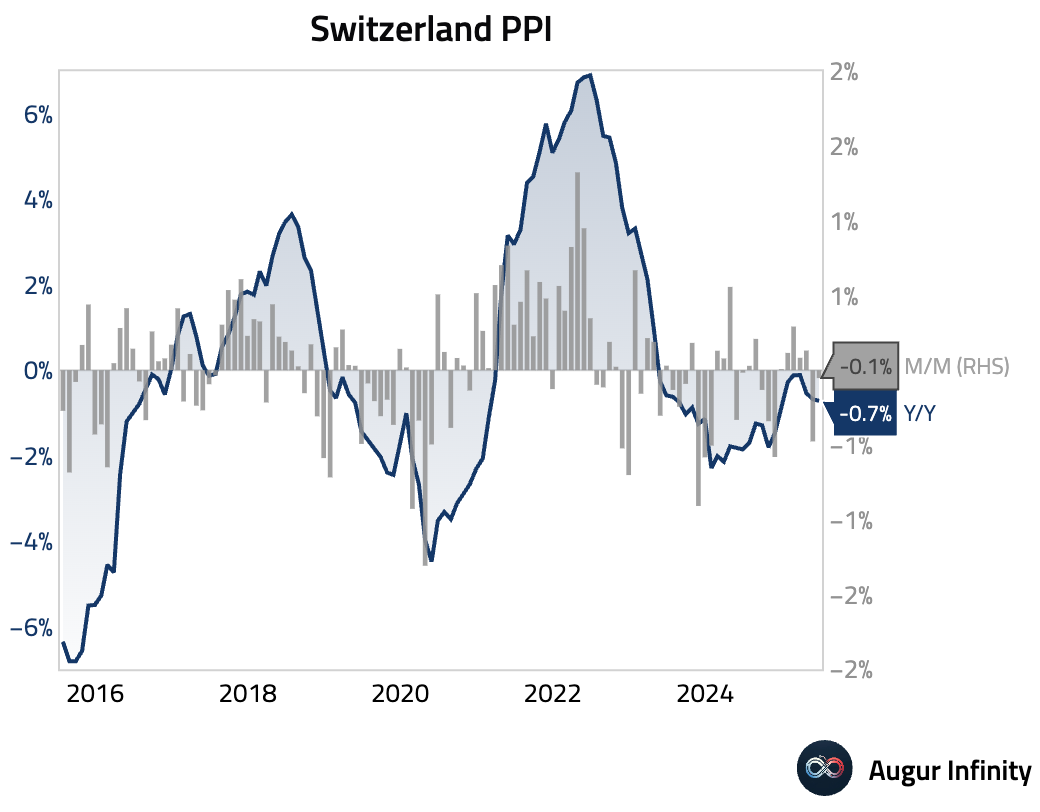
- Switzerland’s Producer & Import Prices fell 0.1% M/M in June, a smaller decline than the previous month's −0.5% but below the 0.2% consensus. The Y/Y figure held steady at −0.7%.
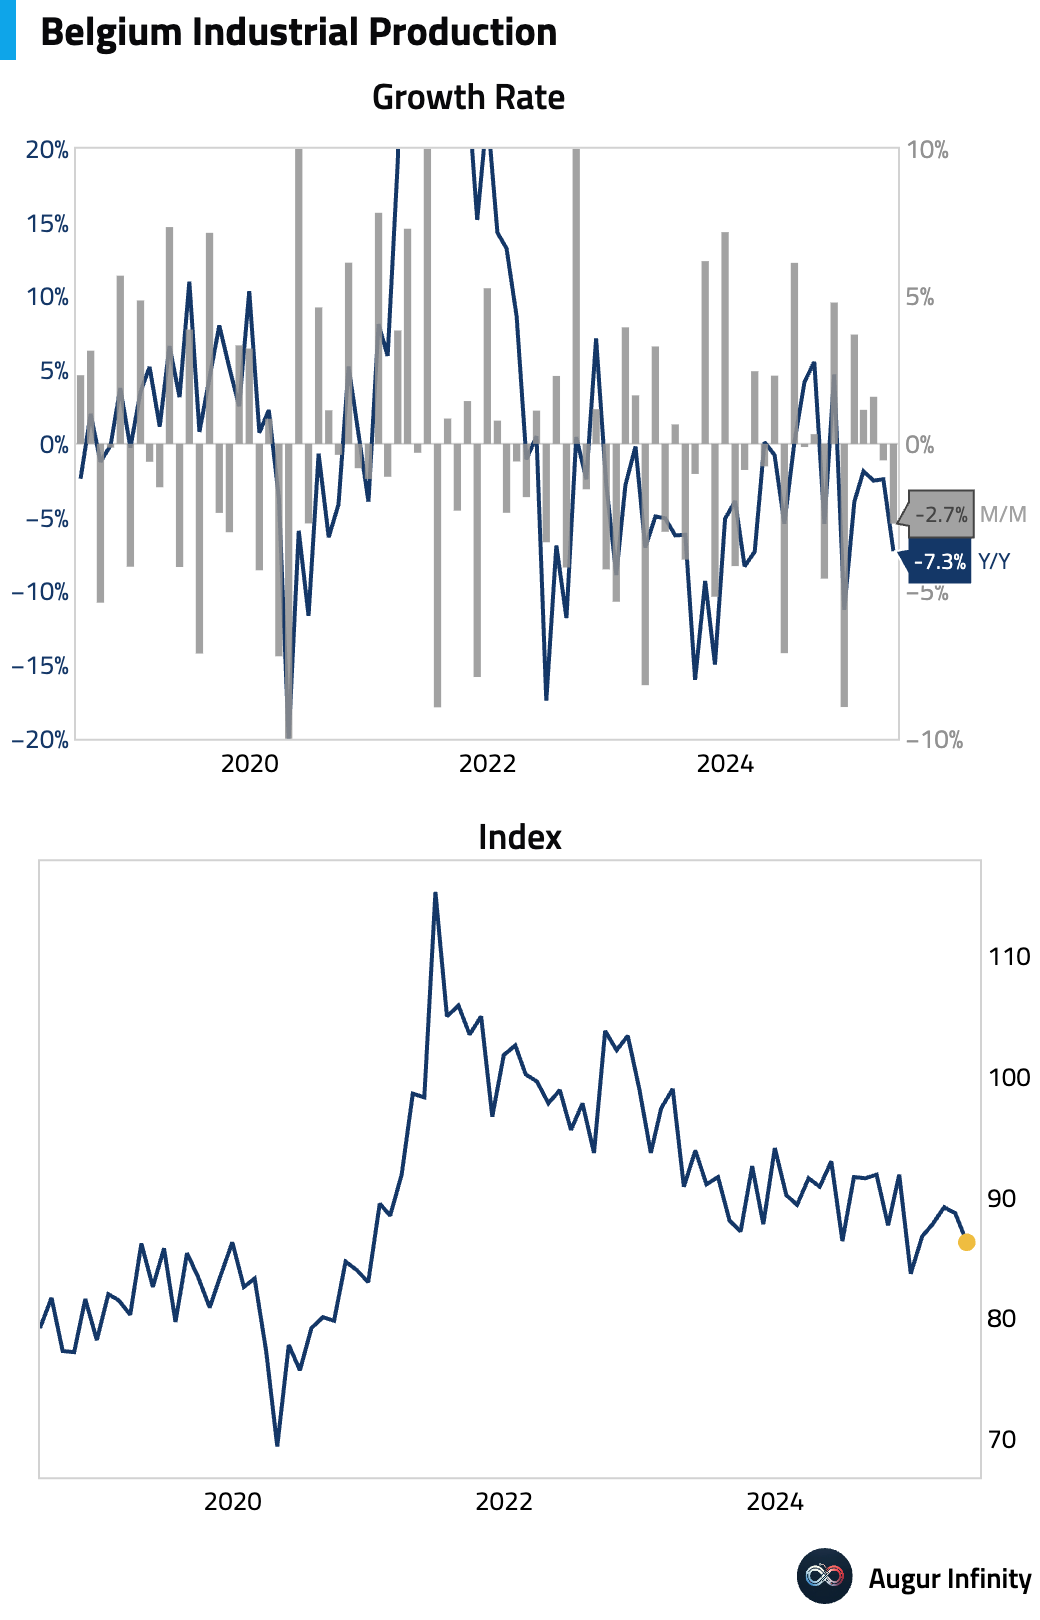
- Belgium’s industrial production declined sharply in May, falling 2.7% M/M (vs. −0.6% prior). The year-over-year figure worsened to −7.3% from −2.4%, marking the weakest reading since December 2024.
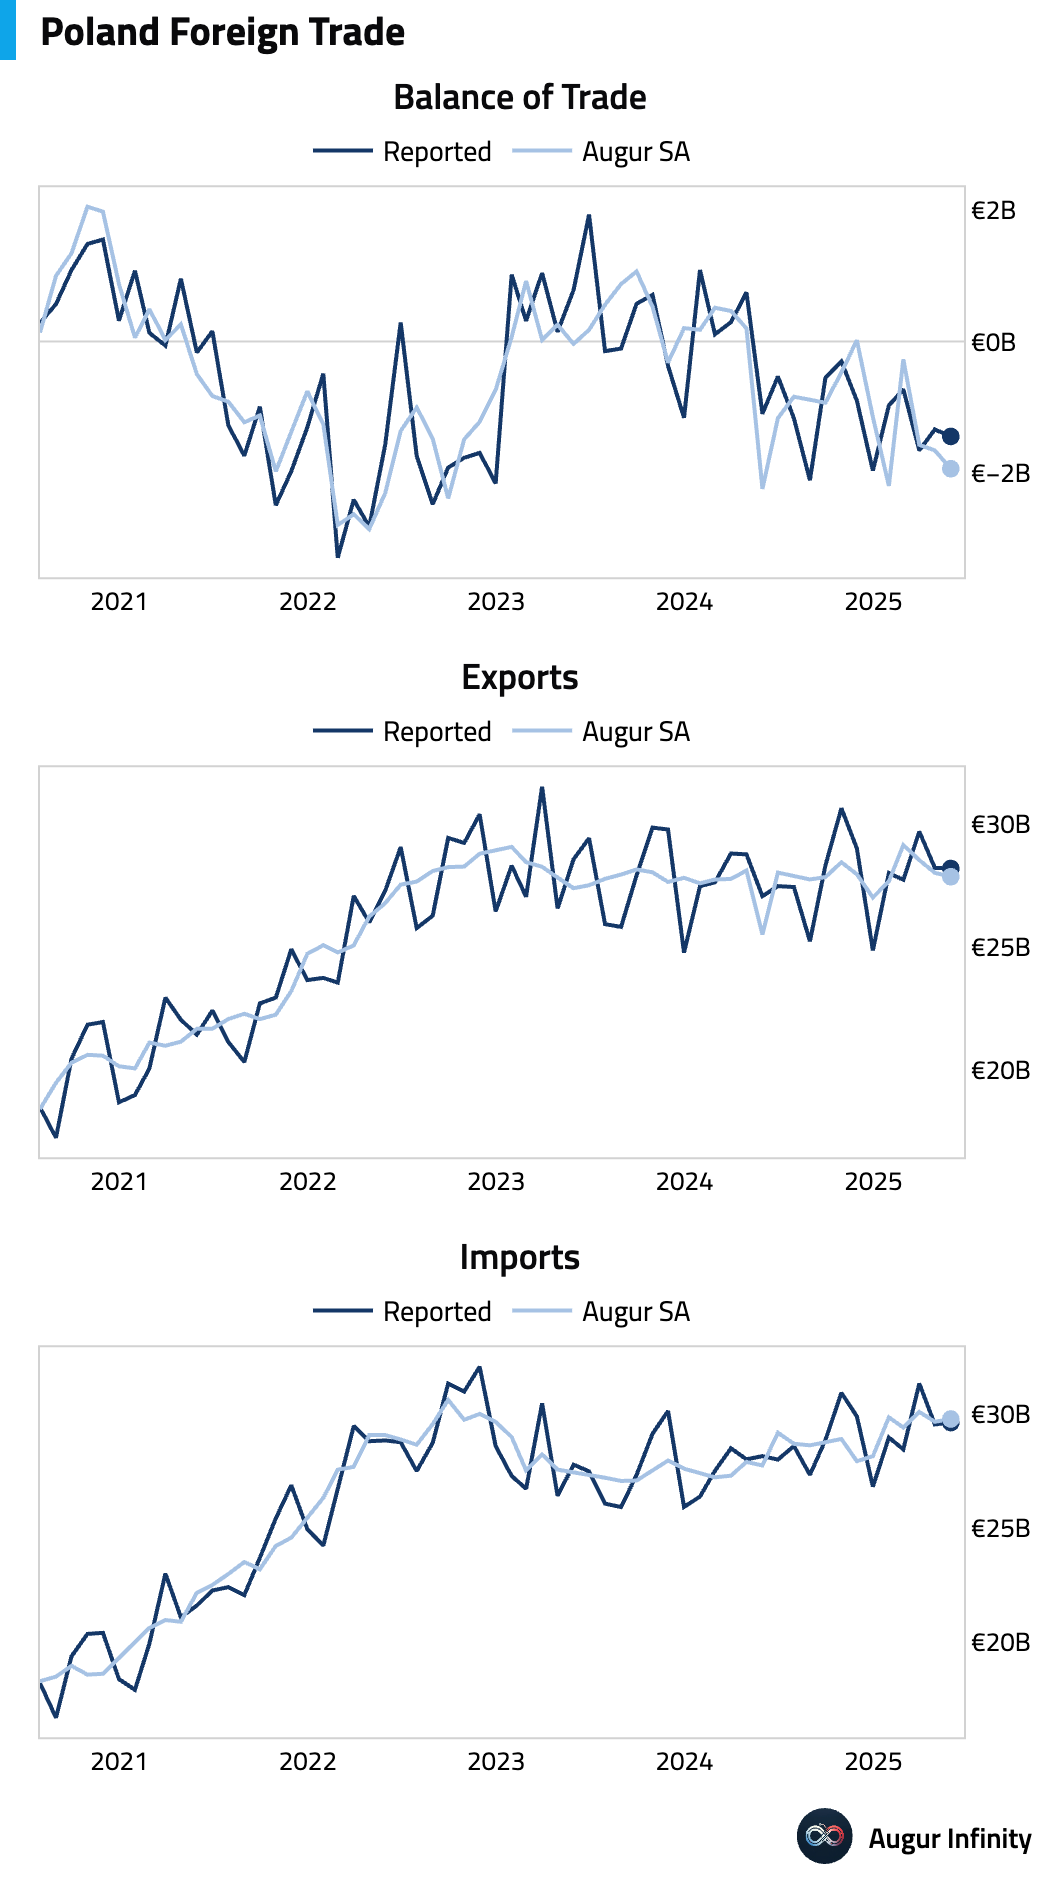
- Poland's trade deficit widened to €1.44 billion in May from €1.34 billion in April.
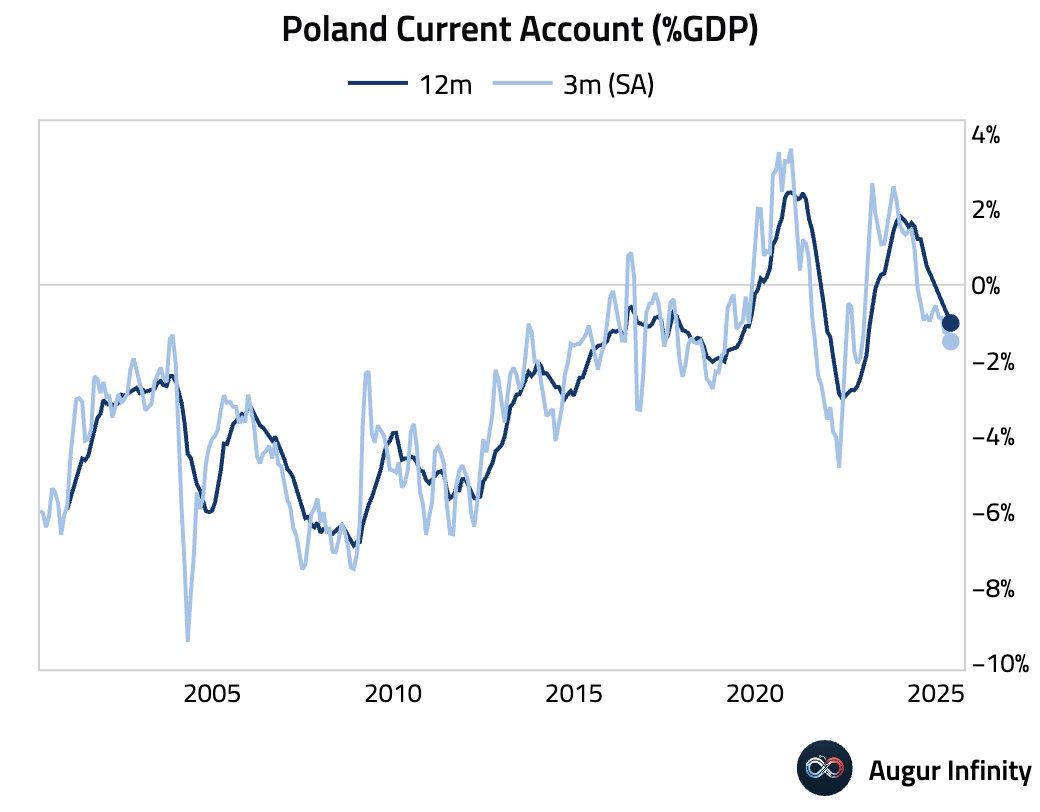
- Poland's current account deficit for May expanded to €1.74 billion, significantly wider than the €785 million consensus estimate and the prior month’s €596 million deficit.
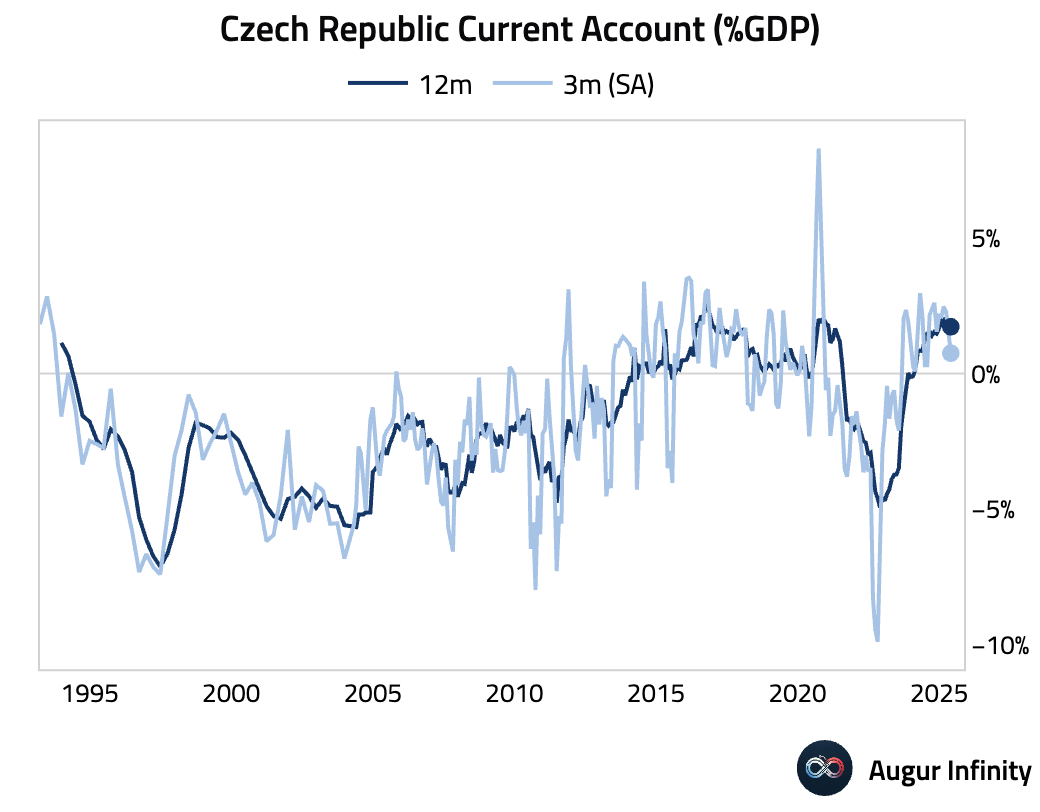
- The Czech Republic’s current account balance swung to a deficit of CZK 5.83 billion in May from a surplus of CZK 14.40 billion previously, missing the consensus forecast for a smaller deficit of CZK 4.98 billion.
Asia-Pacific
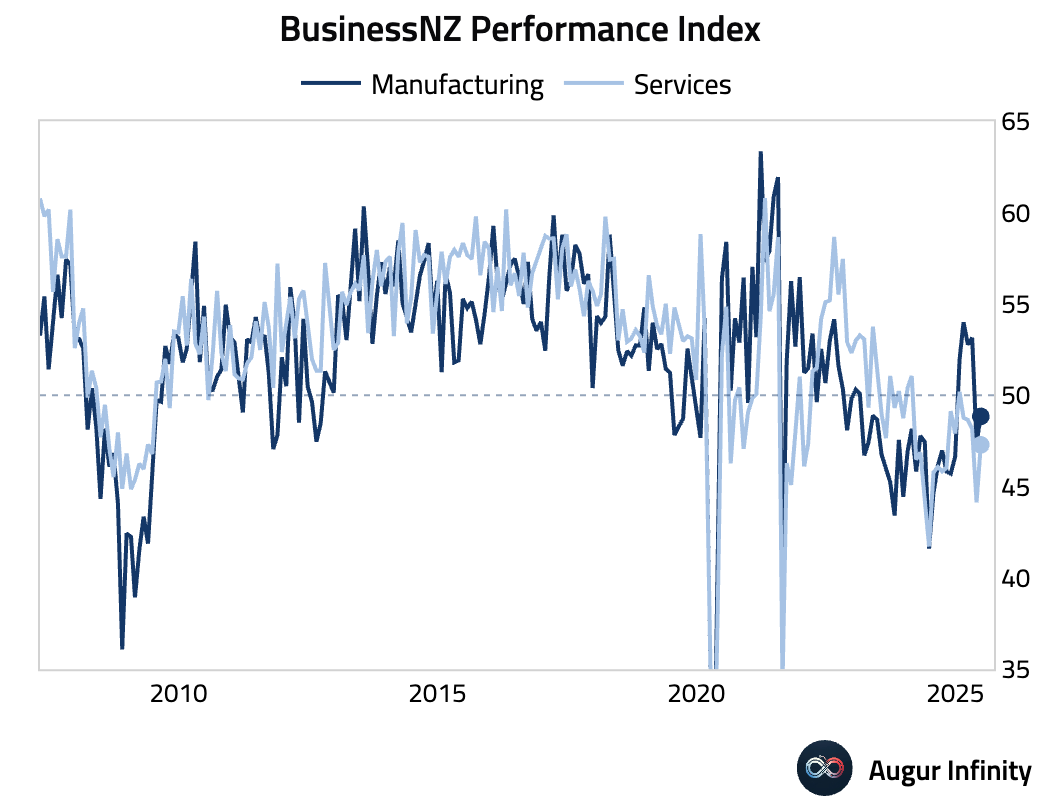
- New Zealand's BusinessNZ Performance of Services Index (PSI) rose to 47.3 in June from 44.1, its highest level in two months, though still indicating contraction.
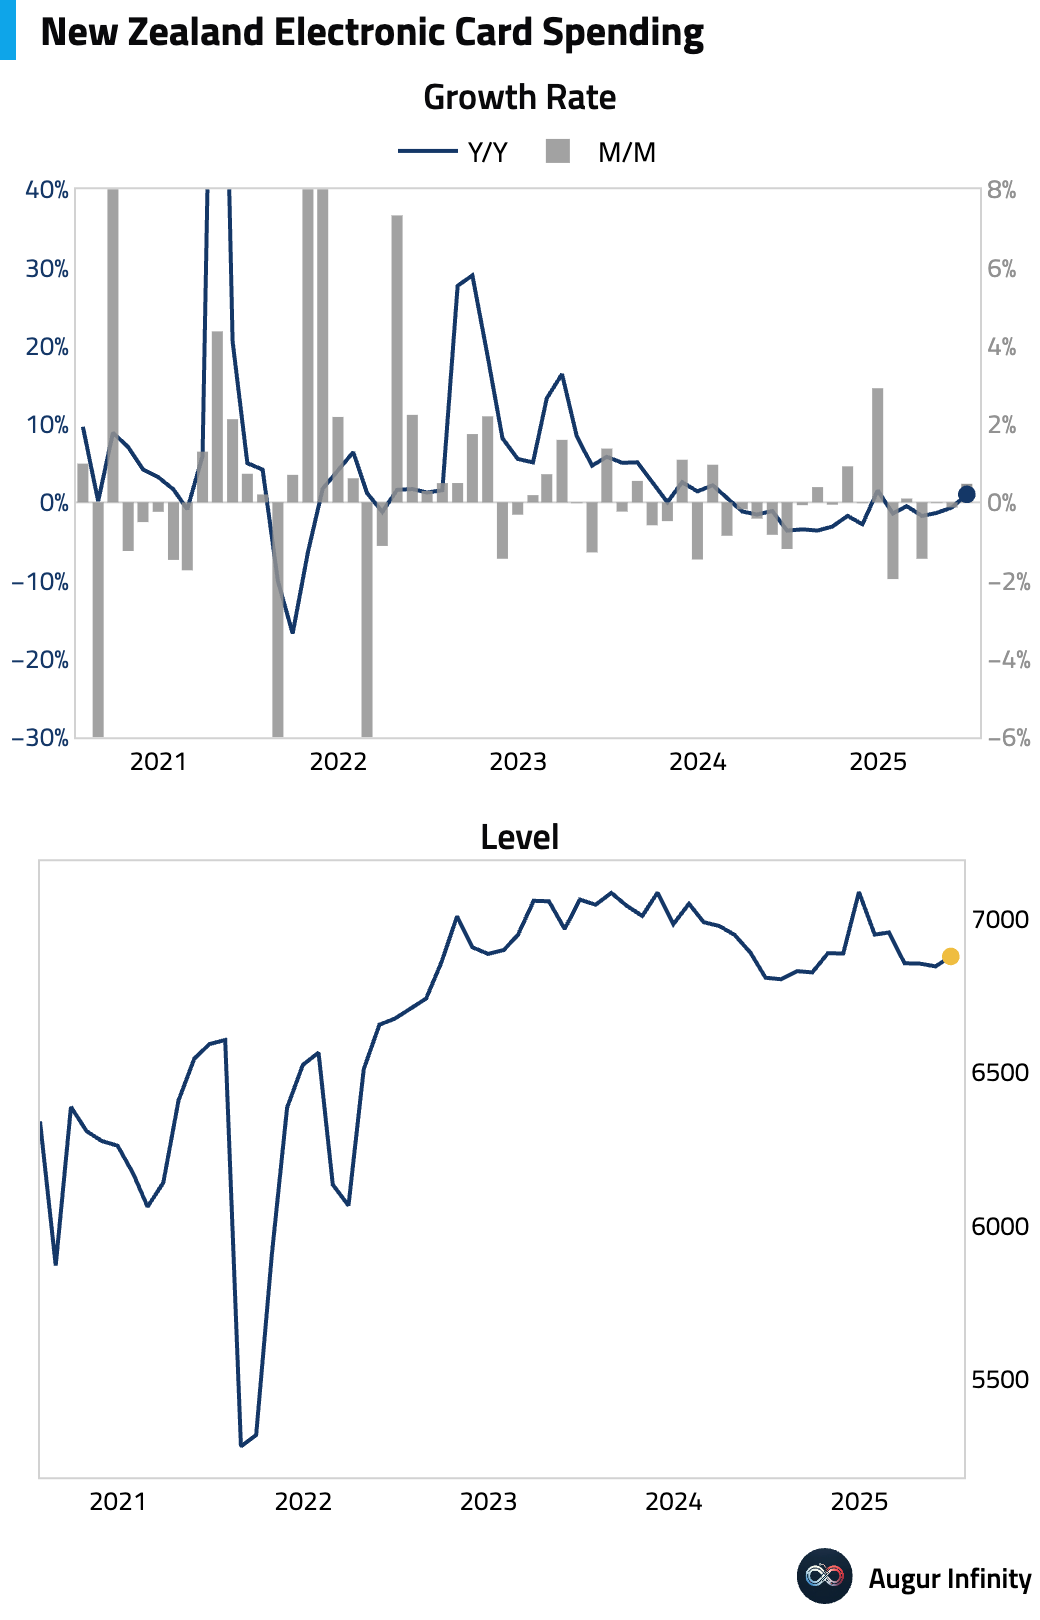
- New Zealand’s electronic retail card spending rebounded in June, rising 0.5% M/M after a 0.1% dip in May, marking its strongest monthly growth since December 2024. However, the Y/Y figure contracted by 0.4%, the weakest reading since December 2024.
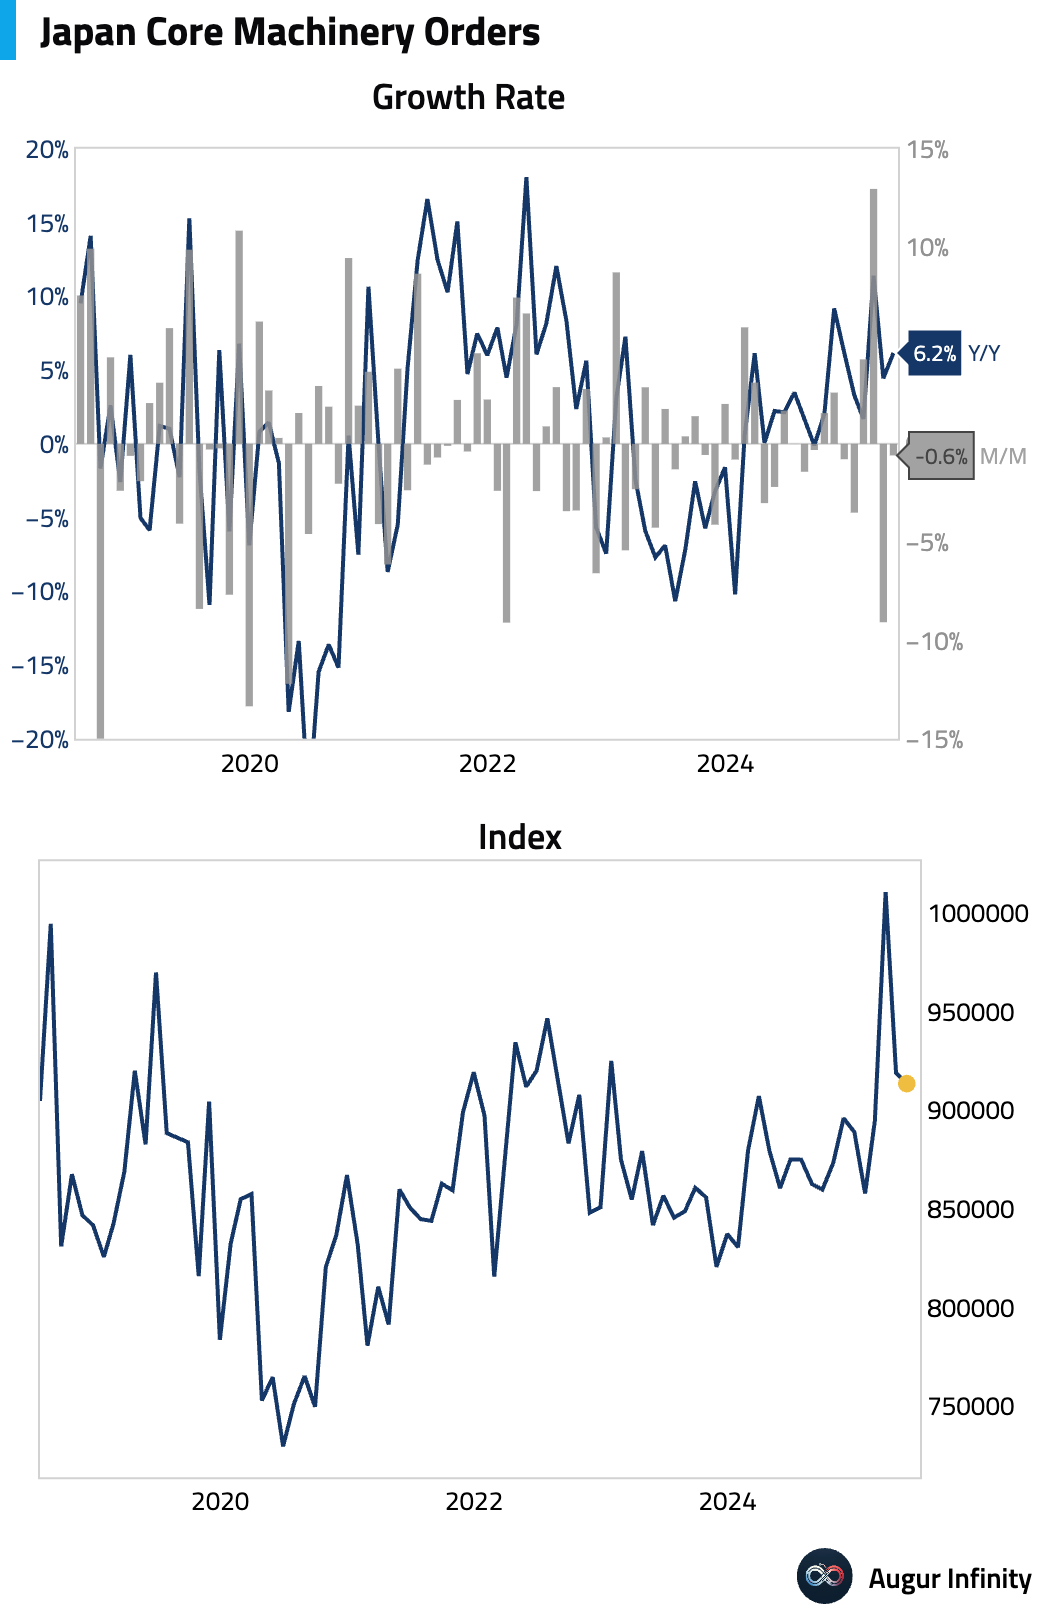
- Japan's core machinery orders fell 0.6% M/M in May, a significant improvement from the 9.1% plunge in April and much better than the −1.5% consensus.
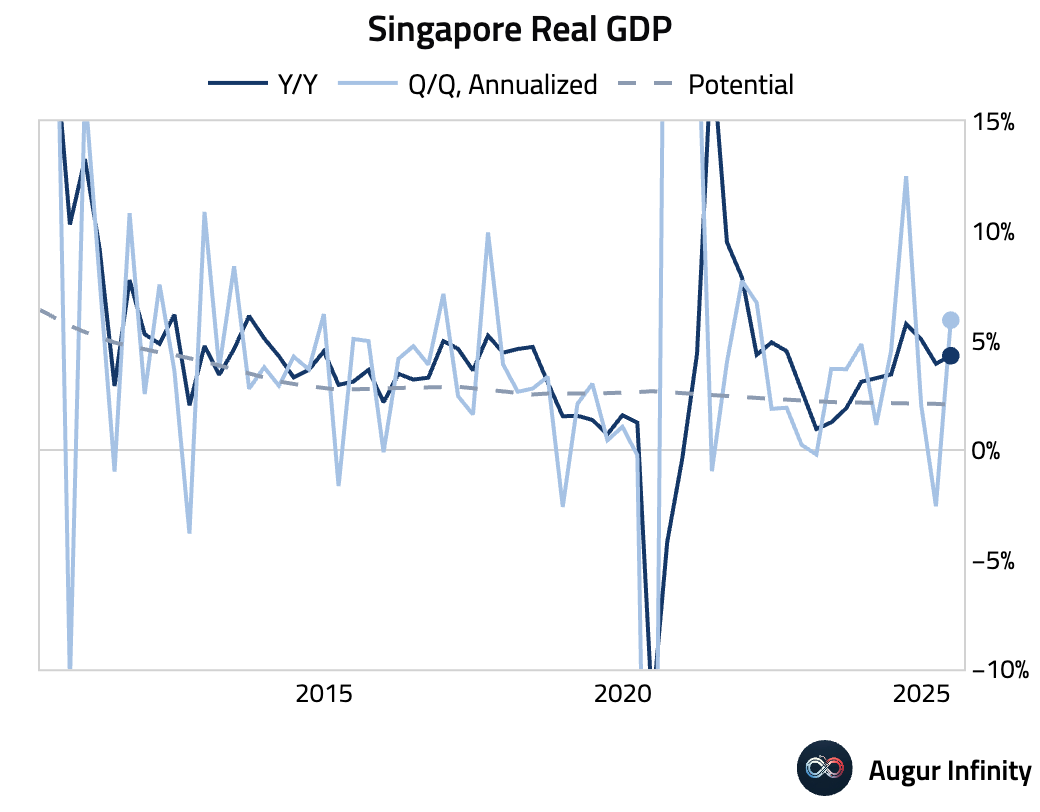
- Singapore’s advance Q2 GDP report showed strong growth, with the economy expanding 1.4% Q/Q, double the 0.7% consensus estimate and a sharp reversal from the −0.5% contraction in Q1. Y/Y growth also accelerated to 4.3% (vs. 3.5% consensus), the strongest pace since Q4 2024.
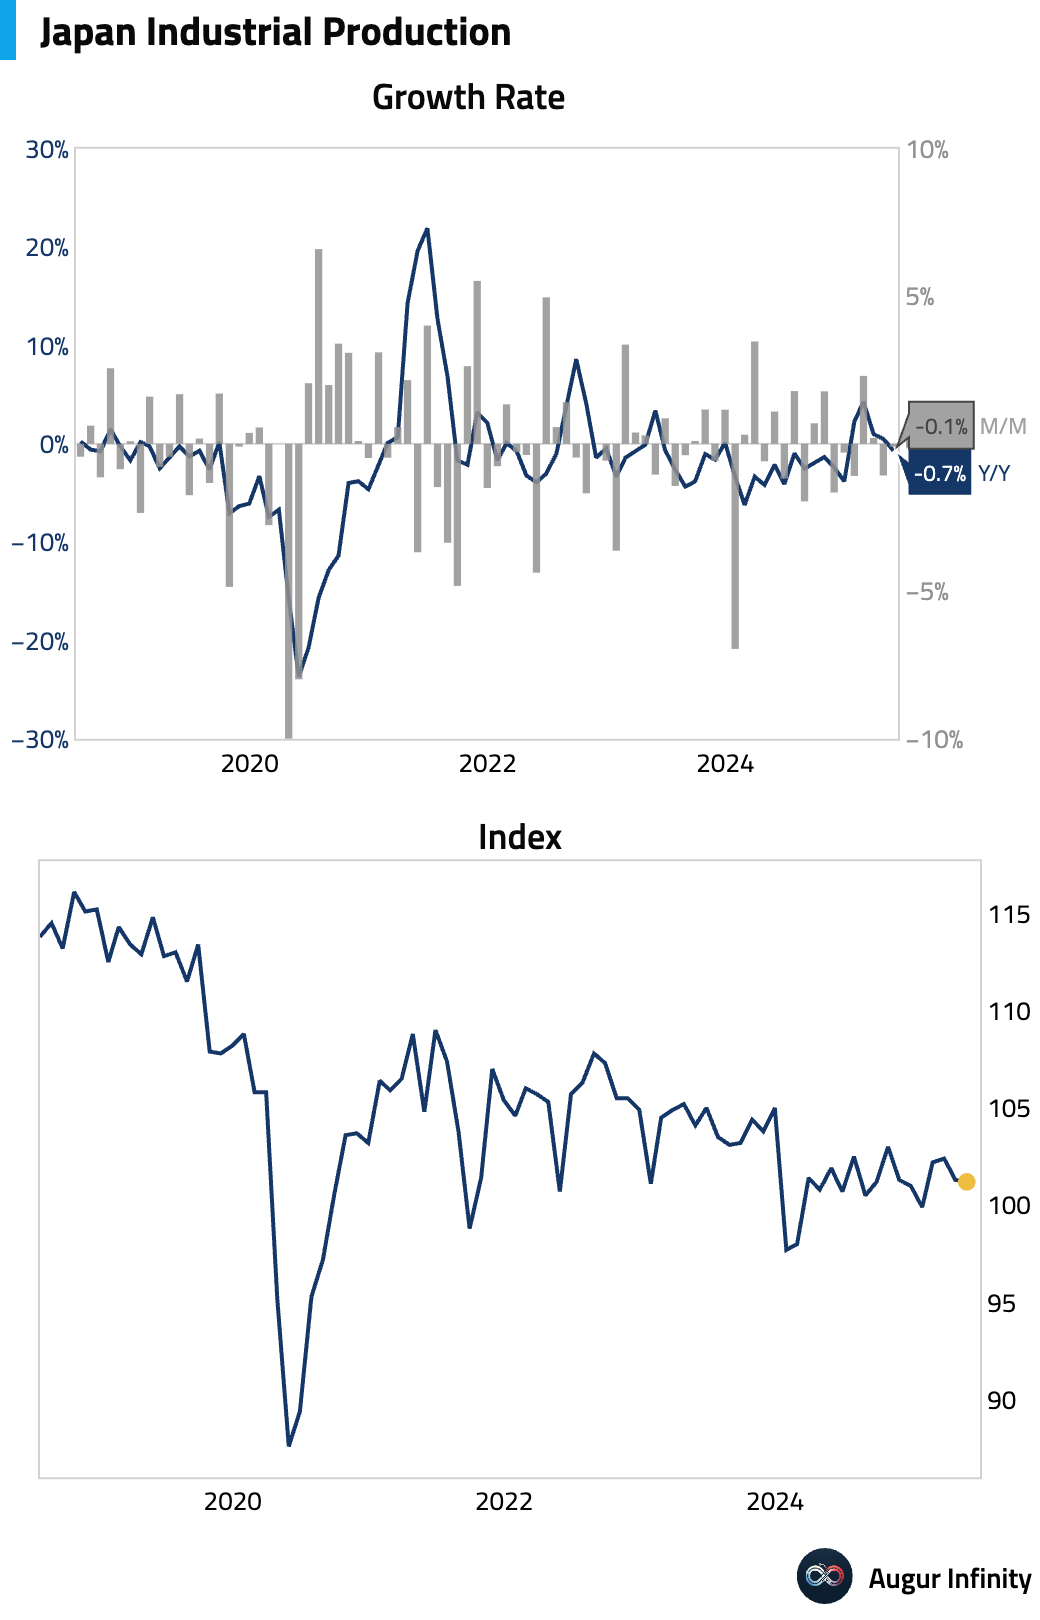
- Japan’s final industrial production for May was revised to a 0.1% M/M decline, missing the 0.5% consensus but improving from April’s 1.1% drop.
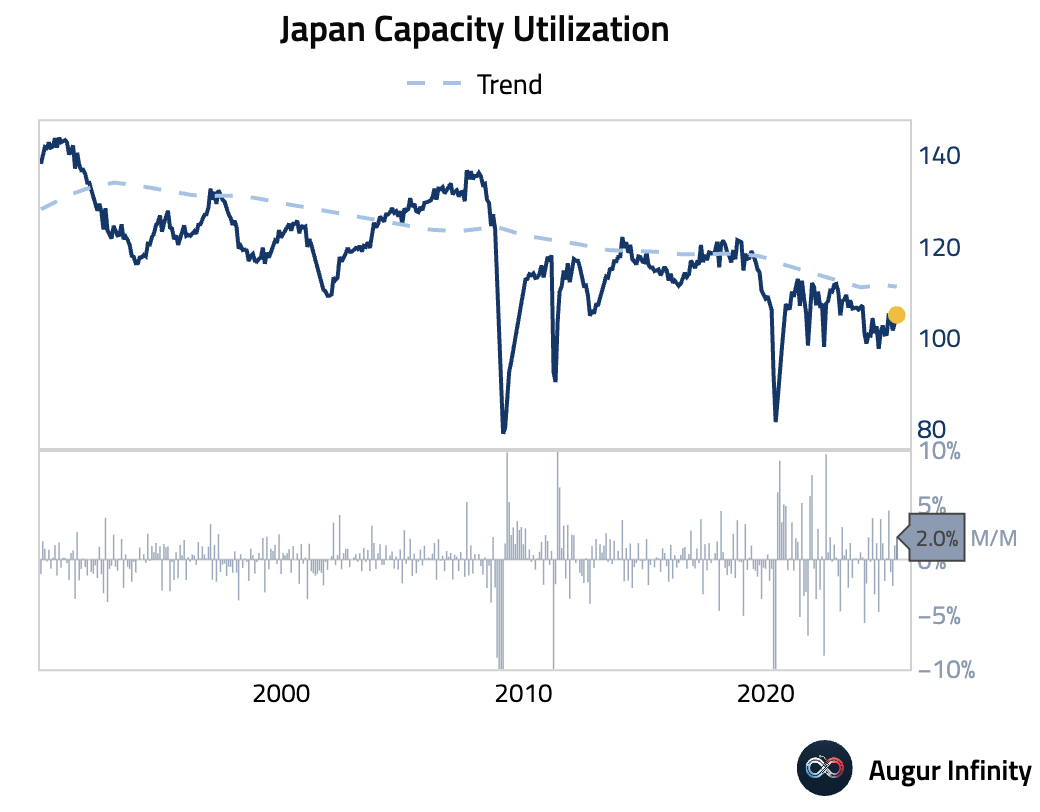
- Japan's May capacity utilization rose 2.0% M/M, accelerating from 1.3% in April and marking the strongest reading since January 2025.
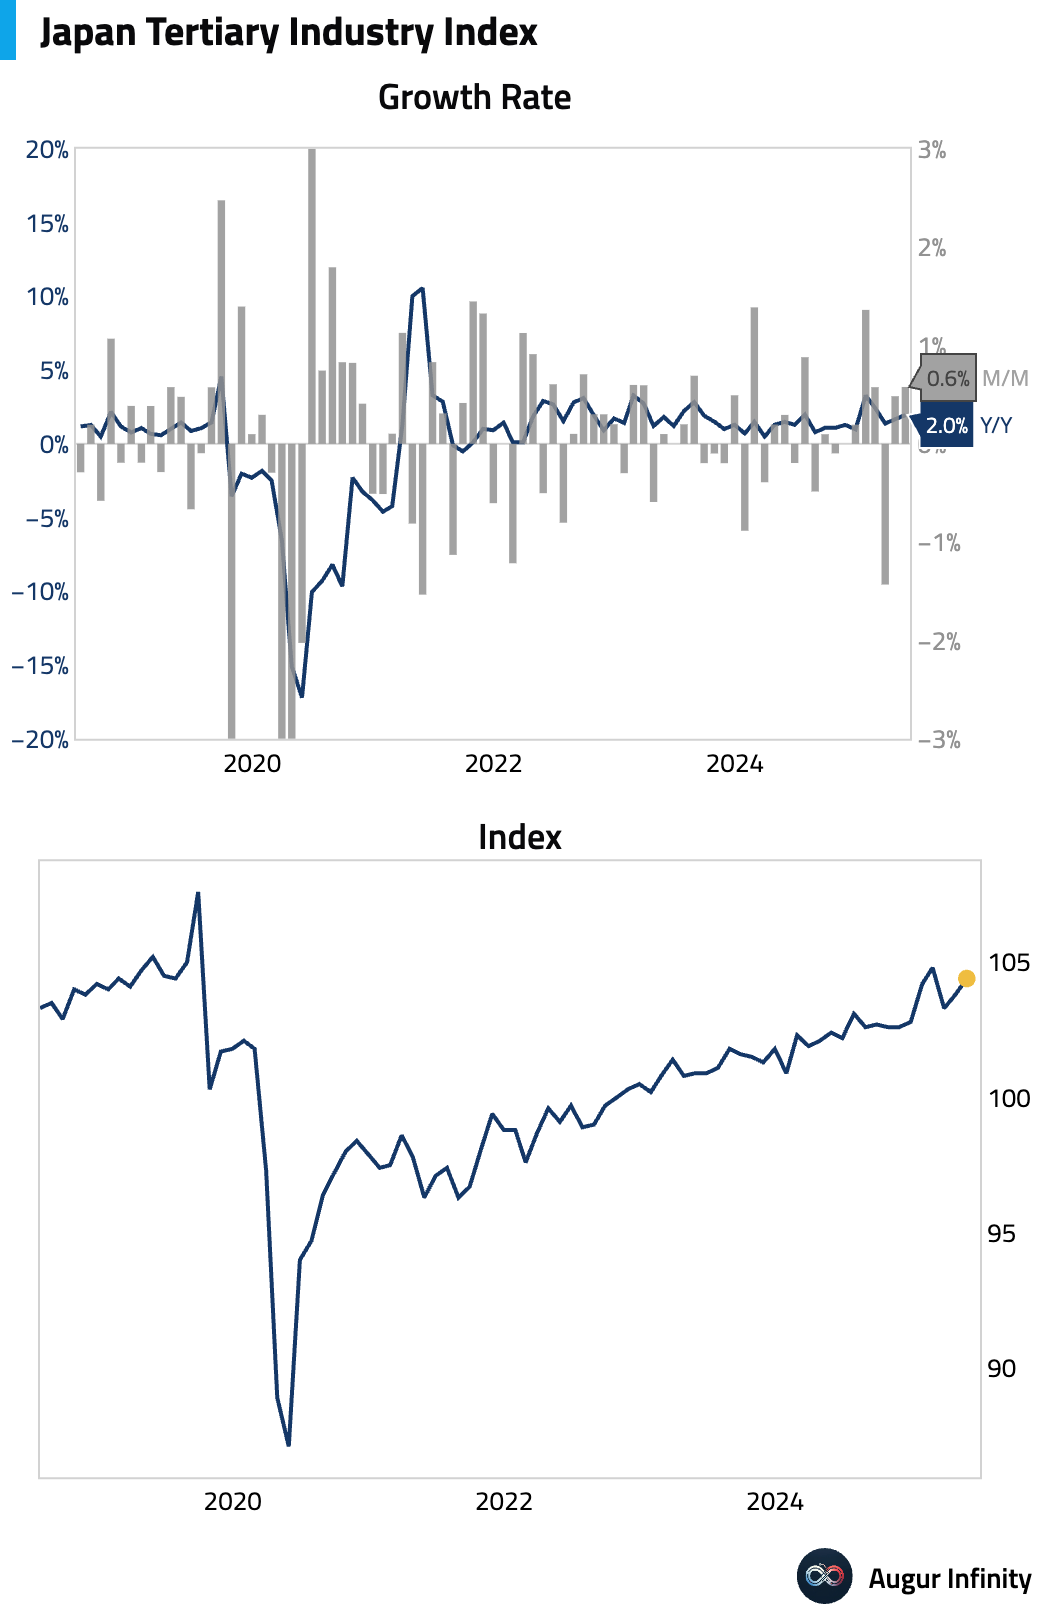
- Japan's Tertiary Industry Index, a gauge of service sector activity, rose 0.6% M/M in May, accelerating from 0.5% and easily beating the 0.1% consensus.
China
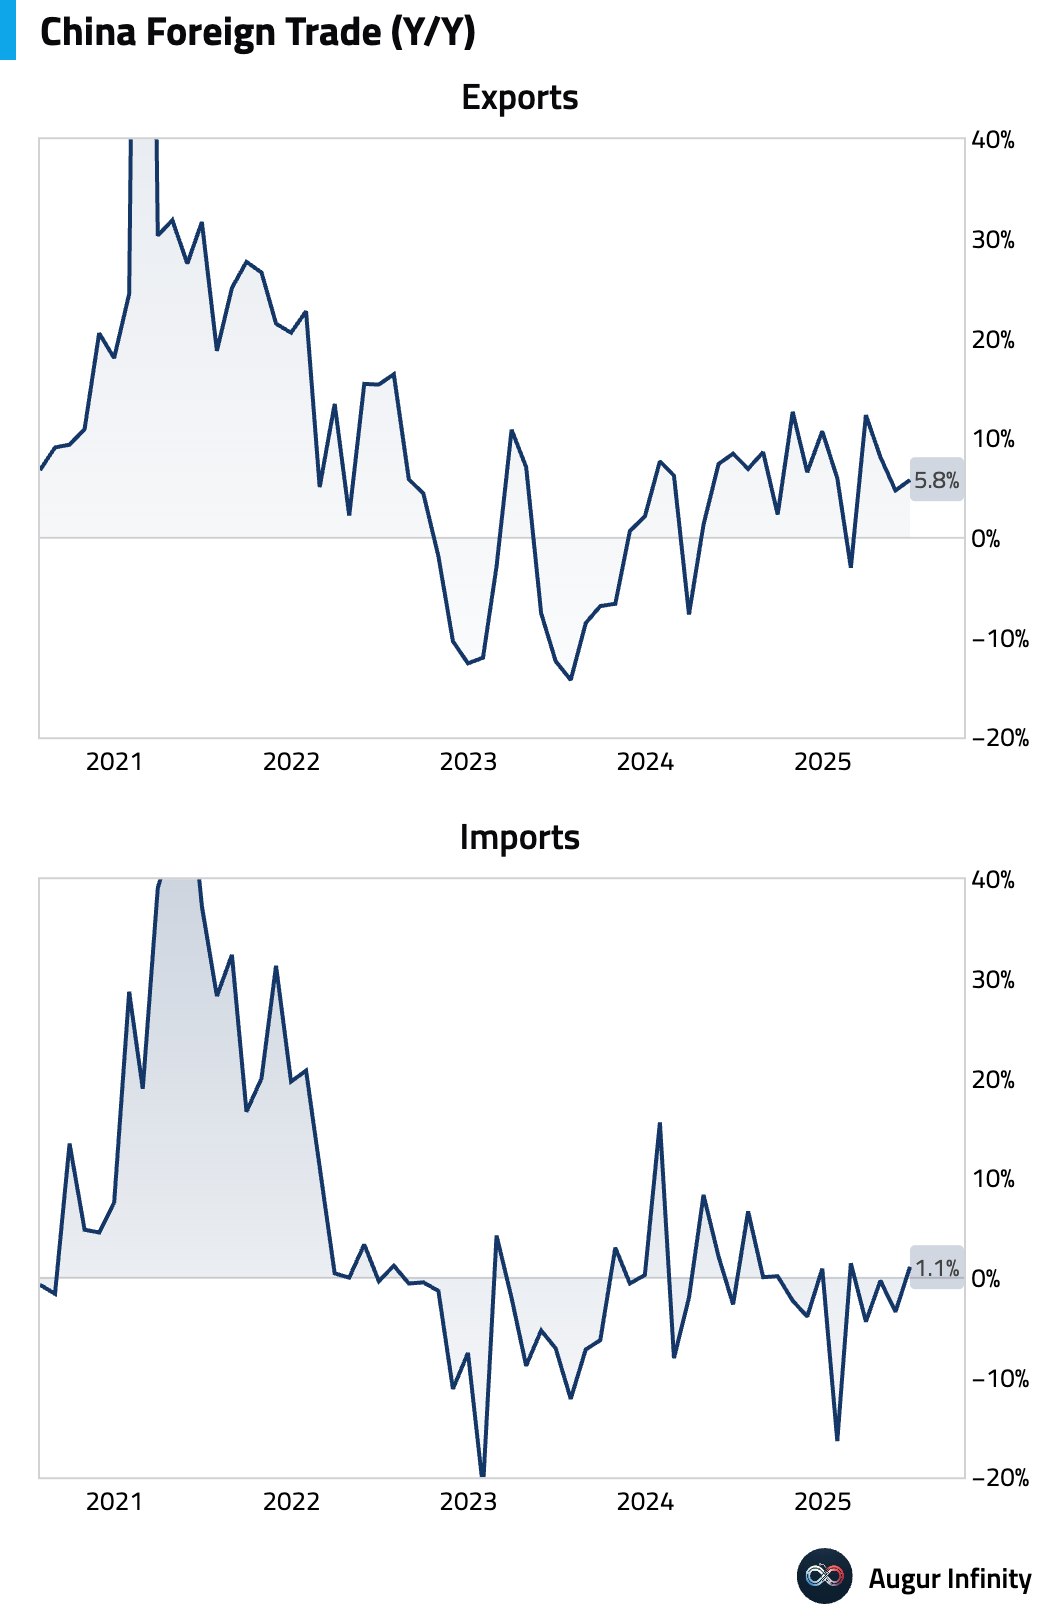
- China's trade surplus widened to a non-Lunar New Year record of $114.8 billion in June, above the $109 billion consensus. The beat was driven by stronger-than-expected export growth of 5.8% Y/Y (vs. 5.0% consensus), reflecting a sharp sequential rebound in US-bound shipments following May tariff reductions. Imports also turned positive, rising 1.1% Y/Y. By product, auto exports surged while semiconductor imports declined.
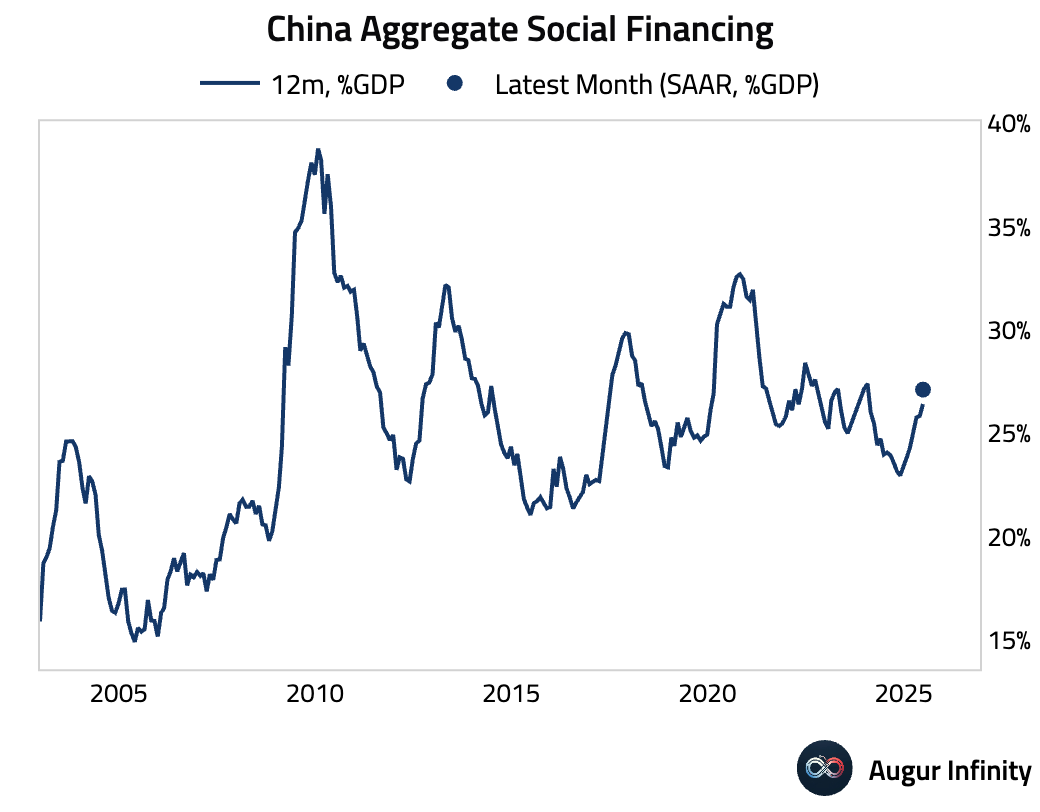
- China's June credit data showed a significant expansion. Total Social Financing (TSF) was ¥4.20 trillion, beating the ¥3.80 trillion consensus, while new RMB loans came in at ¥2.24 trillion, well above the ¥2.02 trillion expected. The strength in loans was broad-based across corporate and household sectors. Despite the headline beat, TSF flows declined modestly on a seasonally adjusted basis. Outstanding loan growth was stable at 7.1% Y/Y, while TSF stock growth accelerated to 8.9% Y/Y.
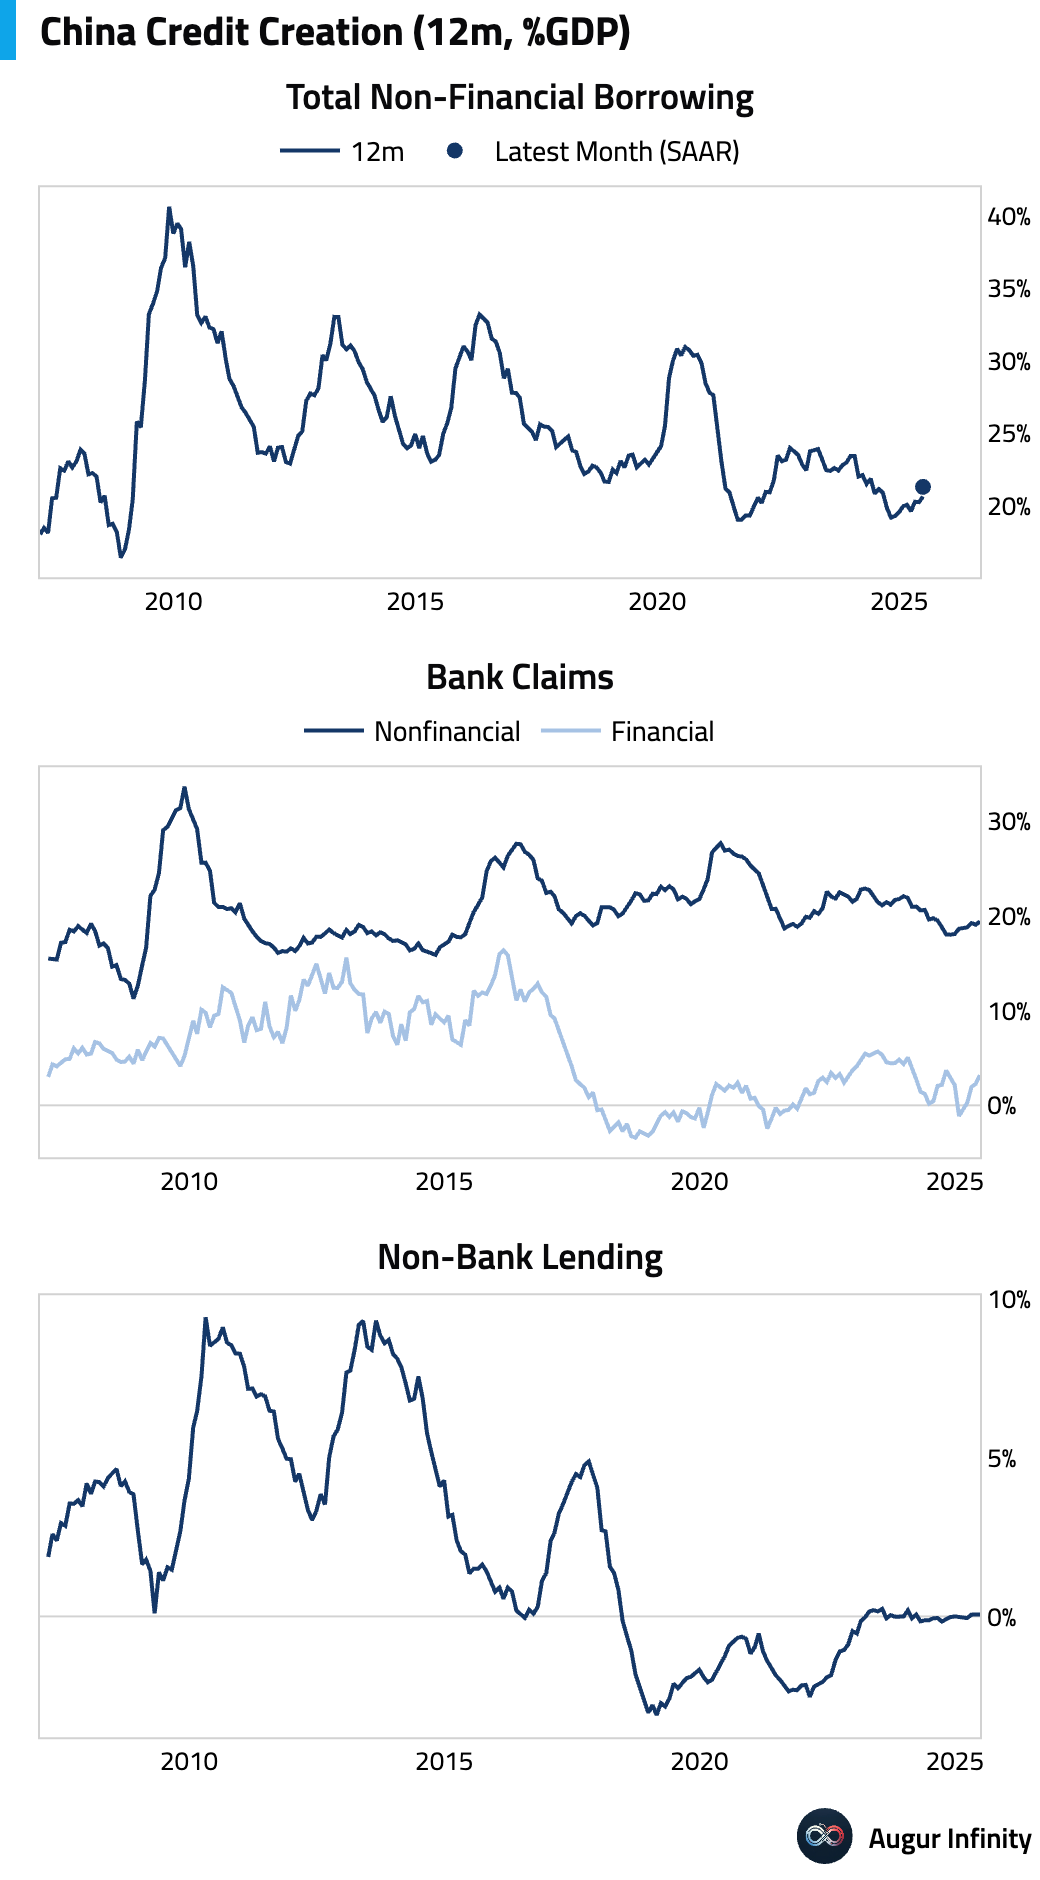
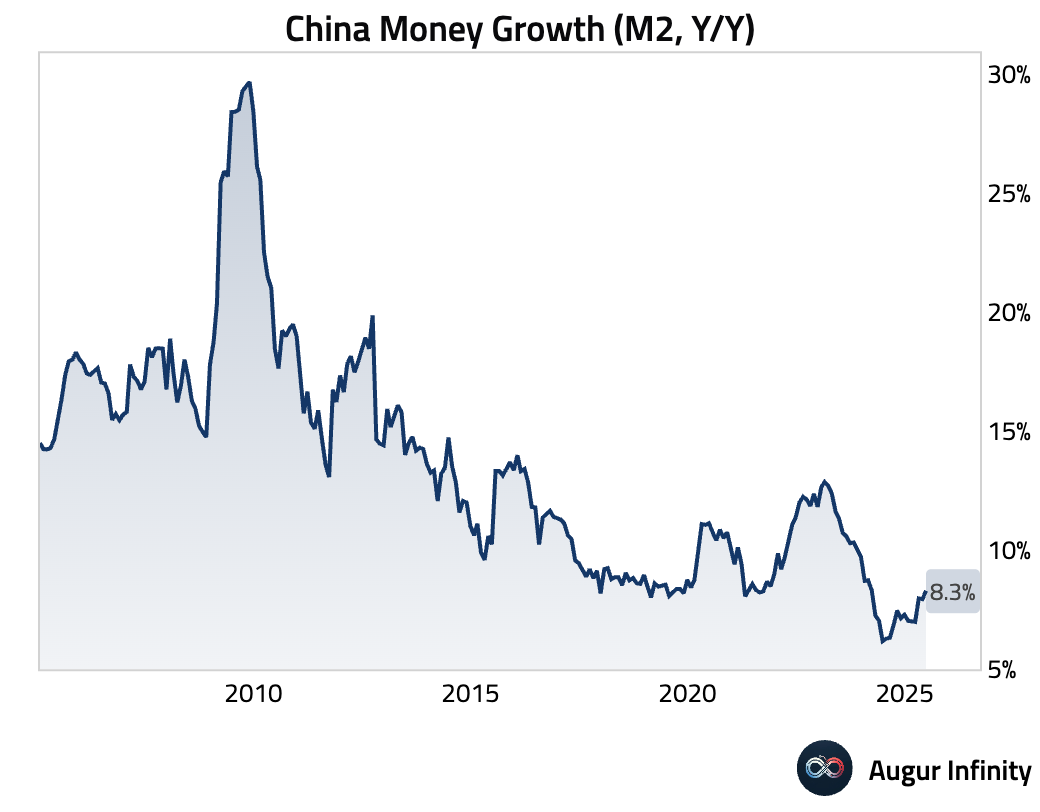
- China's M2 money supply growth accelerated to 8.3% Y/Y in June, slightly above the 8.1% consensus and up from 7.9% in May. This marks the strongest reading on record. M1 growth also picked up to 4.6% Y/Y from 2.3% prior. The increases were likely boosted by fiscal spending.
Emerging Markets ex China
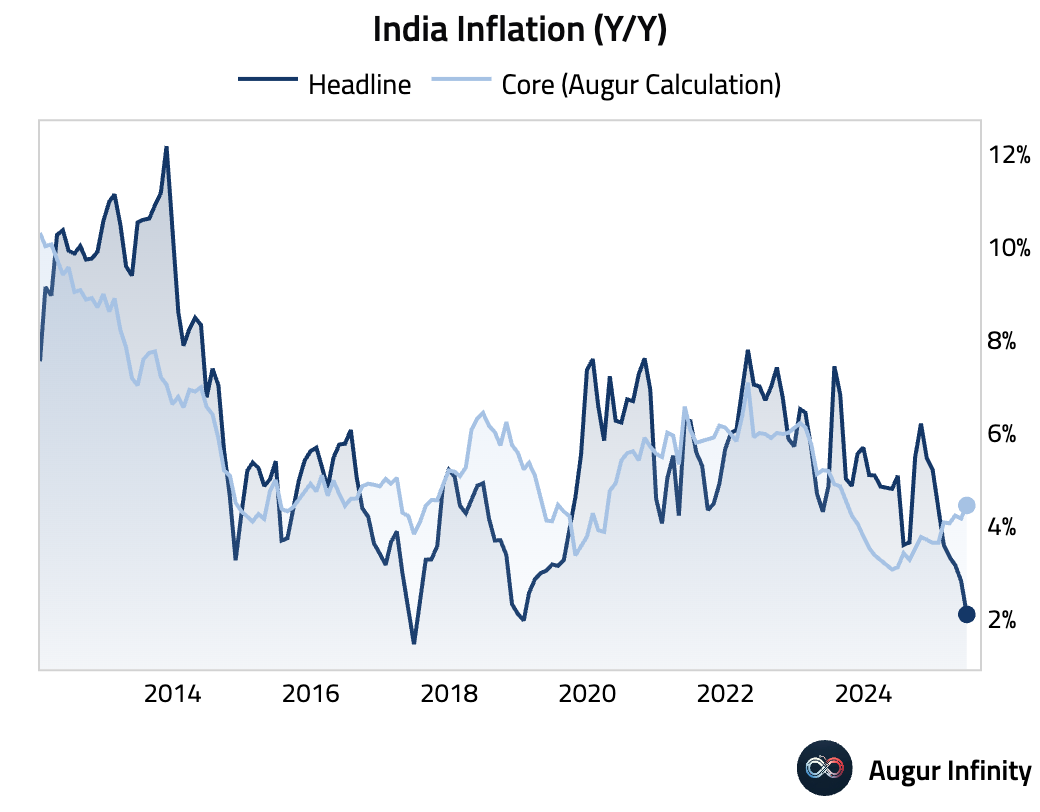
- India's headline CPI inflation fell to 2.1% Y/Y in June, below the 2.5% consensus and marking the lowest reading in over six years. The decline was driven by deepening food deflation (−0.2% Y/Y), particularly in vegetables (−19% Y/Y) and pulses (−12% Y/Y). In contrast, core CPI rose to 4.4% Y/Y on higher education and gold prices. Analysts see the soft headline print as increasing the probability of further rate cuts from the Reserve Bank of India, with some forecasting two more 25 bps cuts this year.
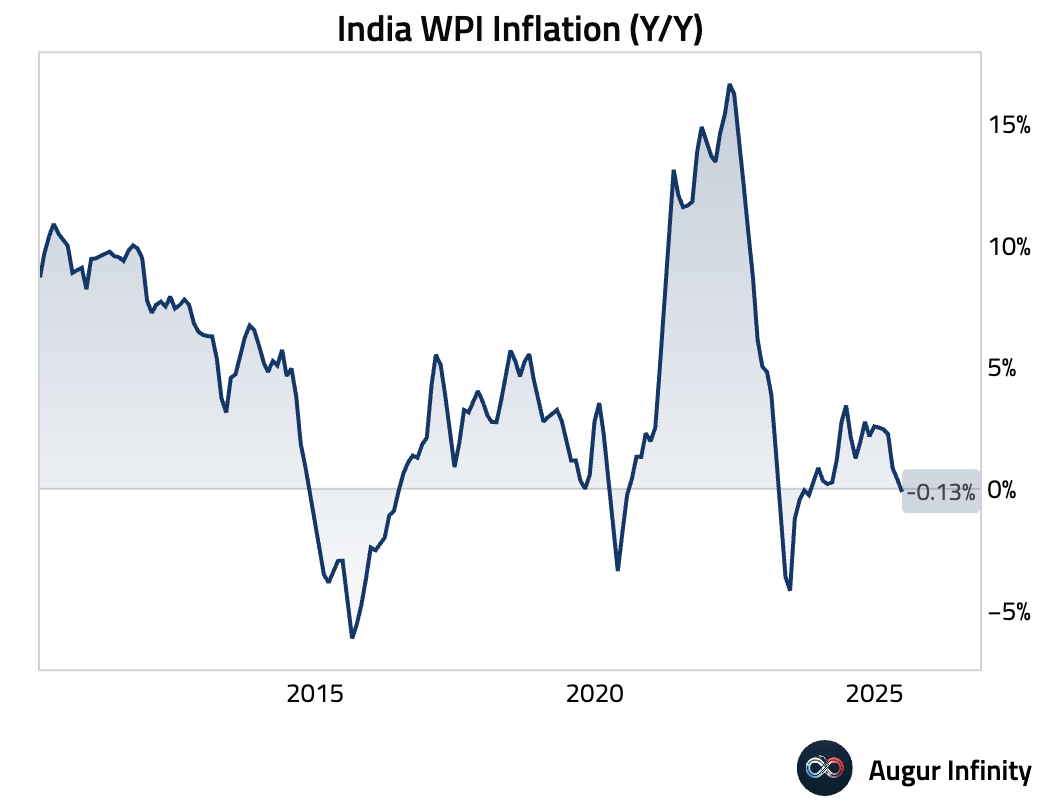
- India’s Wholesale Price Index (WPI) inflation unexpectedly turned negative in June, falling to −0.13% Y/Y from 0.39% in May and missing the 0.52% consensus. Food prices saw a −0.26% Y/Y decline, while manufacturing price growth eased to 1.97% Y/Y.
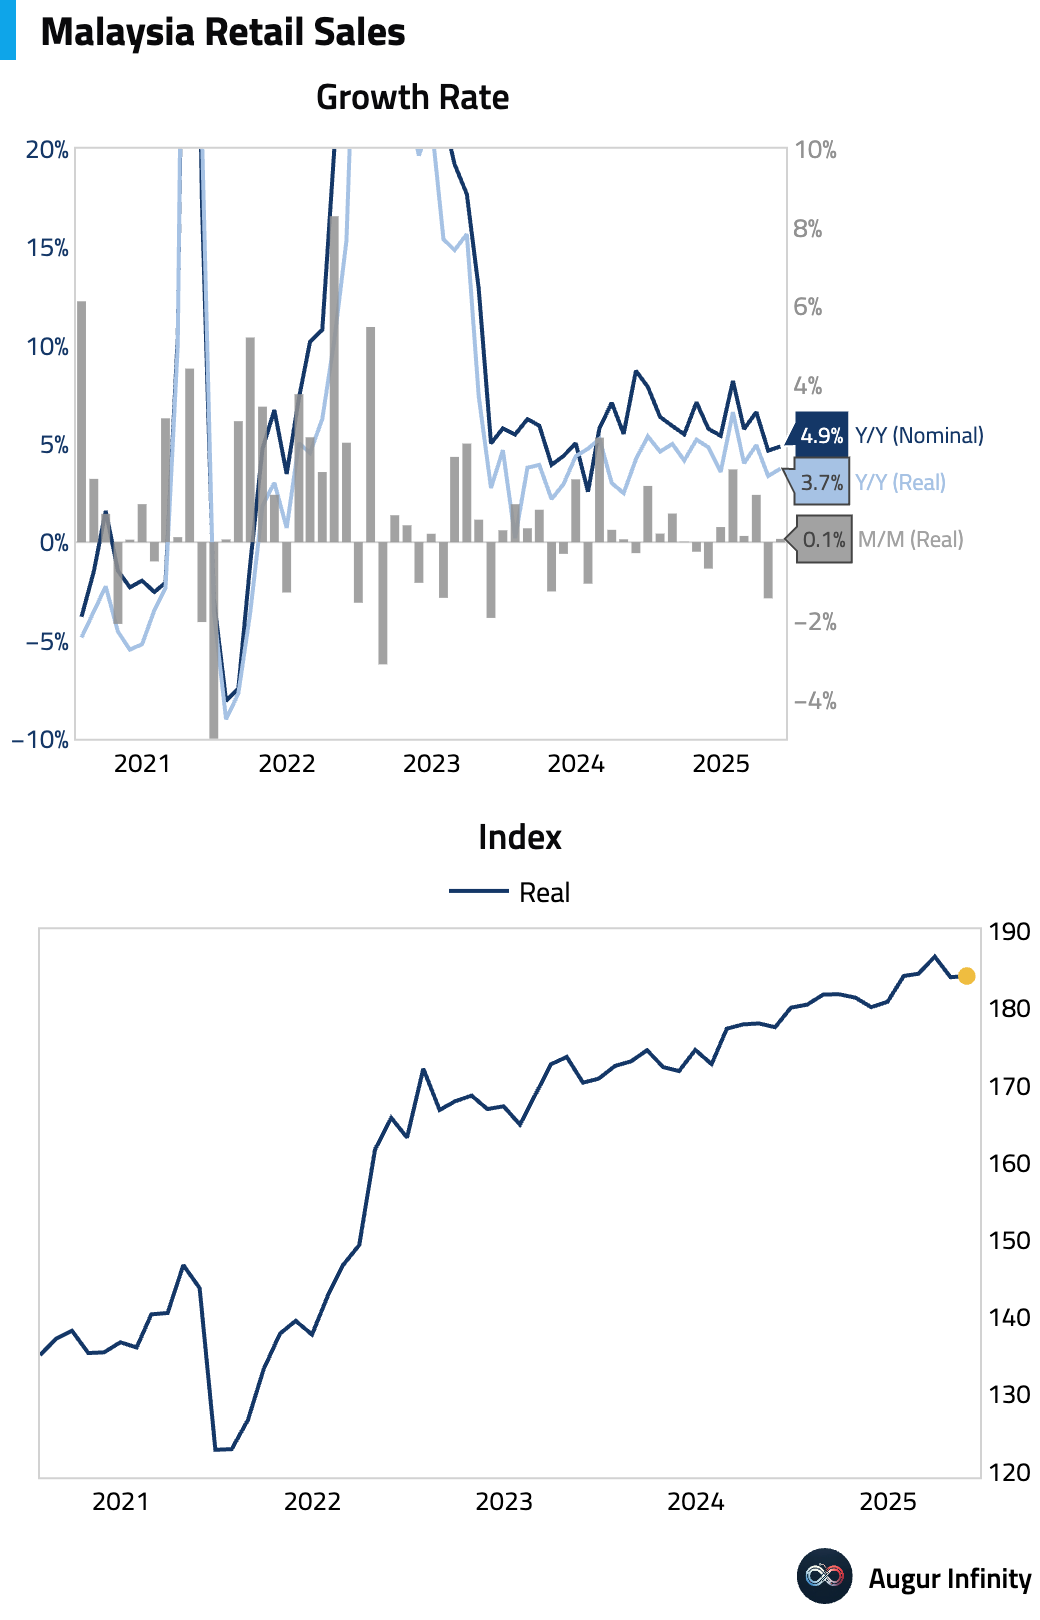
- Malaysia's retail sales growth accelerated to 4.9% Y/Y in May from 4.7% in April.
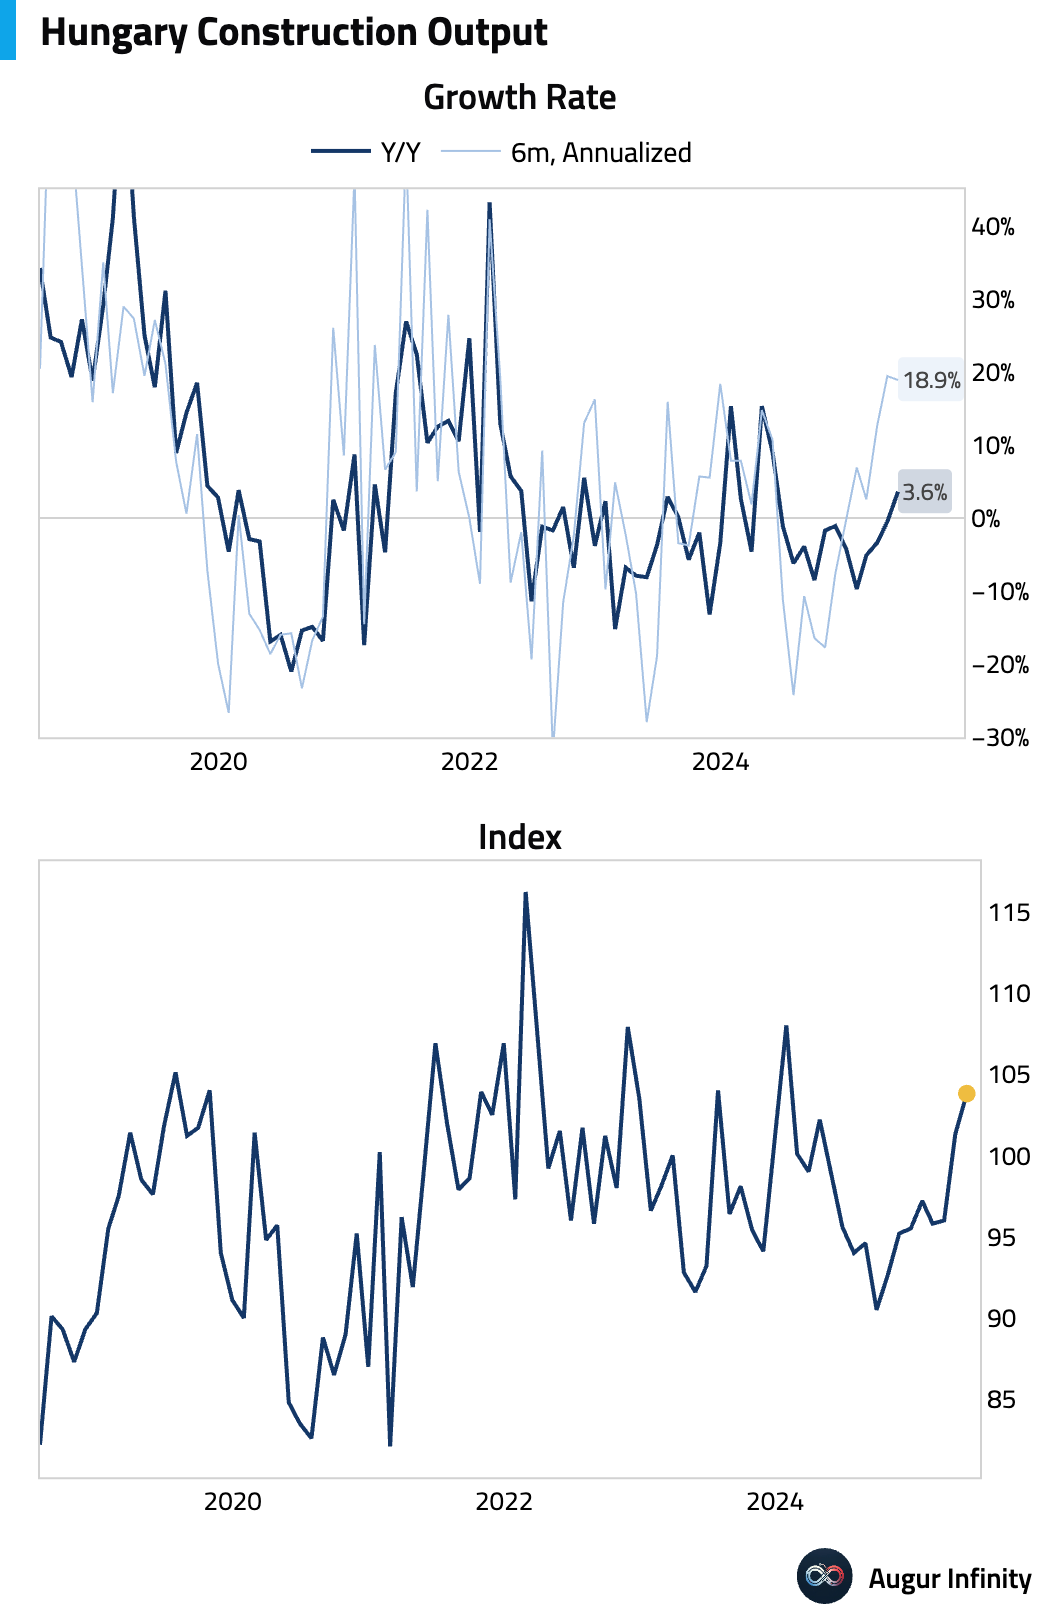
- Hungary’s construction output rebounded strongly in May, growing 3.6% Y/Y after contracting 0.5% in April. This marks the strongest annual growth in over a year.
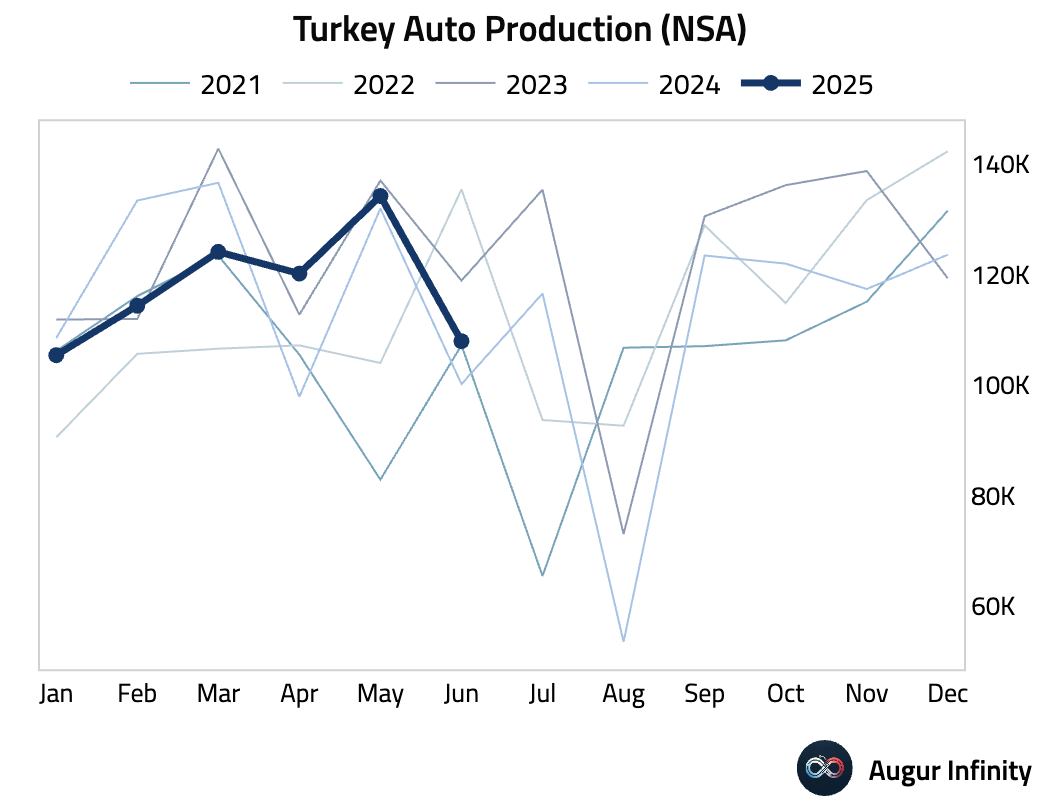
- Turkey’s auto production surged 7.8% Y/Y in June, a sharp acceleration from the 1.7% growth seen in May.
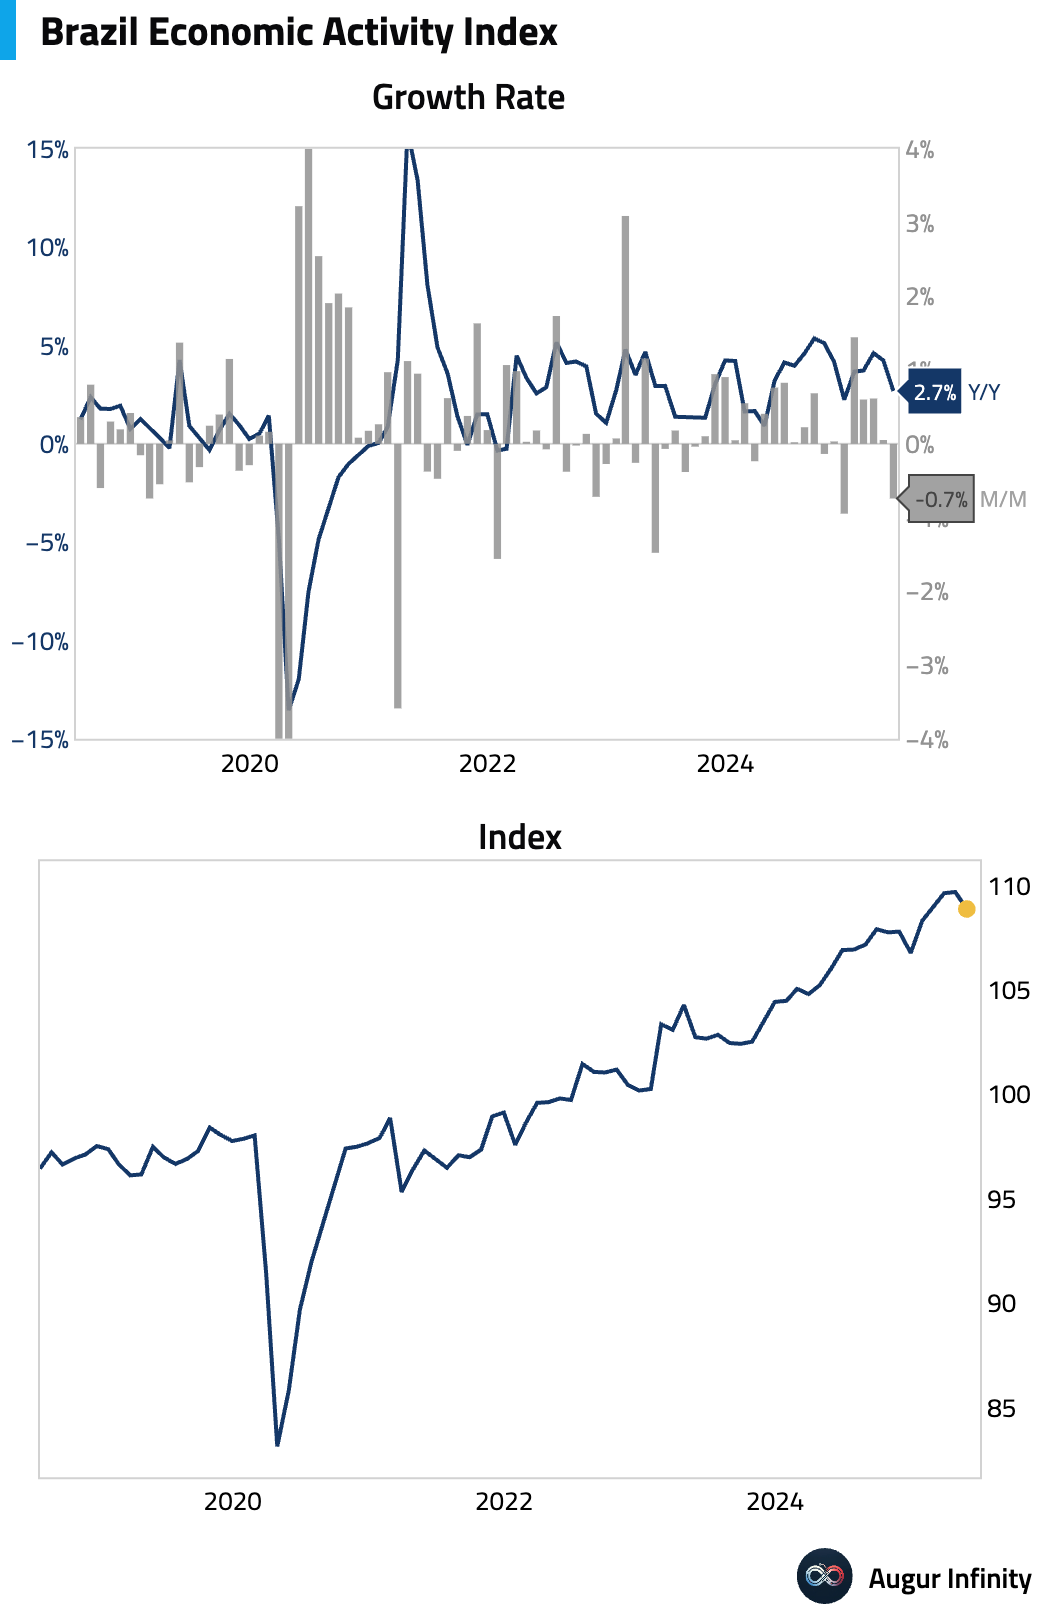
- Brazil's IBC-BR economic activity index, a proxy for GDP, declined 0.7% M/M in May, a significant miss compared to the 0.0% consensus and a reversal from the 0.1% gain in April.
- Argentina's inflation continued to cool in June. The M/M rate ticked up to 1.6% from 1.5% but was below the 1.9% consensus. The Y/Y rate fell to 39.4% from 43.5%, its lowest level since January 2021.
Global Markets
Equities
- U.S. equities edged higher, with the S&P 500 up 0.1% and the Nasdaq Composite gaining 0.3%. Markets remained resilient despite White House announcements of potential 30% tariffs on goods from Mexico and the EU. European markets were softer, with Germany and France both extending their losing streaks to three days. In Asia, Chinese and South Korean markets posted strong gains of 1.2% and 0.9%, respectively. In Latin America, Brazilian equities fell for a fourth consecutive day.
Fixed Income
- The U.S. Treasury curve flattened as yields on the front end fell while the long end rose. The 2-year yield dipped 1.3 bps, while the 10-year yield rose 0.3 bps, marking its third consecutive daily increase. The 30-year yield climbed 1.3 bps. The moves come ahead of key U.S. inflation data and amid rising trade tensions.
FX
- The U.S. dollar was broadly stronger against its G10 peers. The British pound, Japanese yen, and Swedish krona all fell for a third consecutive day against the dollar. The euro also weakened, down 0.1%. The Canadian dollar was a notable exception, gaining 0.1% against the greenback.
Disclaimer
Augur Digest is an automated newsletter written by an AI. It may contain inaccuracies and is not investment advice. Augur Labs LLC will not accept liability for any loss or damage as a result of your reliance on the information contained in the newsletter.