Headlines
- The Trump administration is reportedly considering new tariffs of 10–15 percent on 150 nations, while separately planning to impose a 93.5 percent tariff on battery materials from China; the European Union is preparing retaliatory tariffs on US exports.
- The US House of Representatives voted to advance stablecoin legislation to a full House vote, expected to occur later today.
- The Senate passed a bill to eliminate $9 billion in spending on foreign aid and public broadcasting, advancing the measure to the House for a vote.
Charts of the Day
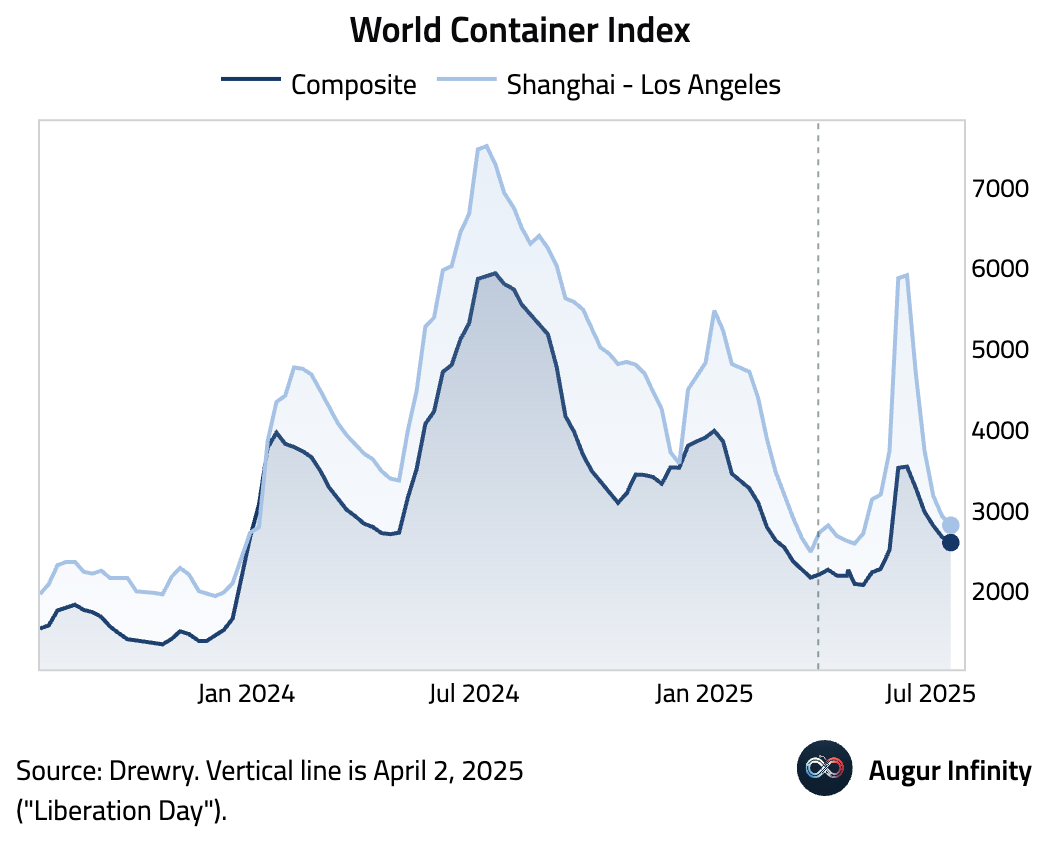
- The World Container Index, which measures spot freight rates, declined for the fifth consecutive week.
Global Economics
United States
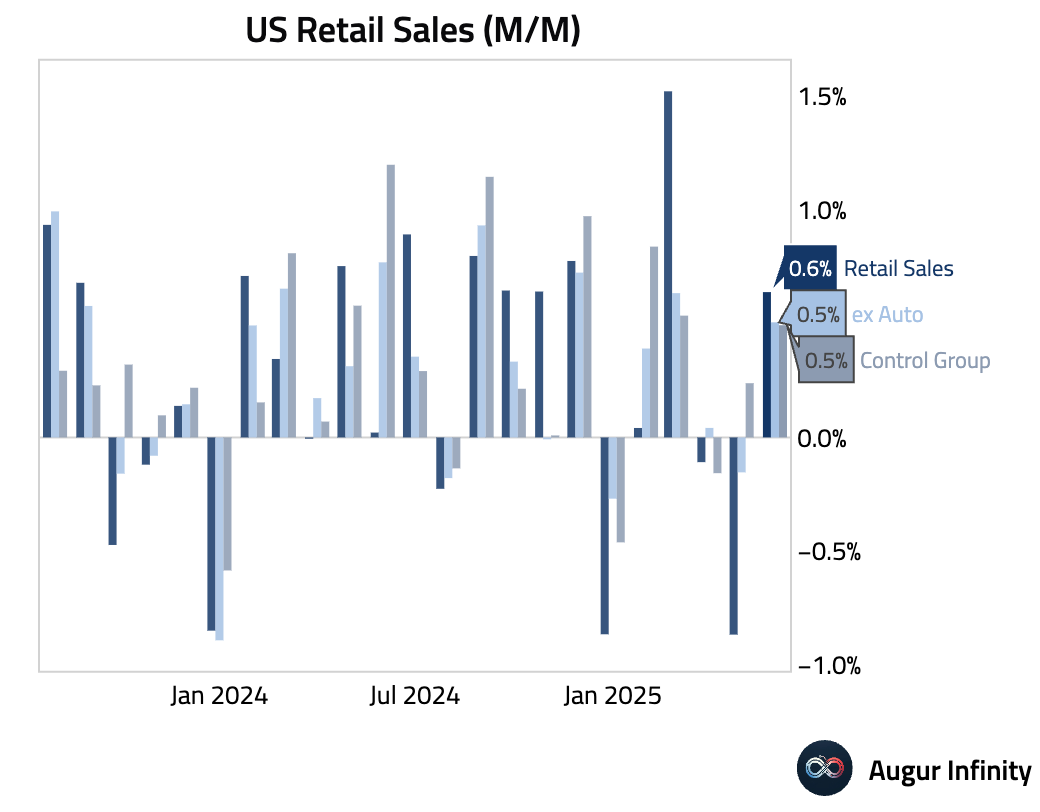
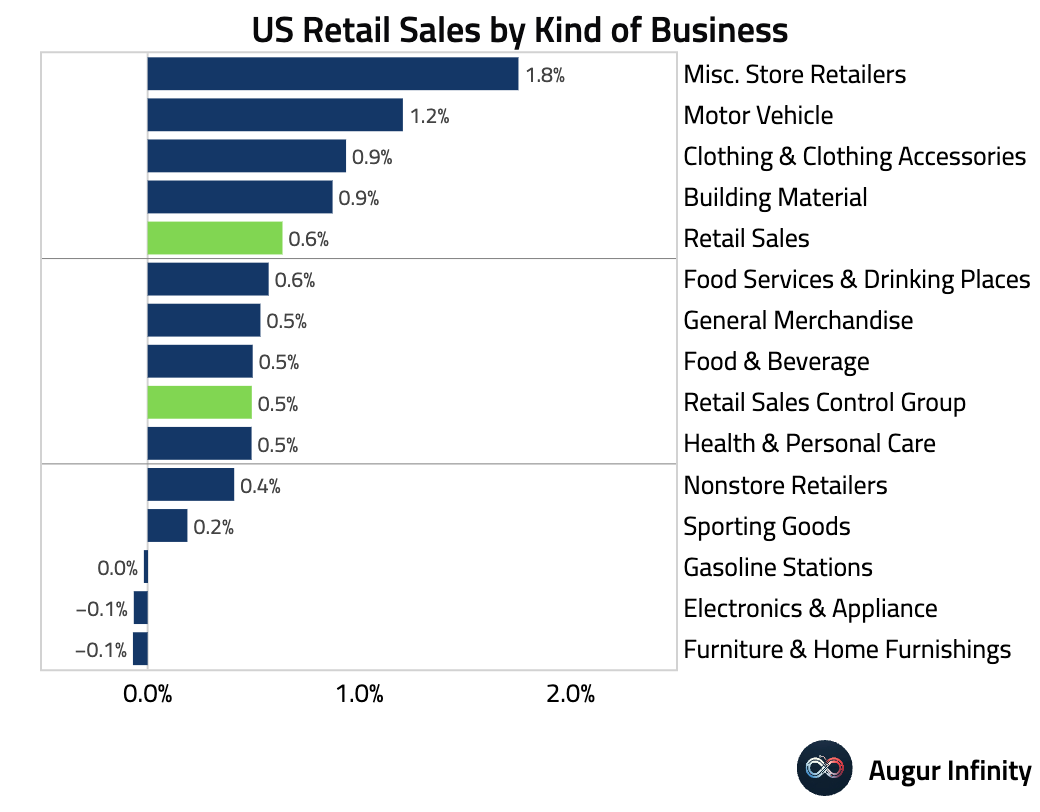
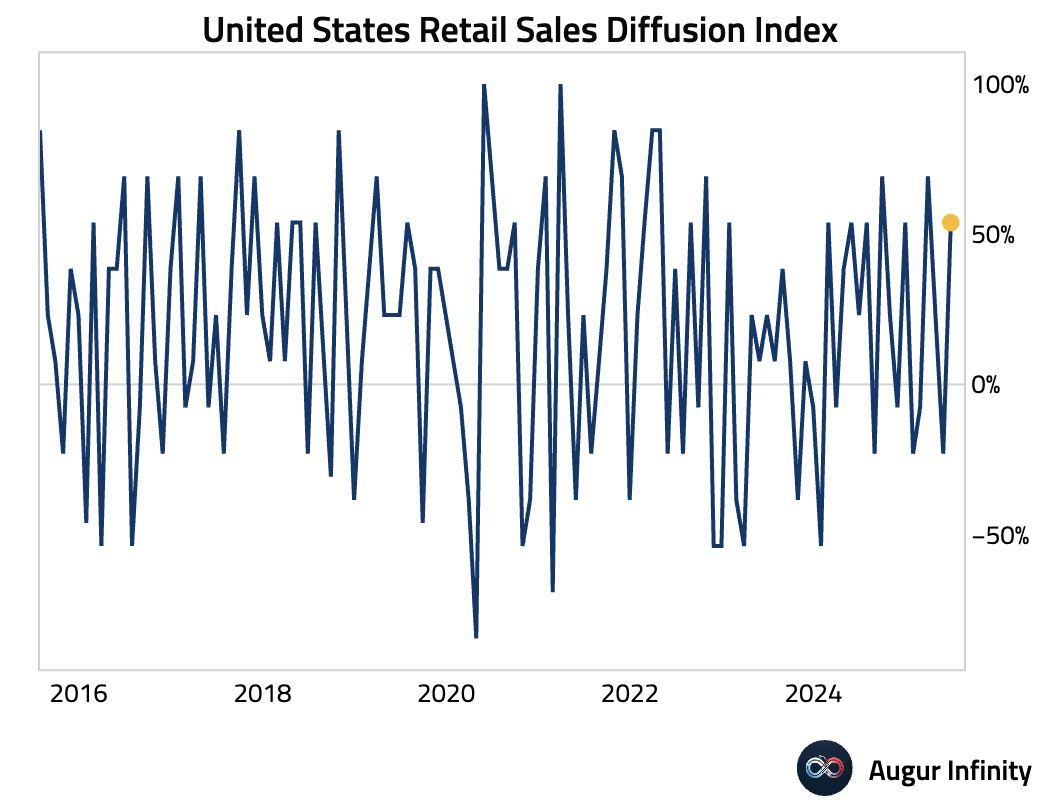
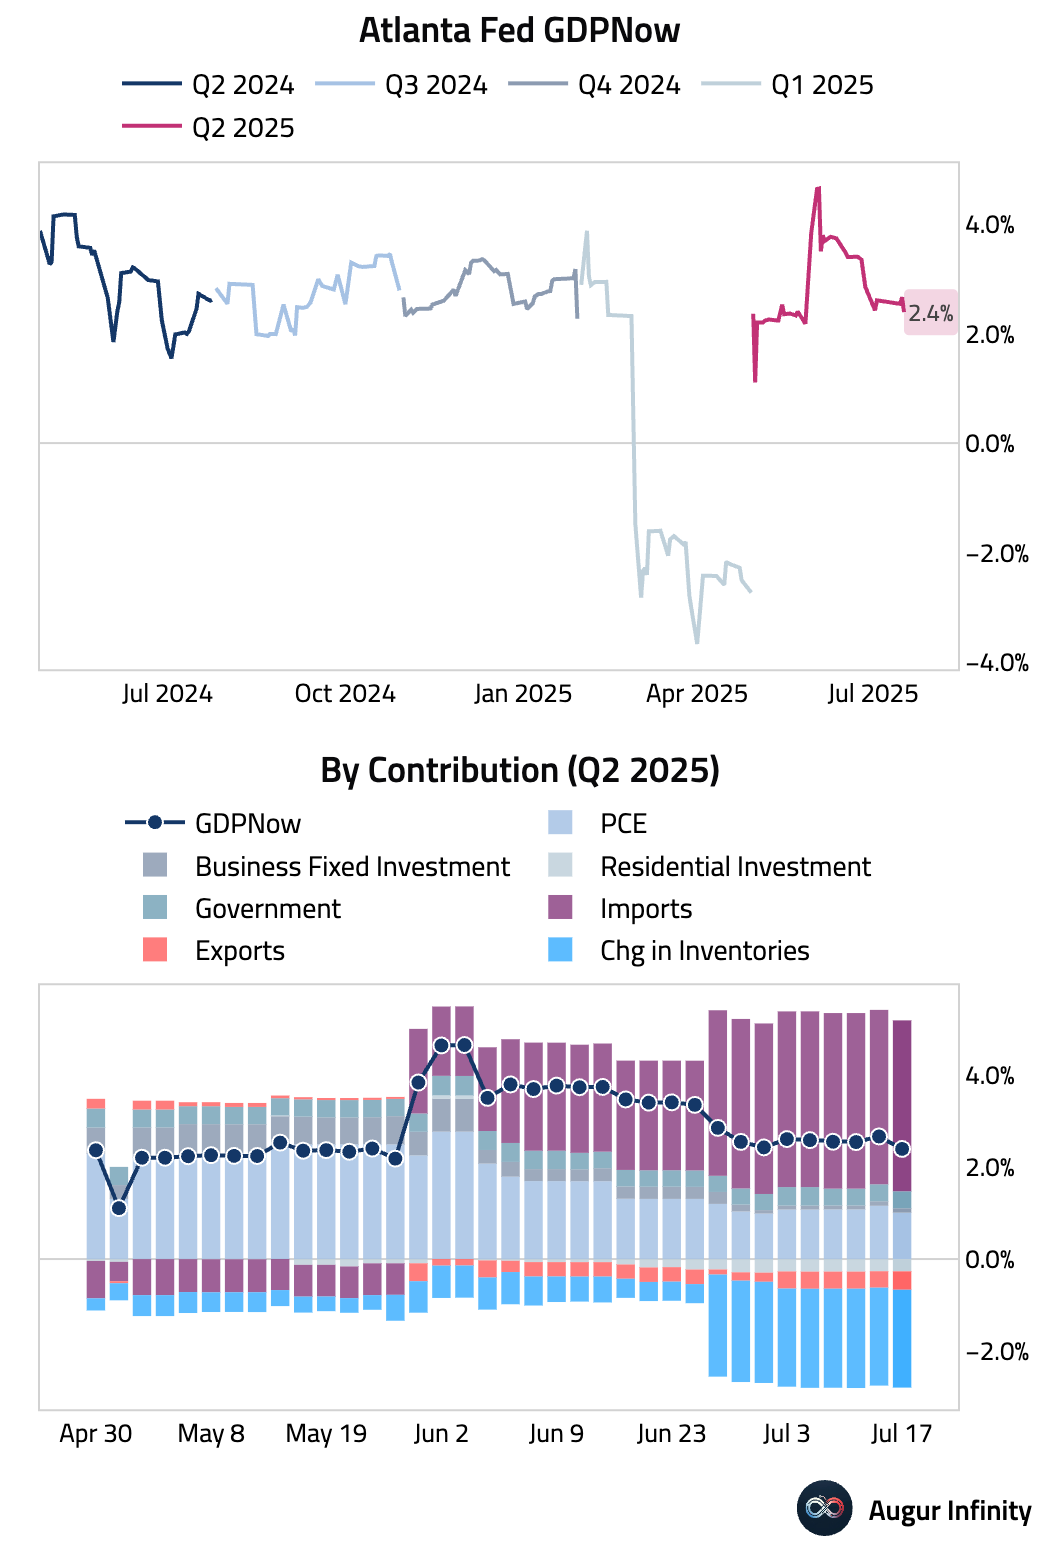
- US retail sales rebounded strongly in June, rising 0.6% M/M, significantly outpacing the 0.1% consensus and reversing May's downwardly revised -0.9% reading. The month-over-month strength was broad-based, with most kinds of businesses registering positive growth, particularly miscellaneous store retailers, motor vehicles, and clothing. The core “control group” used for GDP calculations also beat expectations, rising 0.5% M/M. Despite the headline strength, downward revisions to prior months led to lower Q2 GDP tracking estimates. Real core retail sales show a 3-month annualized decline of 0.9%, suggesting underlying consumer weakness.
- The Atlanta Fed's GDPNow model is now tracking Q2 GDP at 2.4%, down from 2.6% on July 9.
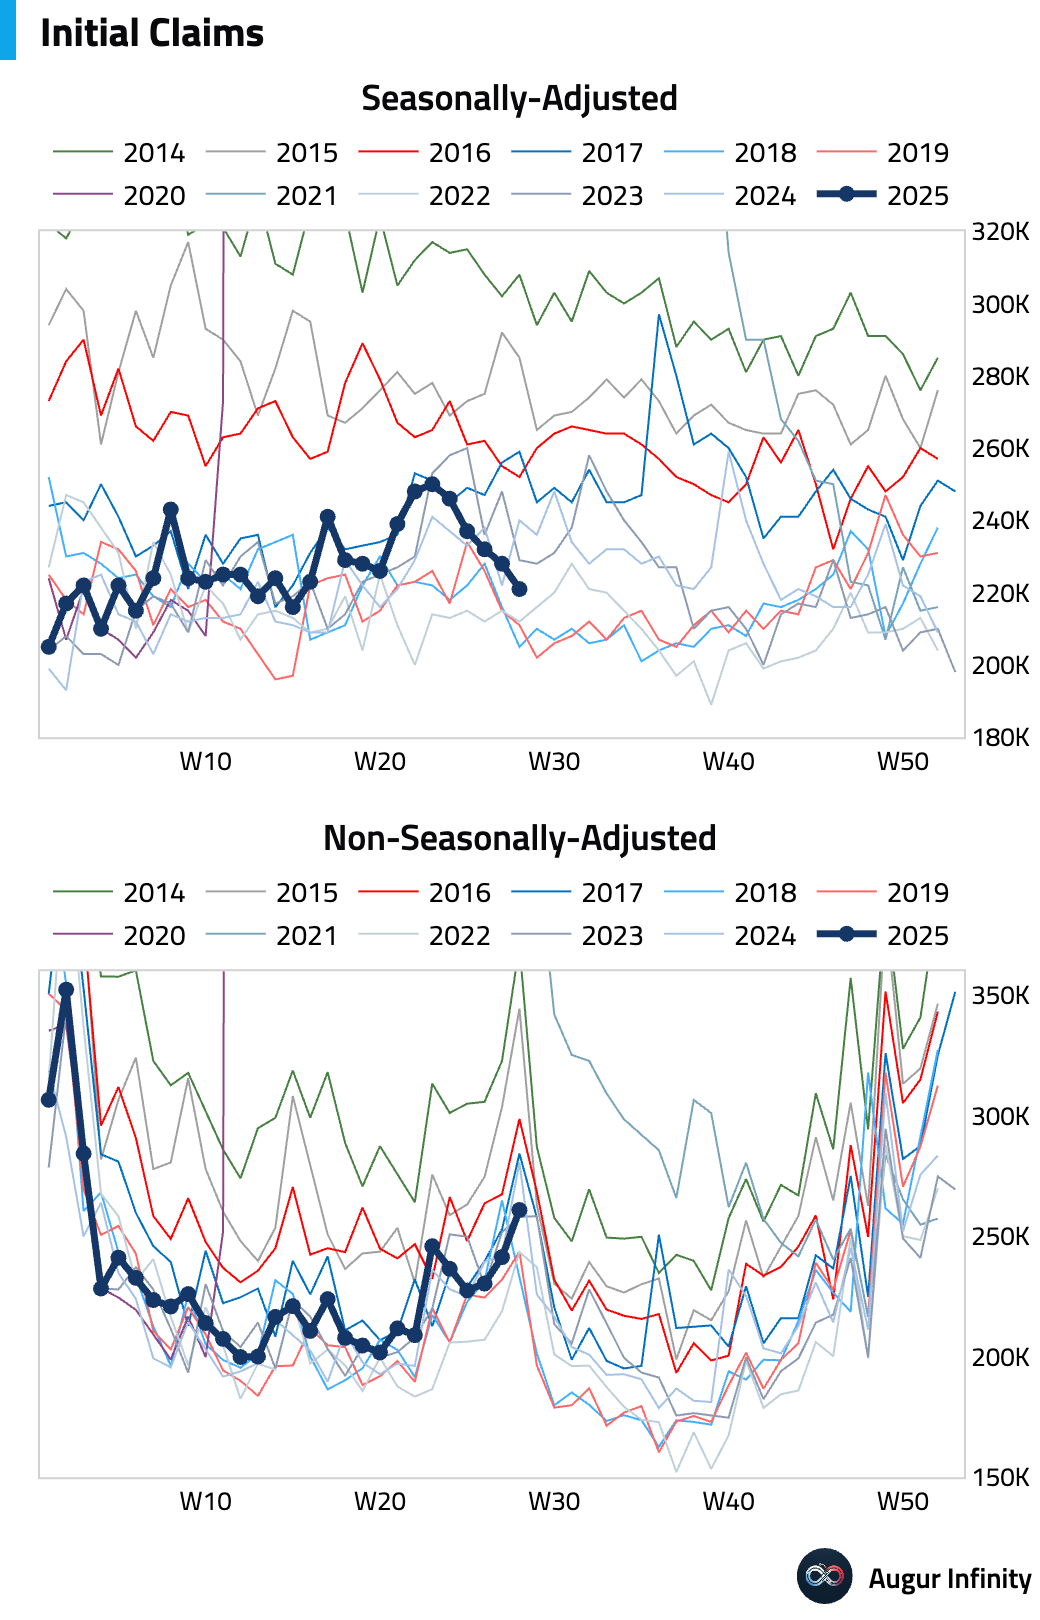
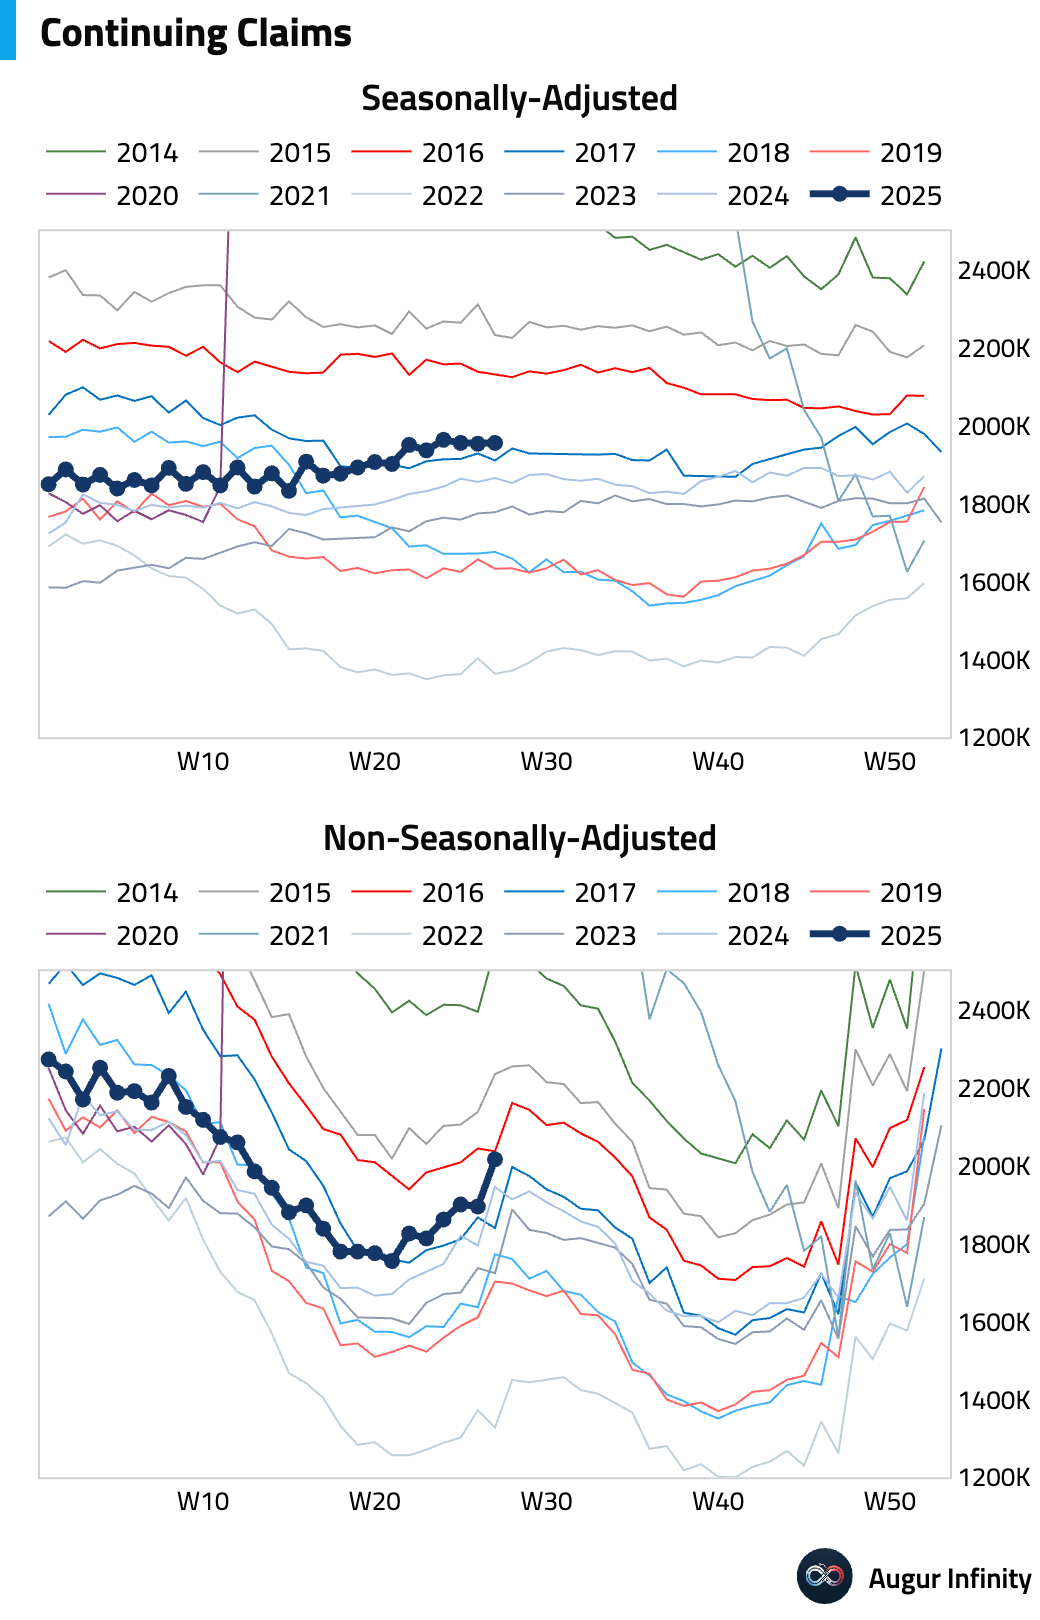
- Initial jobless claims for the week ended July 12 fell more than expected to 221,000, below the 235,000 forecast and the prior week's 228,000. The four-week moving average also declined to 229,500. Continuing claims for the week ended July 5 edged up slightly to 1.956 million but remained below consensus. The data points to continued resilience and tightness in the labor market, countering narratives of a rapid cooling.
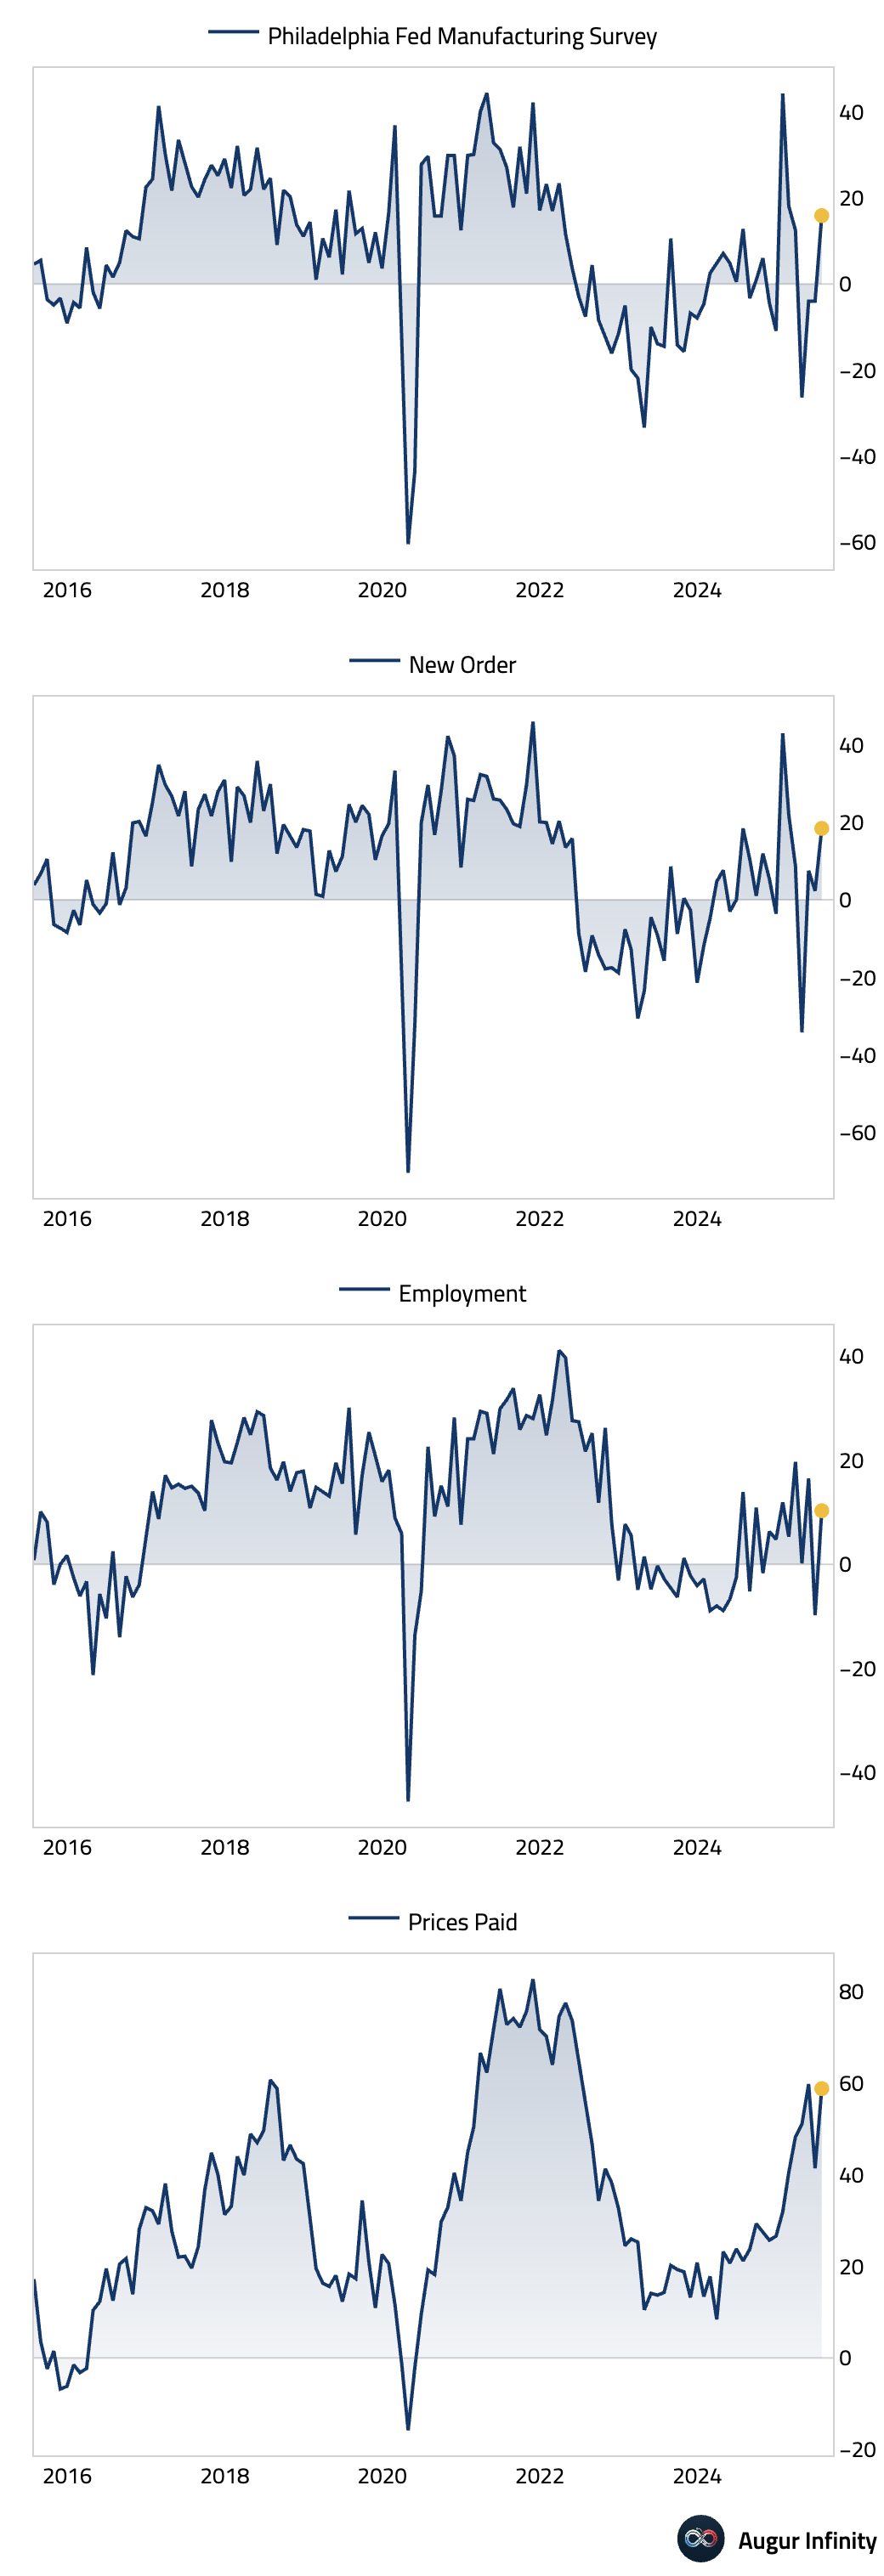
- The Philadelphia Fed Manufacturing Index surged to 15.9 in July, crushing expectations for a -1.0 reading and rebounding sharply from -4.0 in June. The report showed broad-based strength, with large increases in the new orders (18.4 vs. 2.3 prior), shipments (23.7 vs. 11.2 prior), and employment (10.3 vs. -9.8 prior) sub-components, suggesting a potential re-acceleration in regional manufacturing activity. The Prices Paid index also surged to 58.8 from 41.4.
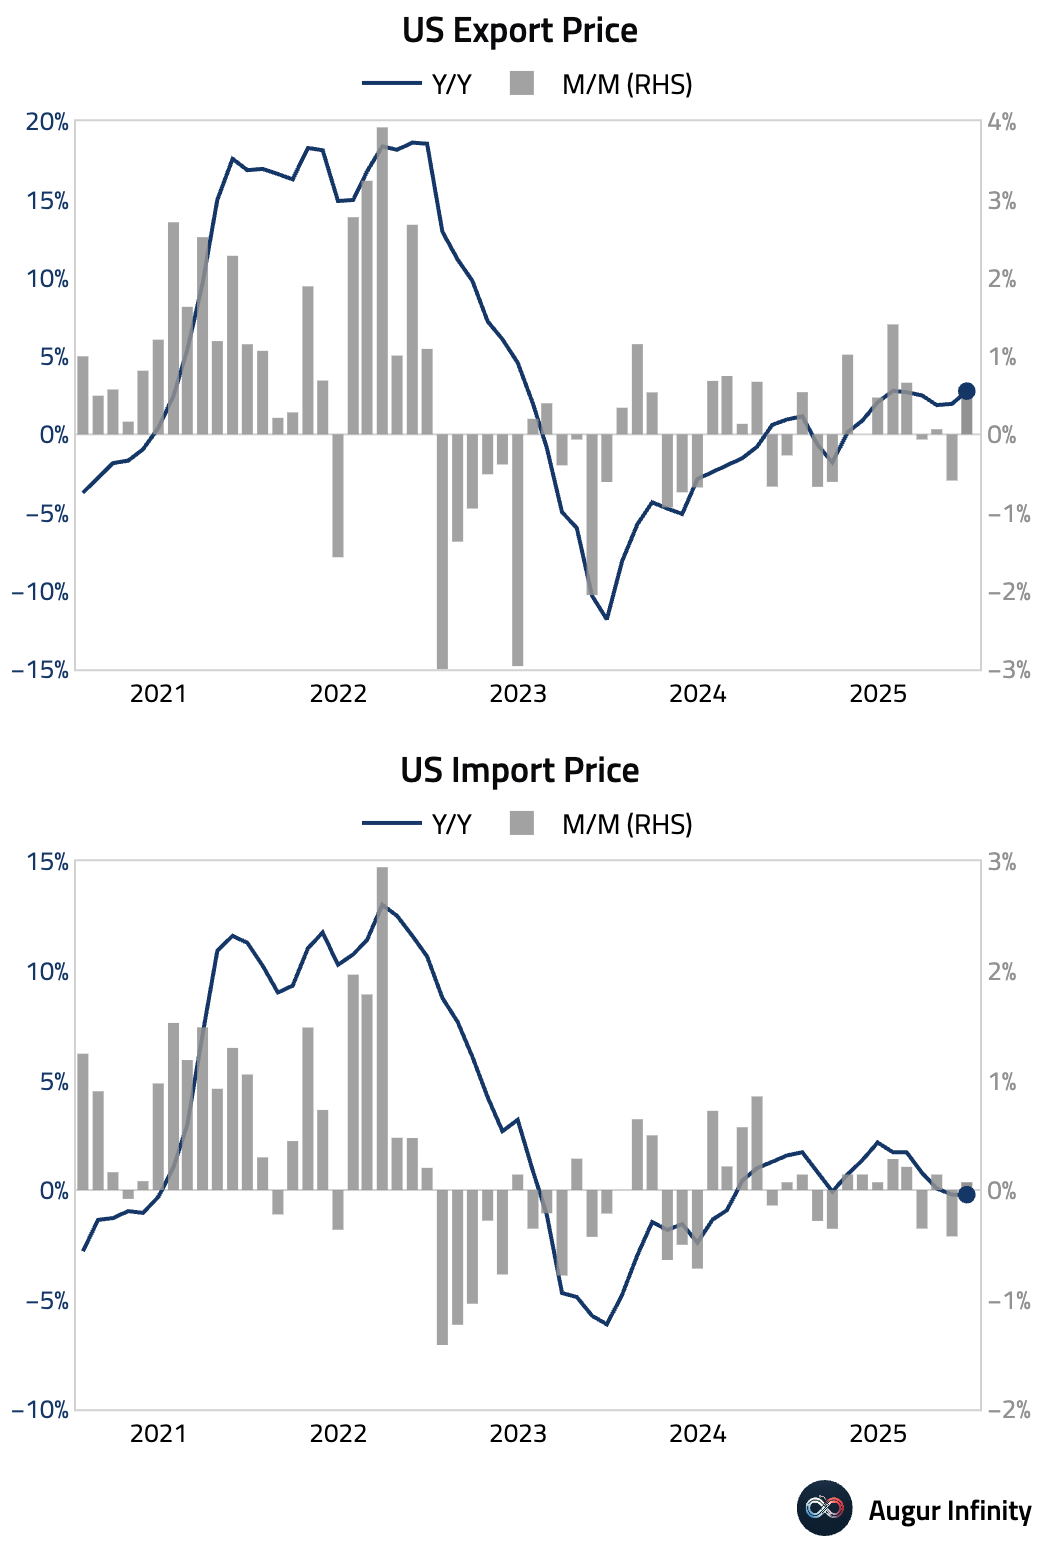
- Import prices were softer than expected in June, rising just 0.1% M/M against a 0.3% forecast, with the ex-petroleum component flat. A 2.2% drop in international airfares contributed to the miss, prompting a downward revision in some core PCE inflation forecasts. Year-over-year, import prices were down 0.2%. Export prices rose 0.5% M/M, pushing the annual rate up to 2.8%, the highest since January 2025.
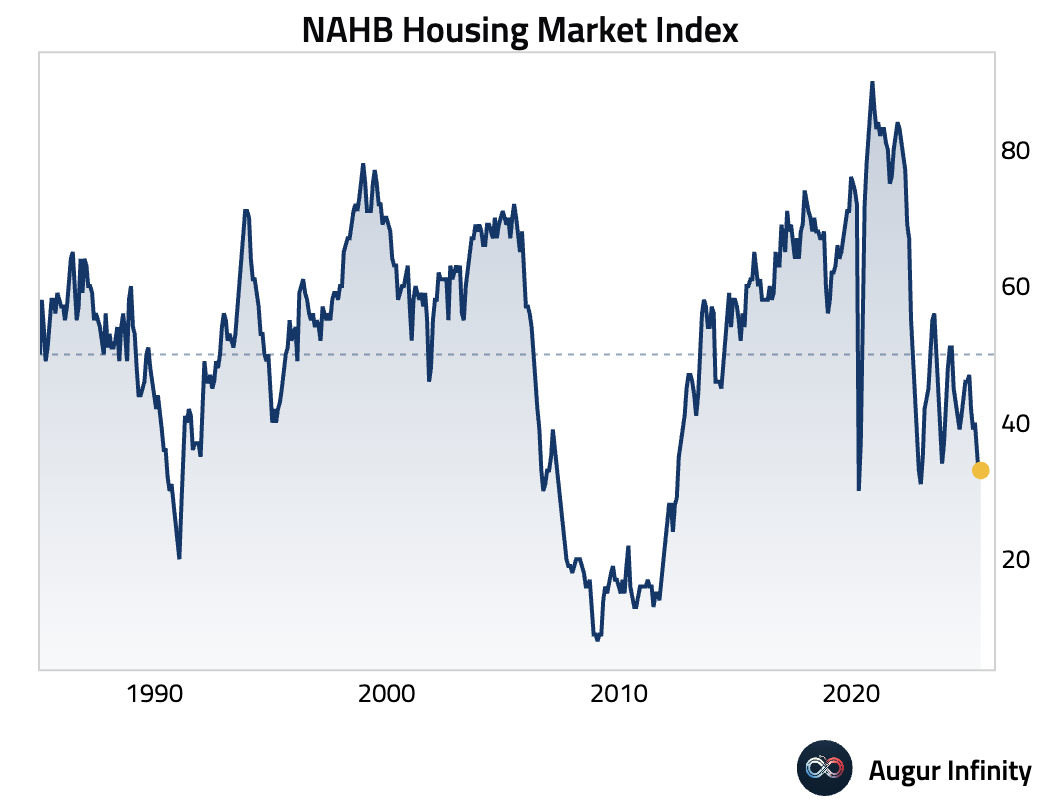
- The NAHB Housing Market Index for July rose to 33 from 32 in June, matching consensus estimates and indicating a slight improvement in homebuilder sentiment.
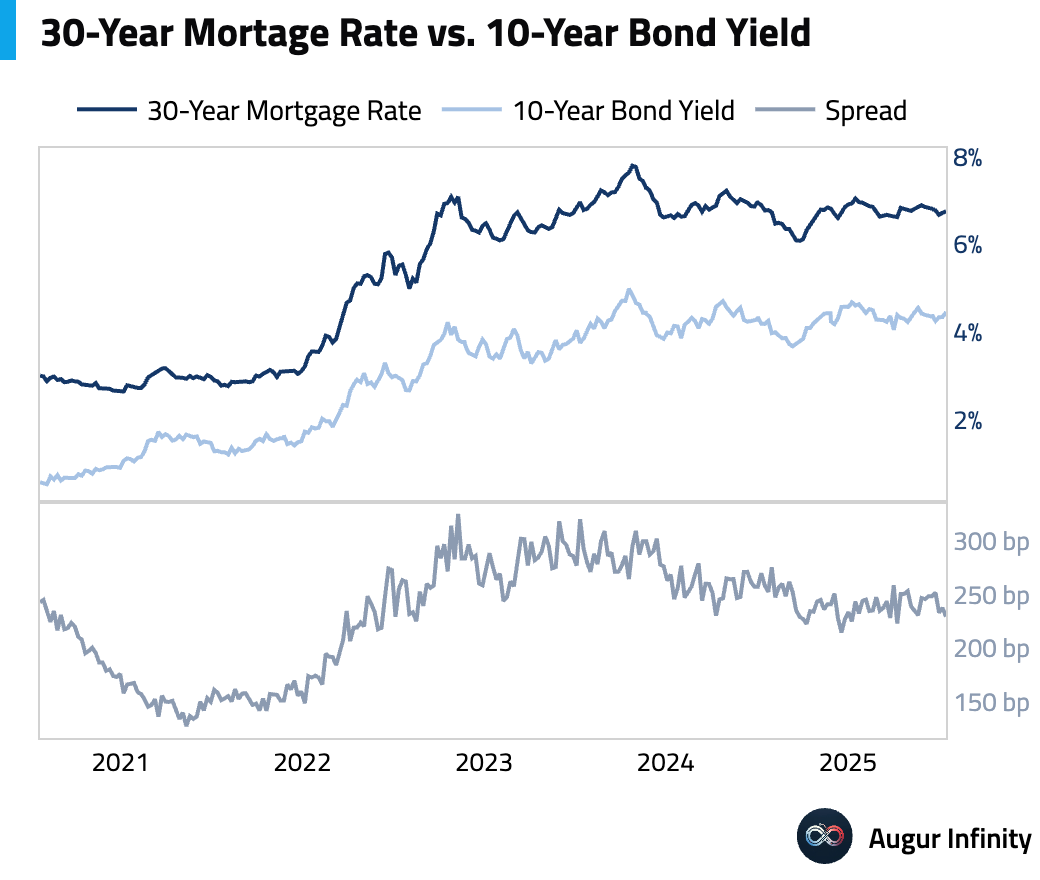
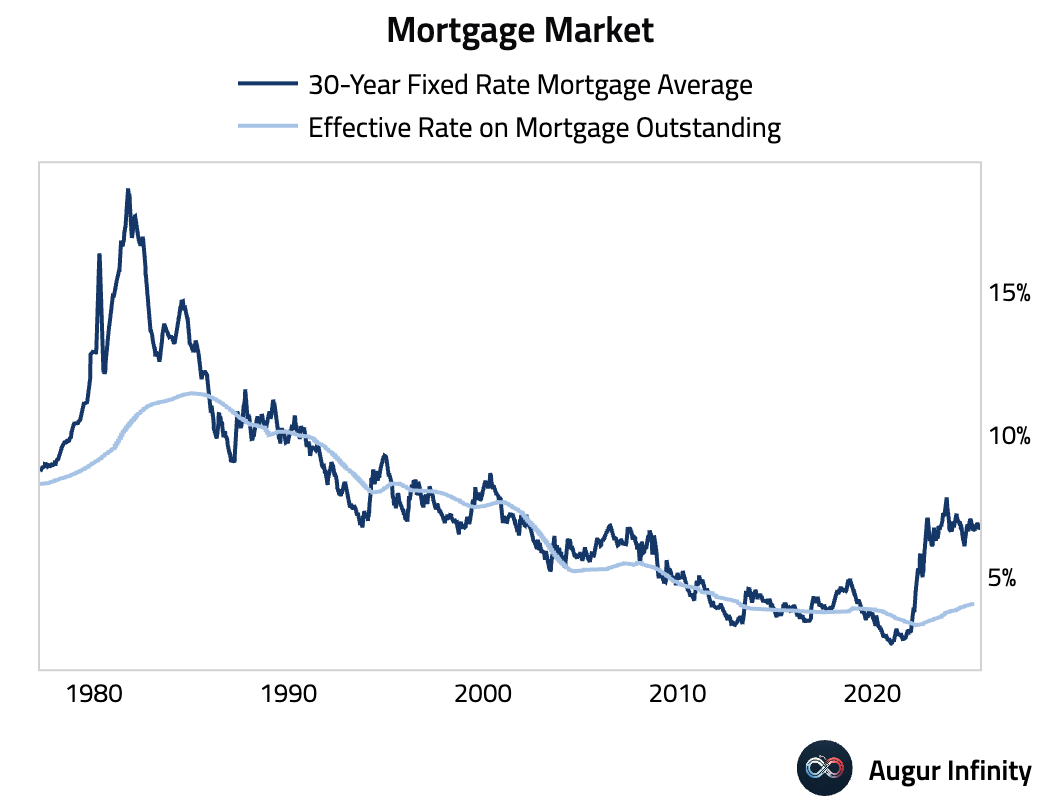
- Average mortgage rates rose for the week, with the 30-year fixed rate at 6.75% and the 15-year at 5.92%.
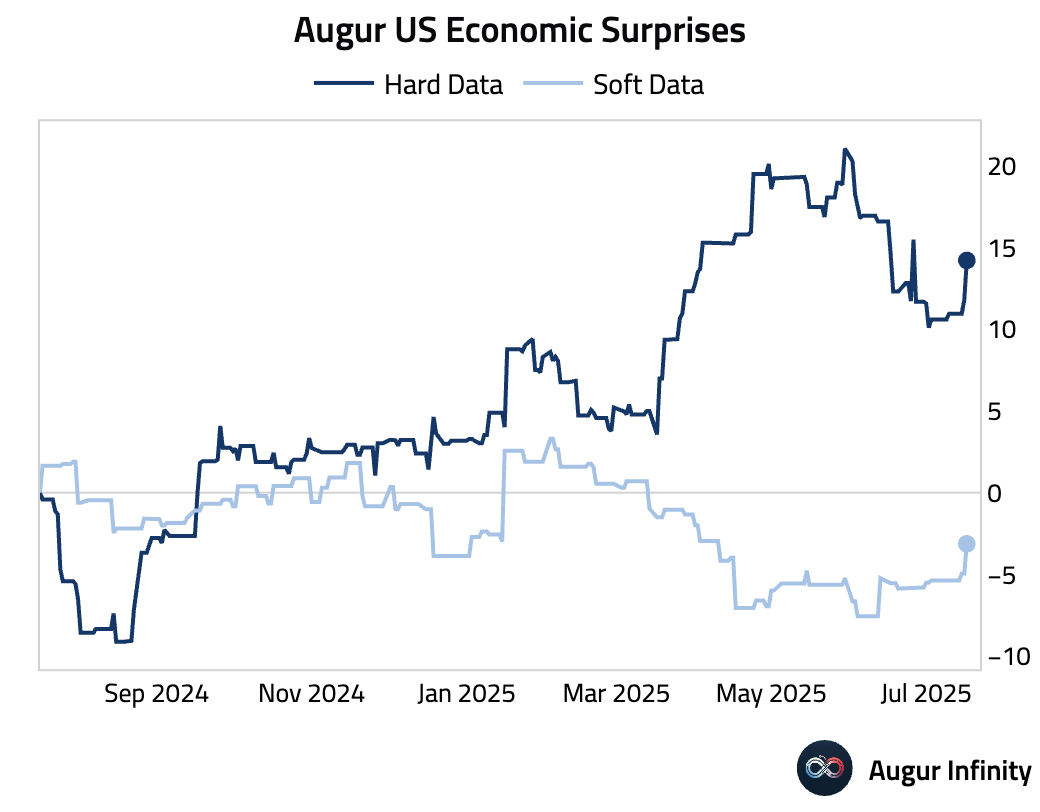
- Both hard data and soft data have surprised to the upside in the US so far this month.
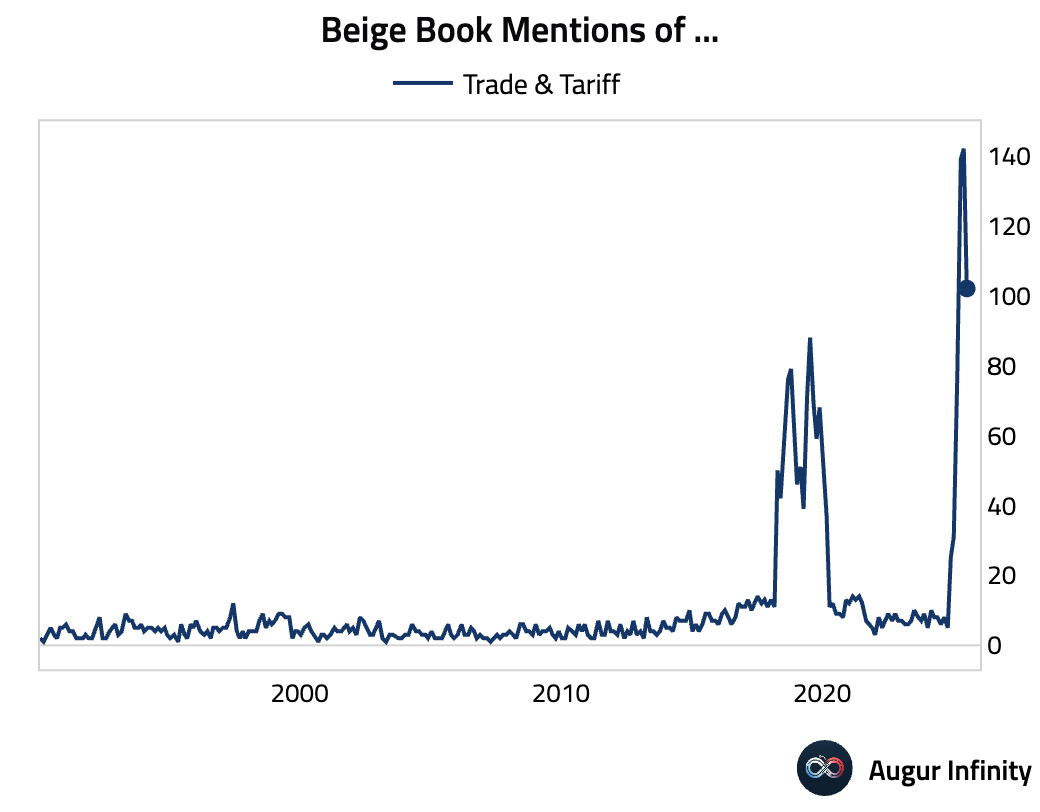
- Mentions of trade and tariff in the Beige Book declined in July, but remain very elevated relative to history.
Canada
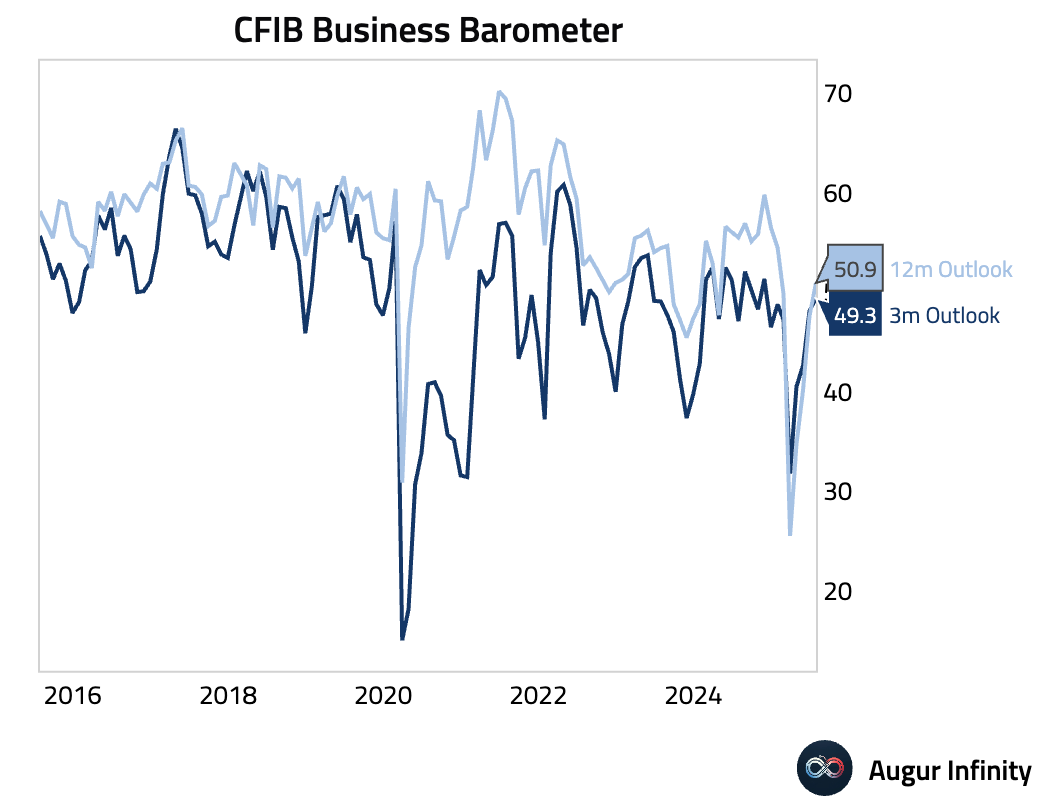
- Canada's CFIB Business Barometer rose to 50.9 in July from 47.5 in June, rebounding into expansionary territory and indicating an improvement in small business sentiment.
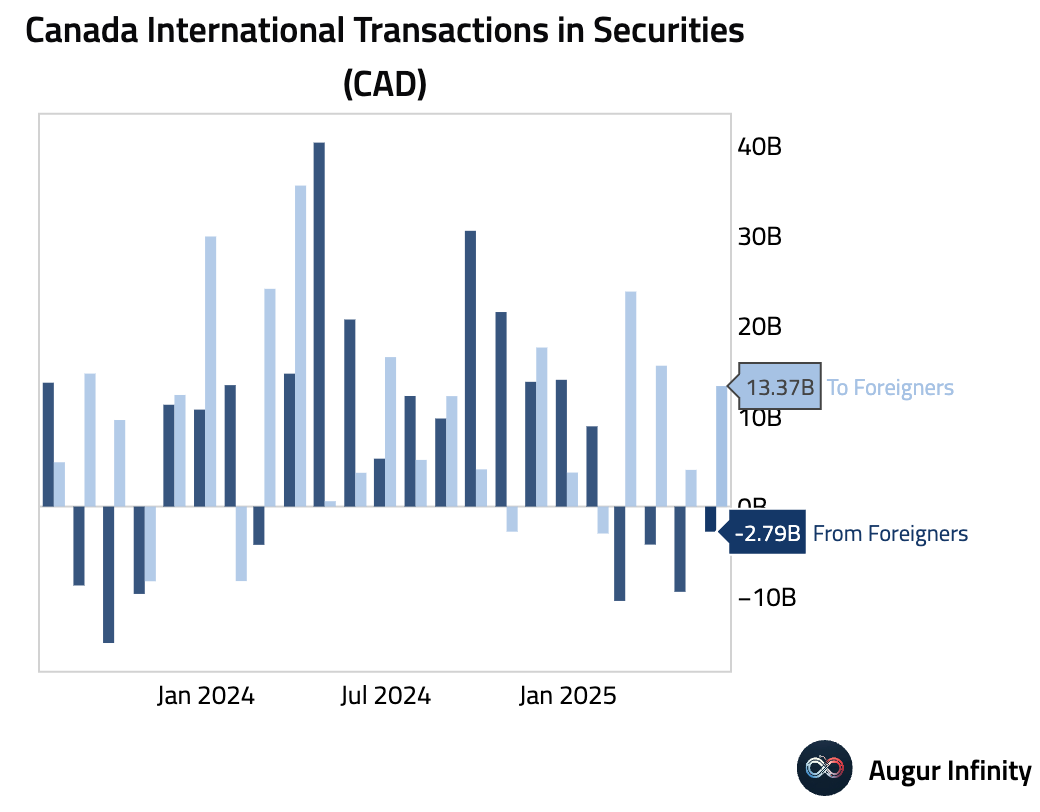
- In May, foreign net selling of Canadian securities moderated to C$2.79 billion, significantly less than the C$9.46 billion sold in April. Meanwhile, Canadian investment in foreign securities increased to C$13.37 billion from C$4.07 billion.
Europe
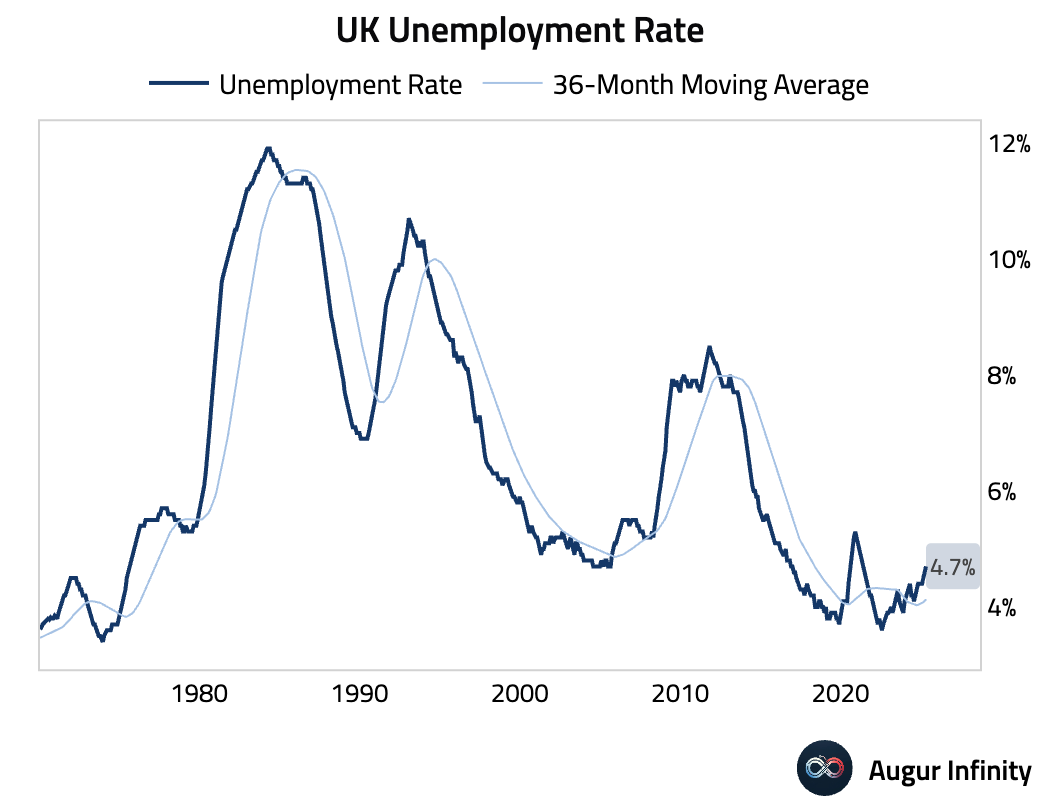
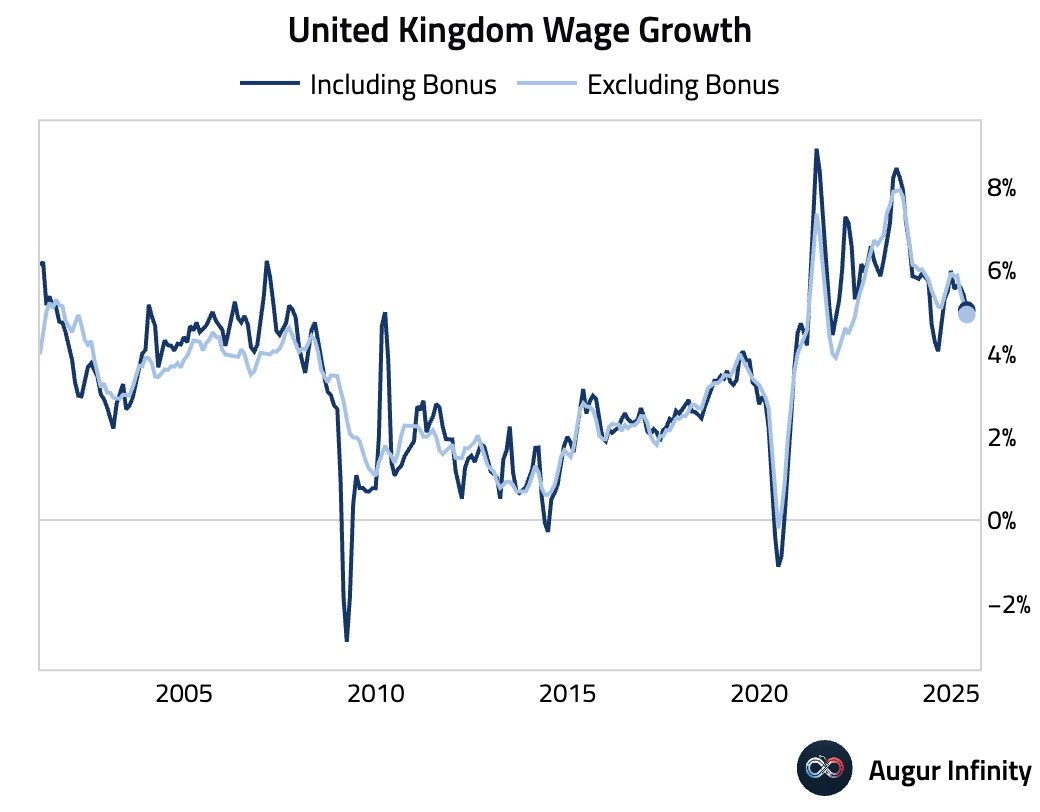
- The UK unemployment rate for the three months to May rose to 4.7%, higher than the 4.6% consensus and the highest reading since April 2021. This dovish signal of labor market loosening was tempered by firmer-than-expected wage growth. Whole economy regular pay grew 5.0% (3m/yoy), beating the 4.9% forecast, while private sector pay growth also surprised to the upside at 4.88%. Despite decelerating, the wage data remains firm.
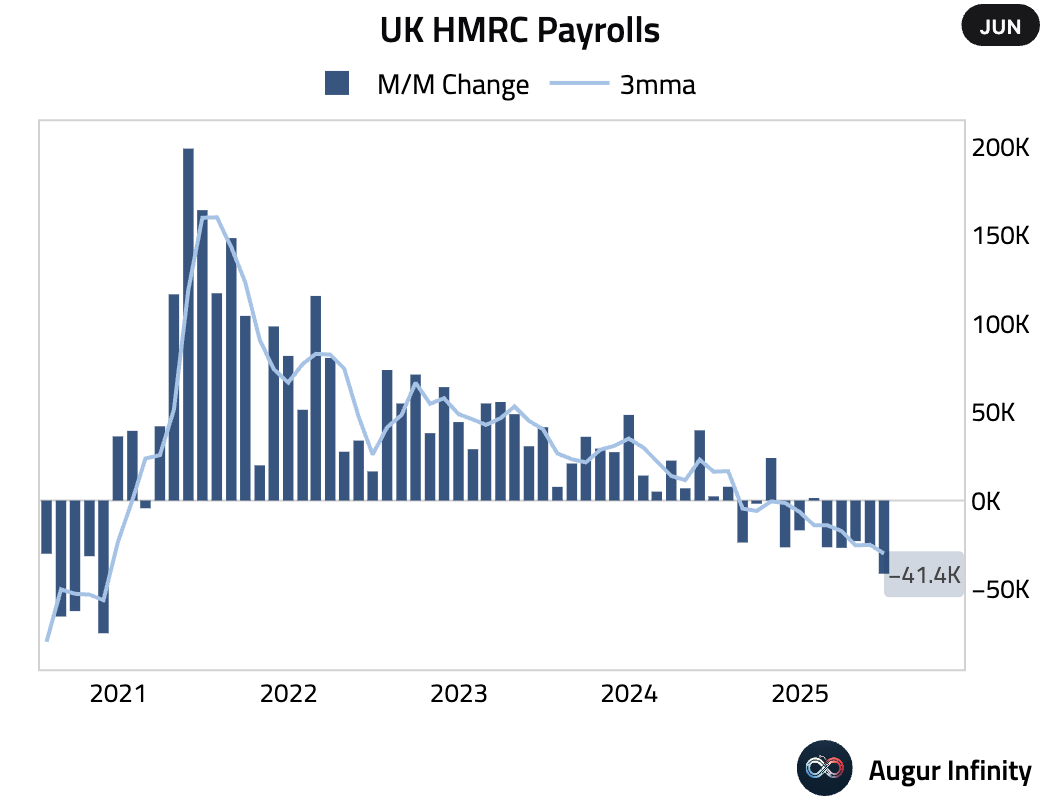
- UK HMRC Payrolls fell by 41,000 in June, a larger decline than May's revised -25,000 and the weakest reading since November 2020. However, significant upward revisions to prior months mean the overall level of employment is firmer than previously projected, a hawkish surprise despite the weak June headline.
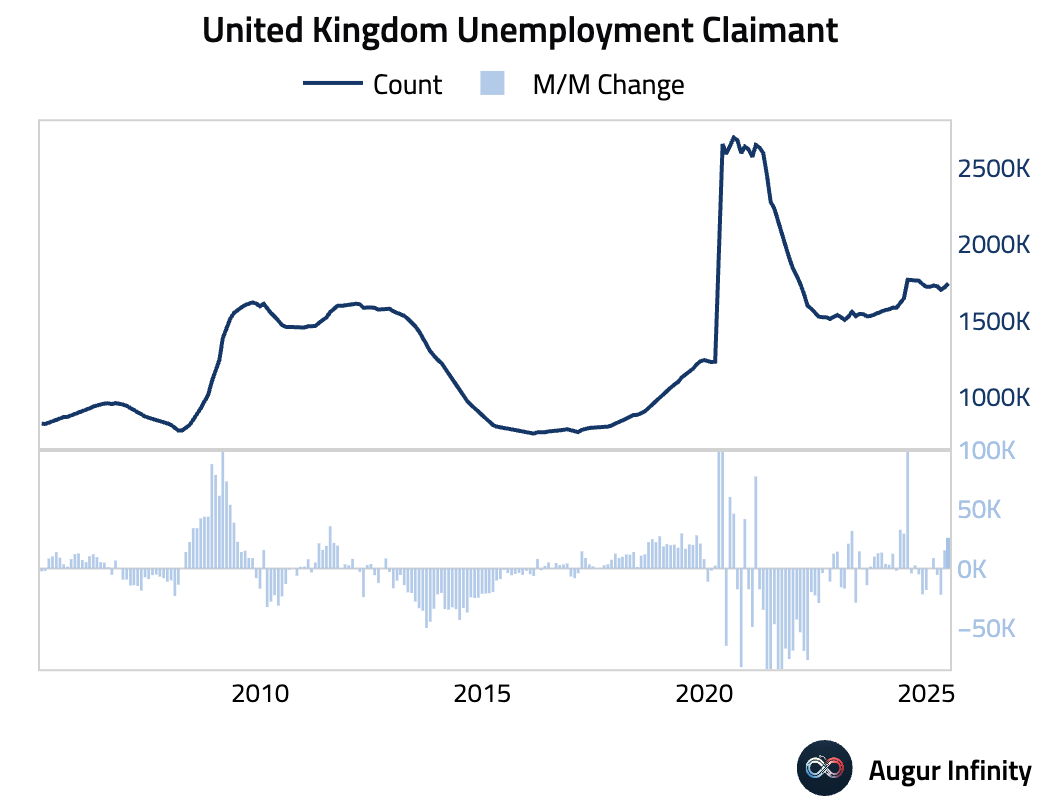
- The UK Claimant Count Change rose by 25,900 in June, above the 17,900 consensus and marking the highest reading since July 2024.
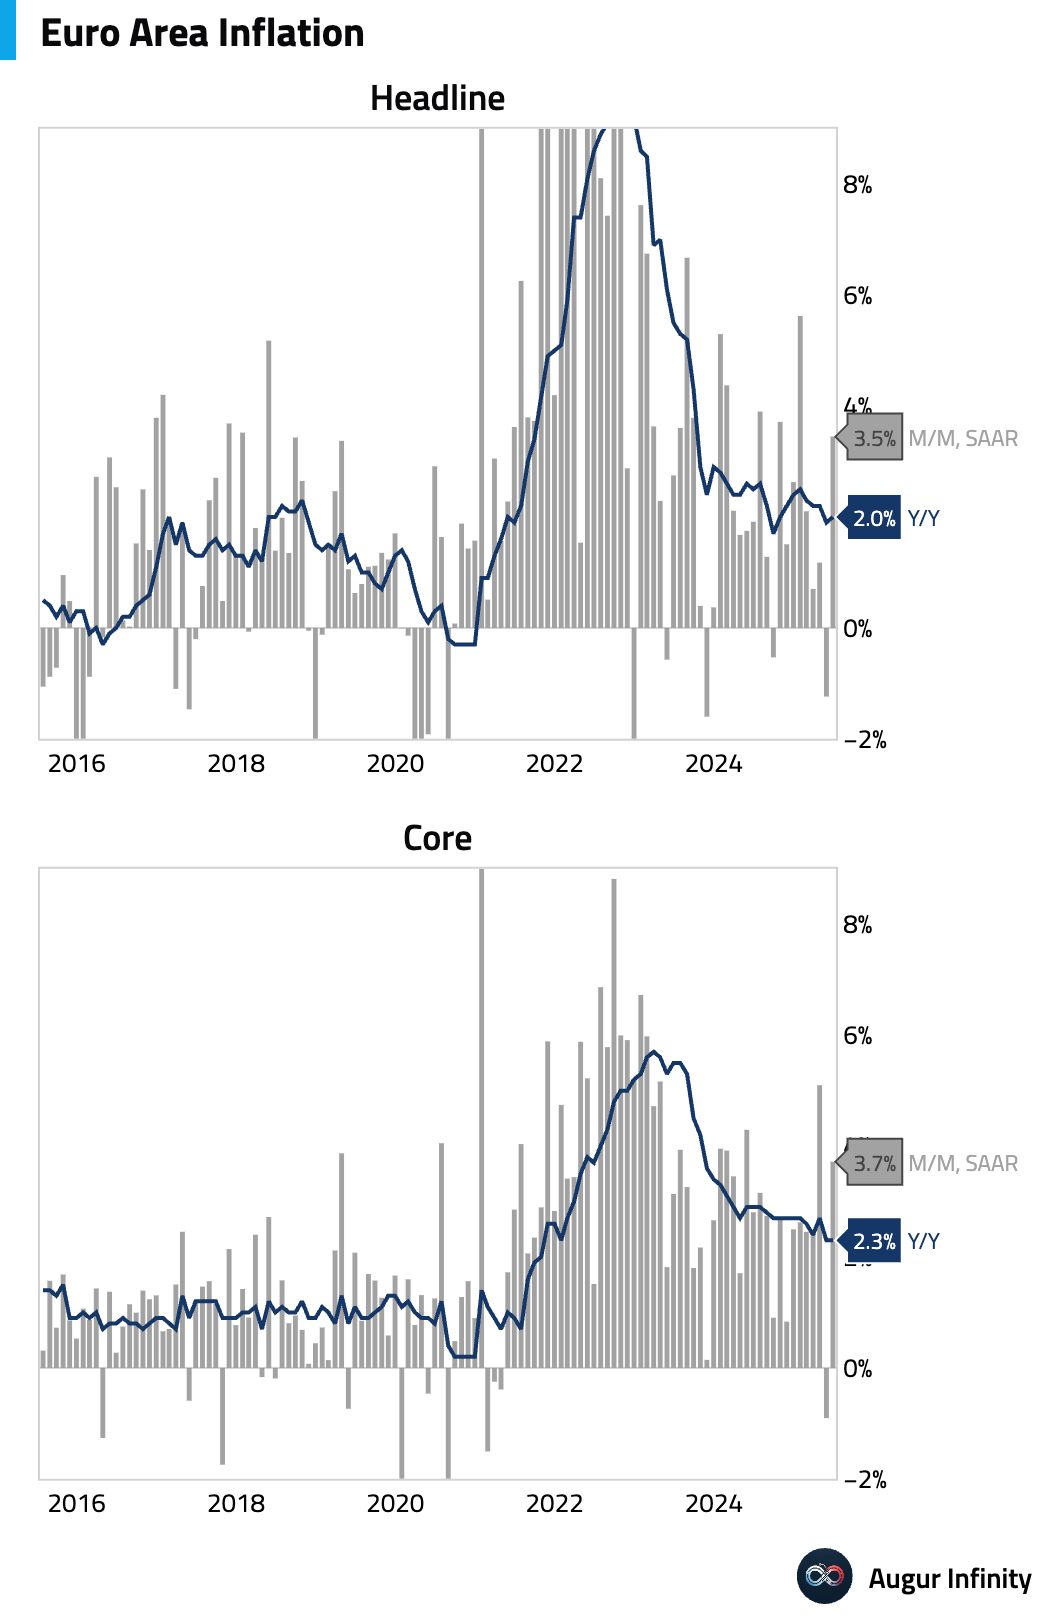
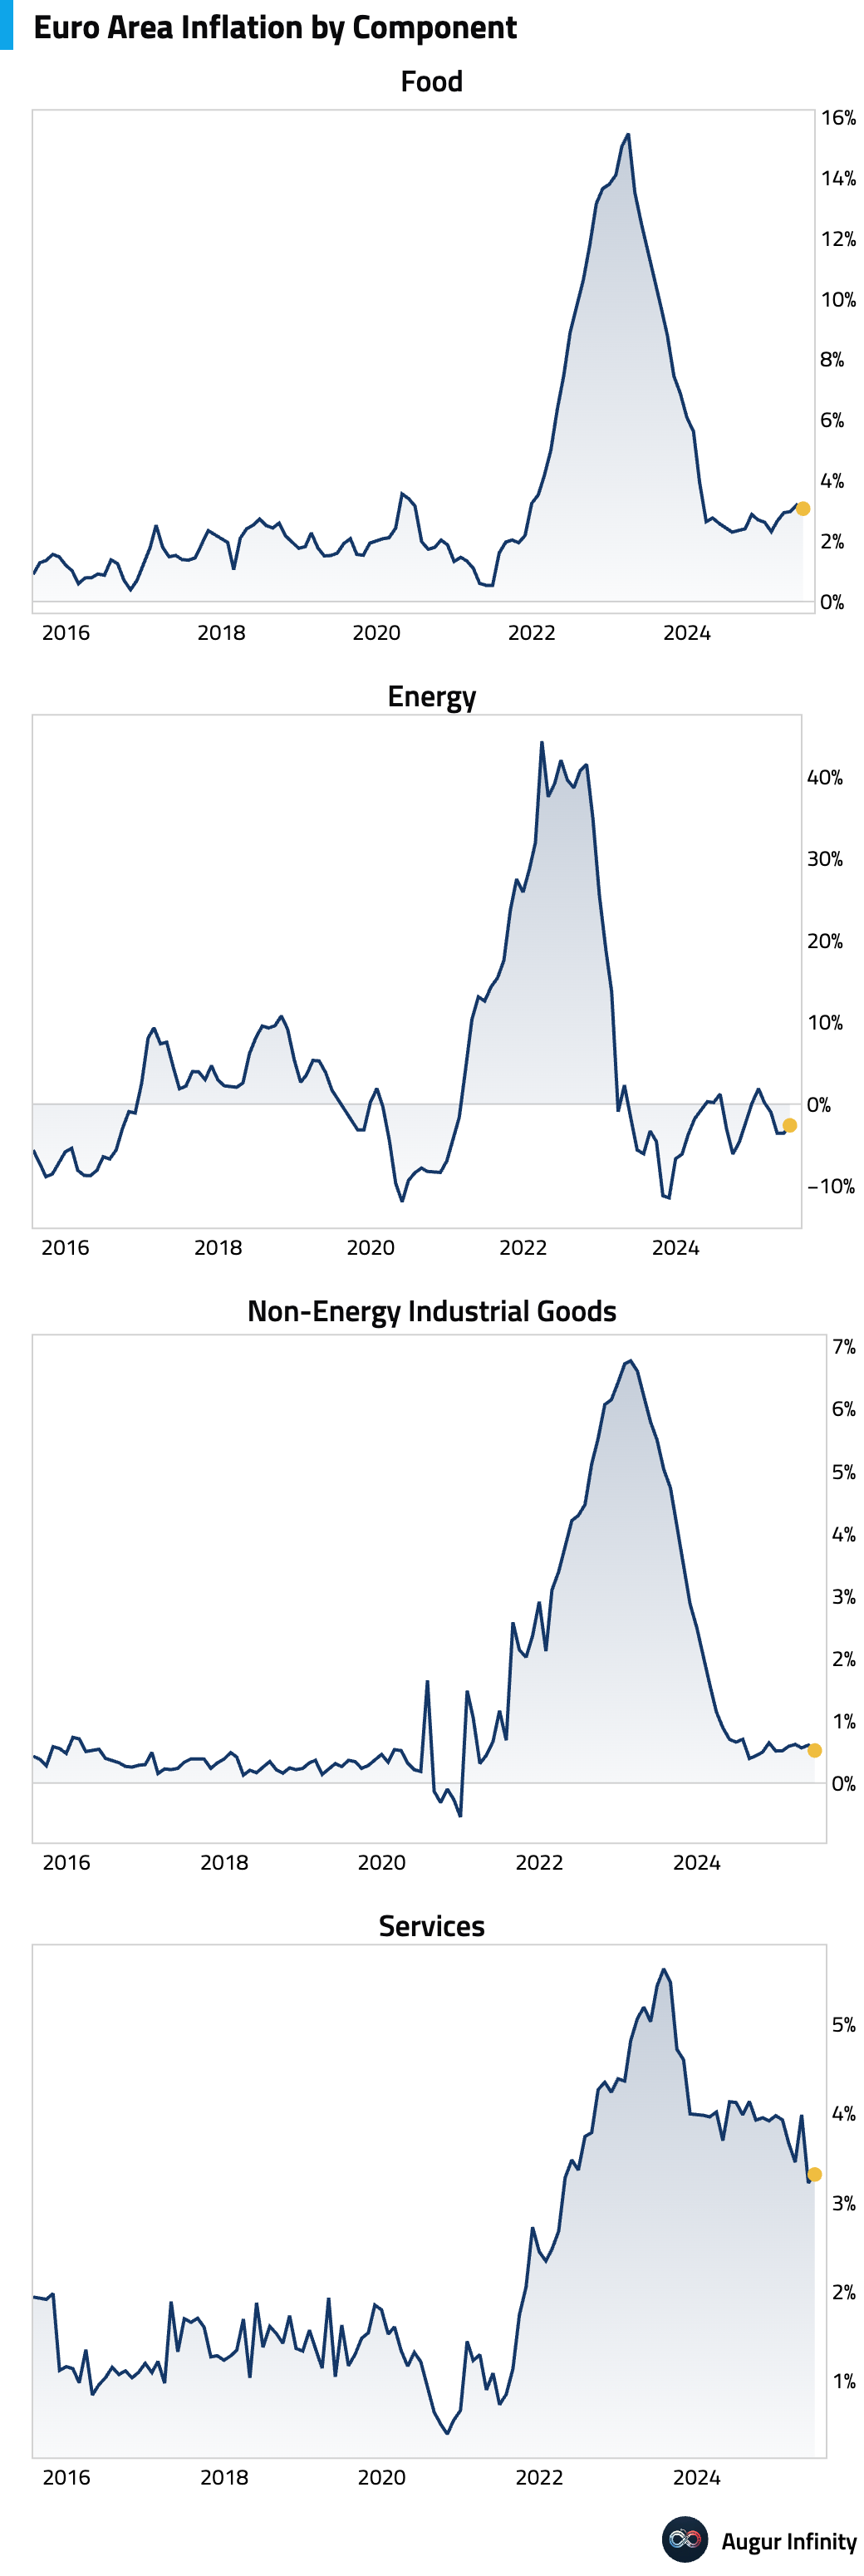
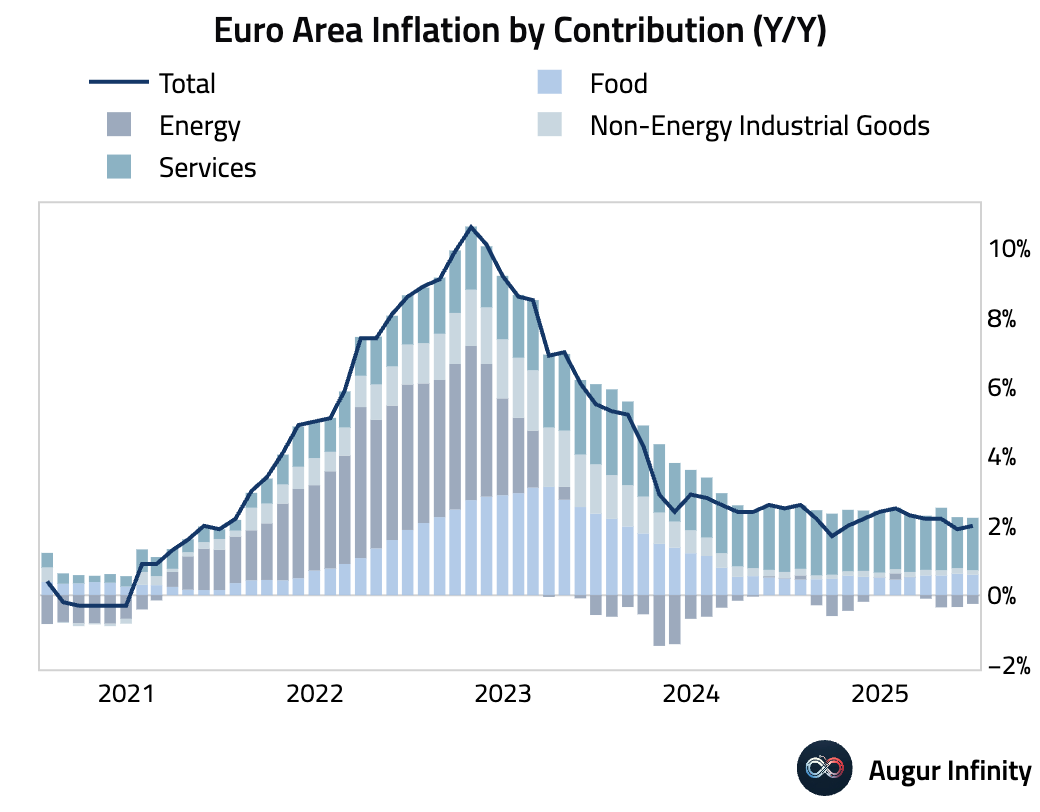
- The final June Eurozone HICP confirmed headline inflation at 2.0% Y/Y, up from 1.9% in May. Core inflation was also confirmed at 2.3% Y/Y, ticking up from the previous month. Both headline and core came in slightly hotter than their flash readings. Services inflation remains the primary driver, contributing 1.51 percentage points to the headline figure, with continued strength in hospitality and housing.
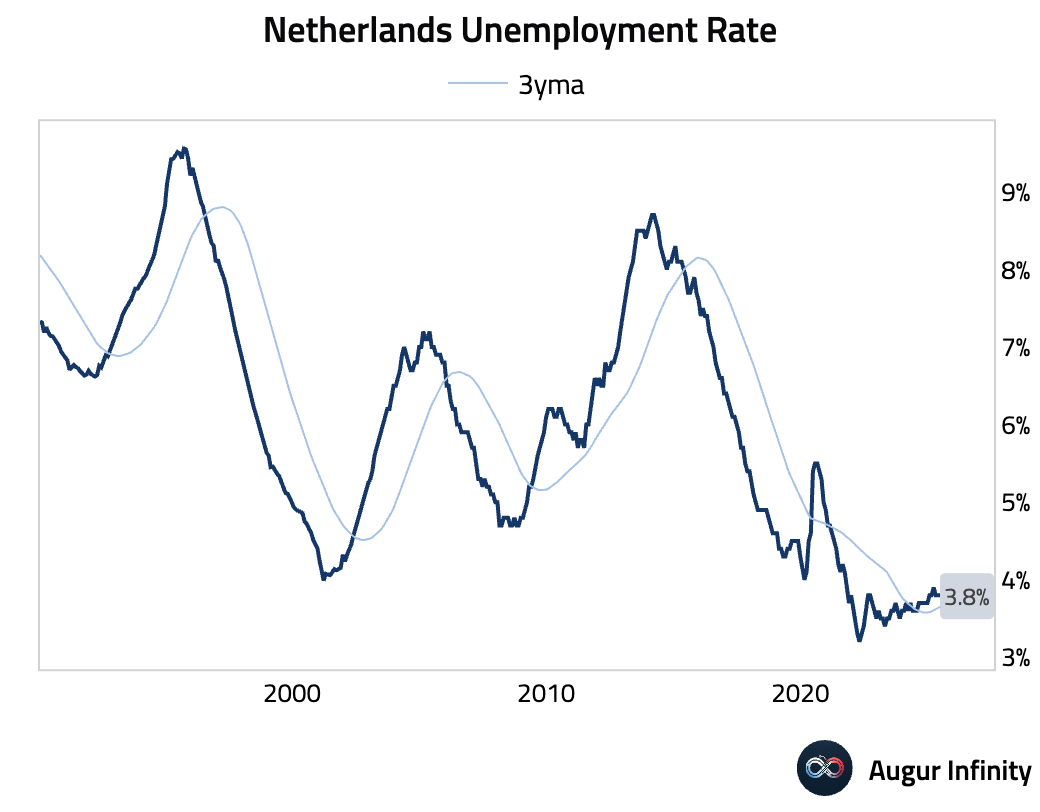
- The Netherlands' unemployment rate held steady at 3.8% in June, unchanged from the previous month.
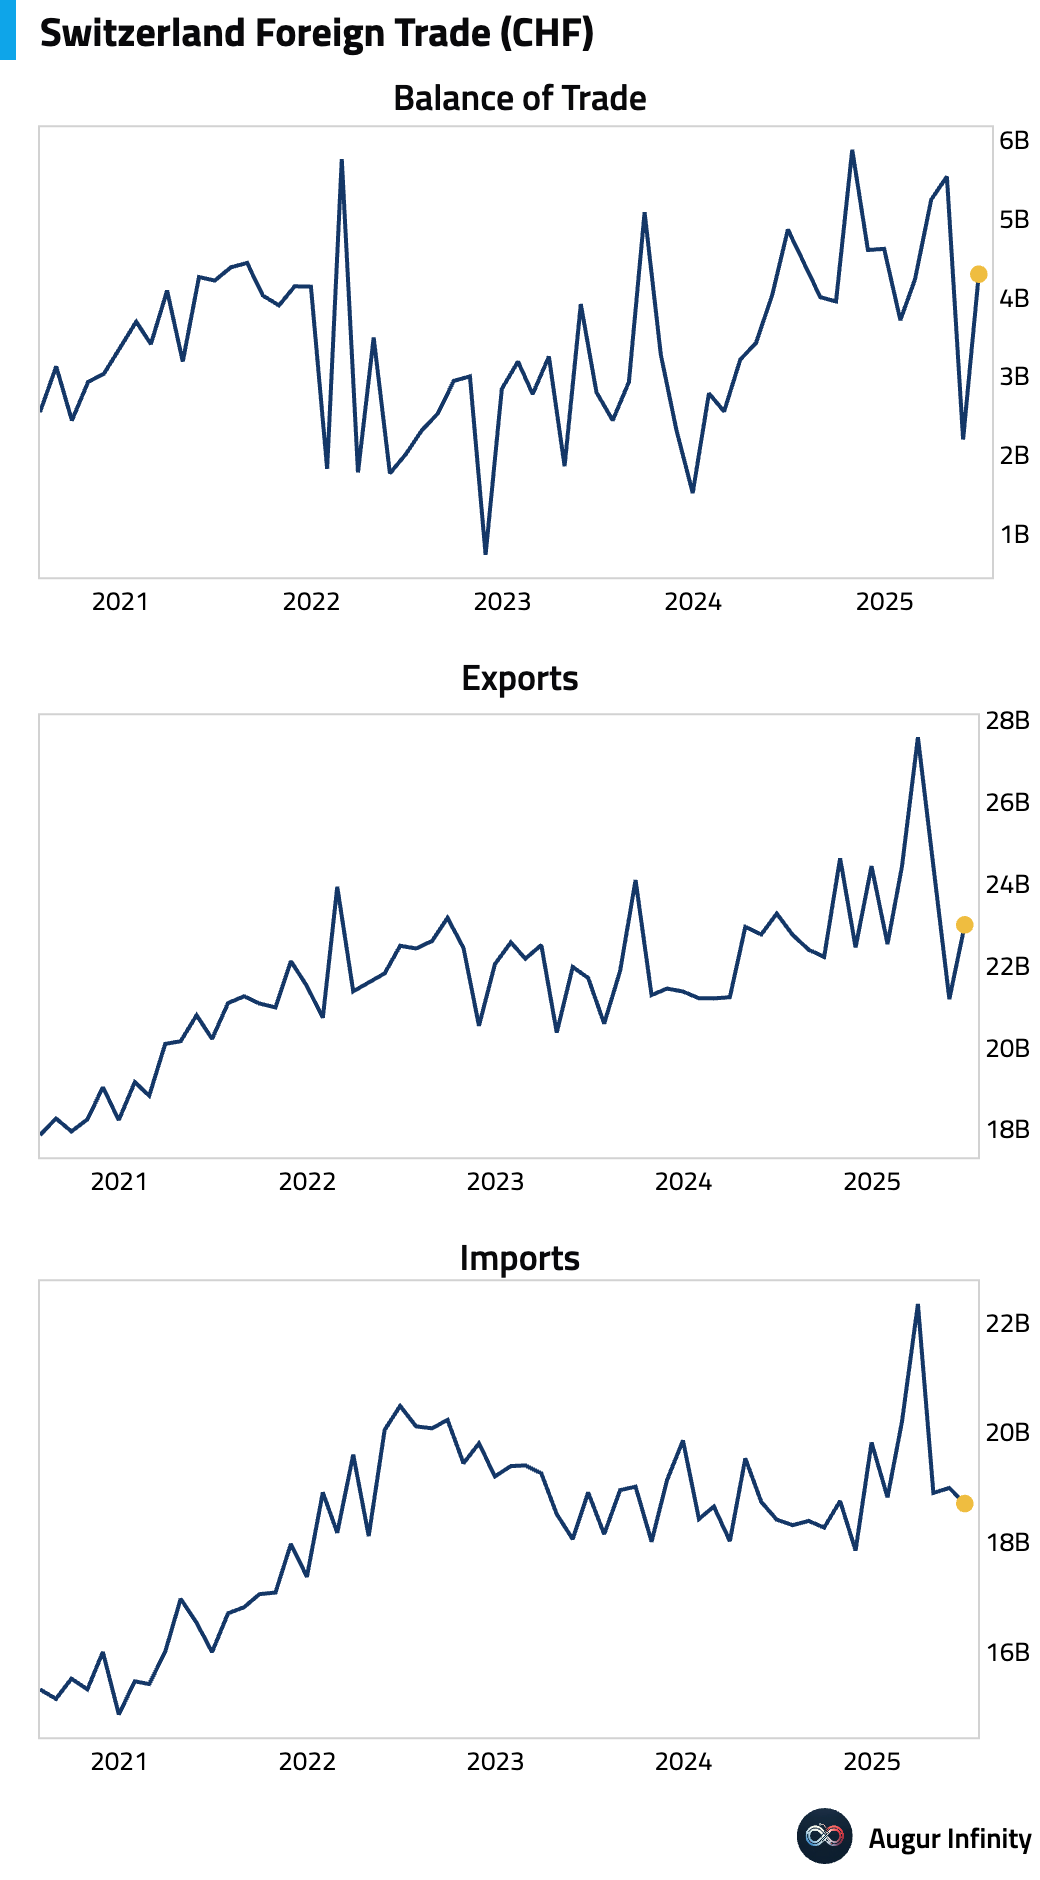
- Switzerland's trade surplus widened to CHF 4.3 billion in June from CHF 2.2 billion in May.
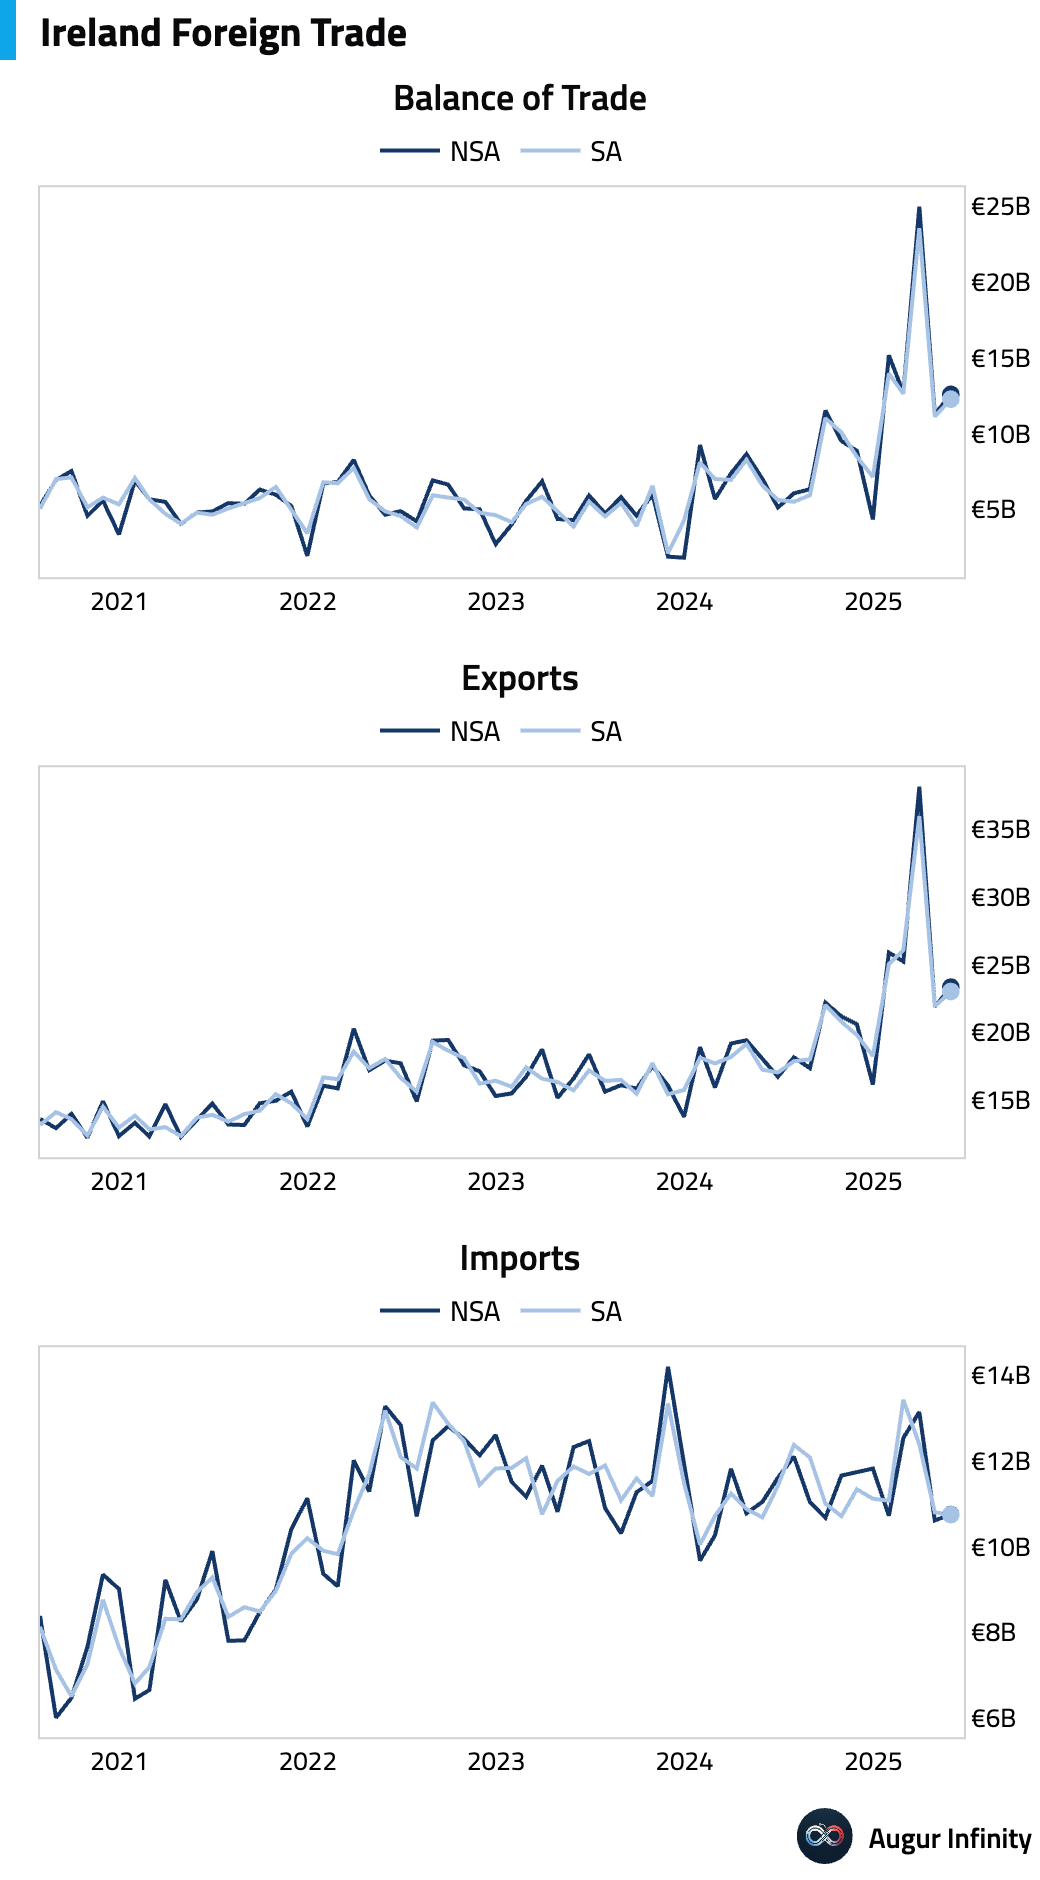
- Ireland's trade surplus increased to €12.6 billion in May from €11.3 billion in April.
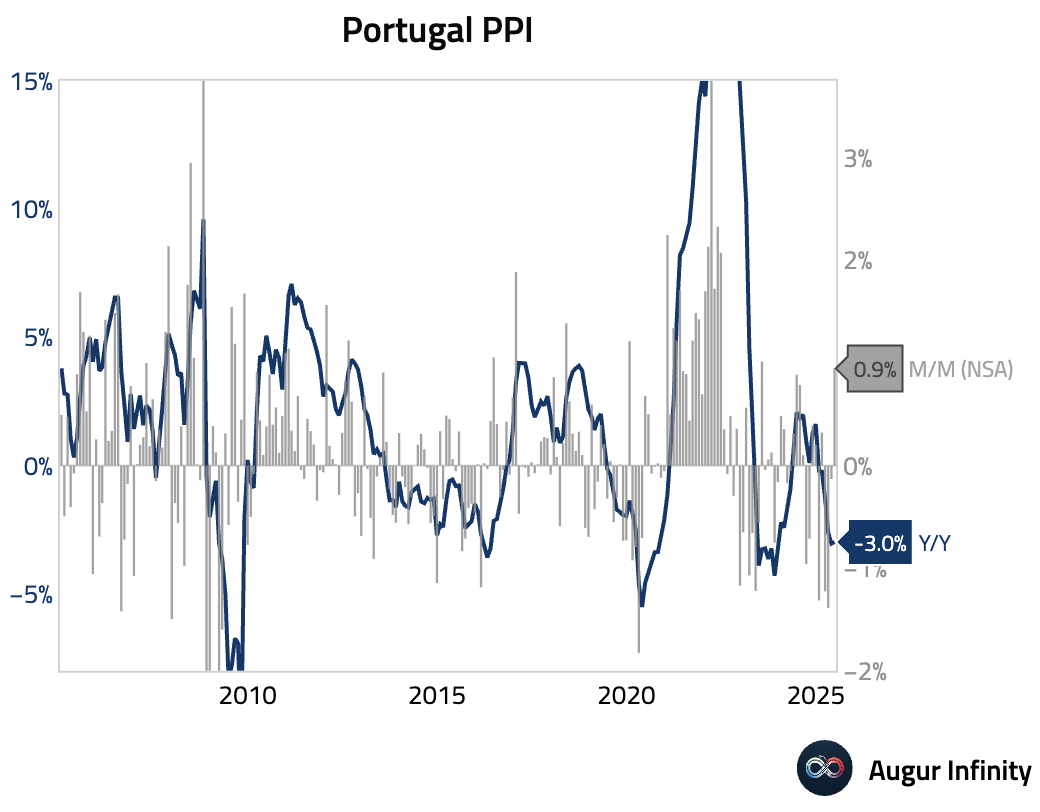
- Portugal's Producer Price Index (PPI) rose 0.9% M/M in June, a sharp acceleration from the -0.1% reading in May. The annual rate held steady at -3.0% Y/Y.
Asia-Pacific
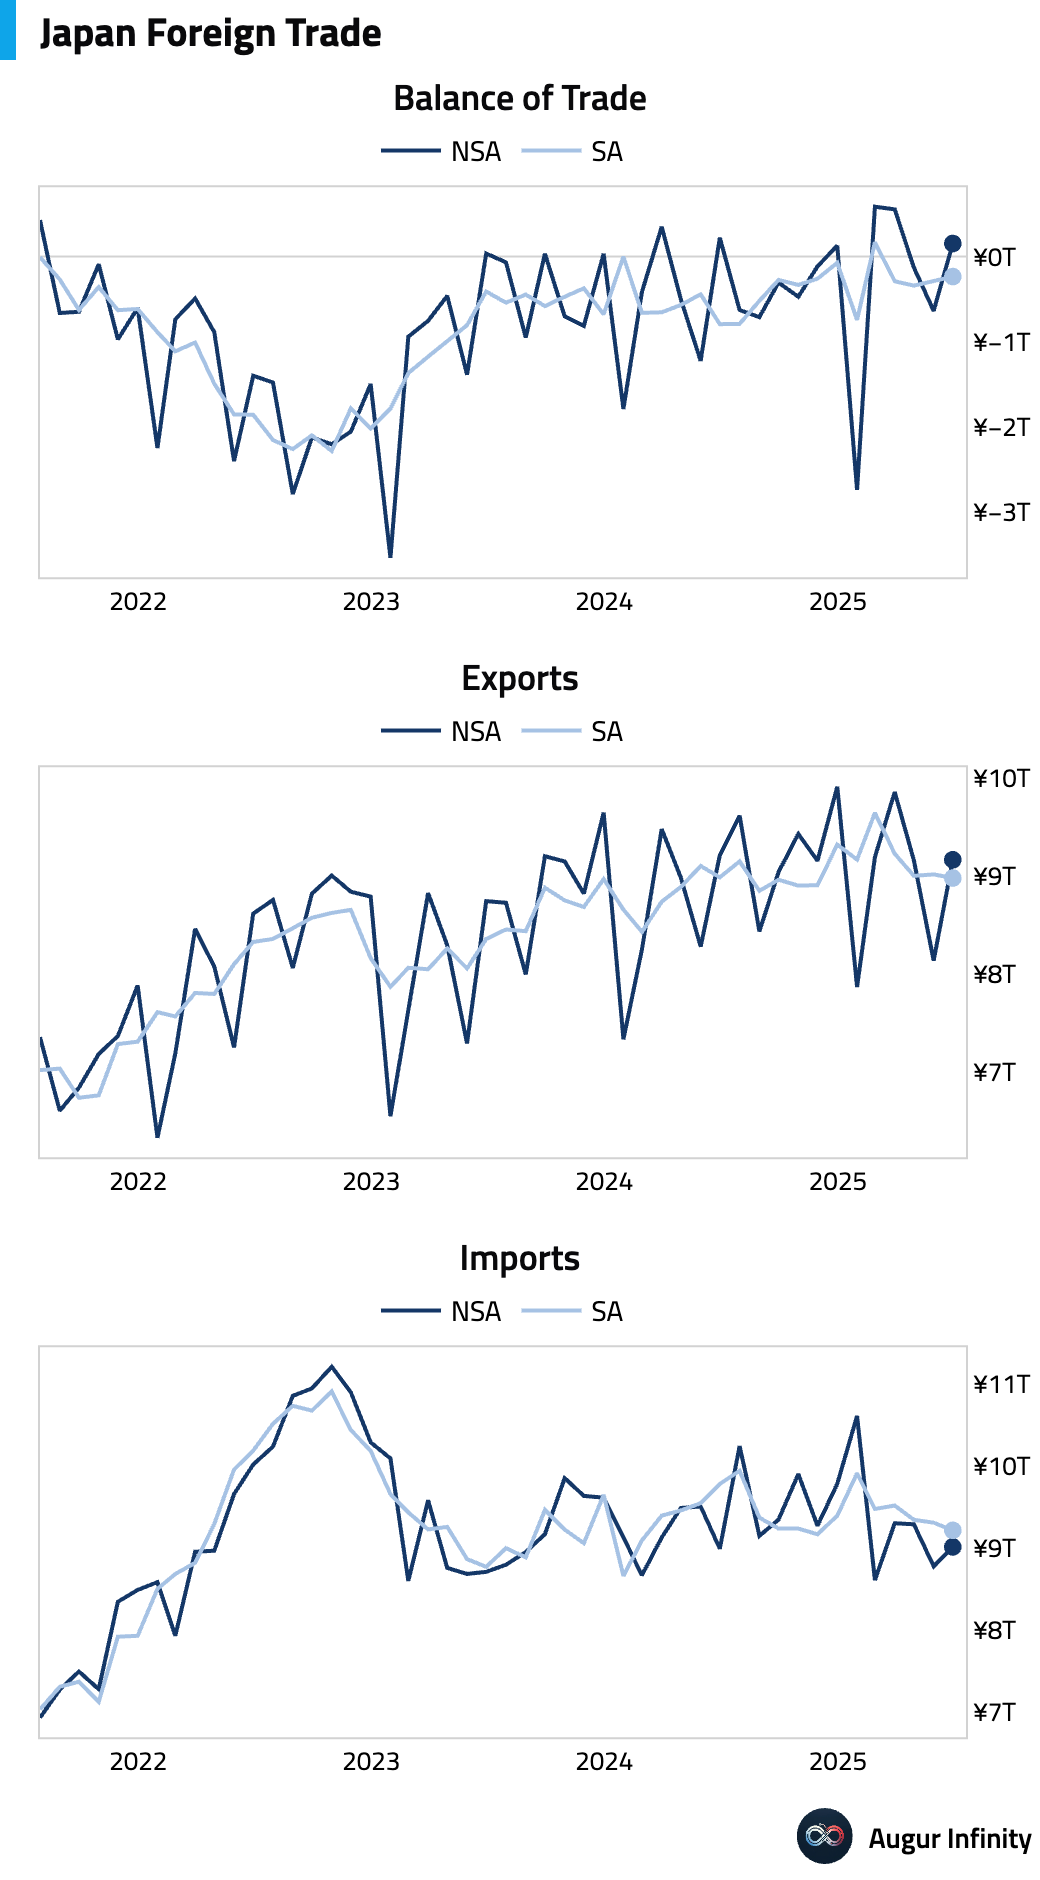
- Japan's trade balance swung to a ¥153.1 billion surplus in June but widely missed the ¥353.9 billion consensus. The miss was driven by a surprise 0.5% Y/Y fall in exports (vs. +0.5% cons), while imports rose 0.2% Y/Y against expectations of a 1.6% decline. Analysis suggests Japanese automakers are absorbing the additional 25 percentage point US tariff, with US-bound car export unit prices falling 18% in USD terms compared to the January-March average. This price decline alone is estimated to have reduced Japan's total June export value by 0.8%.
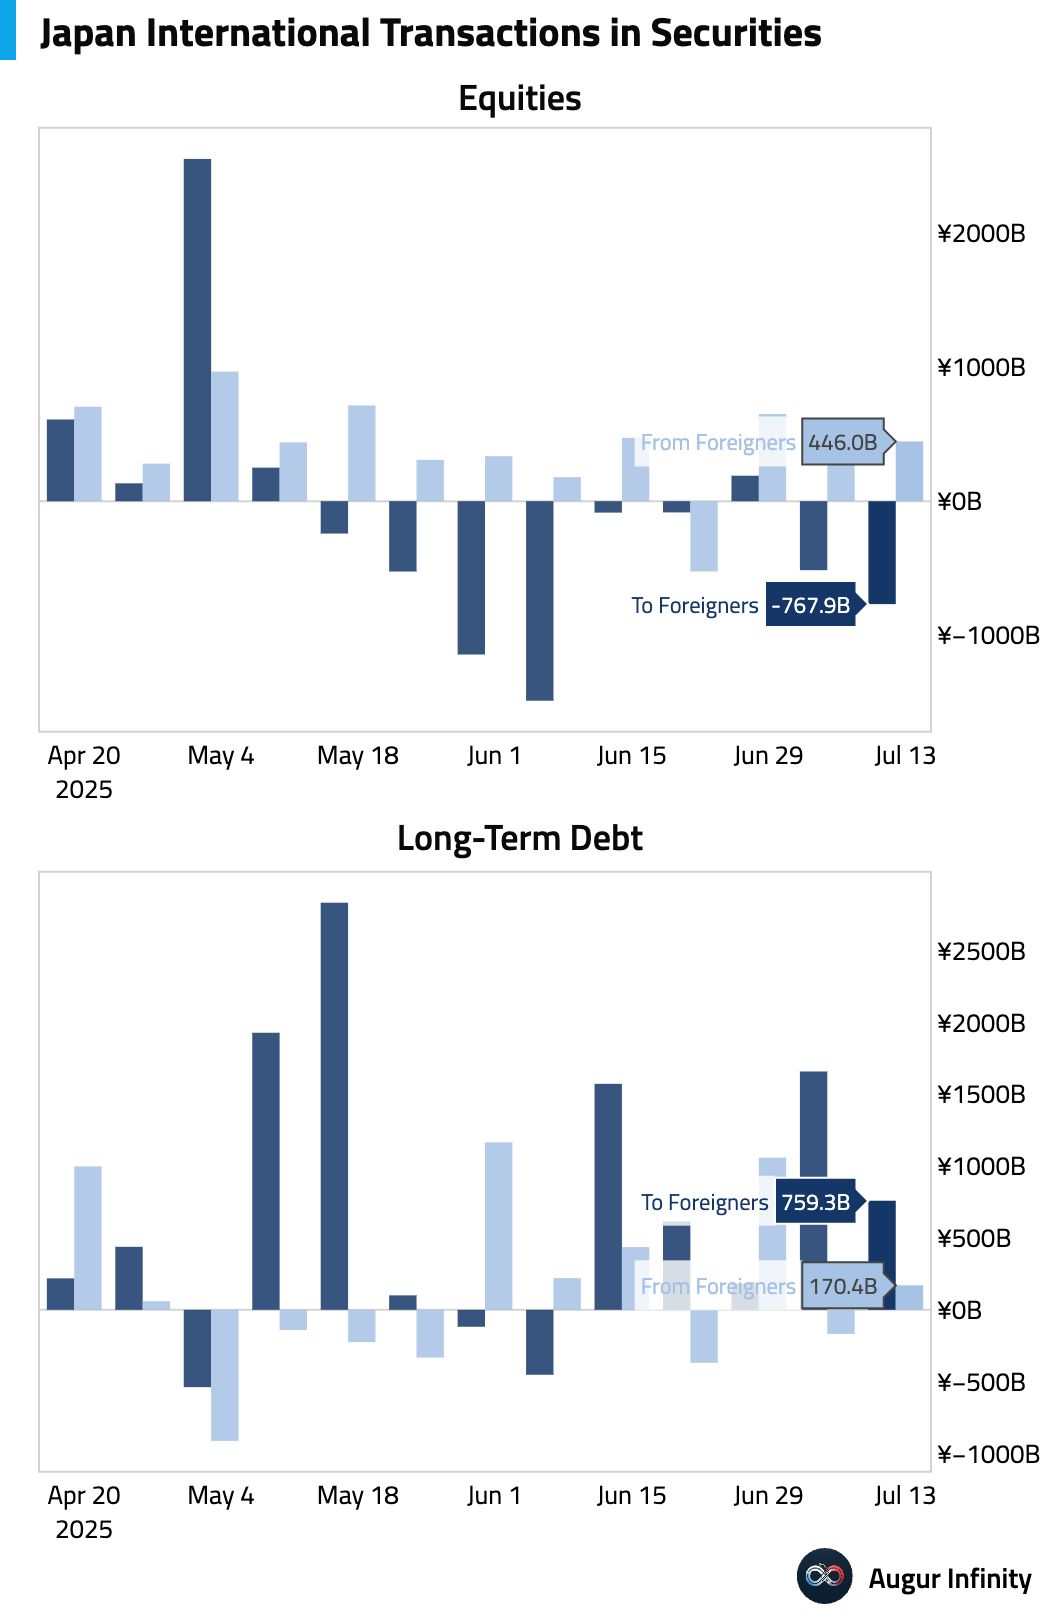
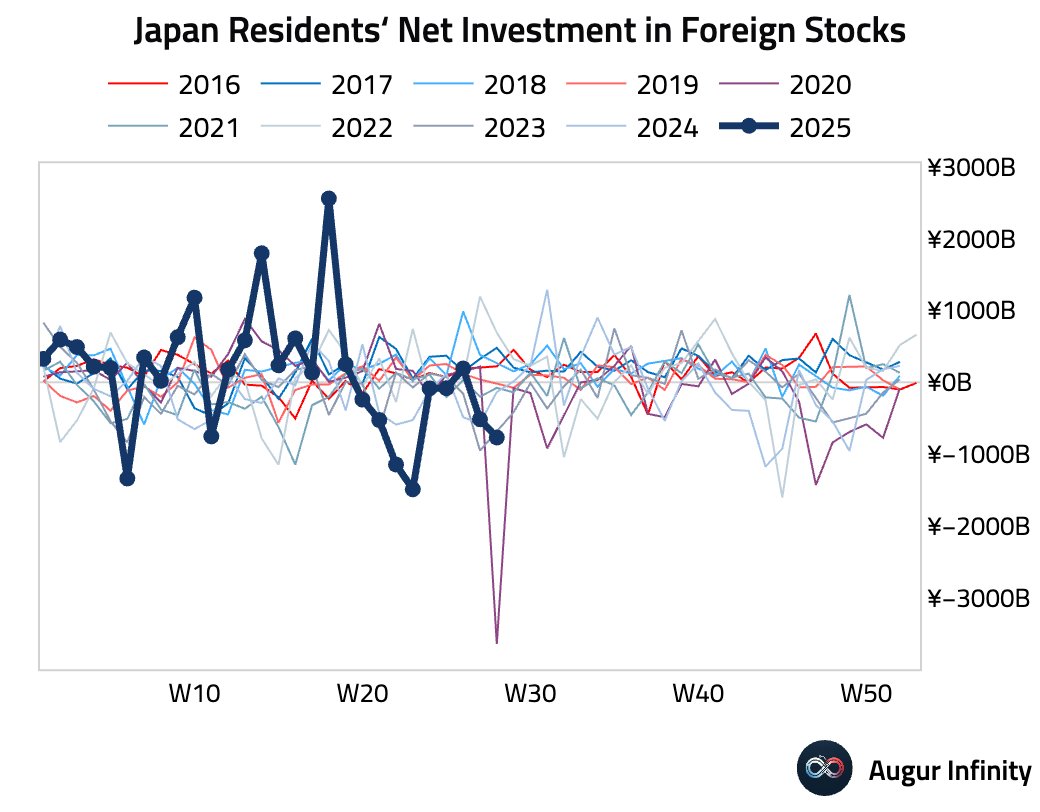
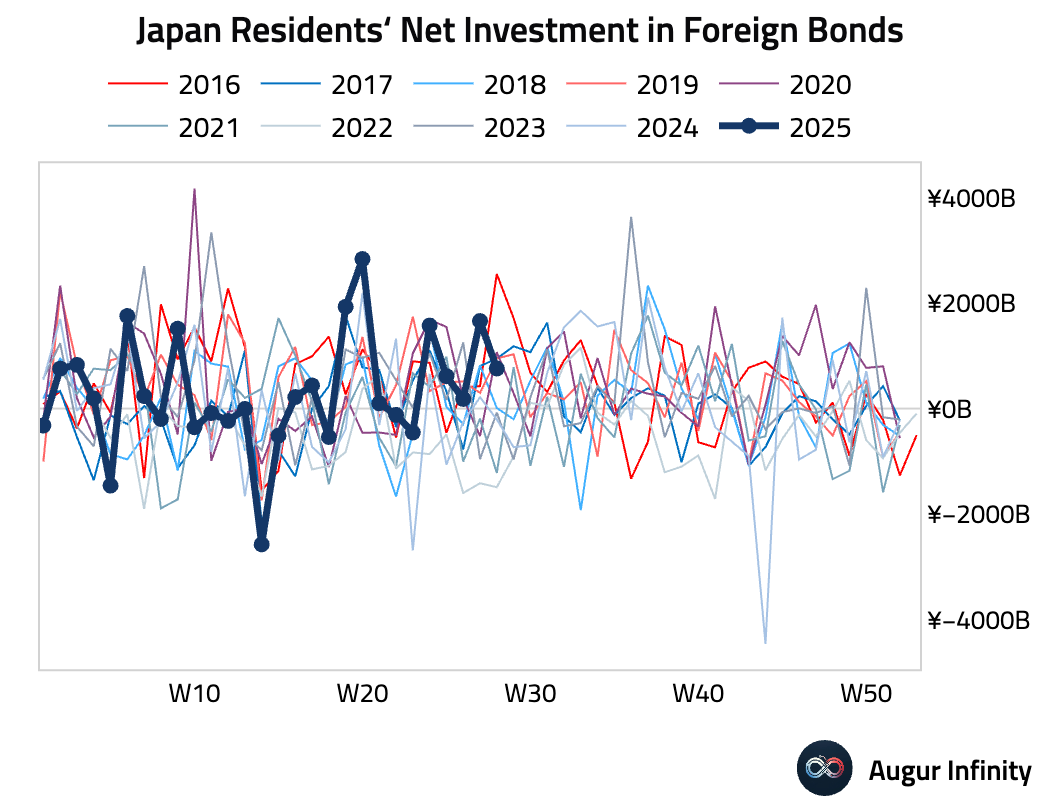
- Japanese investors purchased a net ¥759.3 billion of foreign bonds in the week ending July 12, while foreign investors purchased a net ¥446.0 billion of Japanese stocks.
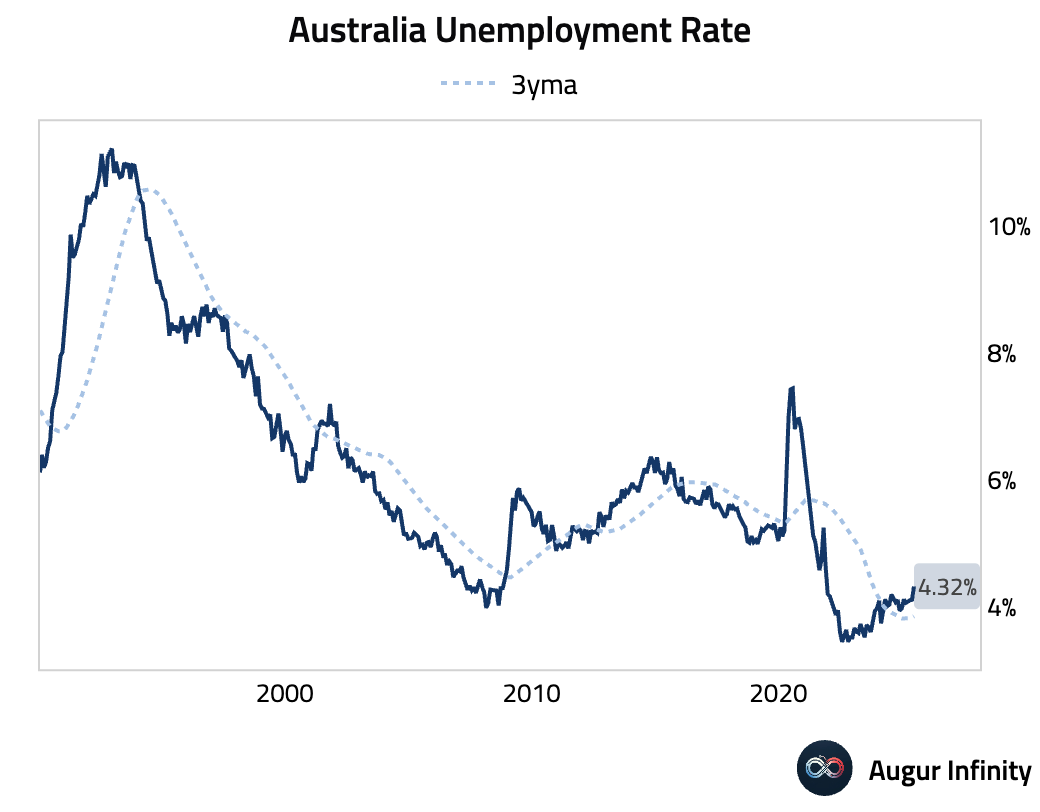
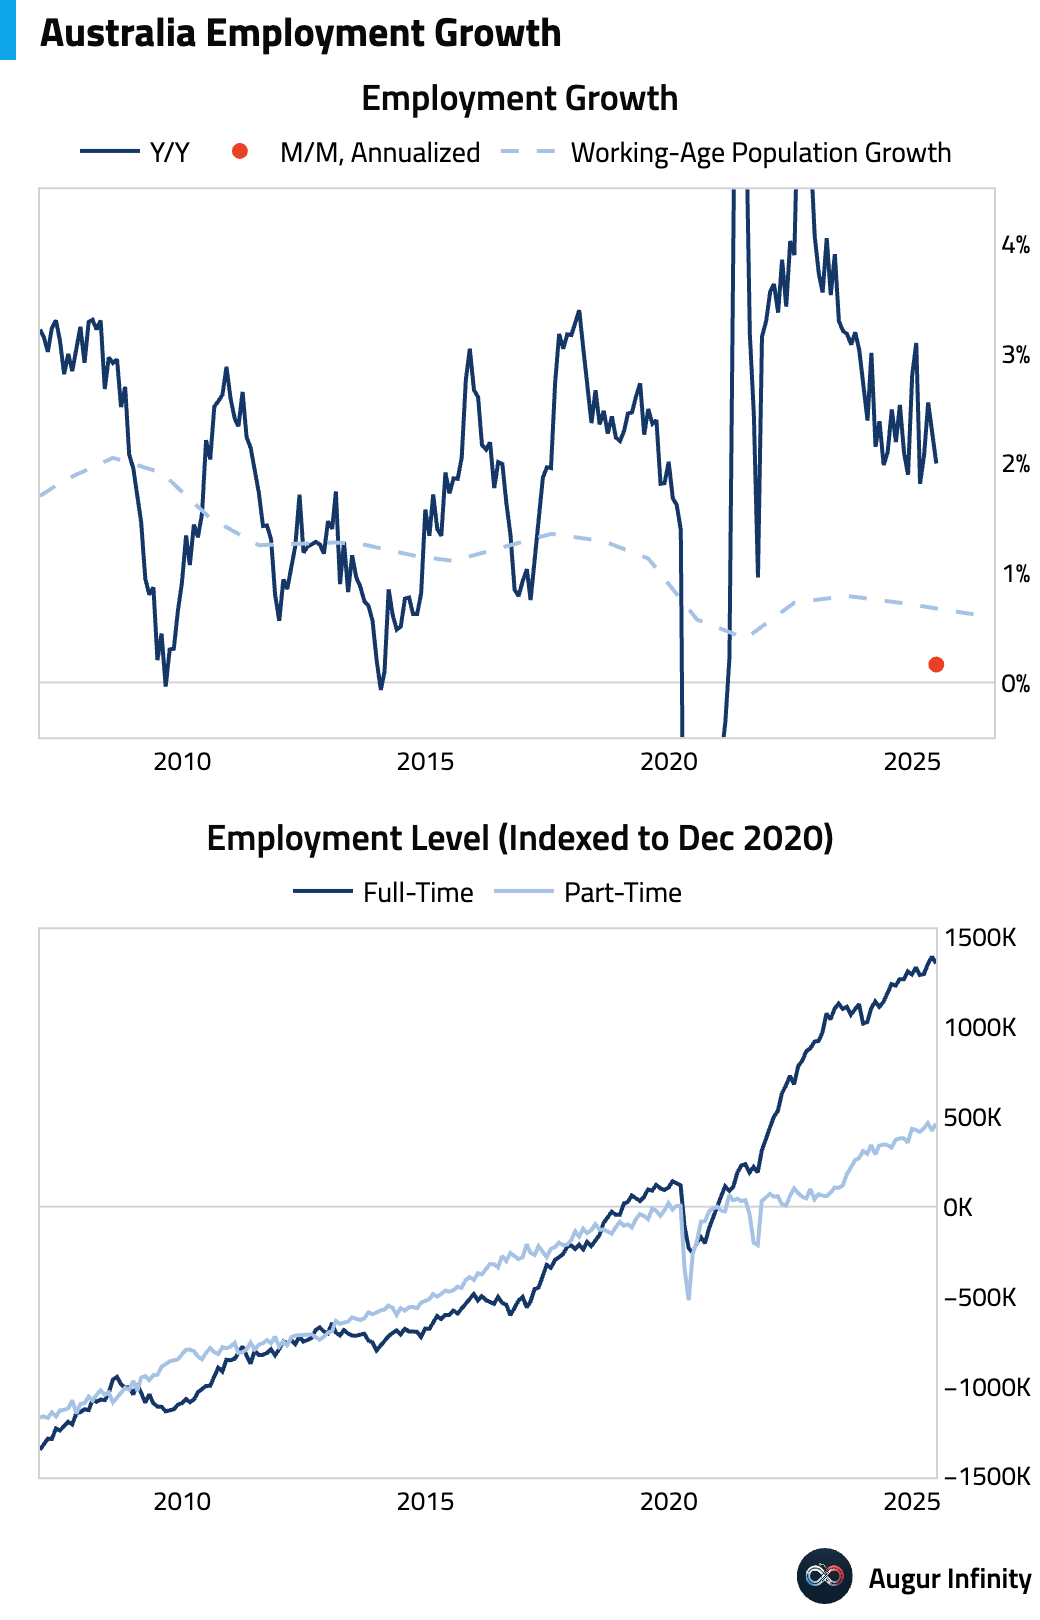
- Australia's unemployment rate unexpectedly rose by 0.2 percentage points to a new cycle high of 4.3% in June, missing the 4.1% consensus. The details were weak, with a mere 2,000 employment gain masking a 38,200 drop in full-time jobs, which was offset by a 40,200 rise in part-time work. Aggregate hours worked fell 0.9% M/M, the largest decline in over two years. The soft data has strengthened the case for an RBA rate cut in August.
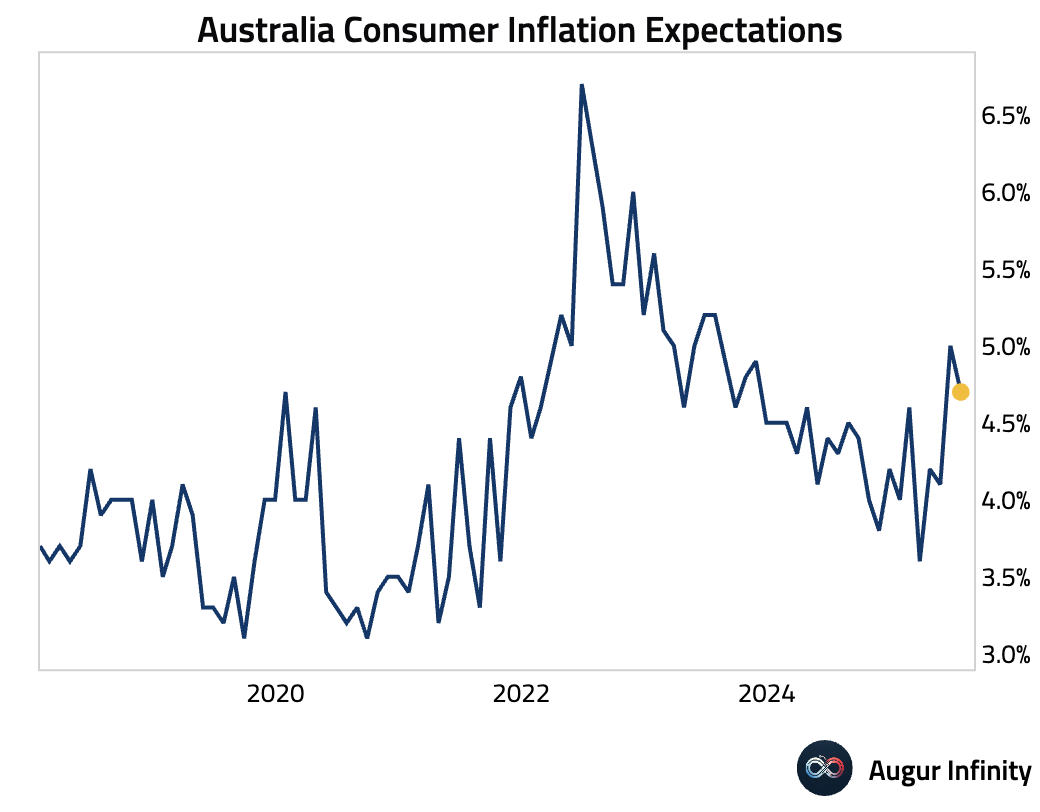
- Australian consumer inflation expectations for July cooled to 4.7% from 5.0% in June.
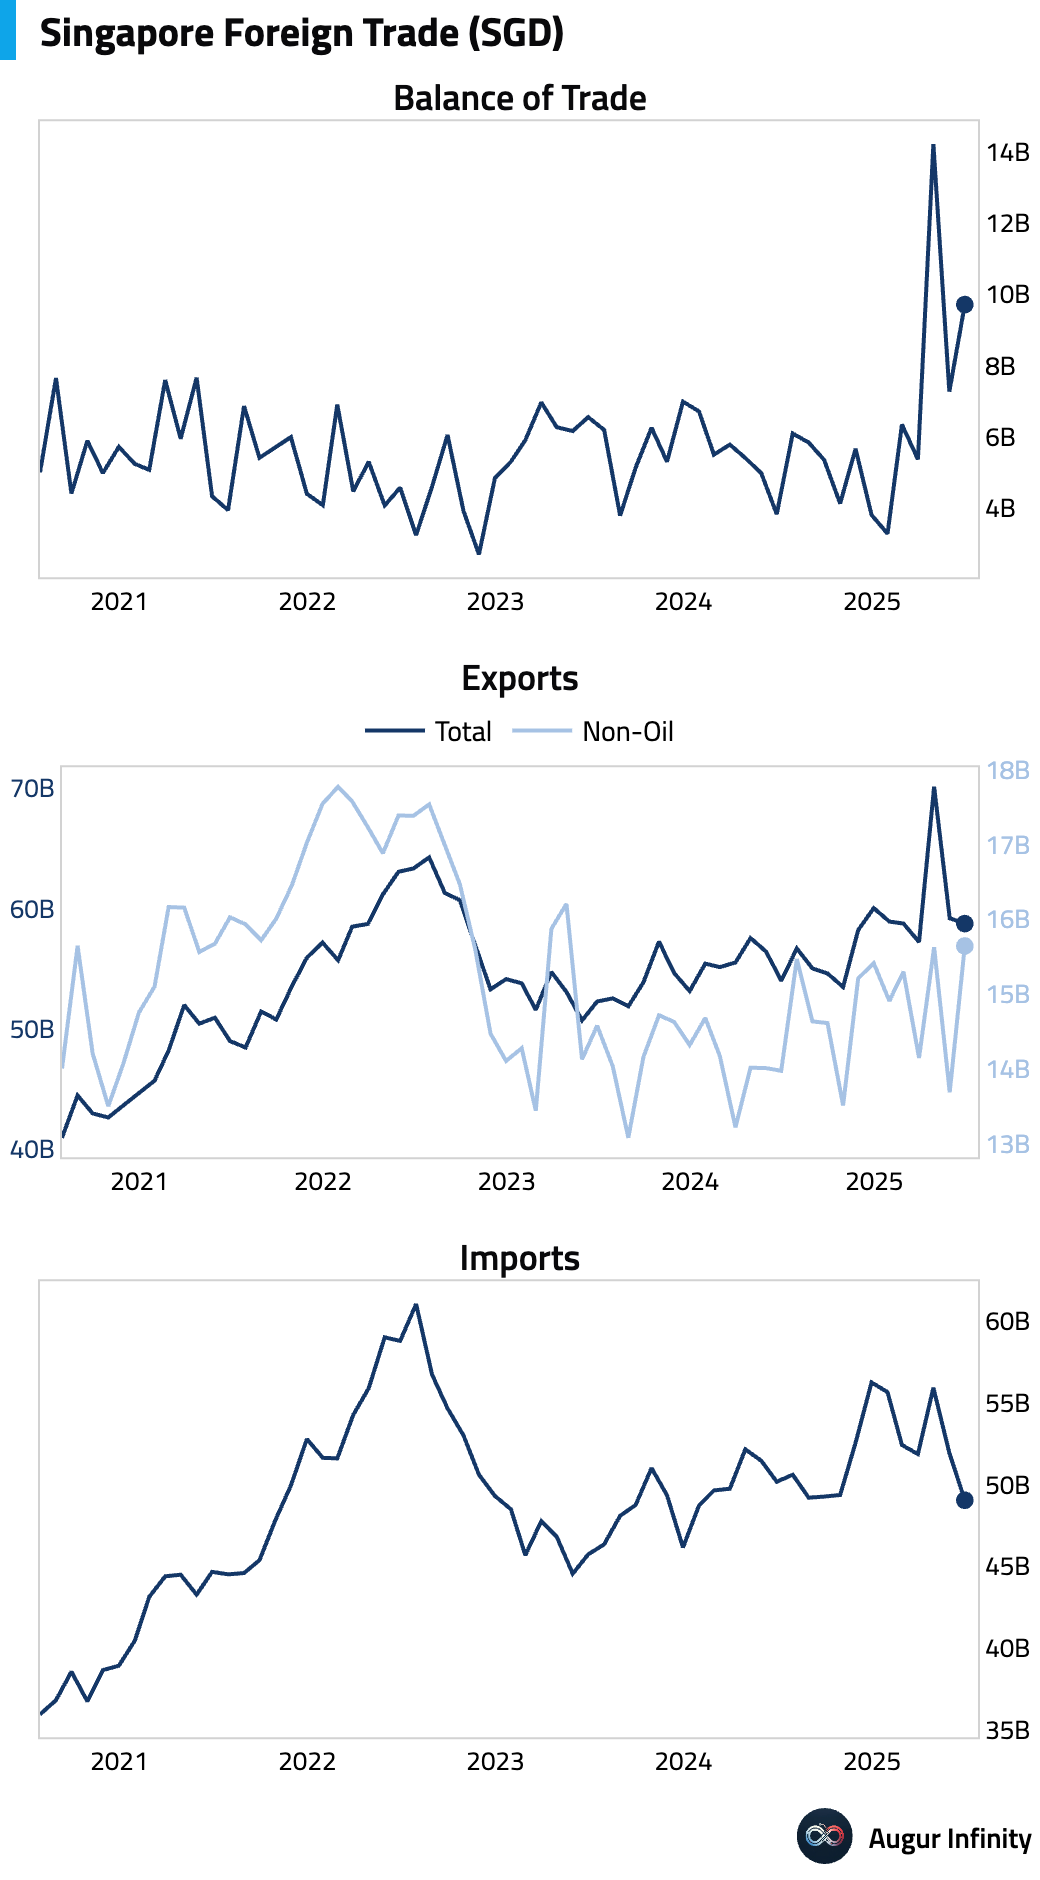
- Singapore's non-oil exports surged 13.0% Y/Y in June, crushing the 5.0% consensus, while M/M exports rebounded 14.3%. This led to a wider trade surplus of S$9.71 billion.
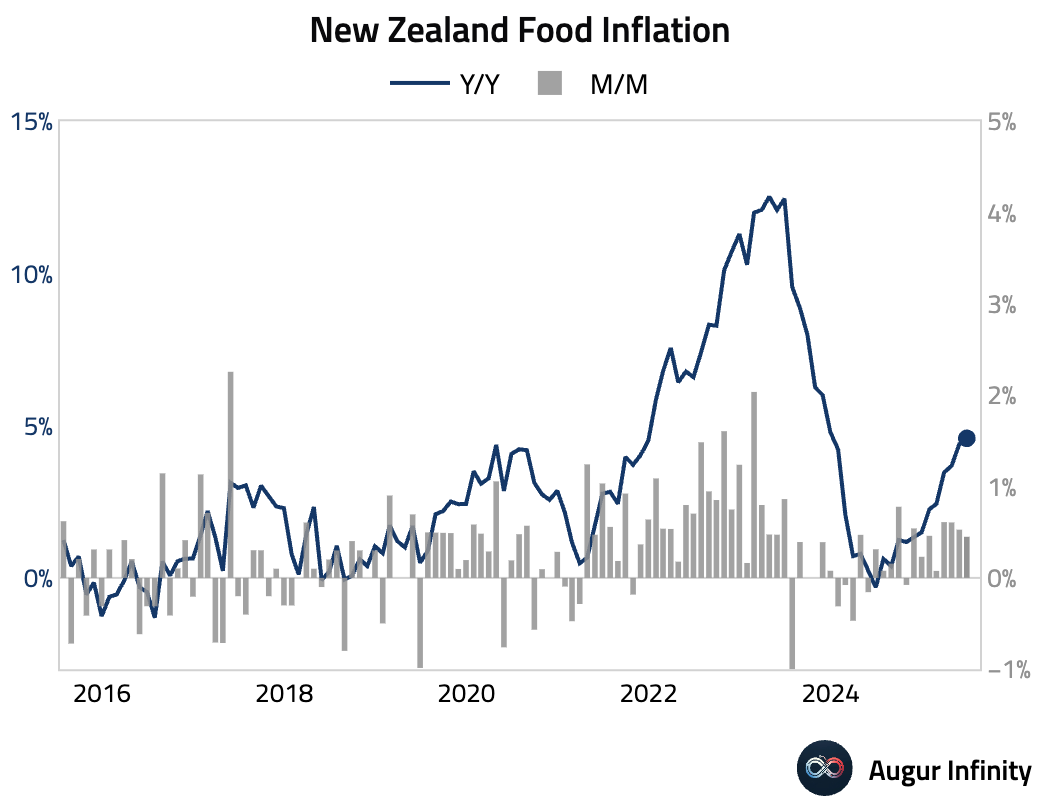
- New Zealand's food inflation accelerated to 4.6% Y/Y in June from 4.4% in May, reaching its highest level since December 2023.
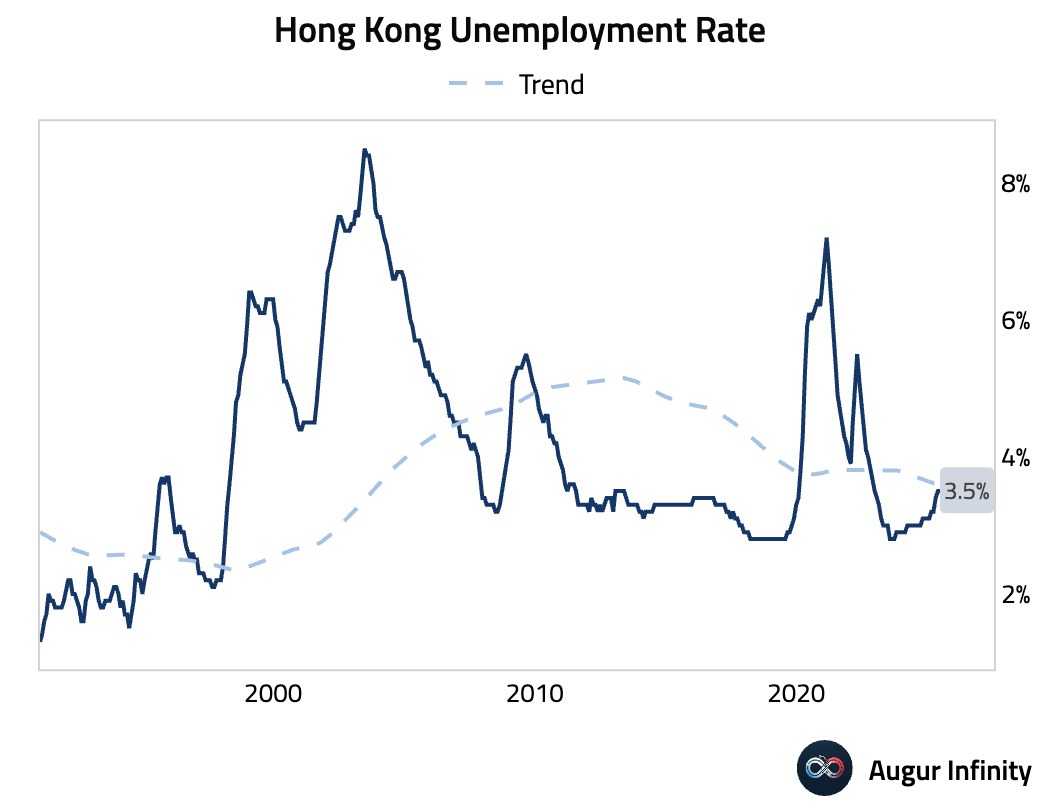
- Hong Kong's seasonally adjusted unemployment rate remained unchanged at 3.5% for the April-June period.
Emerging Markets ex China
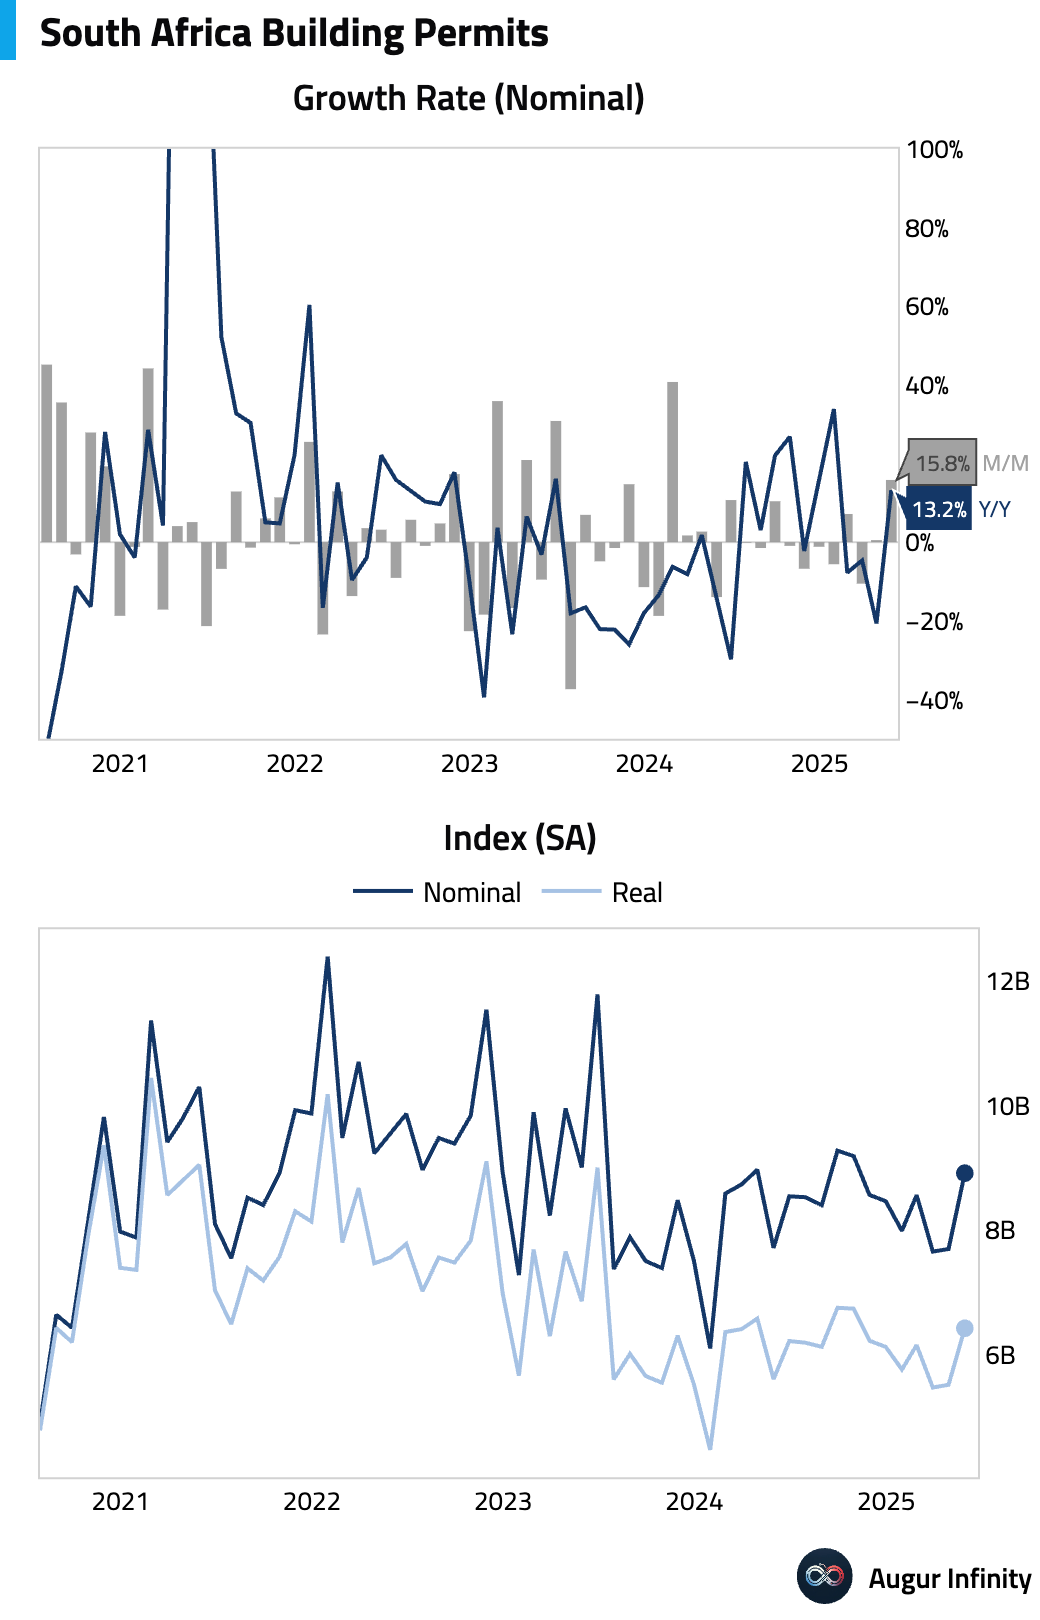
- South Africa's building permits rose 13.2% Y/Y in May, rebounding sharply from a 20.7% decline in the prior month.
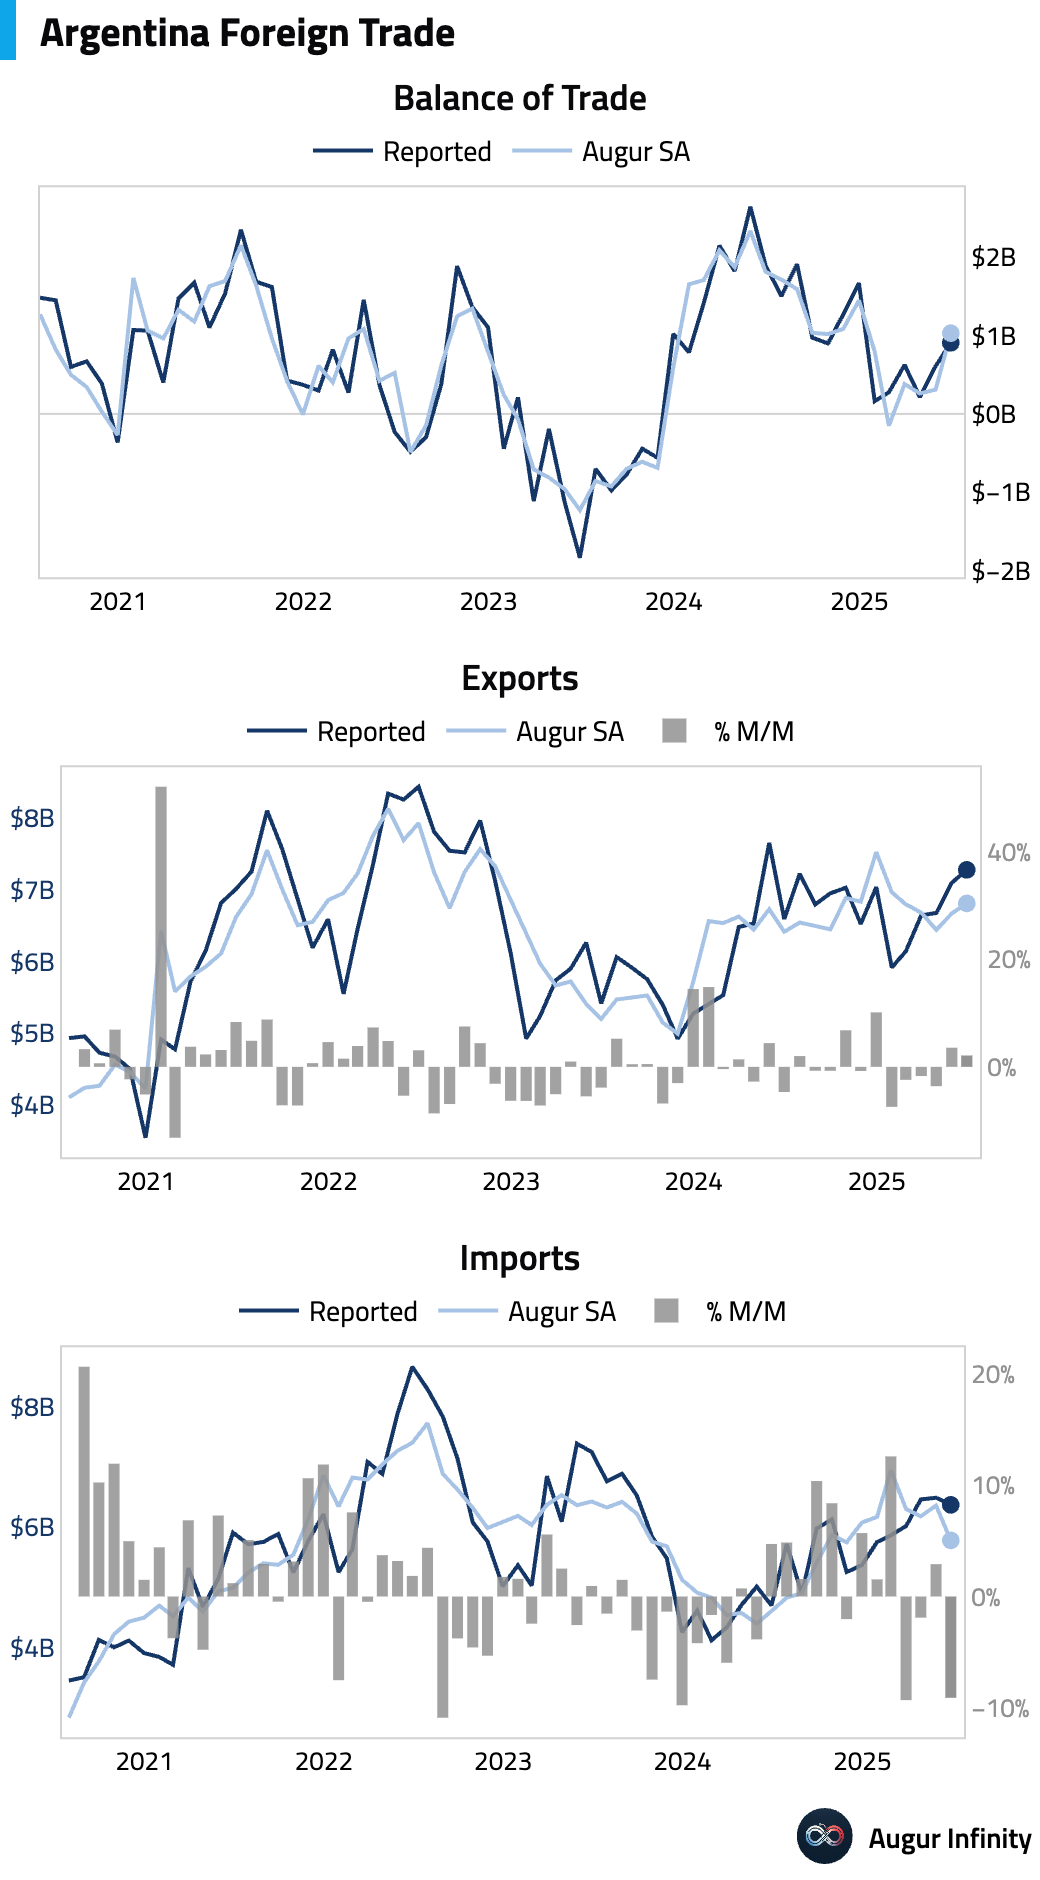
- Argentina's trade balance for June registered a surplus of $906 million, widening from the previous month and beating consensus expectations of $681 million.
Global Markets
Equities
- Global equities were broadly higher, supported by strong US economic data. US markets saw solid gains, with the S&P 500 and Nasdaq Composite advancing 0.5% and 0.7%, respectively, each marking a fourth consecutive day of gains. Emerging markets also rose 0.6%. In Brazil, the local market gained for a third straight day, rising 0.4%.
- After surpassing Japan's weight in the ACWI global equity index just a few days ago, NVIDIA's weight is now inching close to 5%.
Fixed Income
- US Treasury yields rose across the front and belly of the curve following strong retail sales and manufacturing data, while the long end was little changed. The 2-year yield climbed 3.1 bps, while the 10-year yield edged up 0.3 bps. The 30-year yield fell marginally.
- Treasury futures liquidity has improved meaningfully over the past month.
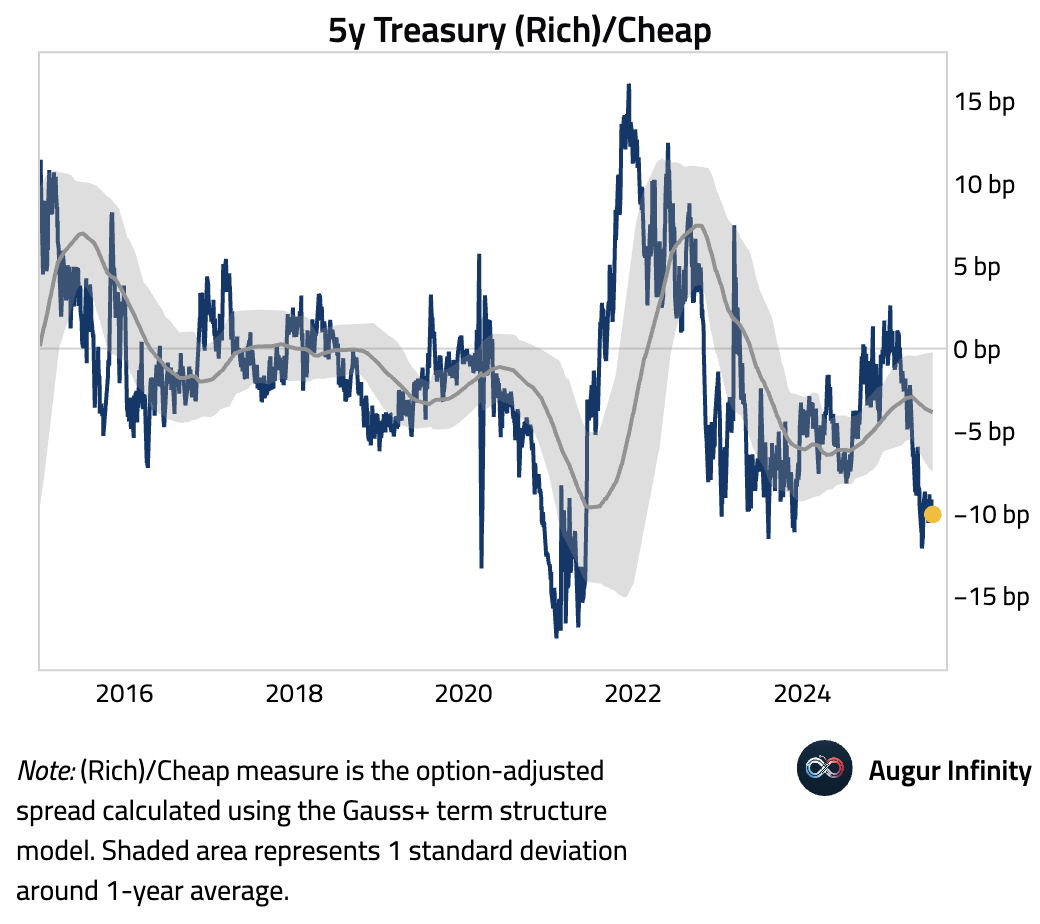
- The 5-year sector of the US Treasury curve is now rather rich, based on a term structure model.
FX
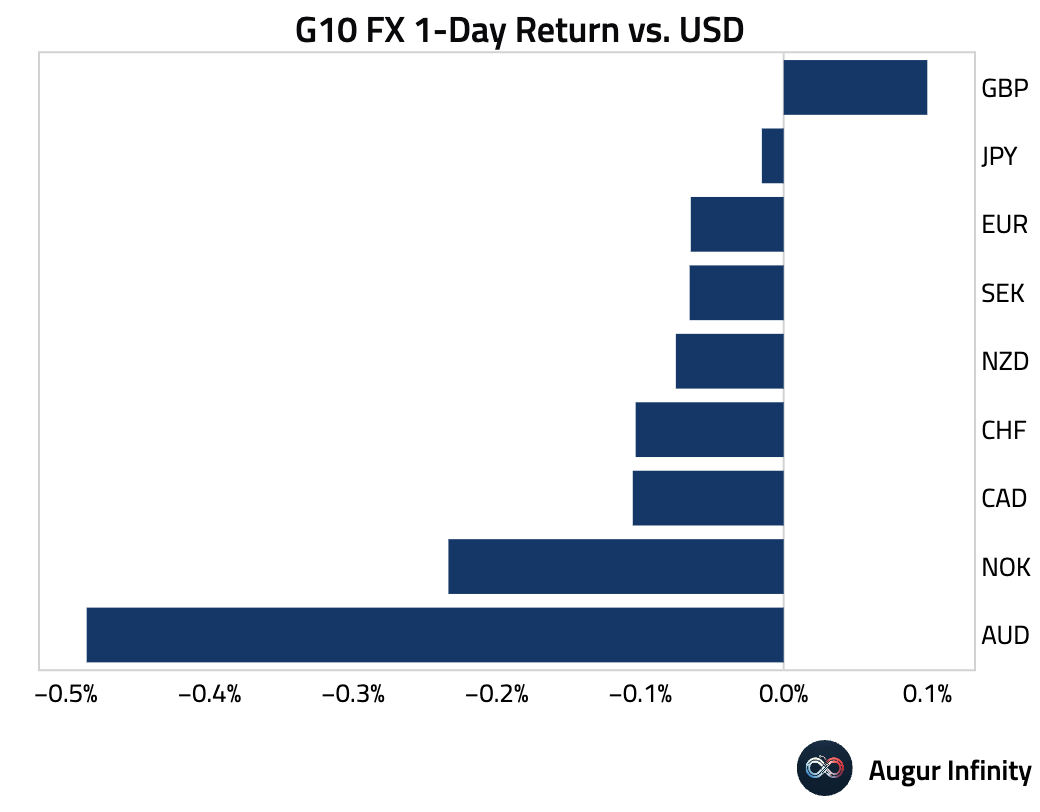
- The US dollar strengthened against most G10 peers, buoyed by robust domestic economic data. The Australian dollar was the weakest performer, falling 0.5% against the greenback following its disappointing jobs report. Several currencies registered multi-day losing streaks against the dollar, including the Swedish krona (six days), New Zealand dollar (five days), and the euro, Swiss franc, and Australian dollar (four days each). The Canadian dollar and Norwegian krone fell for a third consecutive day.
Disclaimer
Augur Digest is an automated newsletter written by an AI. It may contain inaccuracies and is not investment advice. Augur Labs LLC will not accept liability for any loss or damage as a result of your reliance on the information contained in the newsletter.