Headlines
- President Trump announced a 50 percent tariff on imported semifinished copper products and related derivatives and suggested that tariff rates on Indian goods could be set between 20 and 25 percent.
- The US Treasury announced in its quarterly refunding statement that it will increase the frequency of nominal buybacks for longer-dated securities.
- The German government approved its federal budget for 2026.
Charts of the Day
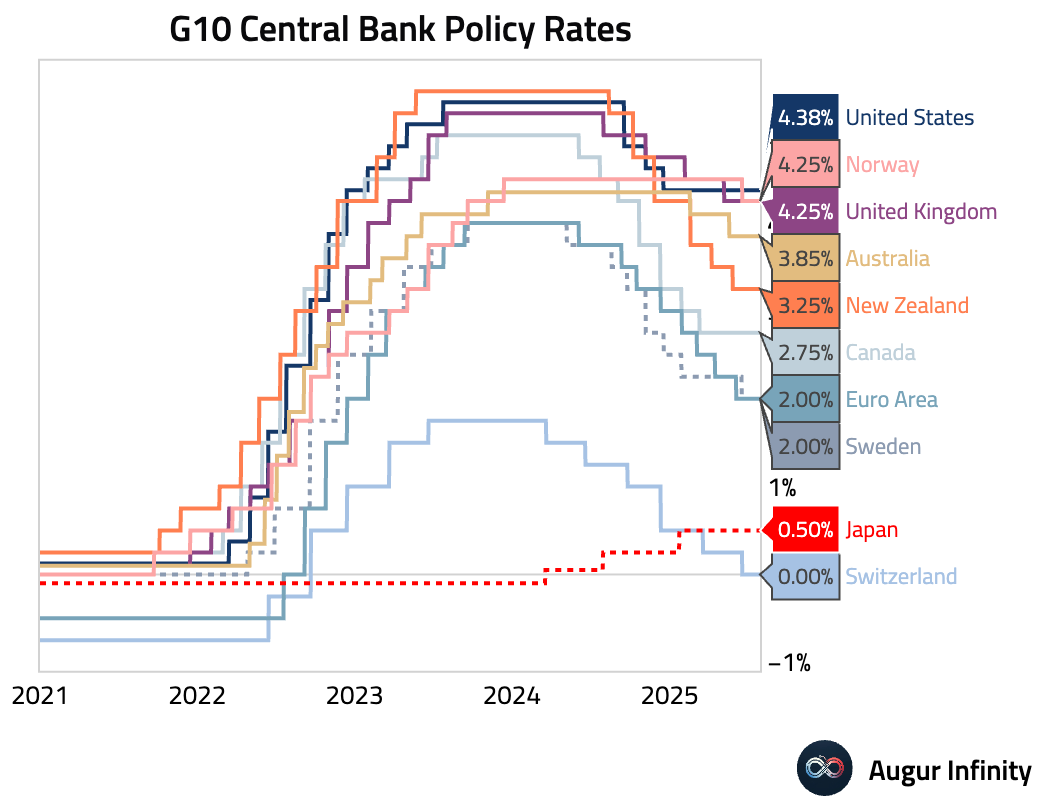
- The US Federal Reserve held its benchmark interest rate steady at 4.25%–4.50%, as expected. However, the decision included dissents from Governors Bowman and Waller, who preferred a 25 basis point cut. This marks the first double dissent since 1993 and signals a growing internal split on the future path of monetary policy.
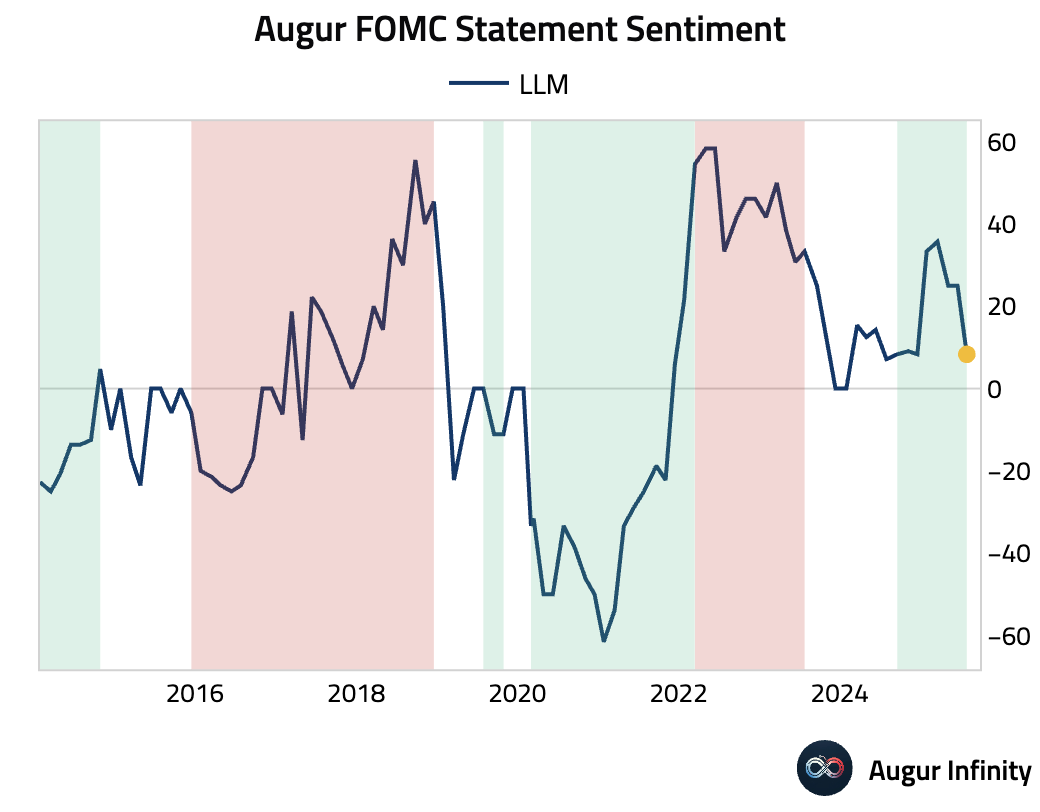
- An interpretation of today’s FOMC statement through a large language model suggests it was the most dovish of the year. The Committee acknowledged that economic growth had “moderated” in the first half of the year.
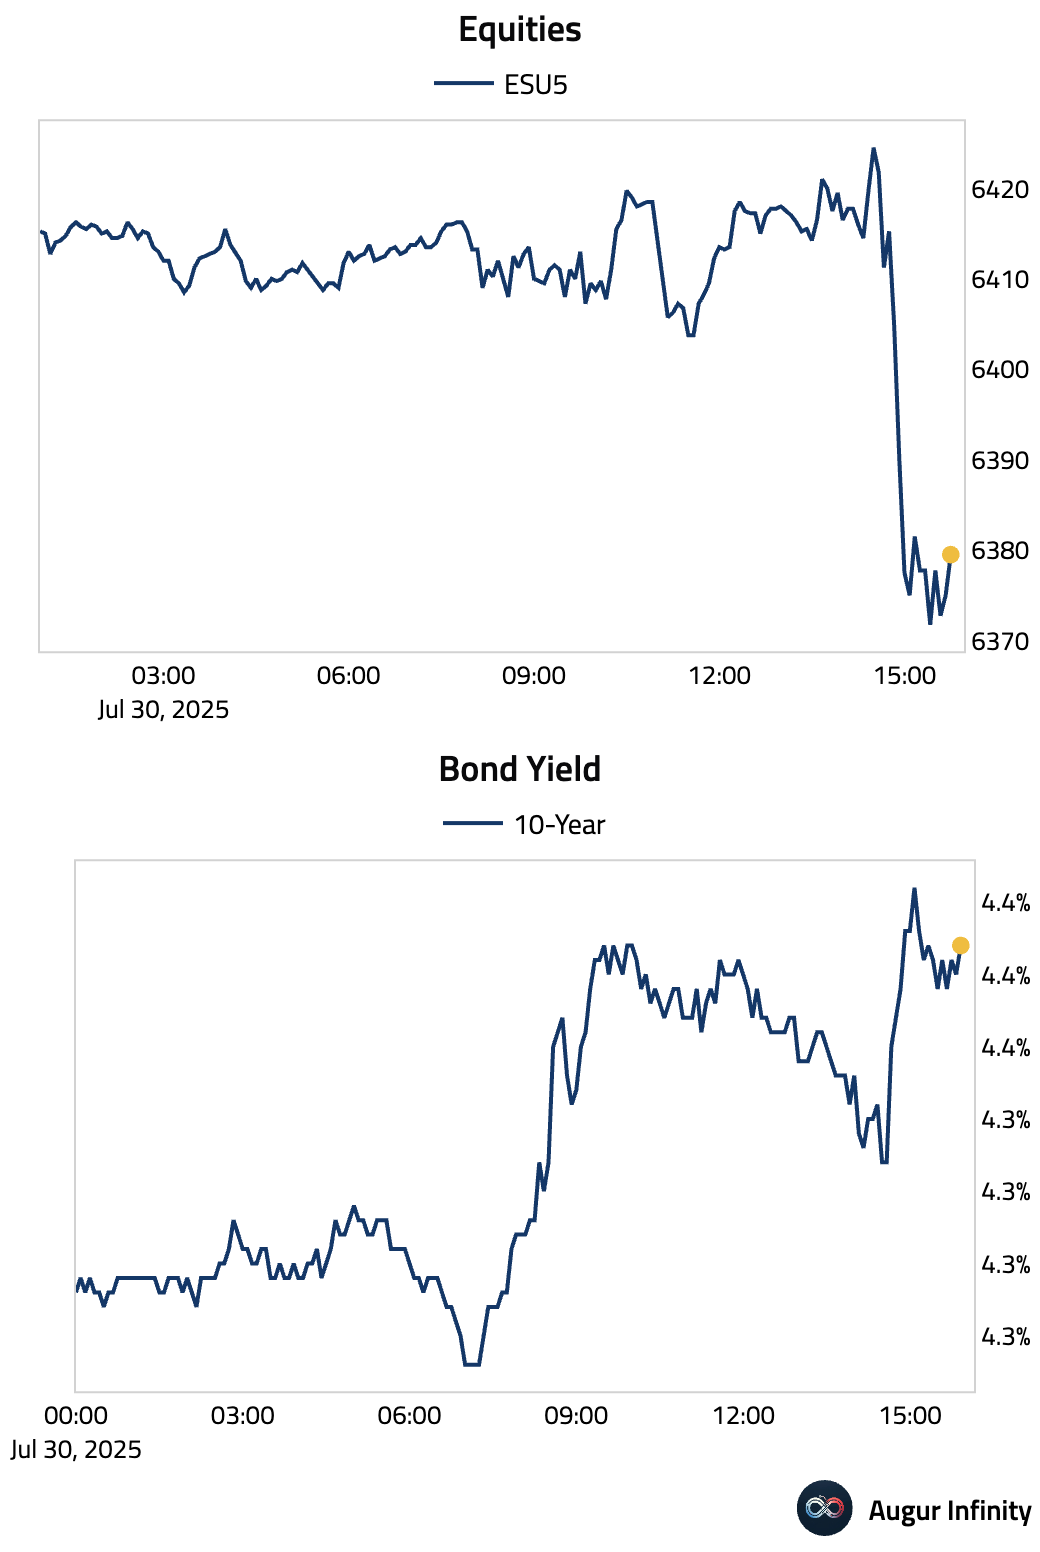
- Despite the dovish statement, market sentiment reversed sharply during the press conference. Chair Powell’s comments that no decision has been made on a September rate cut and that the FOMC must wait to see the inflationary impact of tariffs triggered a selloff in equities and a spike in bond yields.
Global Economics
United States
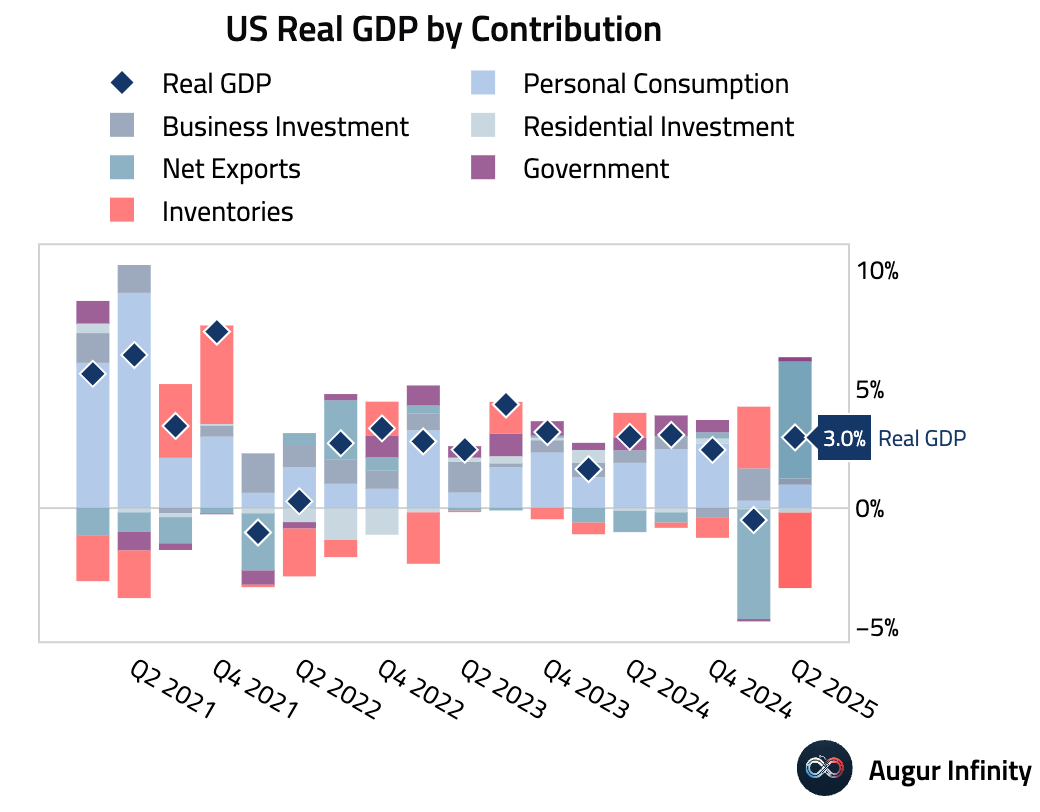
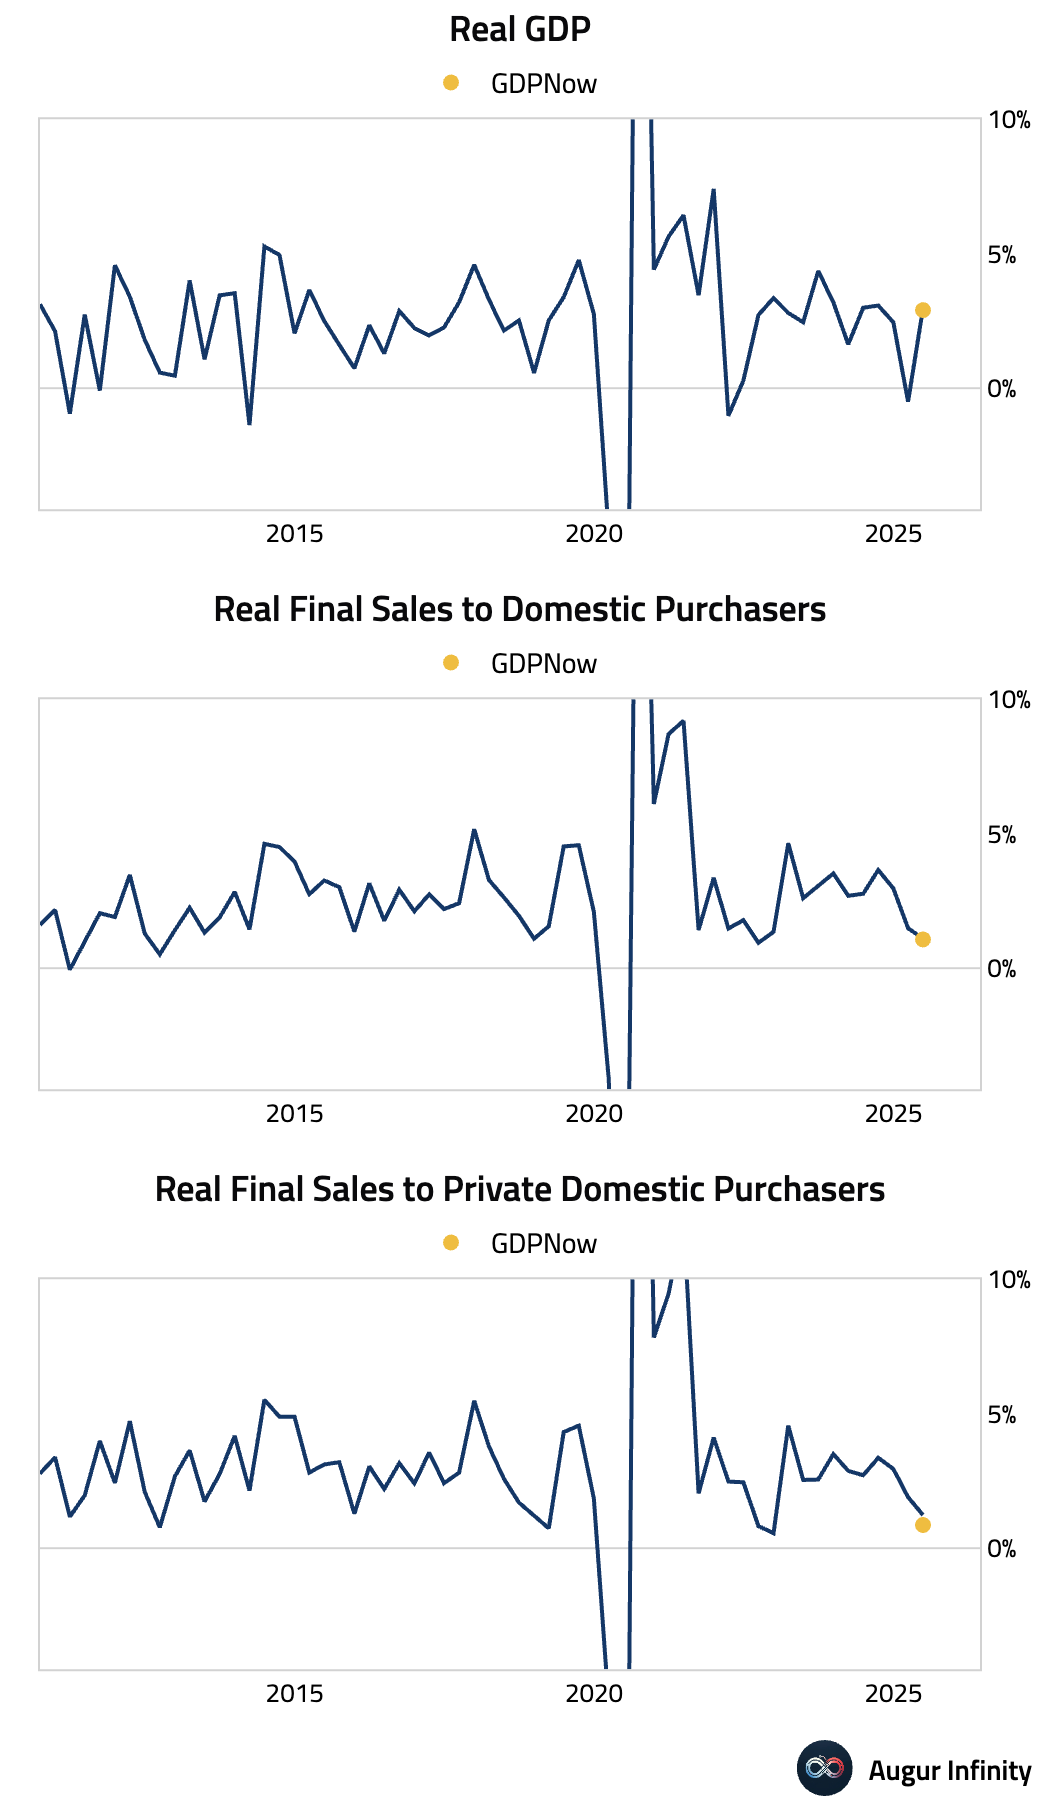
- Advance Q2 GDP data showed the US economy expanded at a 3.0% annualized rate, handily beating the 2.4% consensus and marking a sharp recovery from the 0.5% contraction in Q1. However, the headline strength is somewhat illusory, as it was heavily inflated by a 1.8 percentage point boost from net exports and inventories, likely due to tariff-related front-loading. Underlying private demand was much weaker, with real final sales to private domestic purchasers growing just 1.2%. On the inflation front, the core PCE price index accelerated to 2.5% QoQ, above the 2.3% consensus, indicating stickier underlying price pressures.
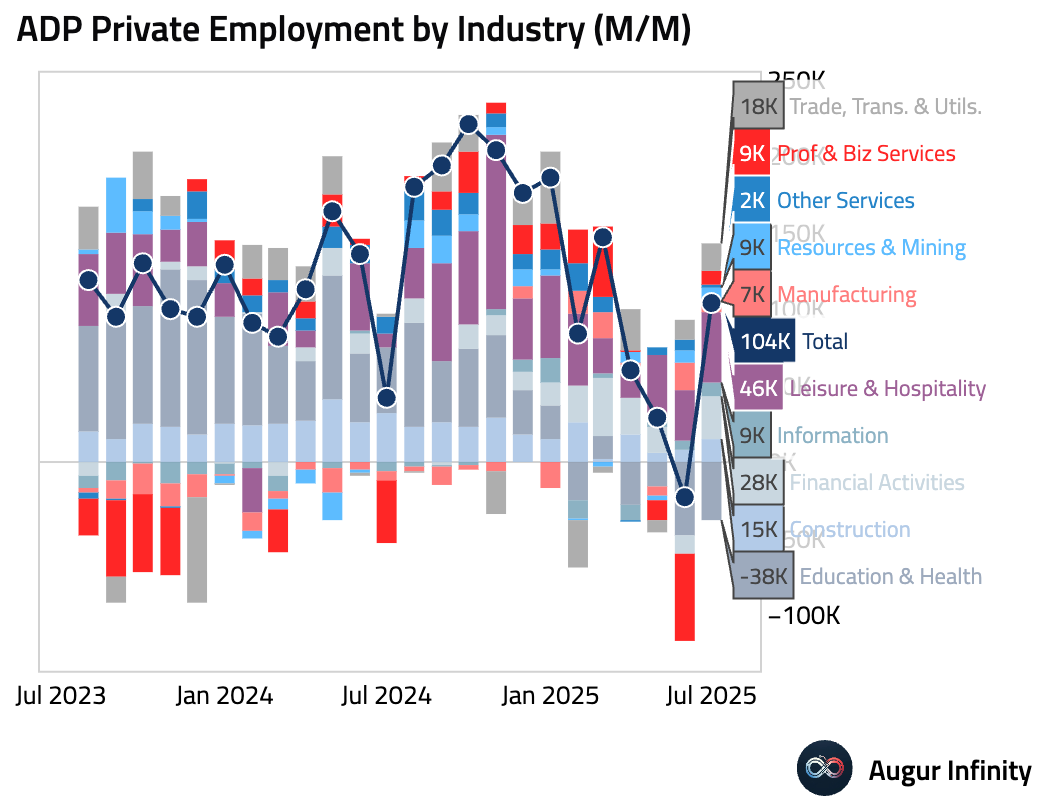
- The ADP Employment report showed private payrolls rose by 104,000 in July, rebounding from a revised 23,000 decline in June and beating the 75,000 consensus estimate. Job growth was led by the services sector (+74,000), particularly in Leisure & Hospitality (+46,000), though this was offset by a significant decline in Education & Health (-38,000).
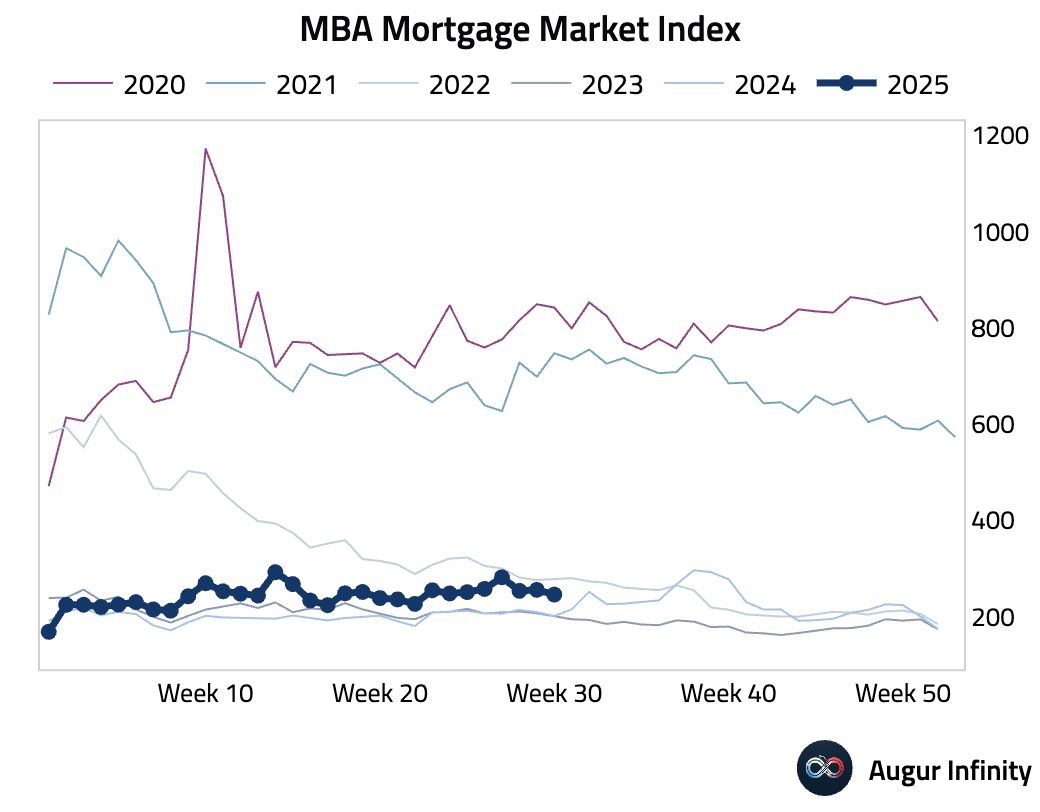
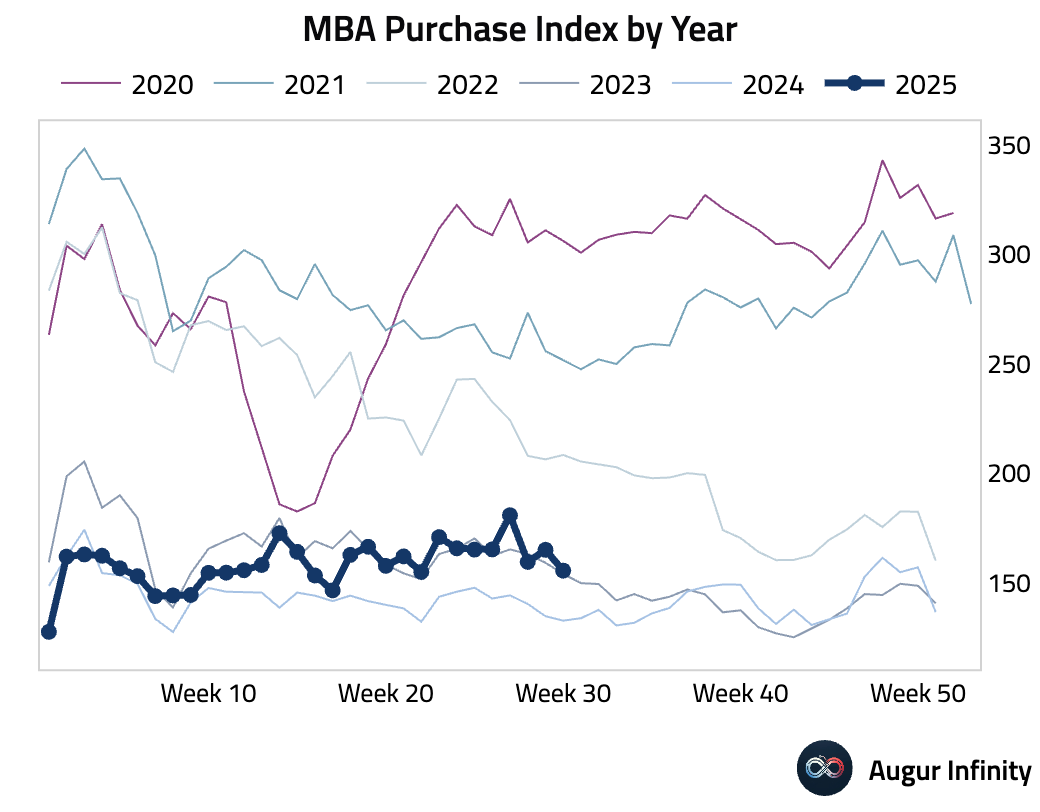
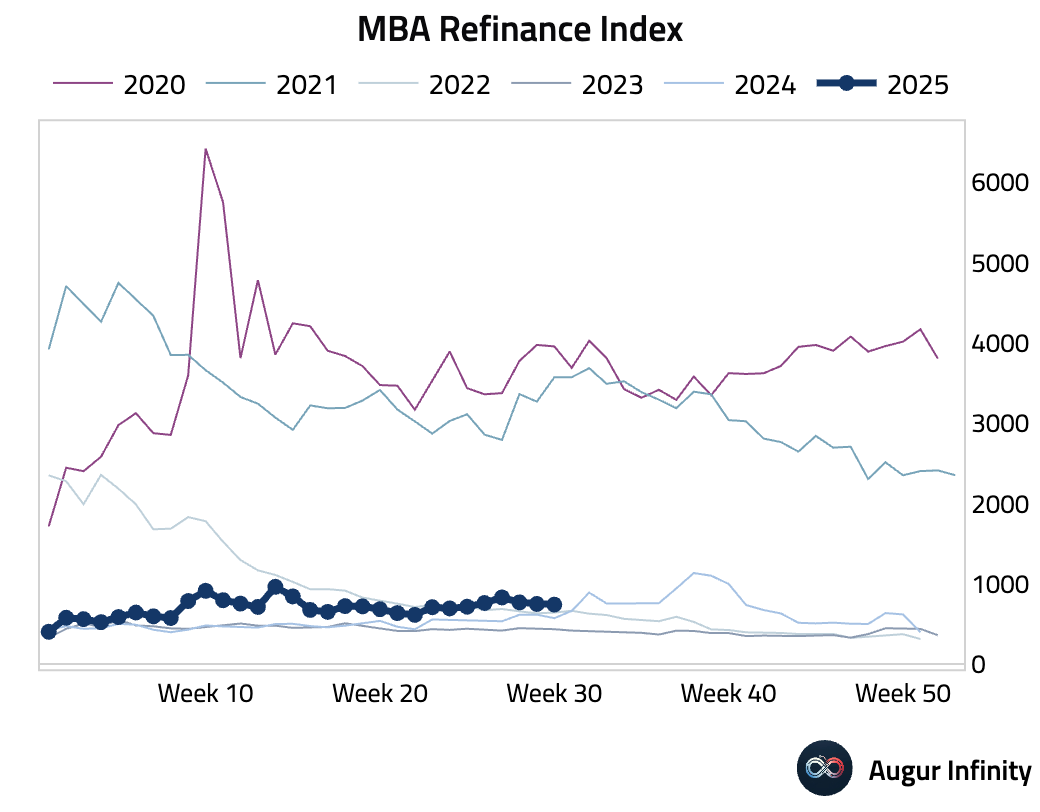
- Mortgage applications pulled back notably last week. The MBA Mortgage Market Index fell 3.8% week-over-week, a reversal from the prior week’s 0.8% gain. The decline was broad-based, with the Purchase Index dropping to 155.6 from 165.1 and the Refinance Index falling to 739.3 from 747.5.
Canada
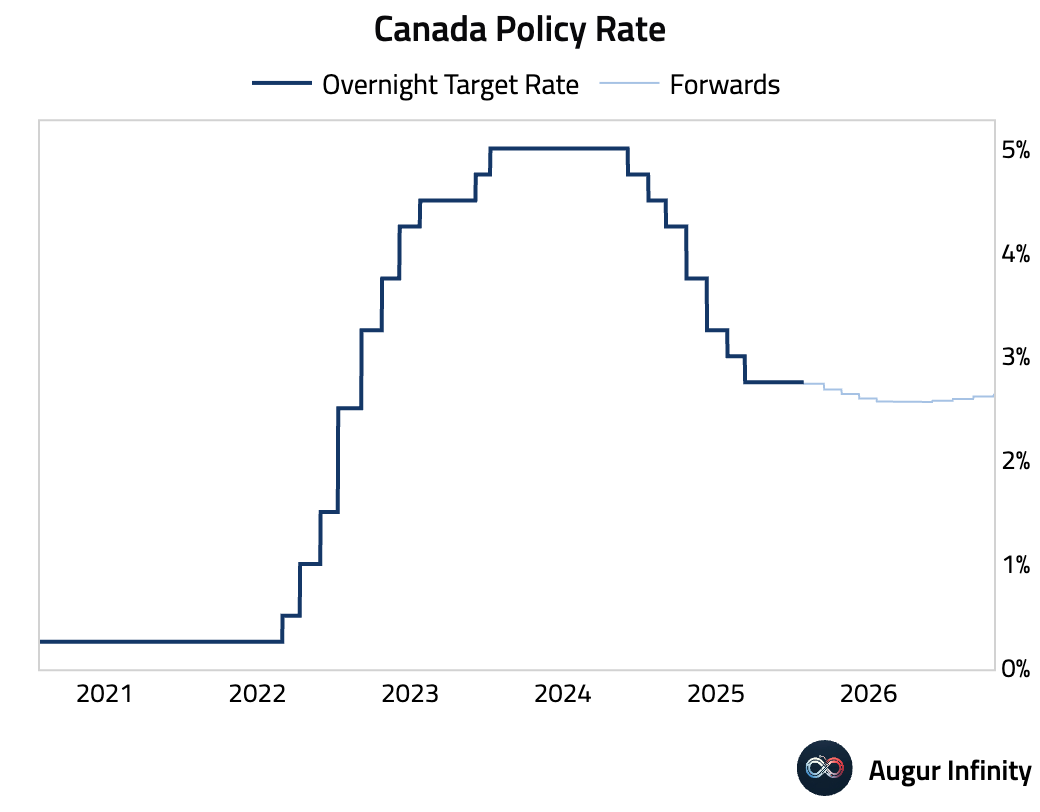
- The Bank of Canada (BoC) held its key interest rate at 2.75%, in line with consensus. The accompanying statement struck a dovish tone, citing growth headwinds from trade uncertainty. The BoC’s own Monetary Policy Report projects a sharp 1.5% annualized GDP contraction for Q2 2025 but revised core inflation forecasts higher to 3.1% for late 2025, explaining the on-hold stance amid conflicting signals. A key domestic headwind is the "mortgage reset" wave in 2025–26, which is expected to increase monthly payments by 6–10% and drag on future consumer spending, supporting the case for future rate cuts.
Europe
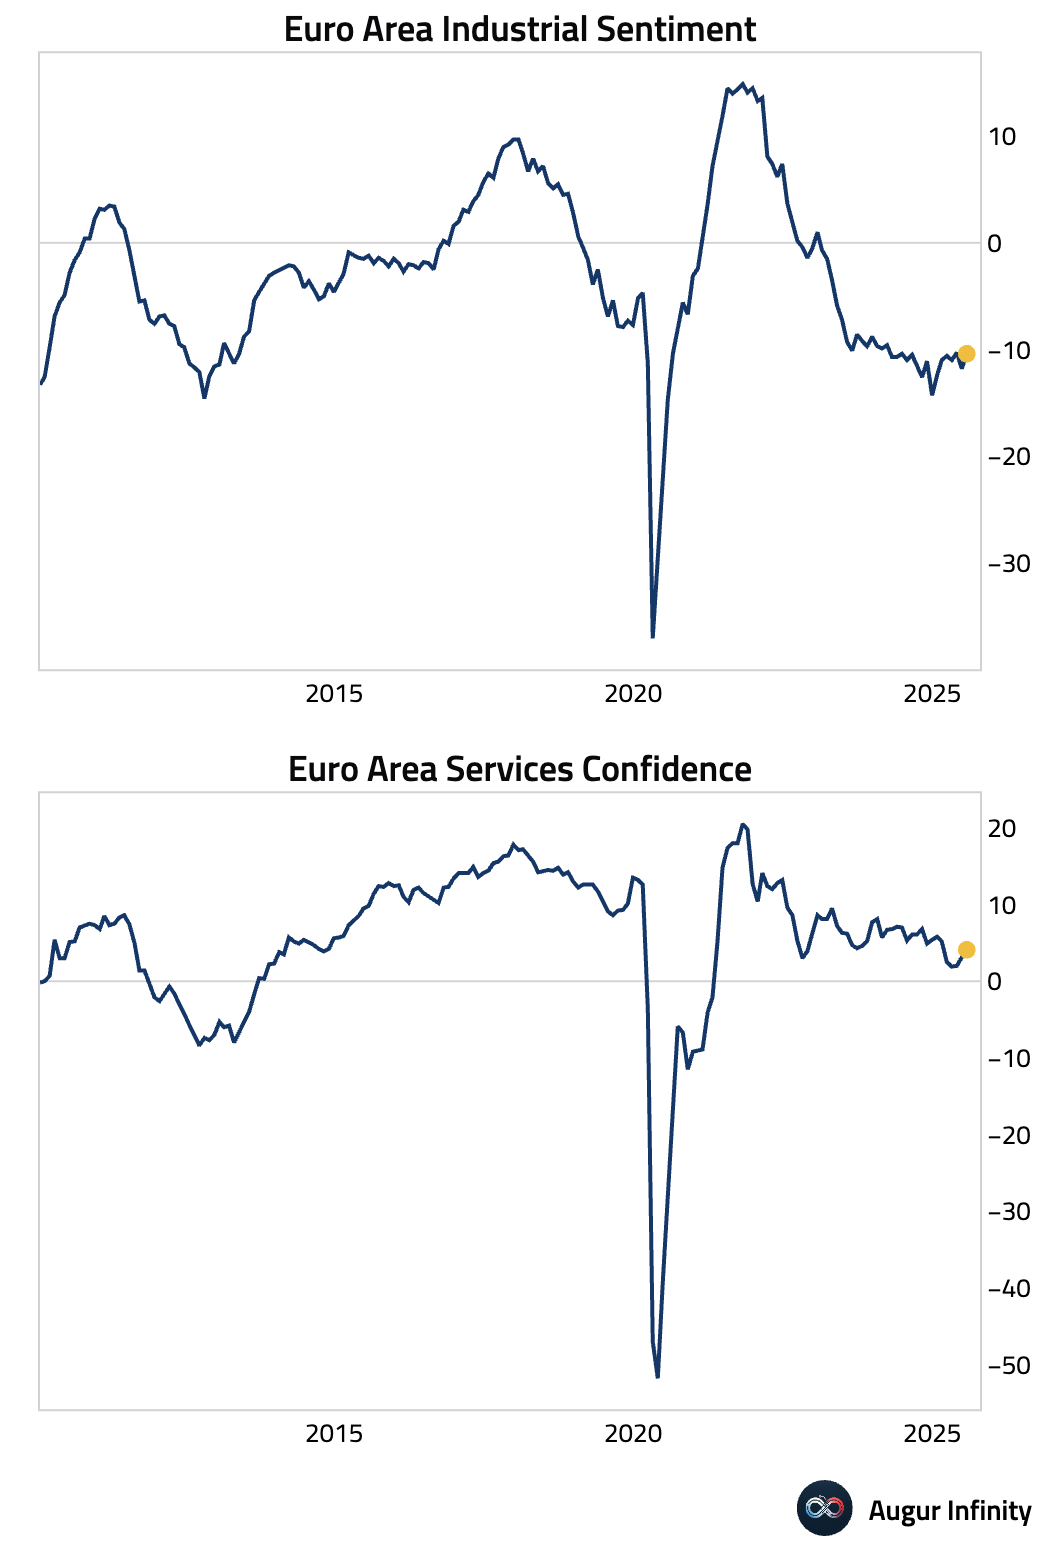
- Eurozone sentiment indicators for July surprised to the upside, with the Economic Sentiment Index rising to 95.8 (consensus: 94.5) from 94.2. The improvement was broad-based, as Industrial Sentiment improved to -10.4 (consensus: -11.0) and Services Sentiment increased to 4.1 (consensus: 3.3).
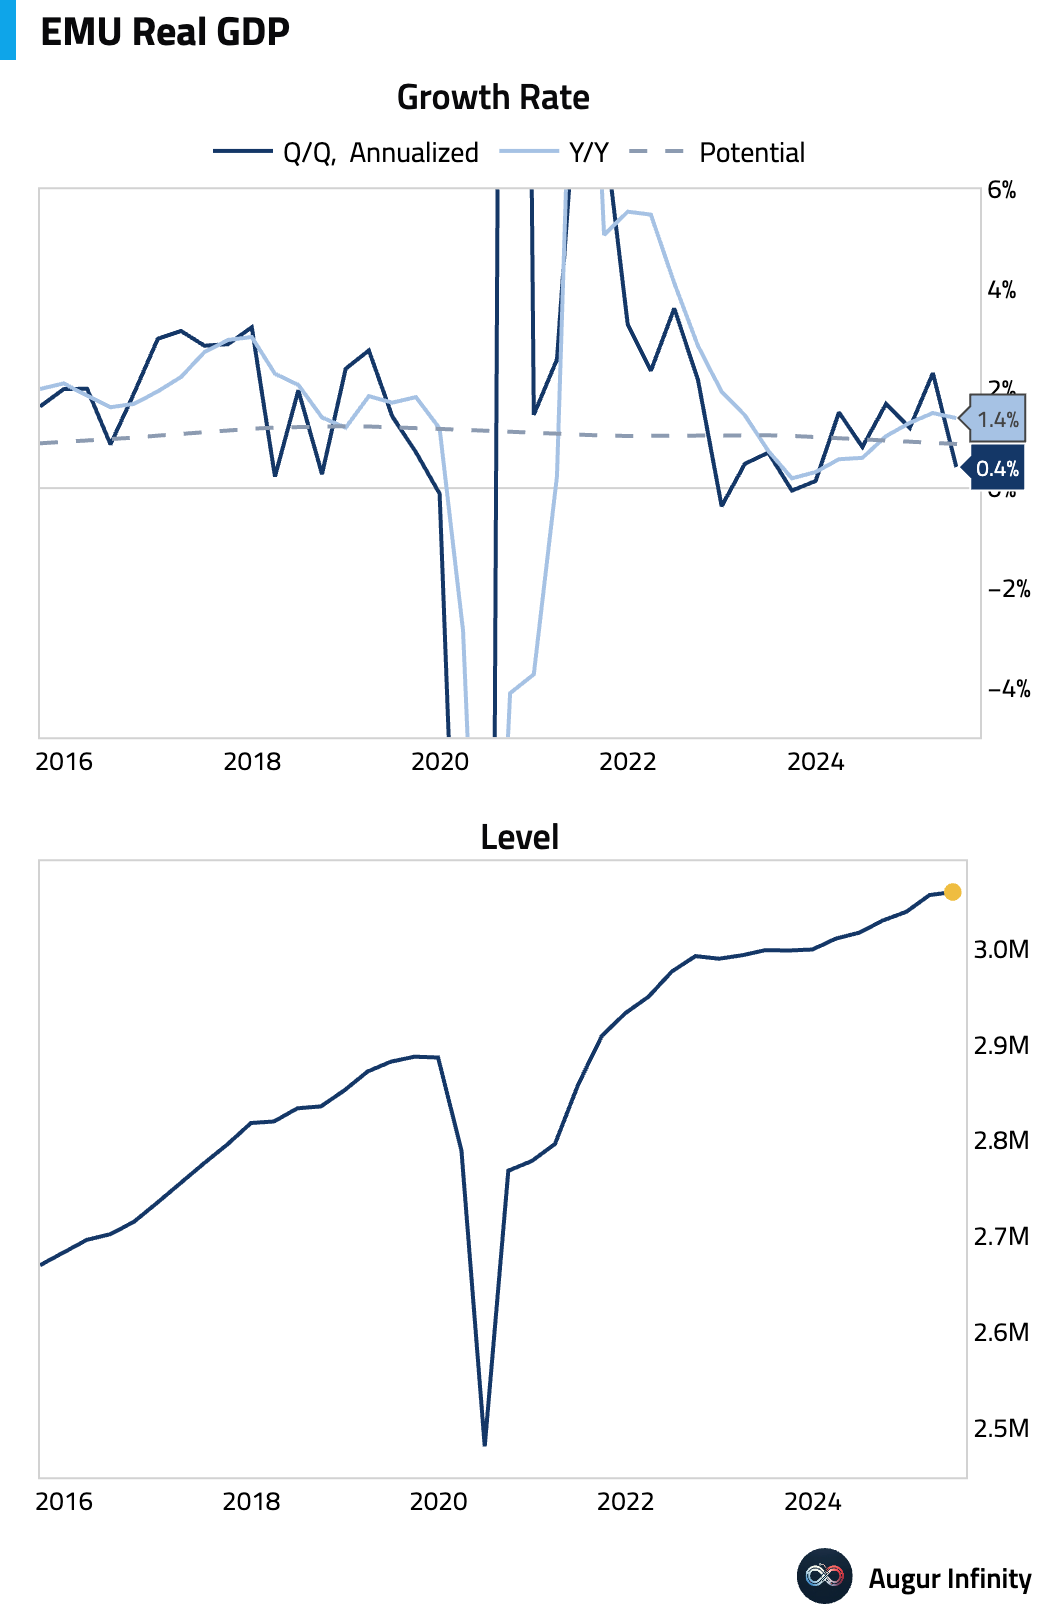
- Flash Q2 GDP for the Eurozone grew 0.1% Q/Q (or 0.4% annualized), slightly ahead of the 0.0% consensus but a sharp deceleration from Q1's 0.6% growth. The annual growth rate was 1.4%. The modest expansion occurred despite a drag from a decline in Irish GDP. Underlying details suggest positive private consumption was offset by contracting investment and a drag from net trade.
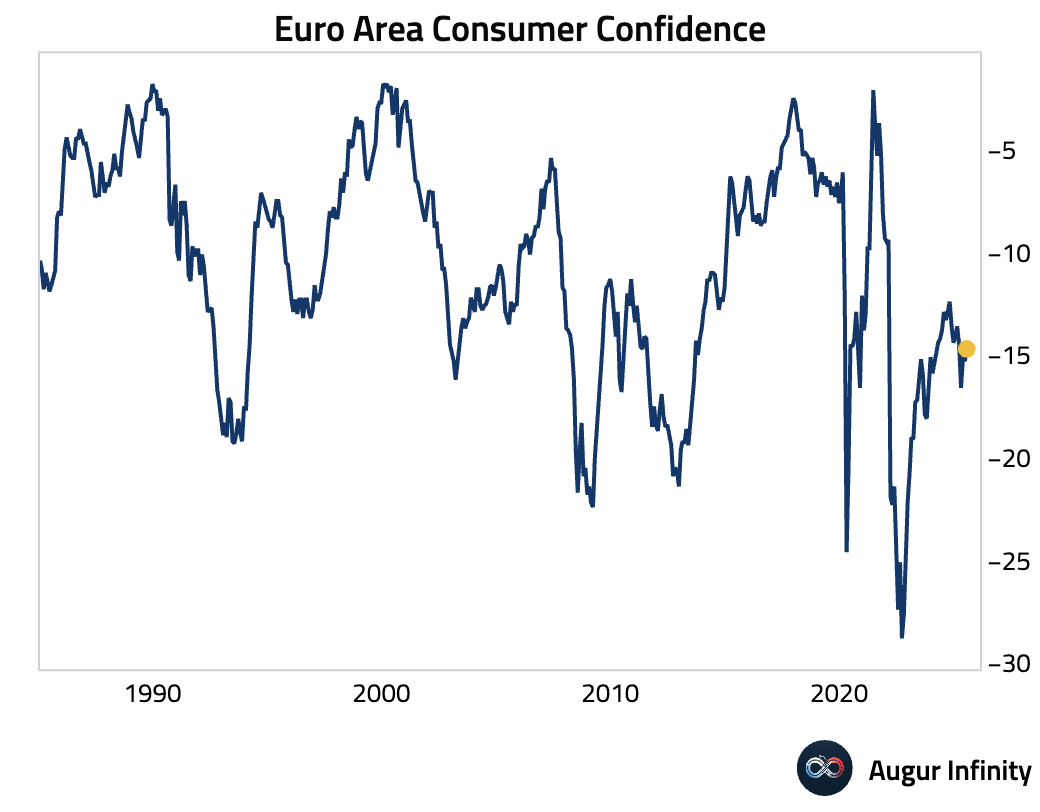
- The final Euro Area Consumer Confidence reading for July was confirmed at -14.7, matching consensus and improving from -15.3 in June.
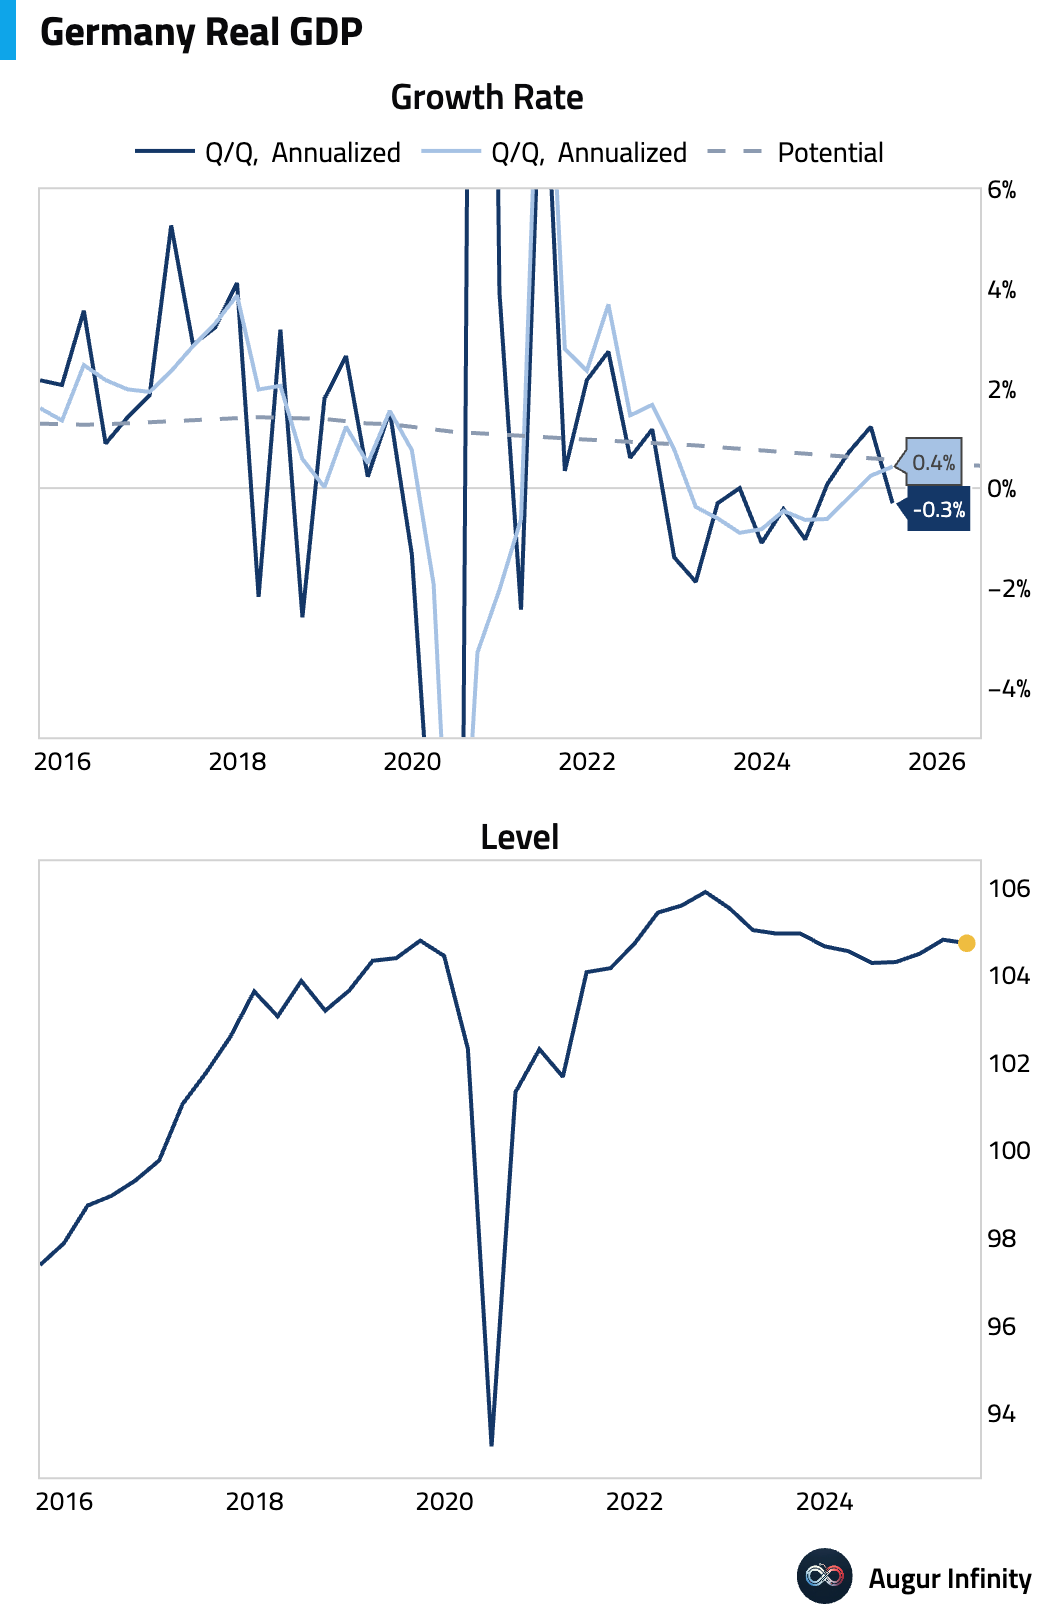
- Germany's economy contracted in the second quarter, with flash GDP falling 0.1% Q/Q, in line with expectations and a reversal from the 0.3% growth seen in Q1. The composition showed a decline in investment, which was offset by positive growth in both household and government consumption. Year-over-year, the economy expanded 0.4%.
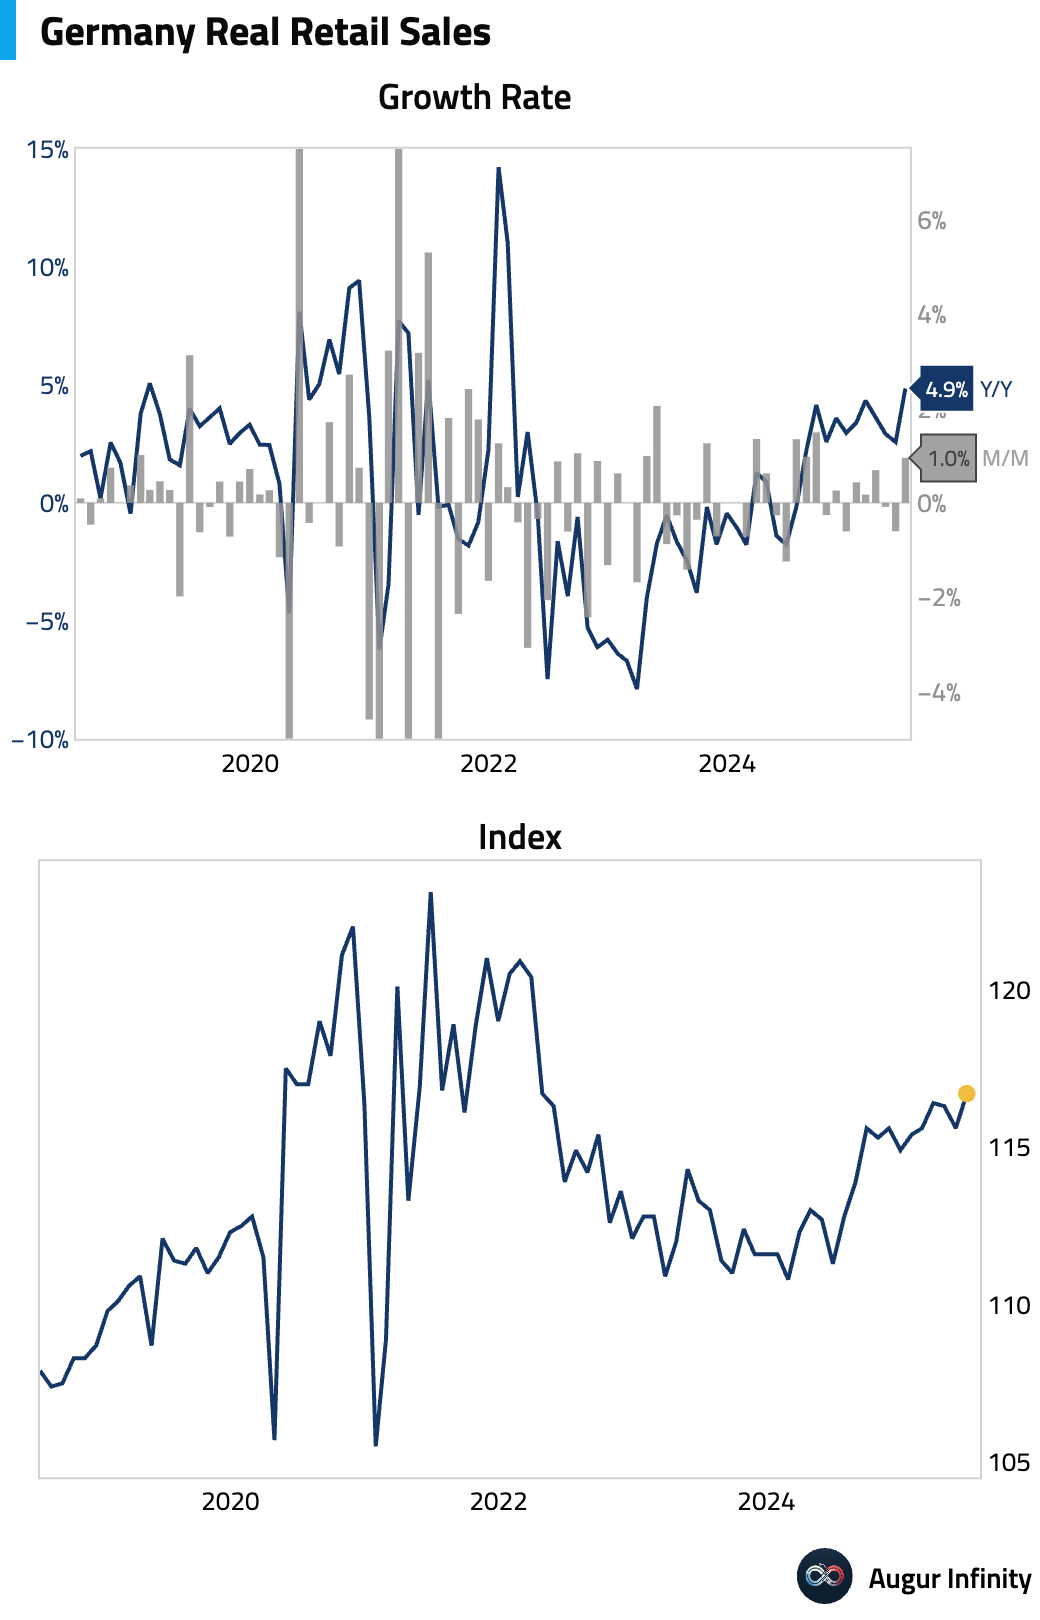
- German retail sales rebounded strongly in June, rising 1.0% M/M and beating the 0.5% consensus. The year-over-year figure surged to 4.9%, its strongest reading since February 2022.
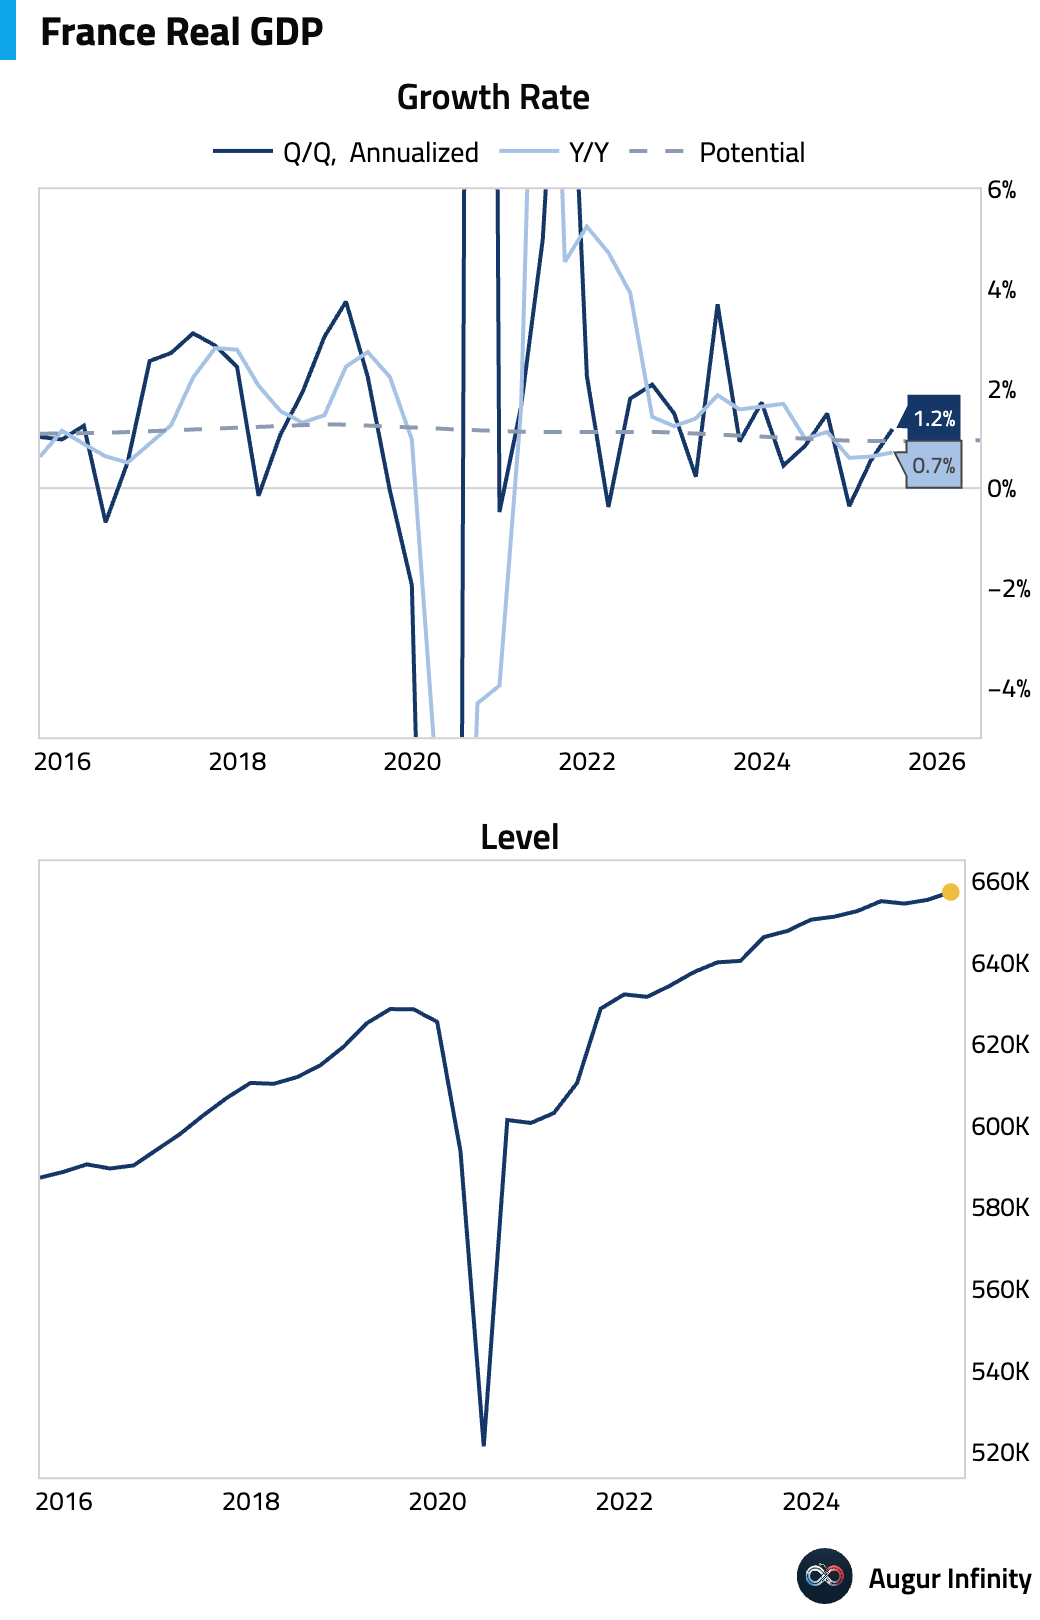
- French Q2 preliminary GDP expanded 0.3% Q/Q (or 1.2% annualized), accelerating from 0.1% in Q1 and surpassing the 0.1% consensus. While the headline figure was strong, the details were soft, as the beat was driven by a large 0.5 percentage point contribution from inventories. This offset flat final domestic demand and a drag from net trade, suggesting weaker underlying activity. The Y/Y growth rate was 0.7%.
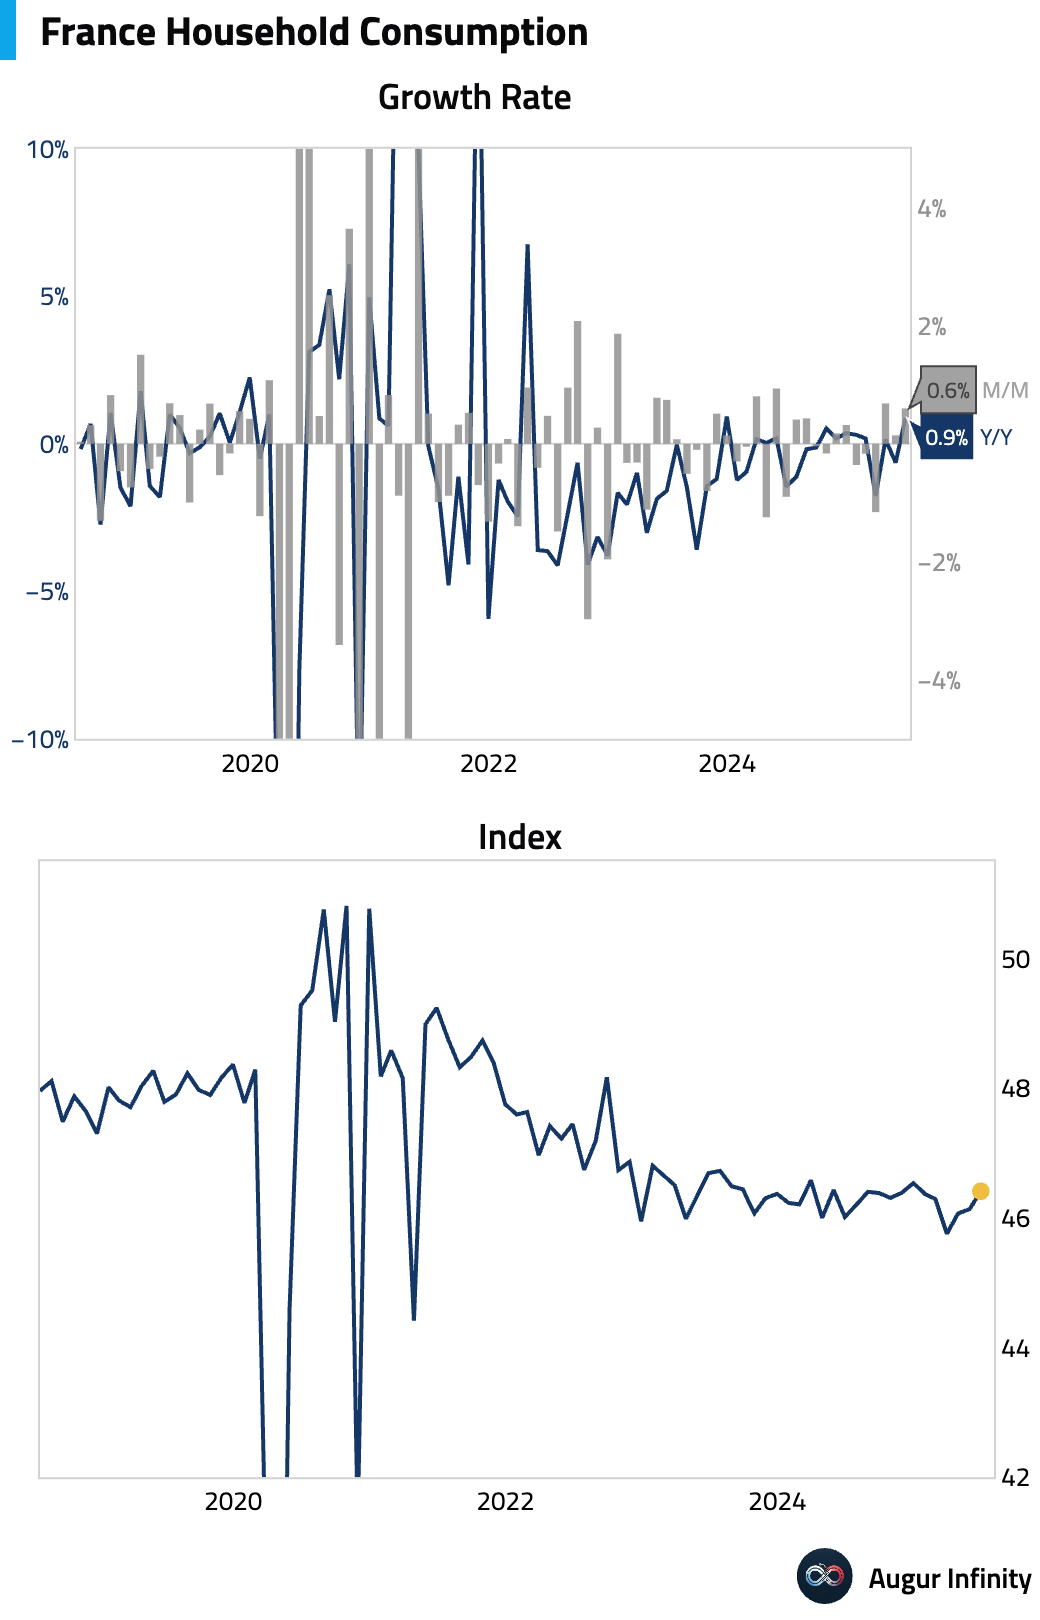
- French household consumption rose 0.6% M/M in June, easily beating the -0.1% consensus and accelerating from May's 0.1% gain. This marks the strongest reading since April 2025.
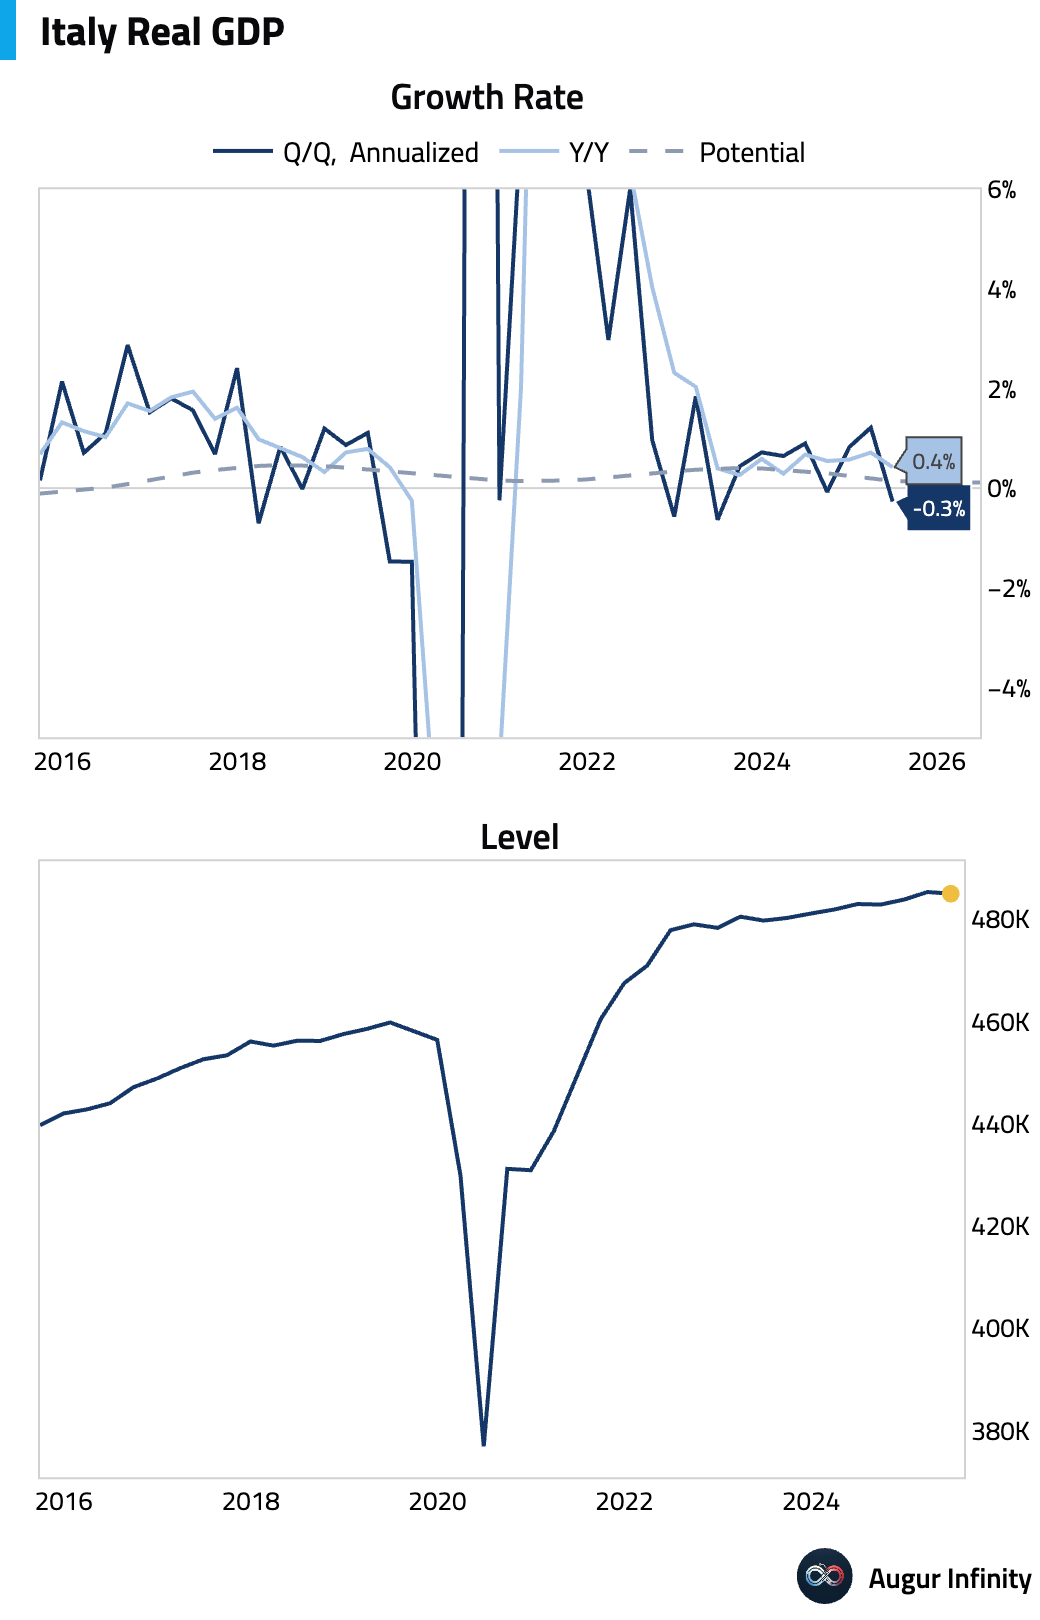
- Italy's economy unexpectedly contracted by 0.1% Q/Q in its advanced Q2 estimate (or -0.3% annualized), missing the consensus forecast for a 0.1% expansion and marking the weakest reading since Q2 2023. The decline was driven by a negative contribution from net exports, with activity falling in the primary and industrial sectors while services remained flat.
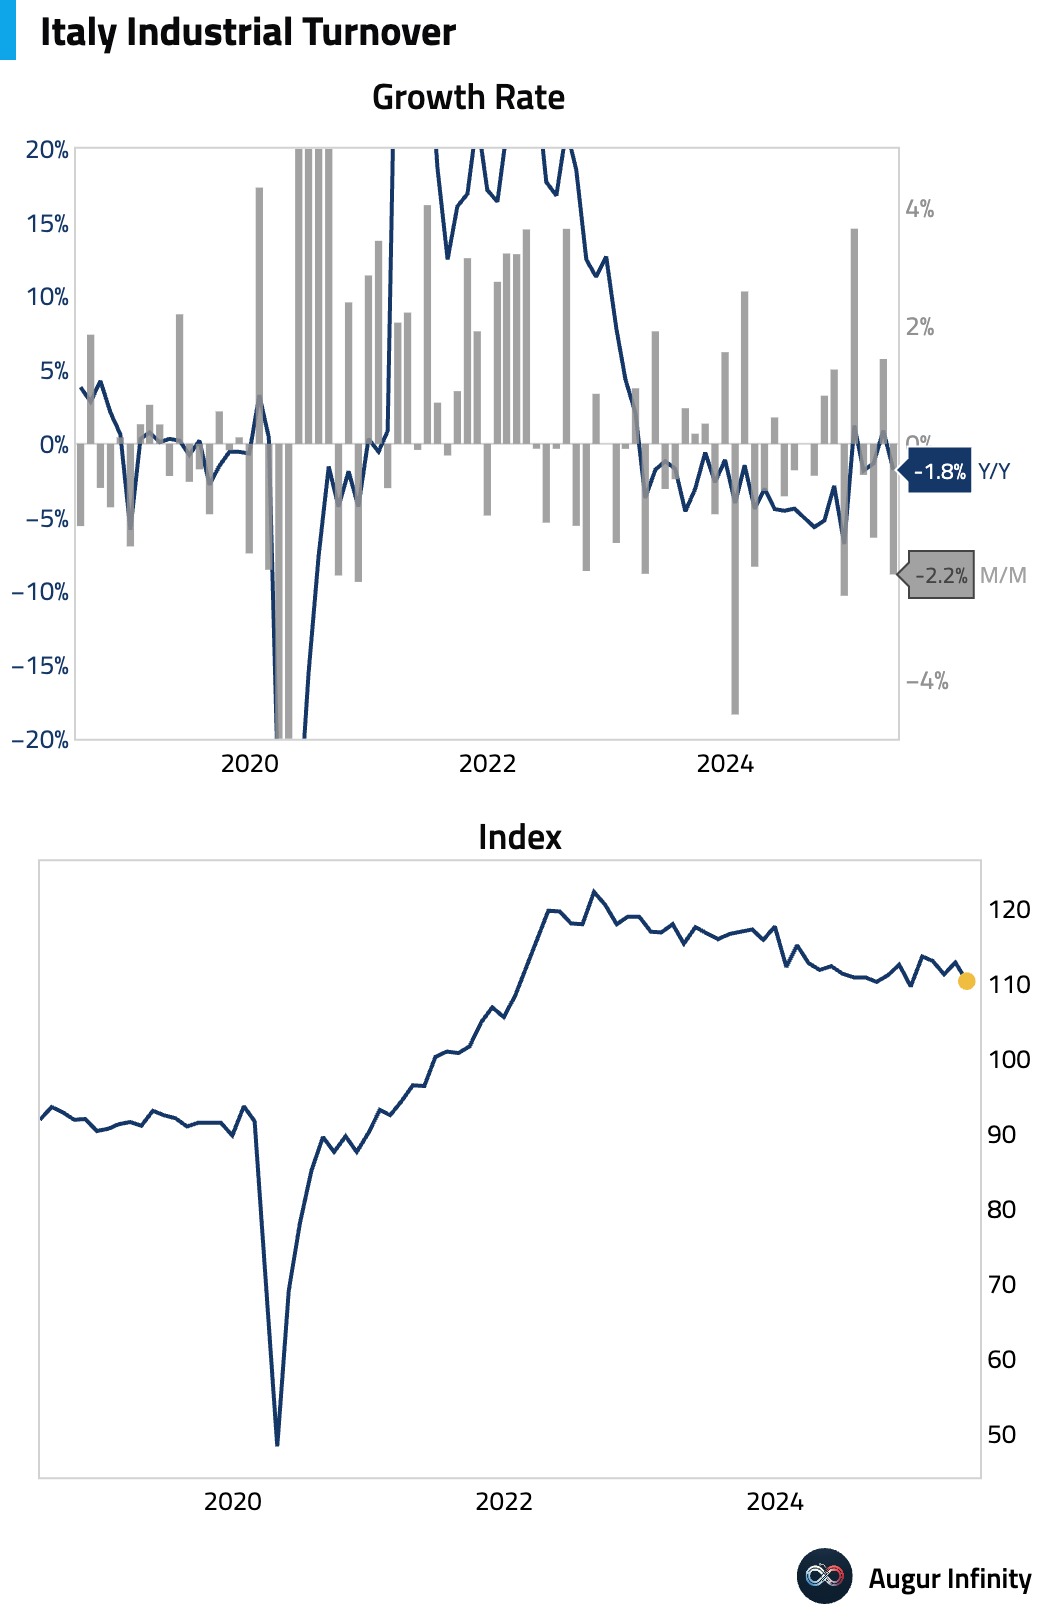
- Italian industrial sales fell sharply in May, dropping 2.2% M/M and 1.8% Y/Y. These were the weakest readings for both metrics since December 2024.
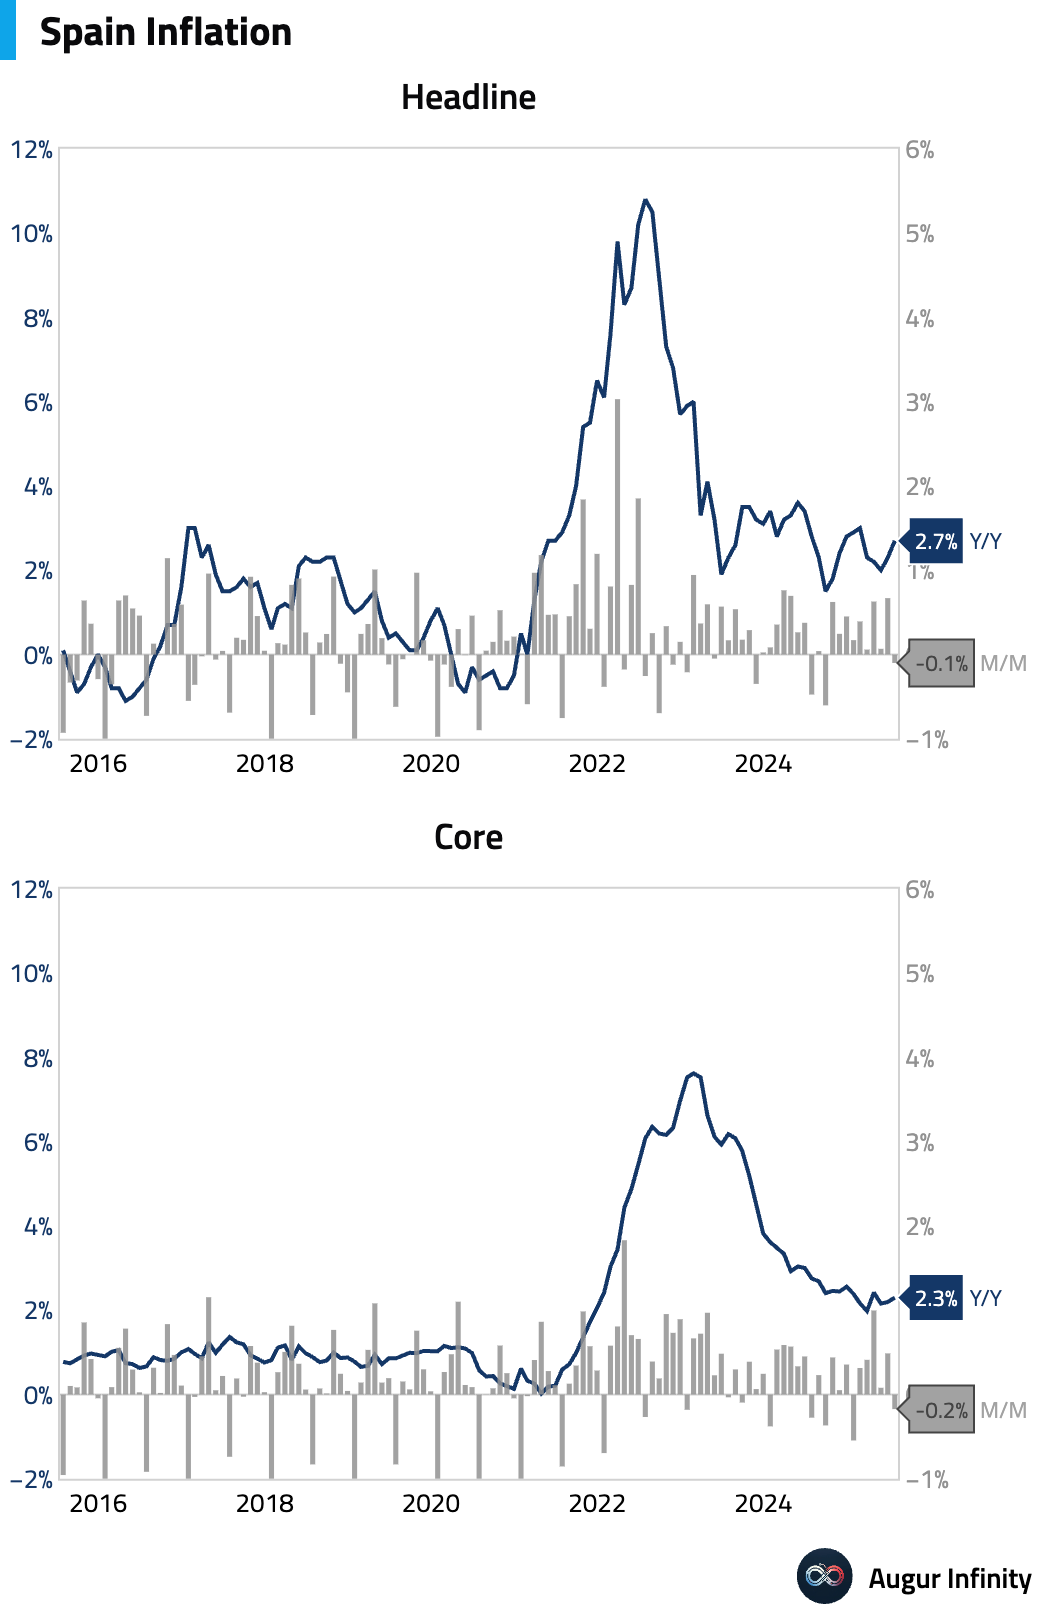
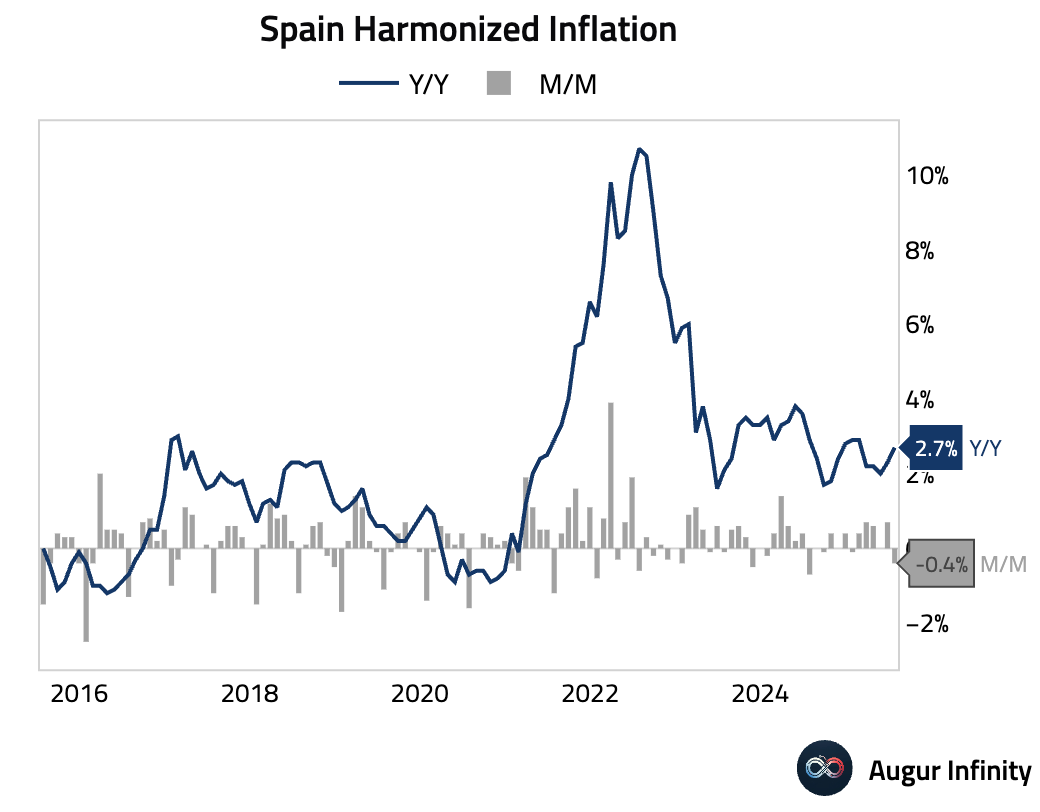
- Spanish preliminary inflation for July was hotter than expected. The headline CPI rose 2.7% Y/Y (vs. 2.6% consensus), driven by higher electricity and fuel prices. More notably, core CPI accelerated to 2.3% Y/Y, defying expectations for a decline, potentially due to the start of transportation subsidy removals. The harmonized index (HICP) also rose 2.7% Y/Y.
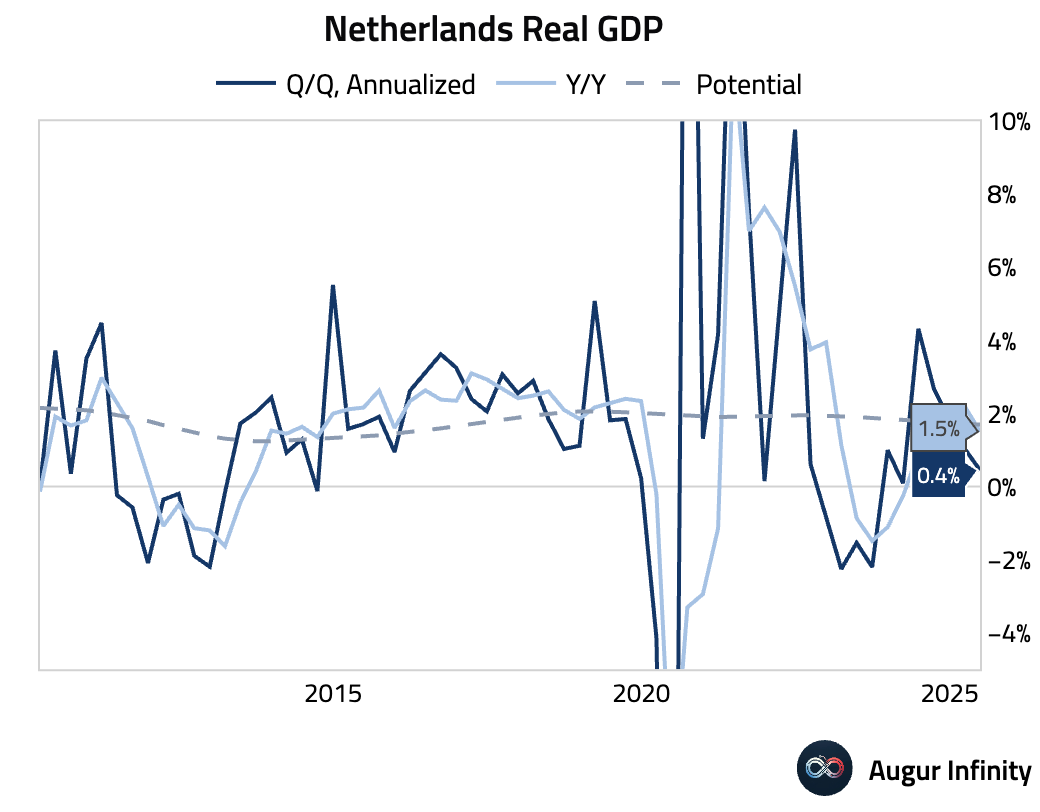
- The Netherlands' flash Q2 GDP growth slowed to 0.1% Q/Q (or 0.4% annualized) from 0.3% in Q1, while the Y/Y rate decelerated to 1.5% from 2.2%, indicating a clear slowdown in economic activity.
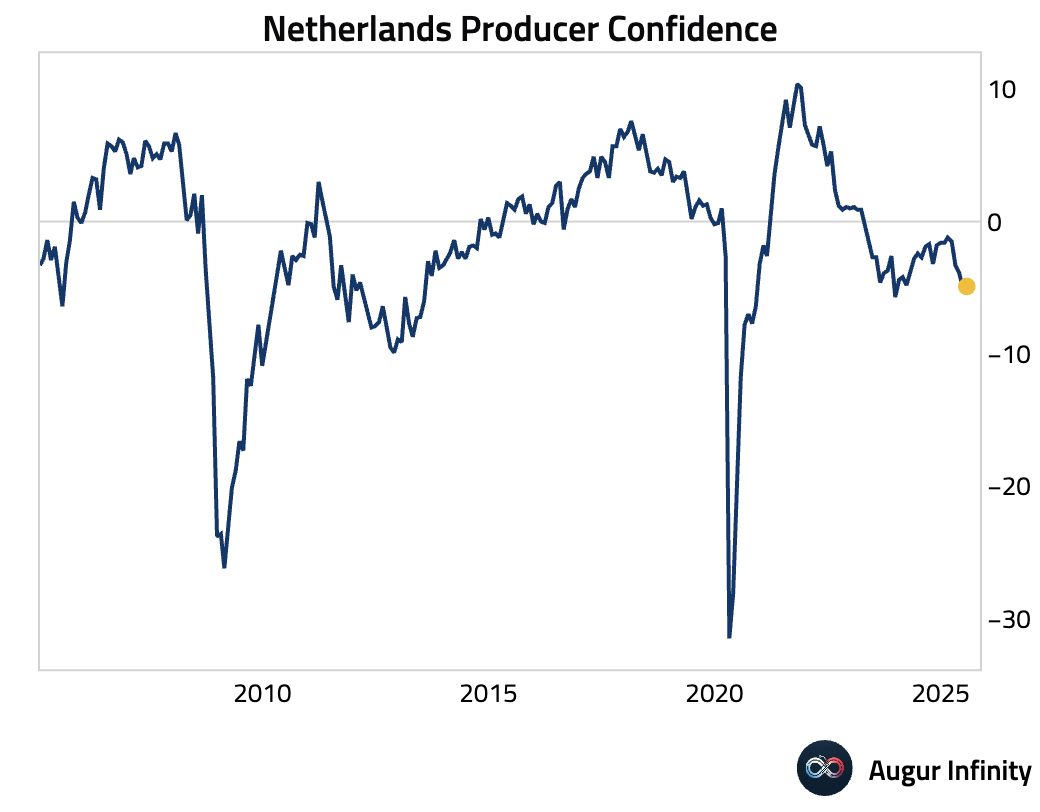
- Dutch business confidence for July edged up slightly to -4.9 from -5.0 in June.
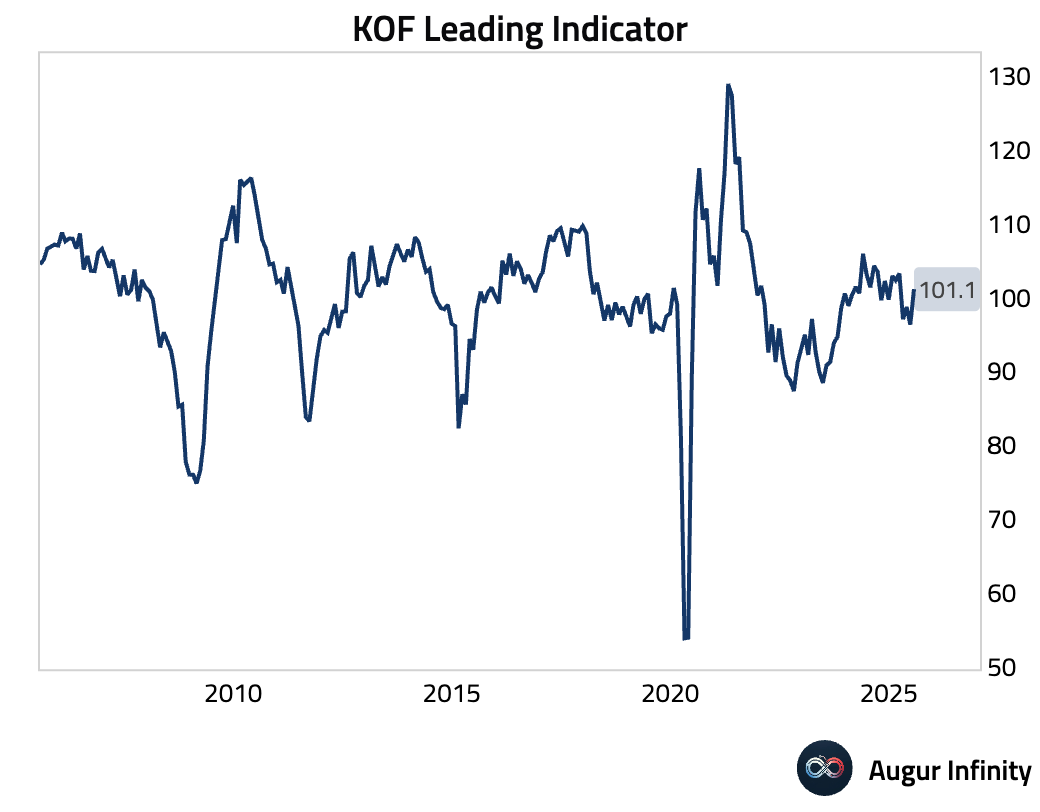
- Switzerland's KOF Leading Indicators jumped to 101.1 in July, well above the 97.5 consensus and up from 96.3 previously, suggesting an improving economic outlook.
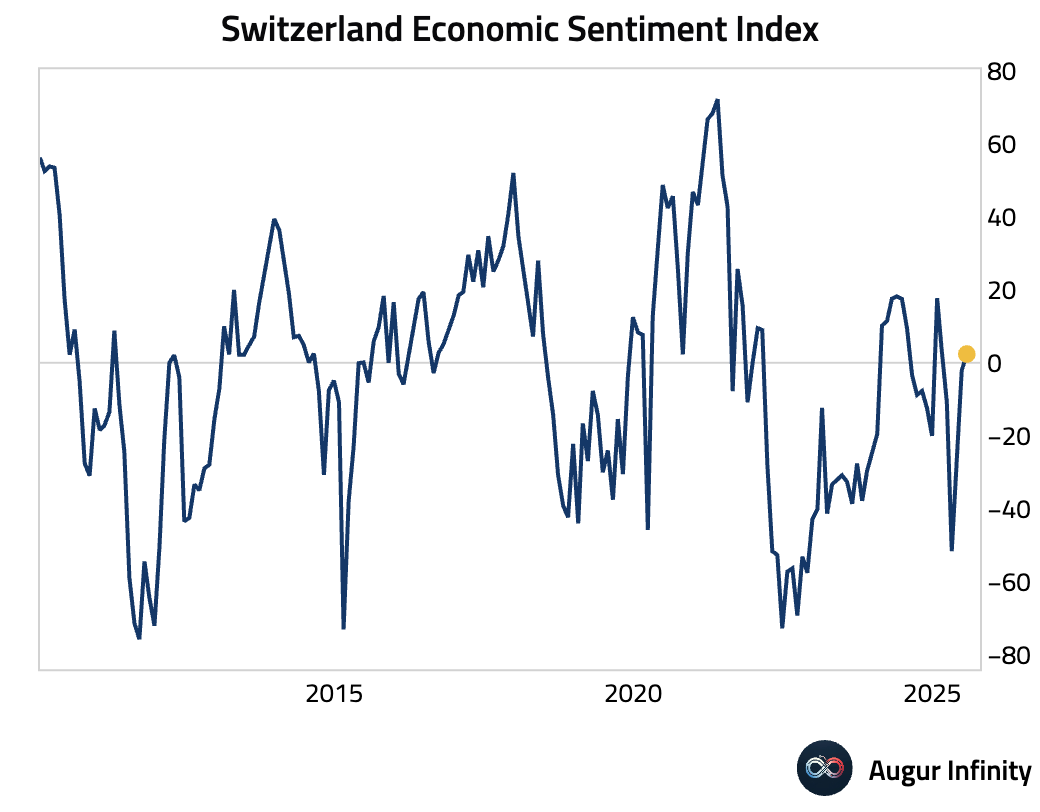
- Swiss Economic Sentiment also surged, turning positive at 2.4 in July from -2.1 in June.
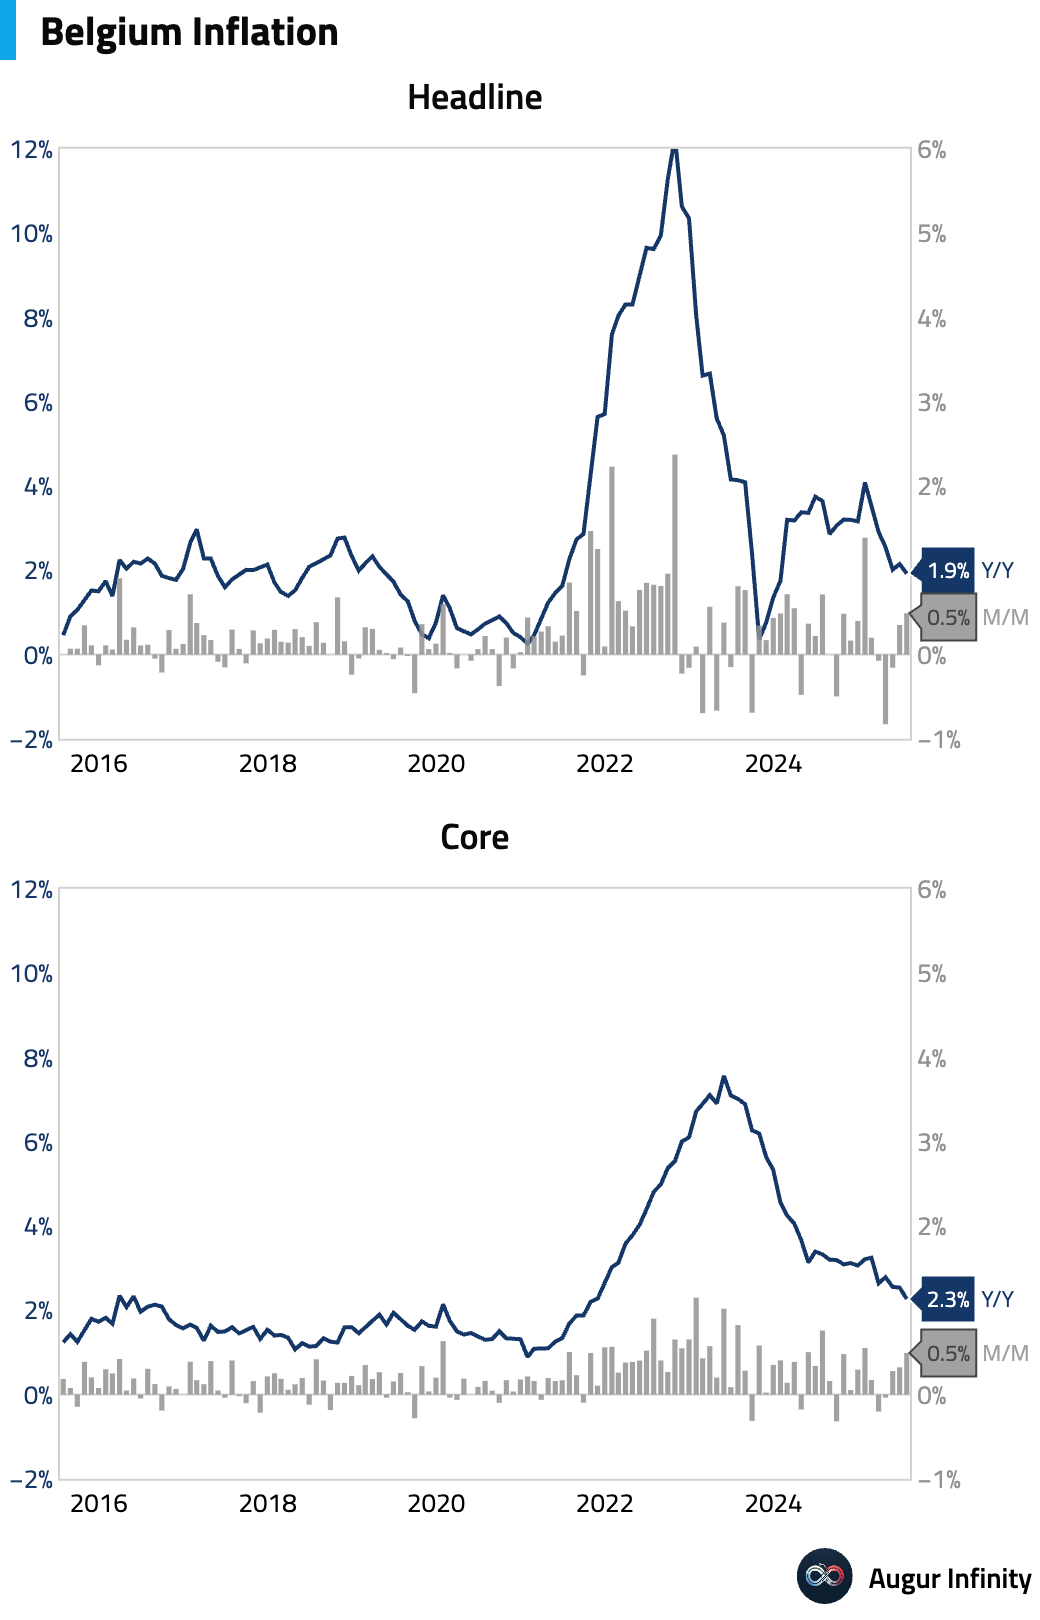
- Belgian inflation for July registered 1.92% Y/Y, down from 2.15% in June. The print was driven by travel, hospitality, and electricity, but underlying inflation softened, with core CPI declining.
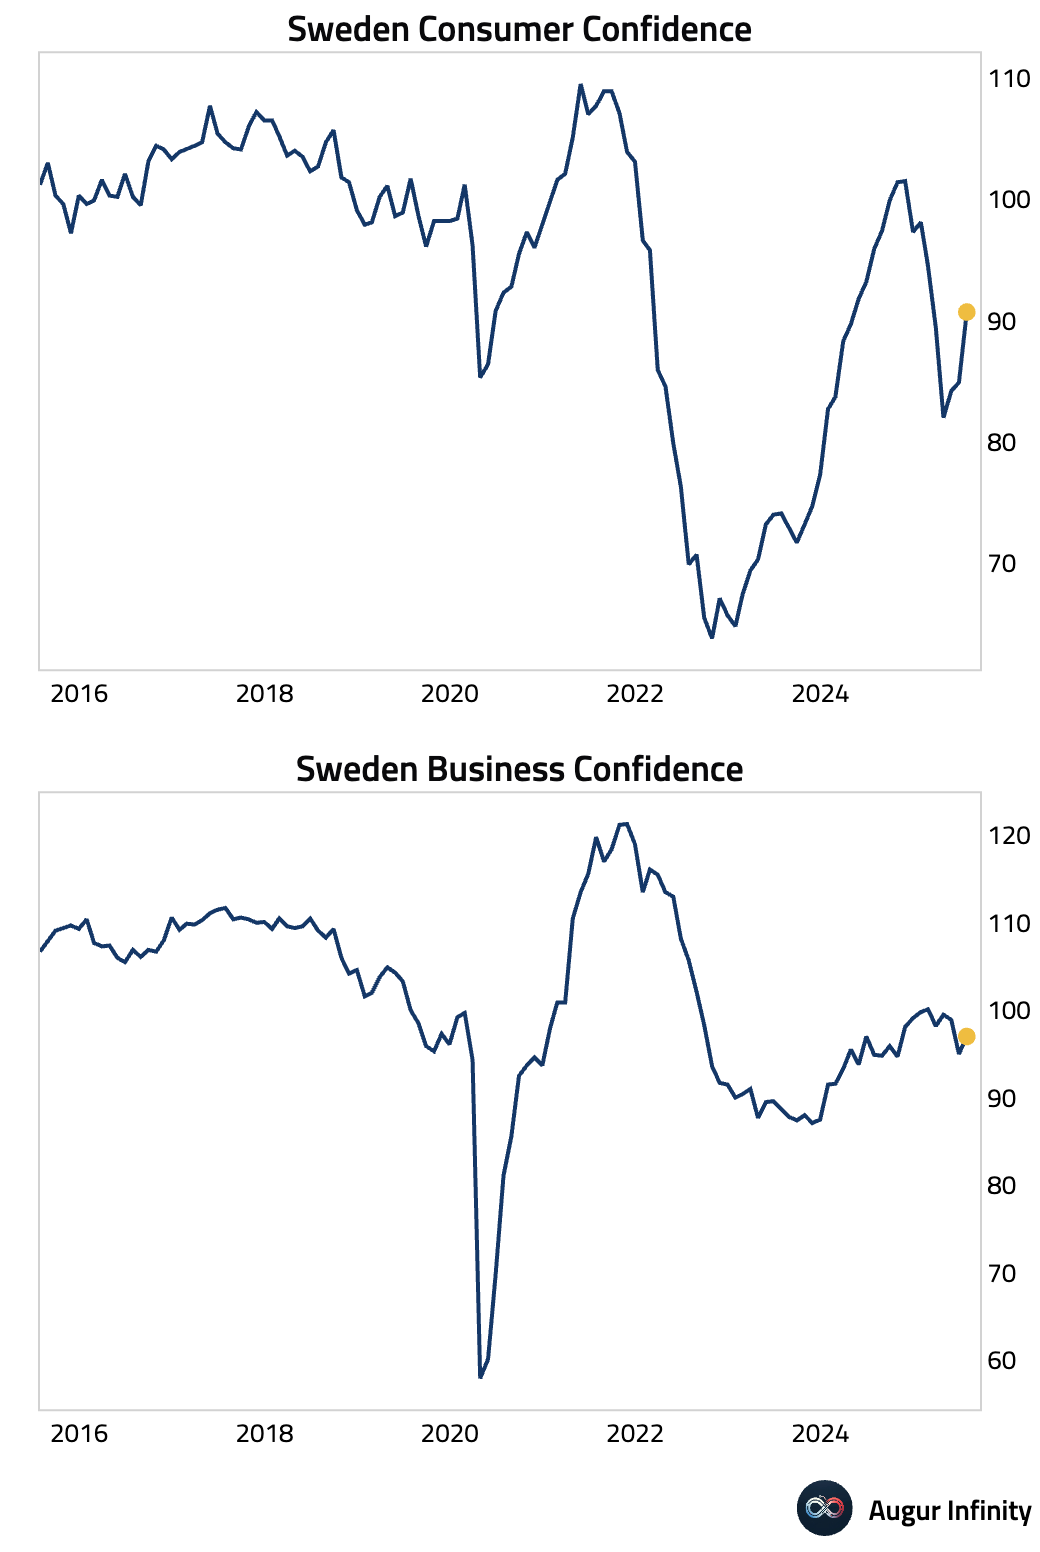
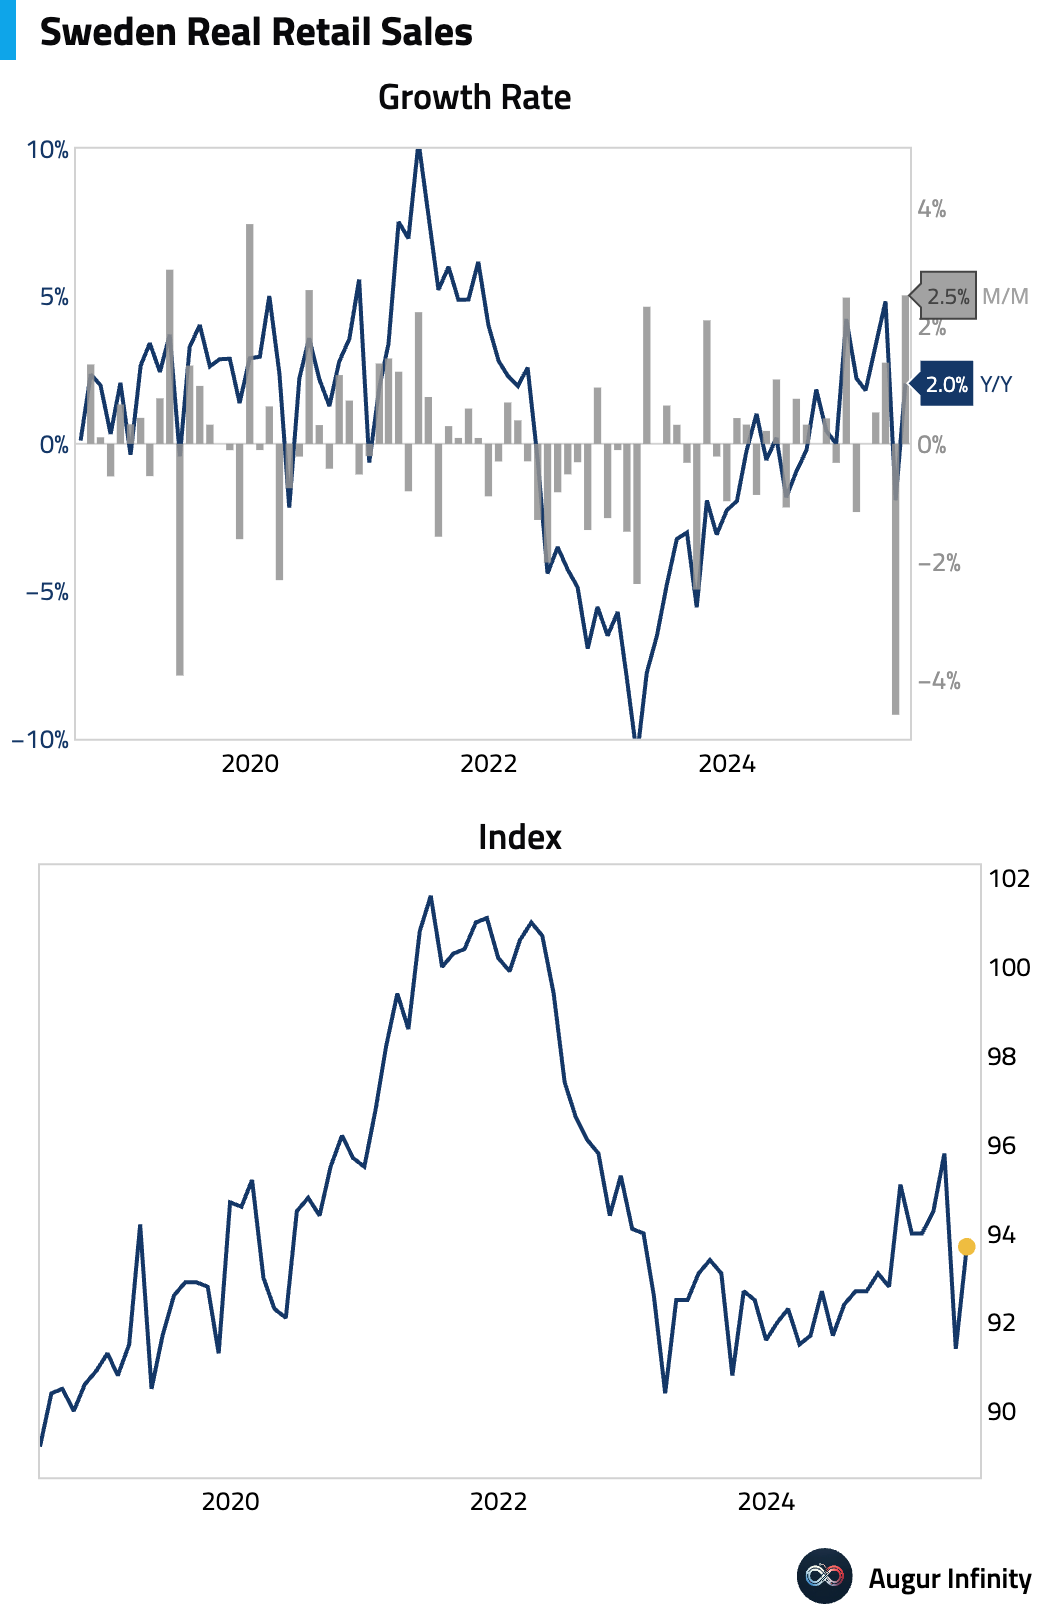
- Swedish economic sentiment improved in July, with both Business Confidence (97.0 vs. 95.0 prior) and Consumer Confidence (90.7 vs. 84.9 prior) rising.
- Swedish retail sales saw a significant rebound in June, rising 2.5% M/M after a 4.6% drop in May. This was the strongest monthly gain since June 2020. The Y/Y rate also turned positive at 2.0%.
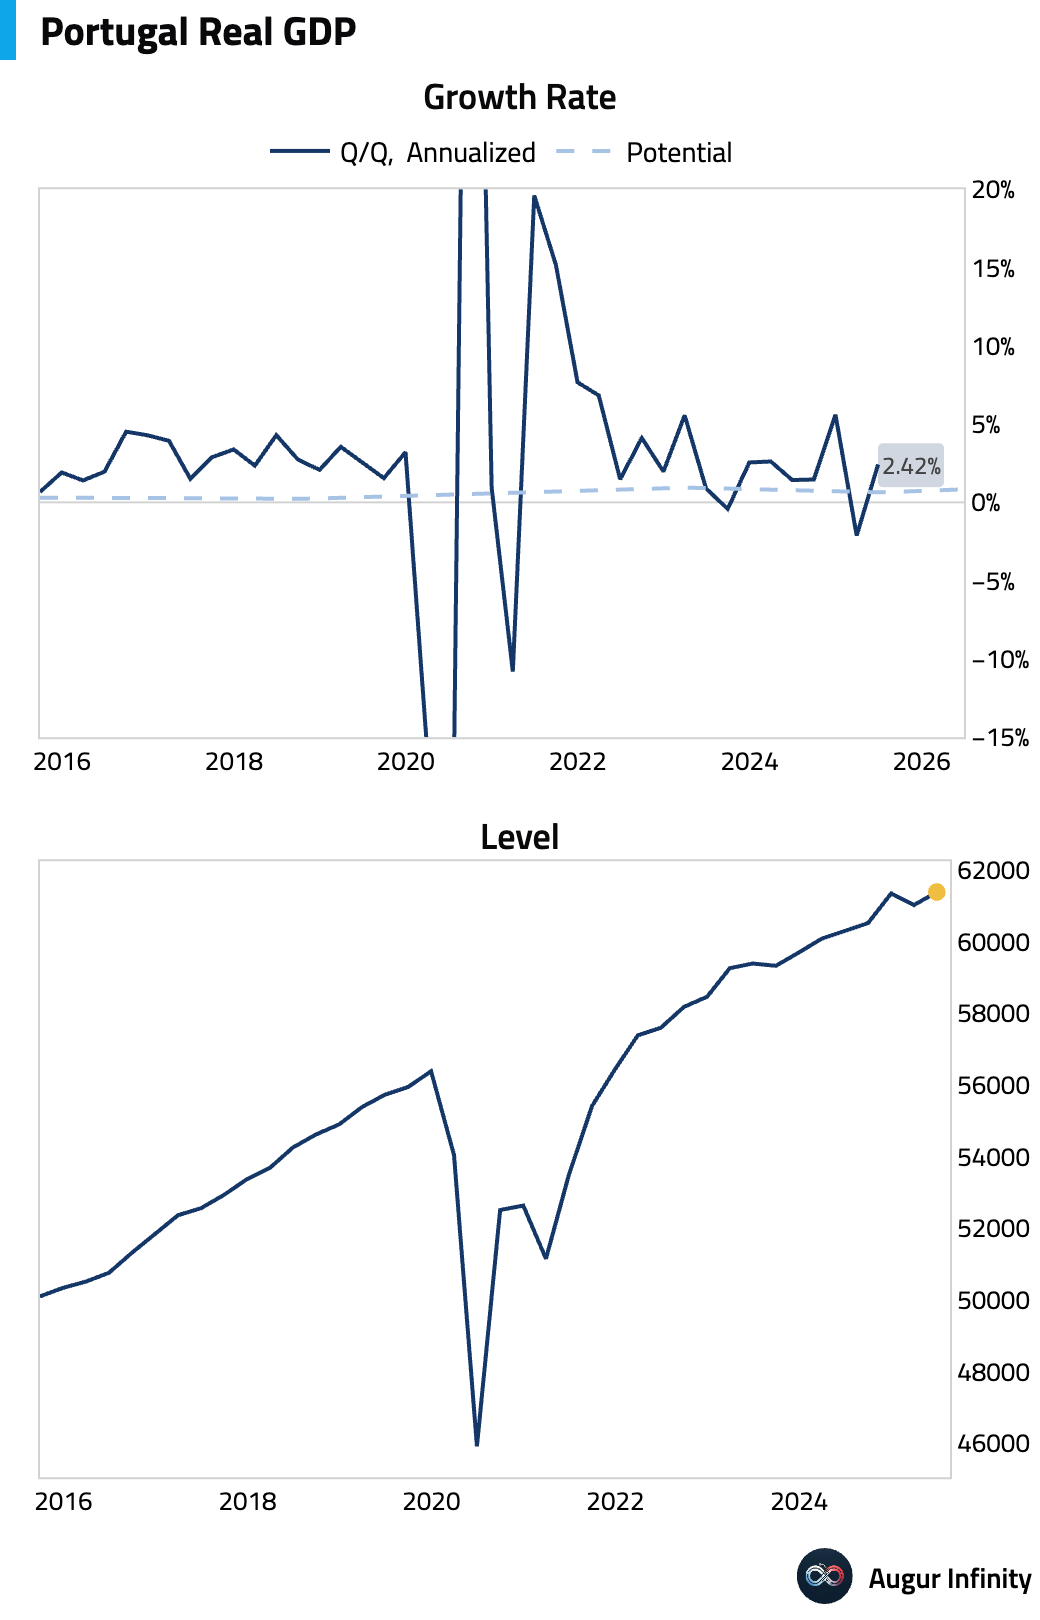
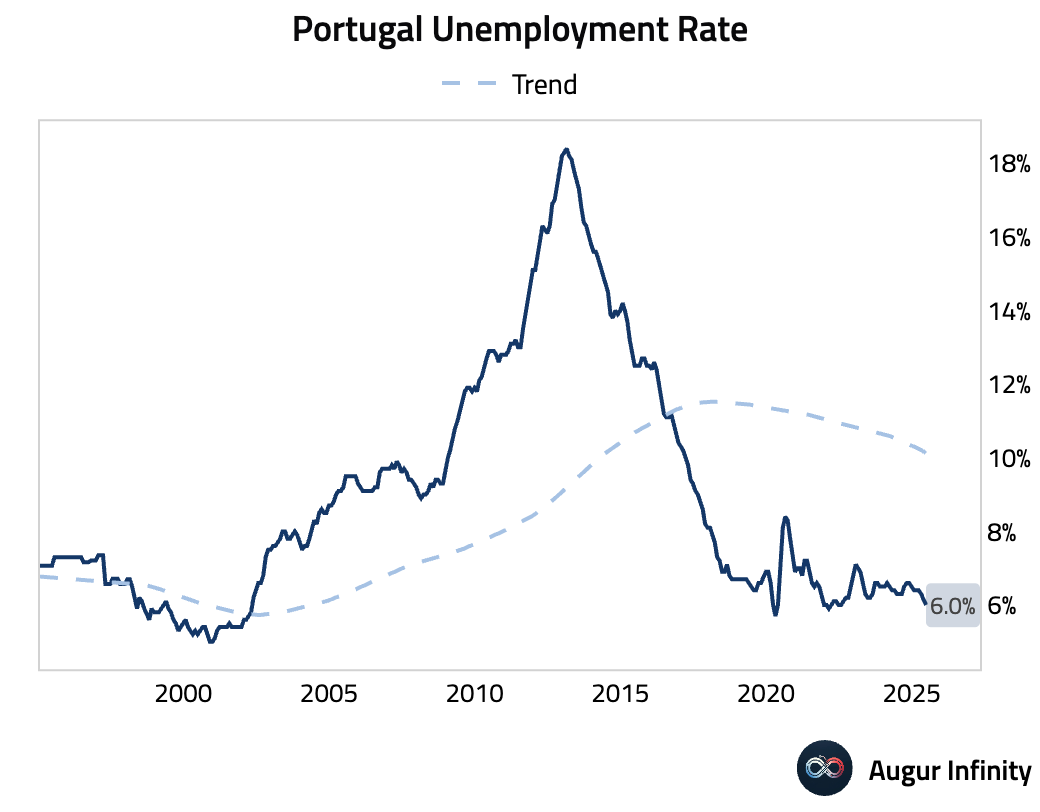
- Portugal's preliminary Q2 GDP showed a 0.6% Q/Q expansion, reversing the 0.4% contraction in Q1. The unemployment rate for June also ticked down to 6.0% from 6.1%.
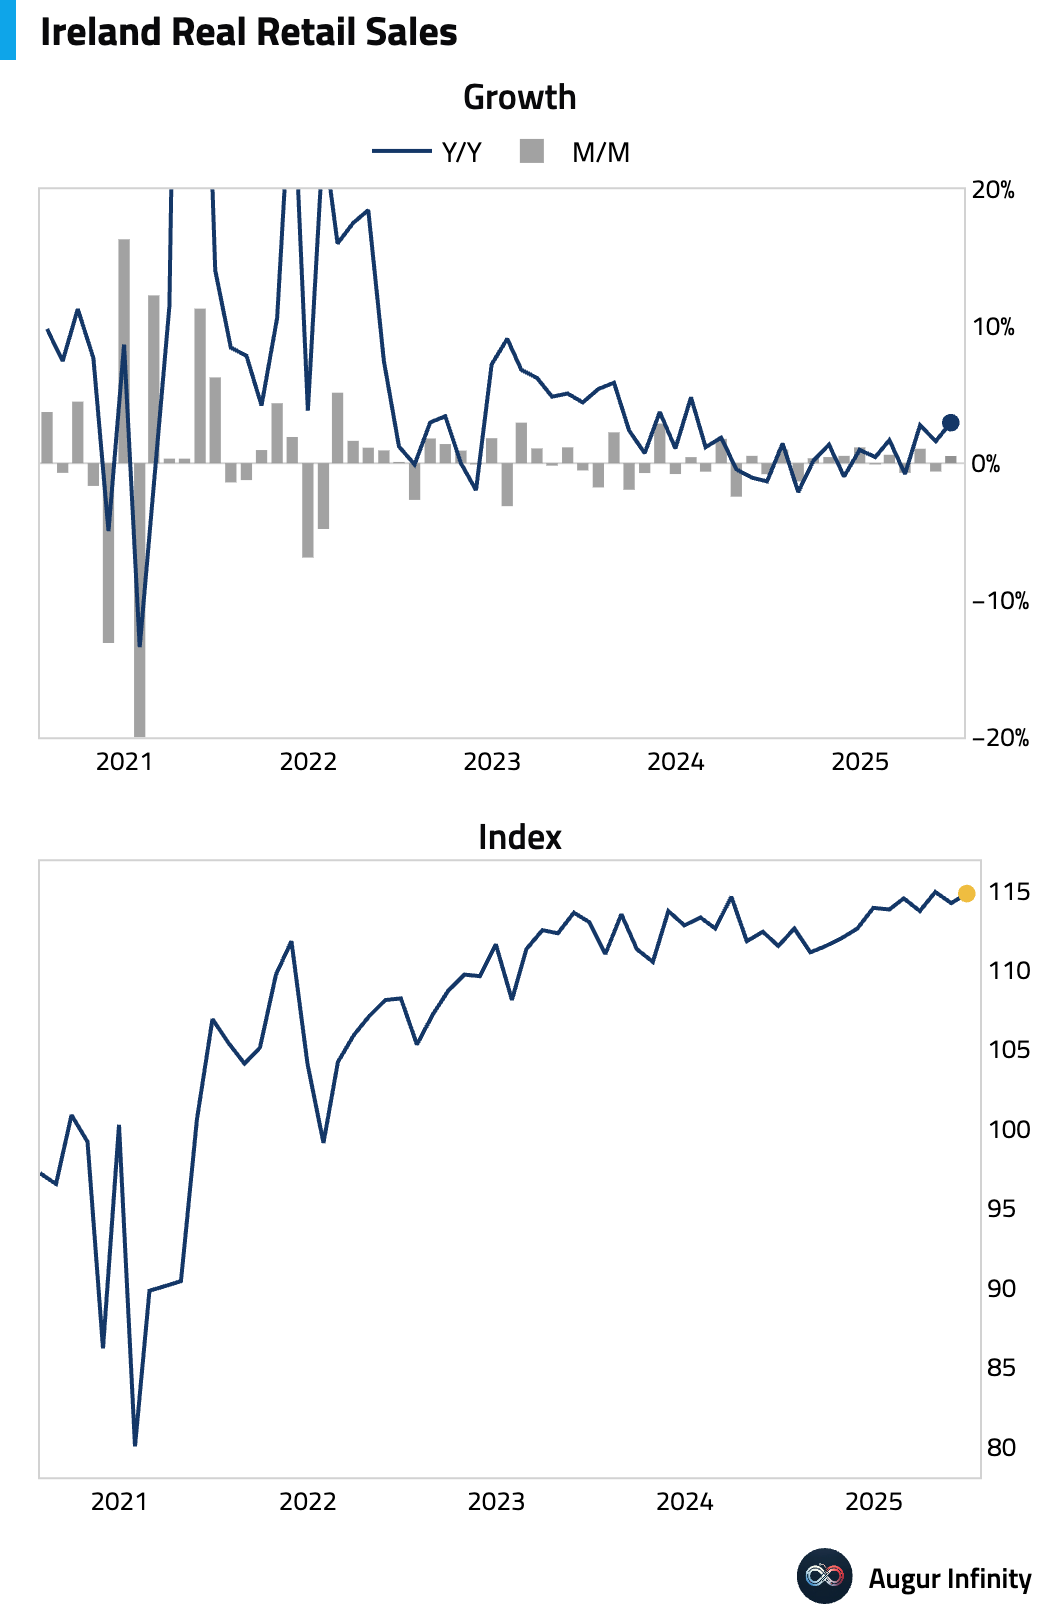
- Irish retail sales recovered in June, rising 0.6% M/M and 3.0% Y/Y.
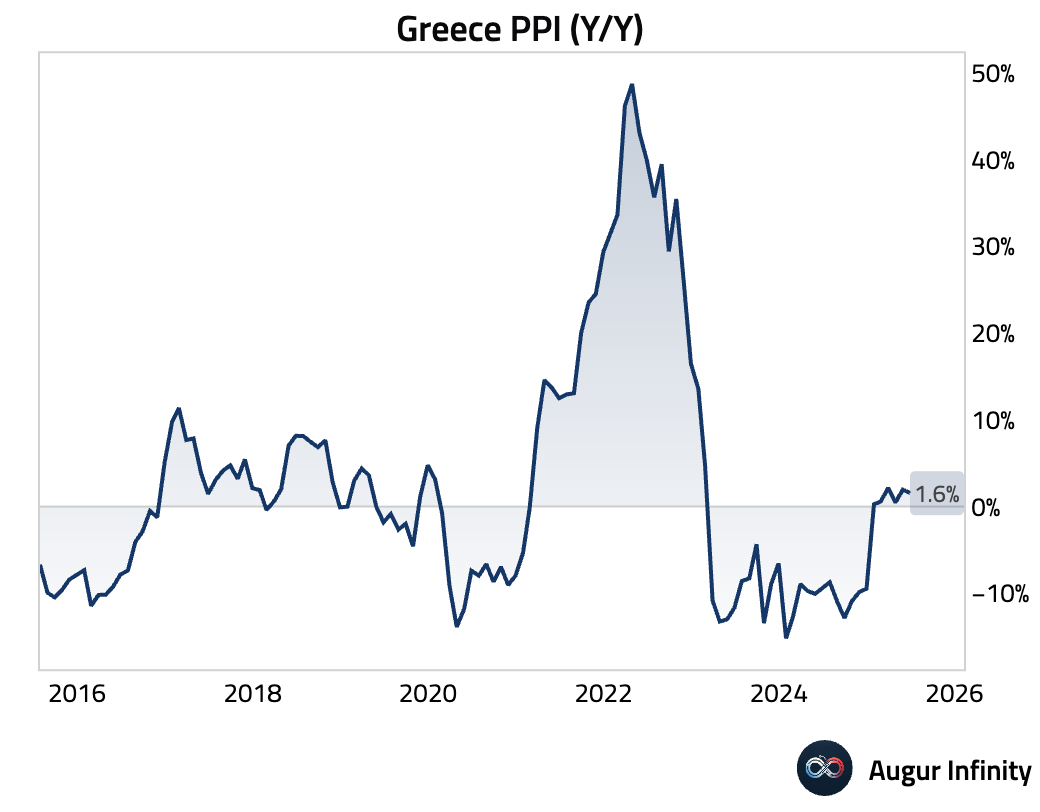
- Greek PPI inflation slowed in June, with the Y/Y rate falling to 1.6% from 2.0% in May.
Asia-Pacific
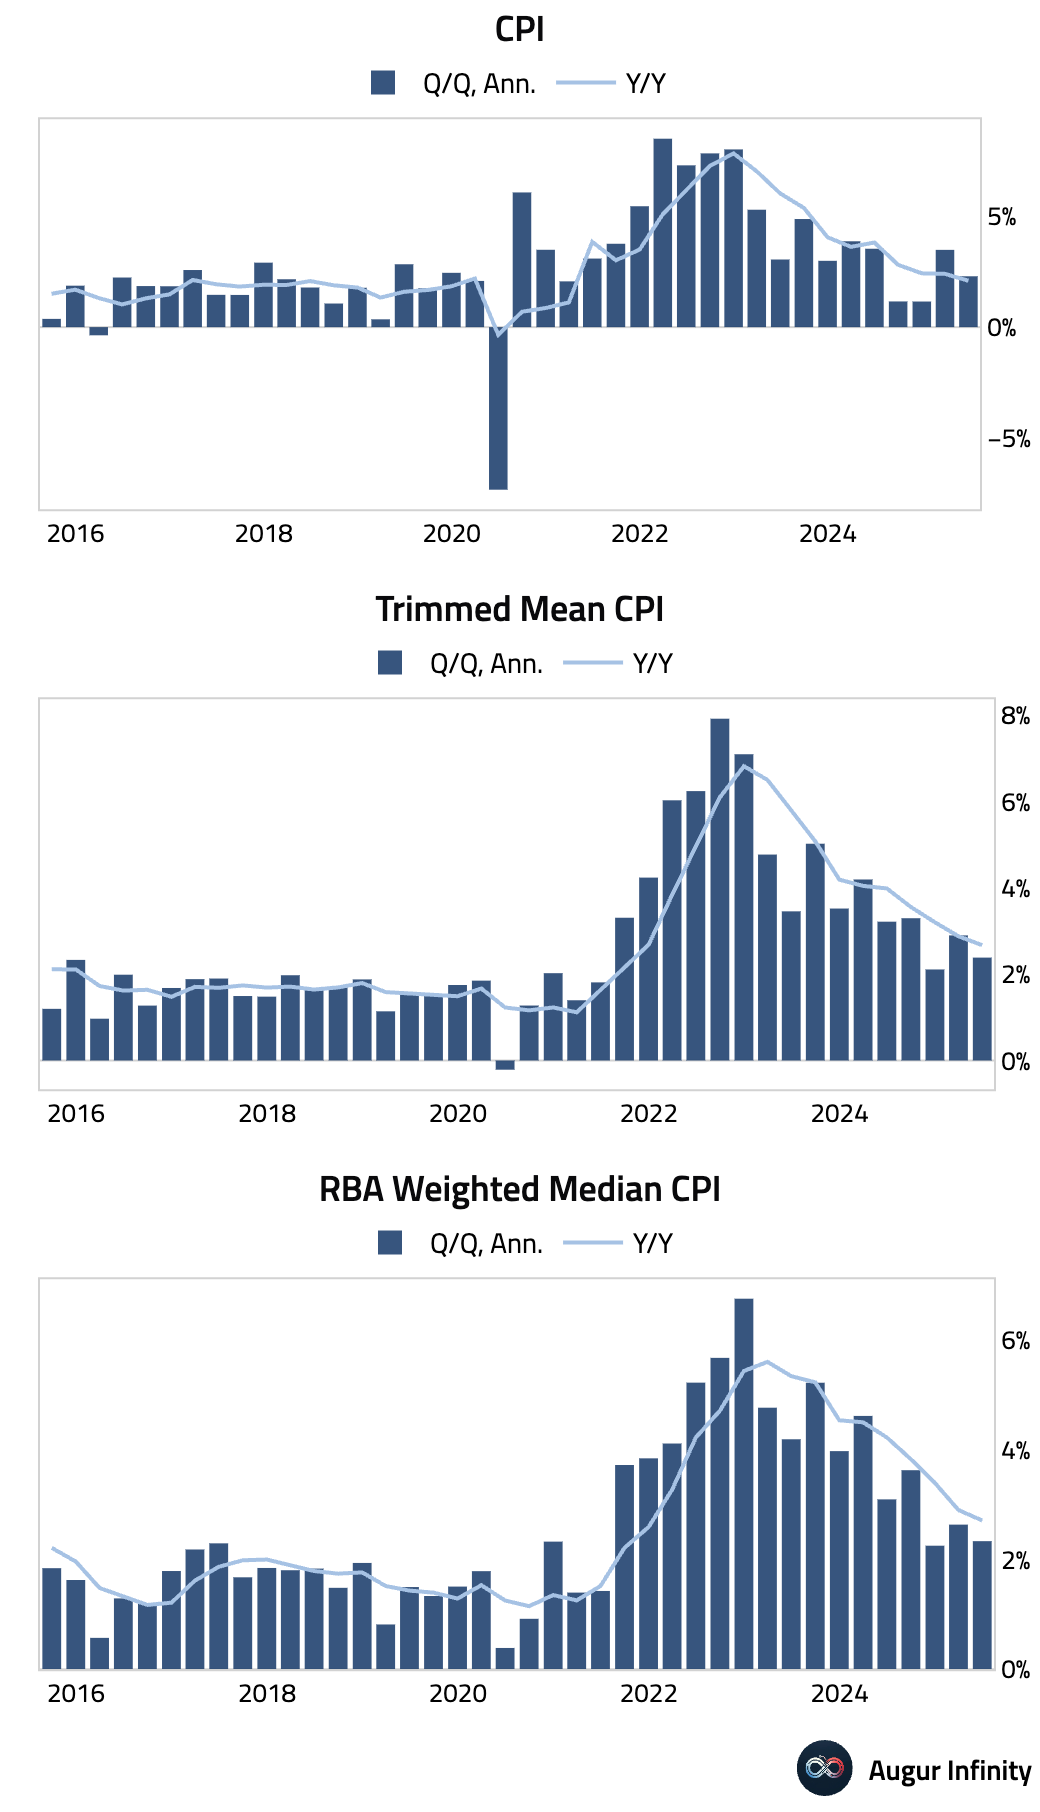
- Australian Q2 inflation data confirmed that the disinflation trend is intact. Headline CPI rose 0.7% Q/Q and 2.1% Y/Y, landing near the bottom of the RBA's 2-3% target band. Core measures were even softer, with the Trimmed Mean CPI rising 0.6% Q/Q and 2.7% Y/Y, the slowest annual pace since late 2021. The composition was encouraging, with wage-sensitive market services inflation slowing. The data strengthens the case for the RBA to ease, possibly as soon as August.
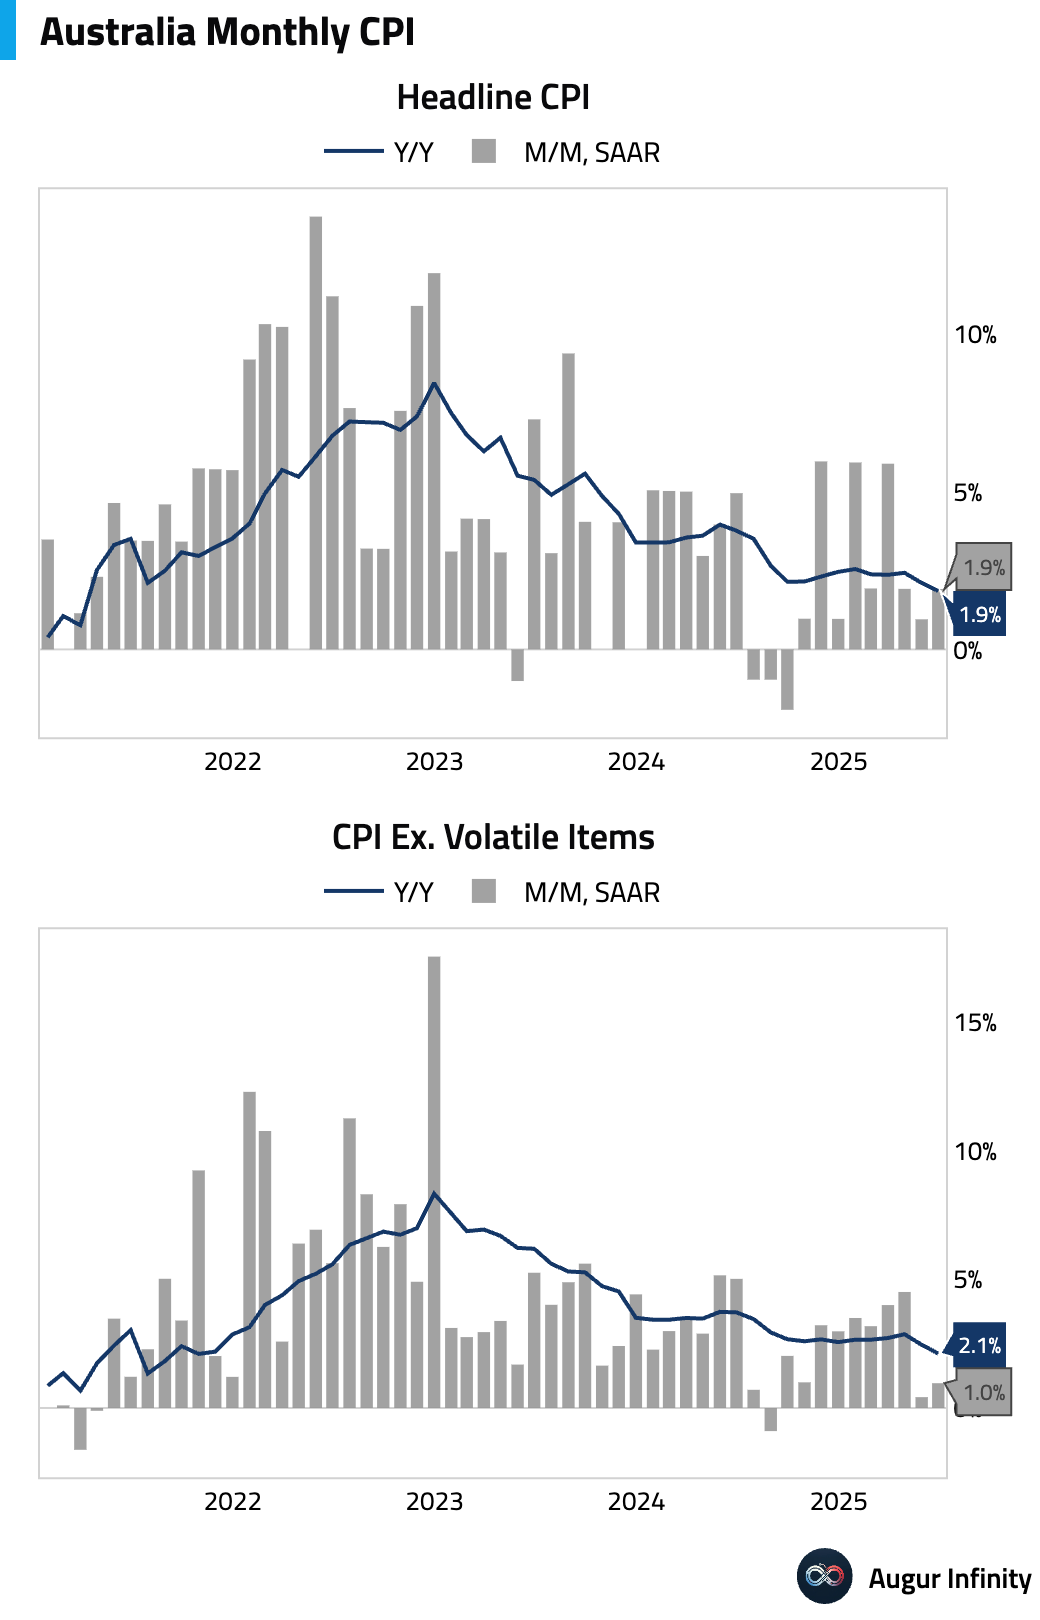
- The monthly CPI indicator for Australia showed a significant downside surprise in June, falling to 1.9% Y/Y (vs. 2.1% consensus), its weakest reading since March 2021. The miss was driven by softer prices for holiday travel, clothing, and pharmaceuticals, pointing to broad disinflationary momentum.
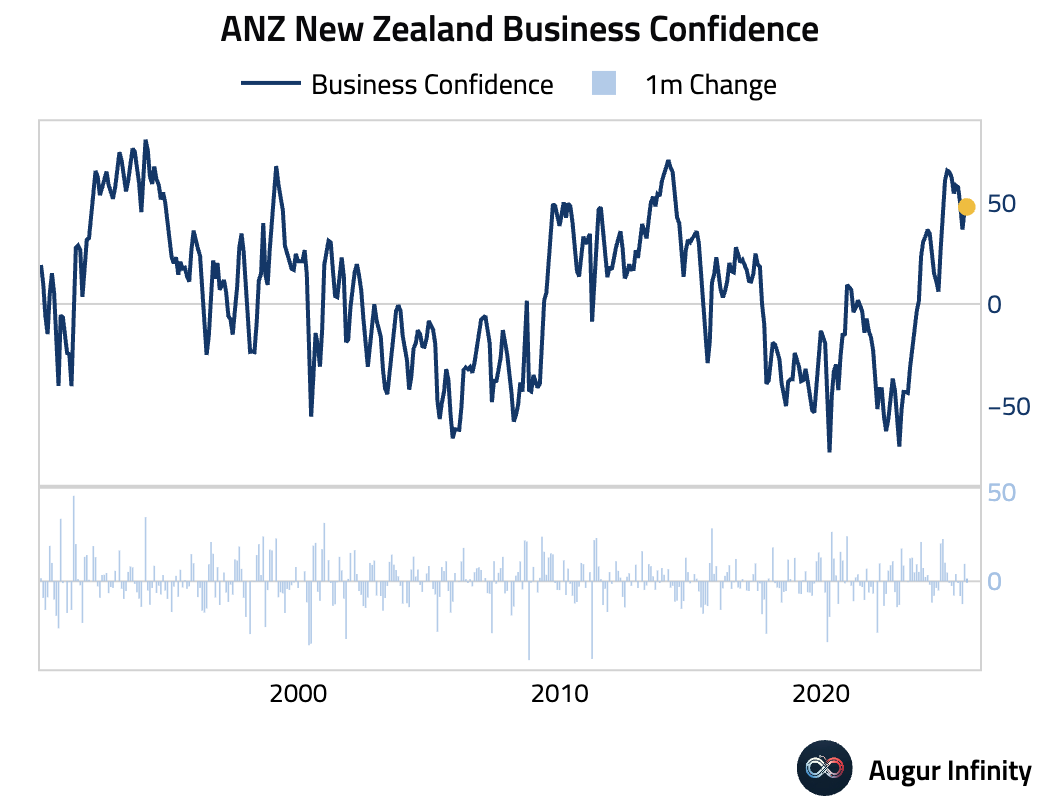
- New Zealand's ANZ Business Confidence rose to 47.8 in July from 46.3 in June, indicating improving sentiment.
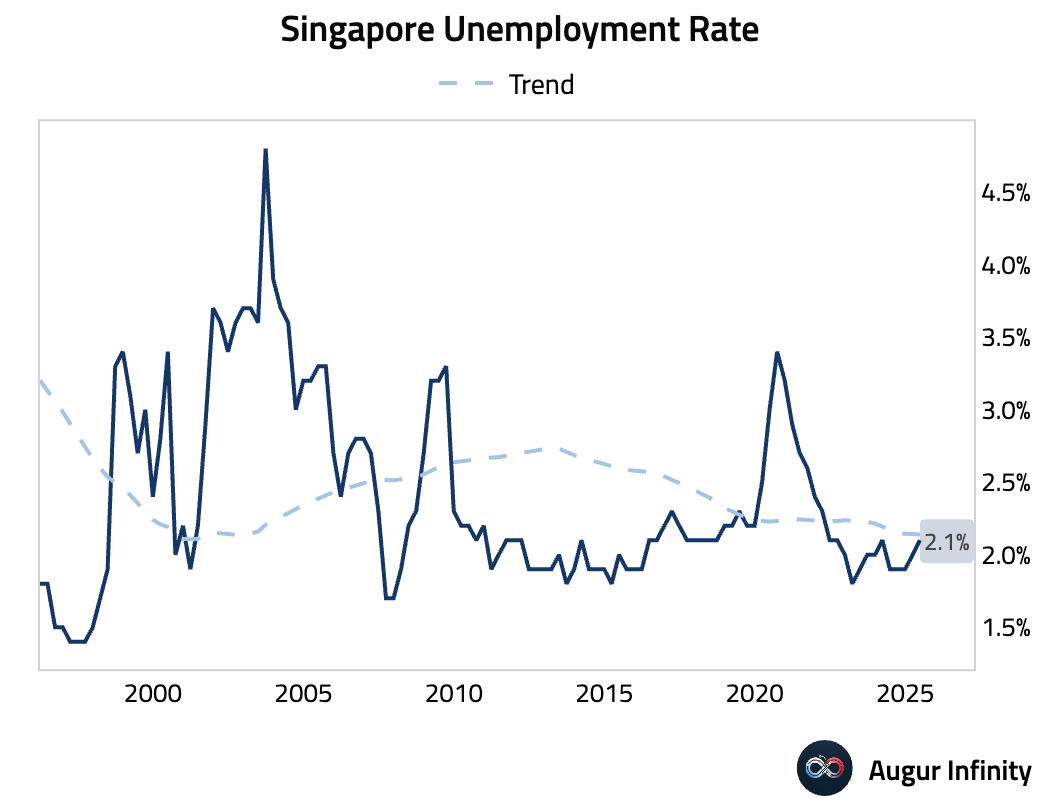
- Singapore's preliminary unemployment rate for Q2 ticked up to 2.1% from 2.0% in the prior quarter.
Emerging Markets ex China
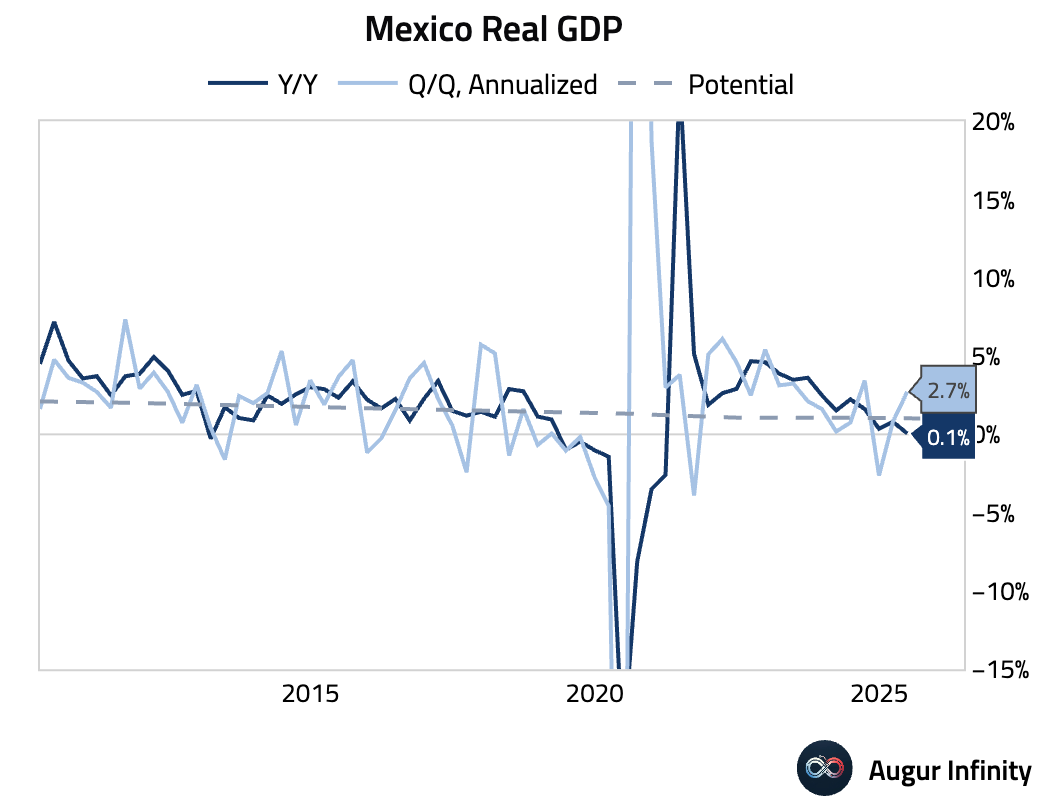
- Mexico's flash Q2 GDP rose 0.7% Q/Q (or 2.7% annualized), well above the 0.4% consensus, driven by strong performance in the industrial and services sectors. Despite the strong sequential beat, Y/Y growth was just 0.1%, slowing significantly from the previous quarter's 0.8% expansion.
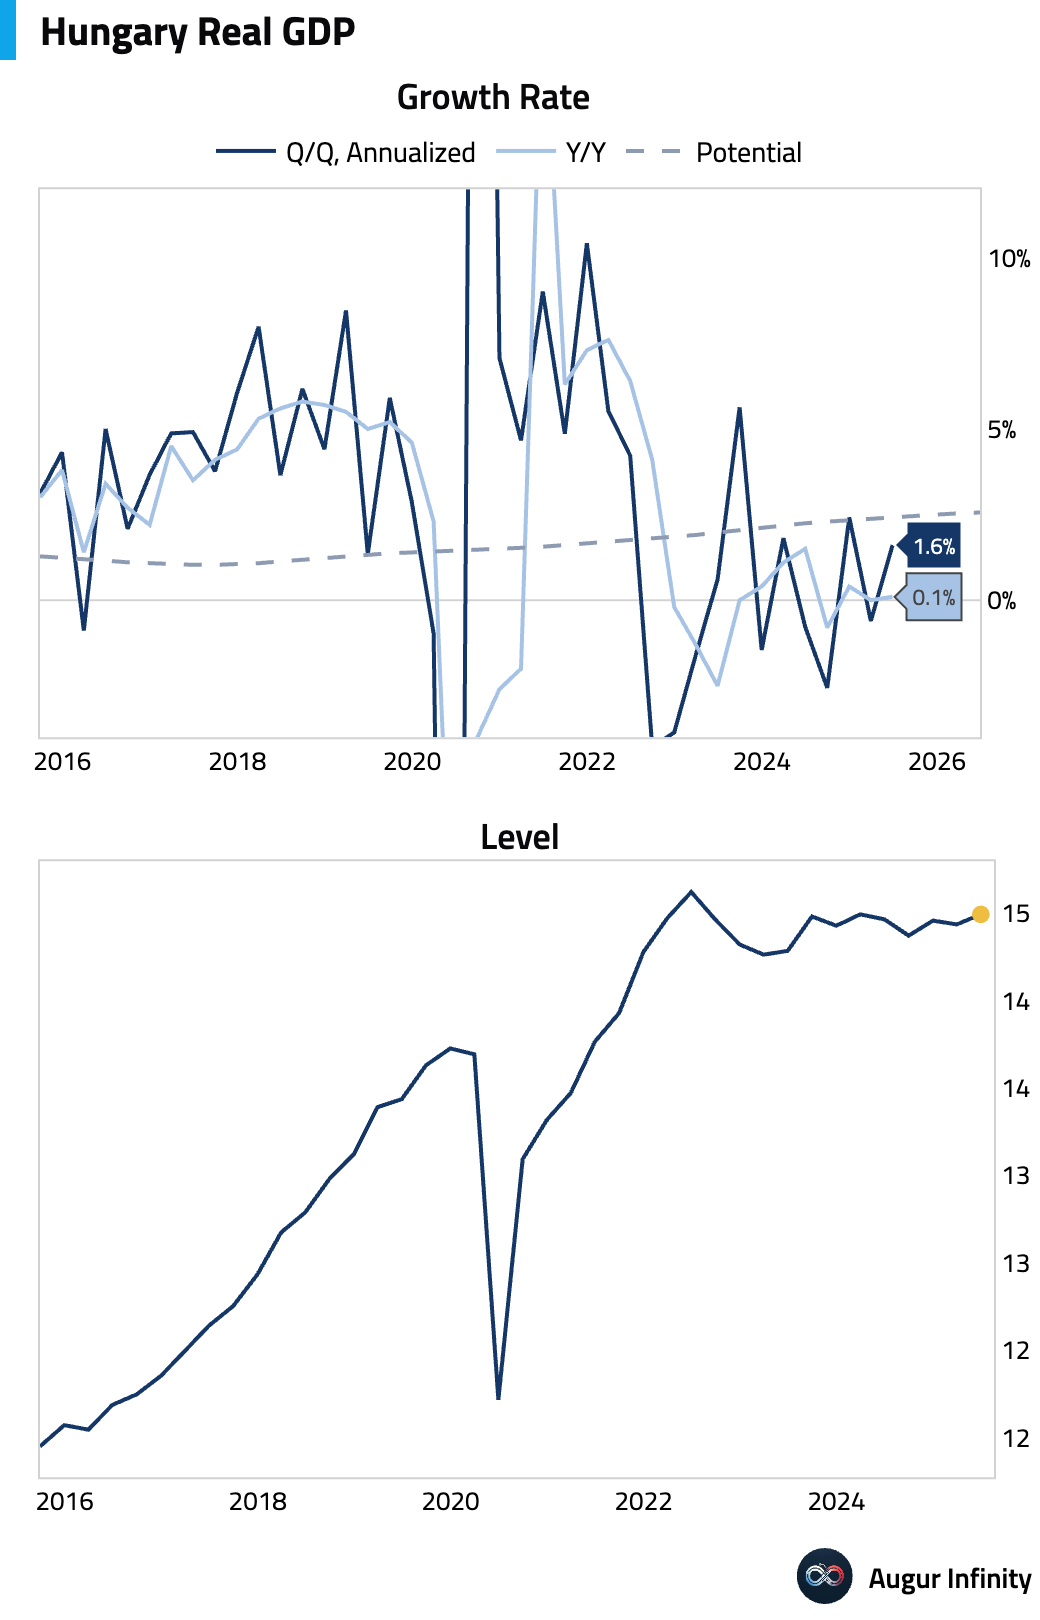
- Hungary's Q2 GDP expanded 0.4% Q/Q (or 1.6% annualized), beating the 0.2% consensus. The growth was likely driven by improved household consumption, offsetting continued weak external demand. However, the economy faces headwinds from potential US tariffs.
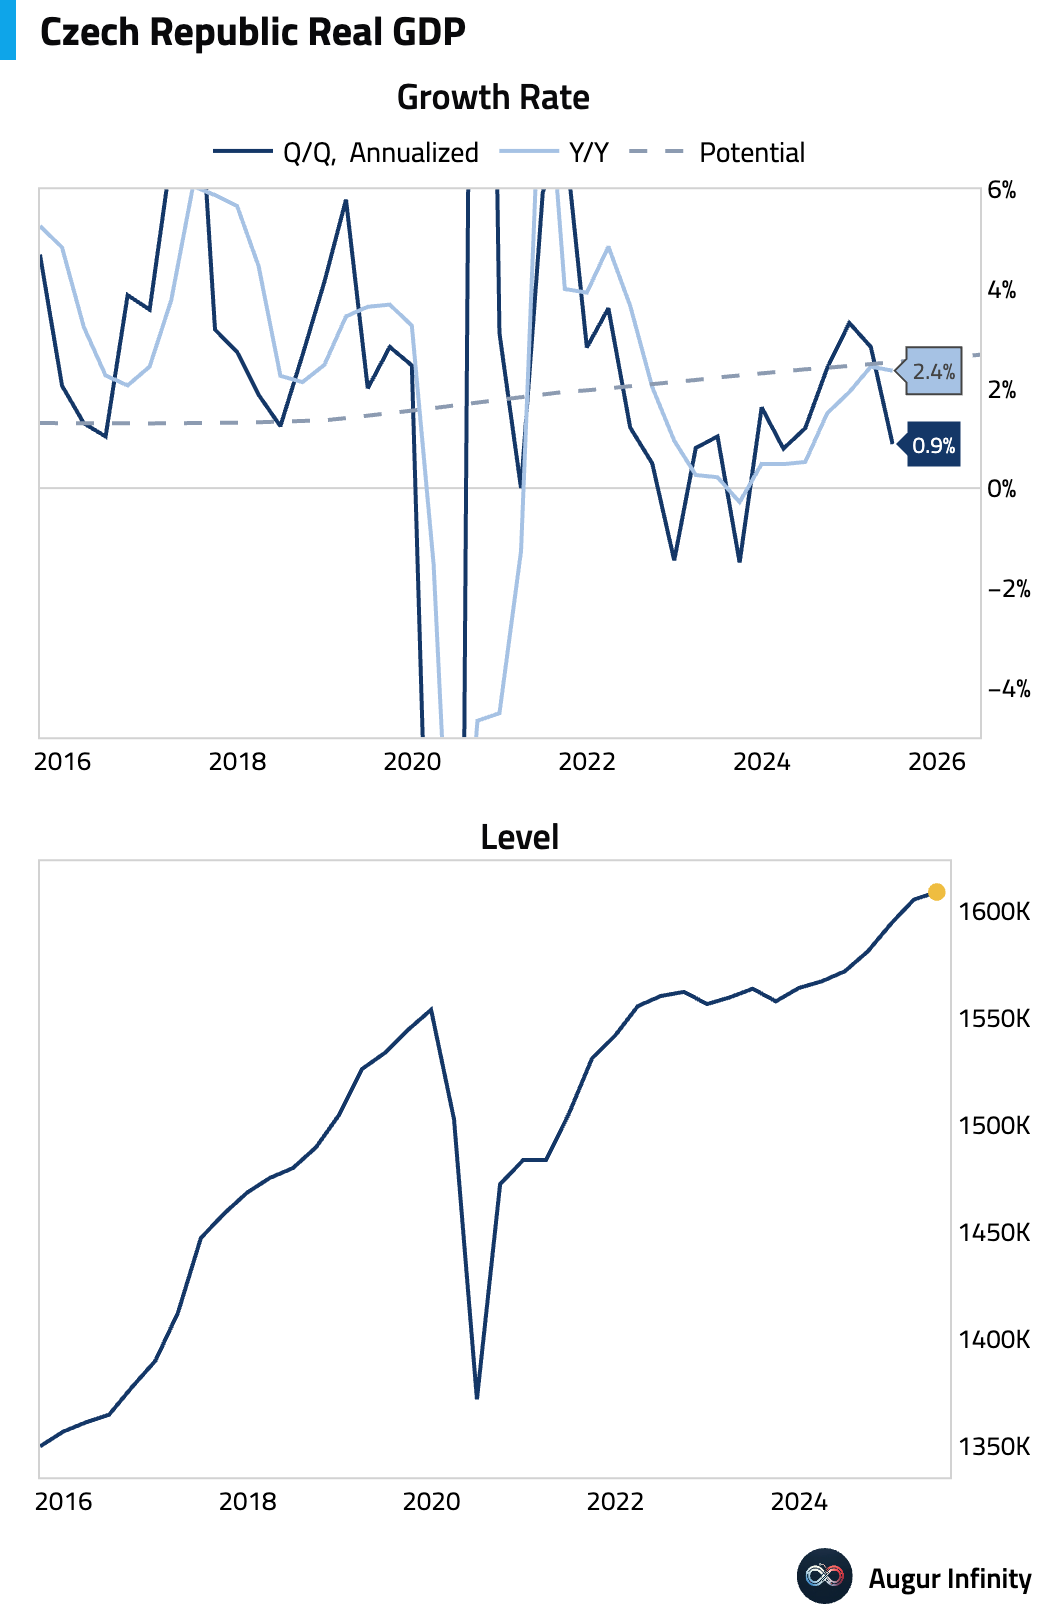
- The Czech Republic's Q2 GDP growth slowed to 0.2% Q/Q, missing the 0.4% consensus, while annual growth held steady at 2.4%. The slowdown was driven by weak foreign demand, partially offset by household consumption.
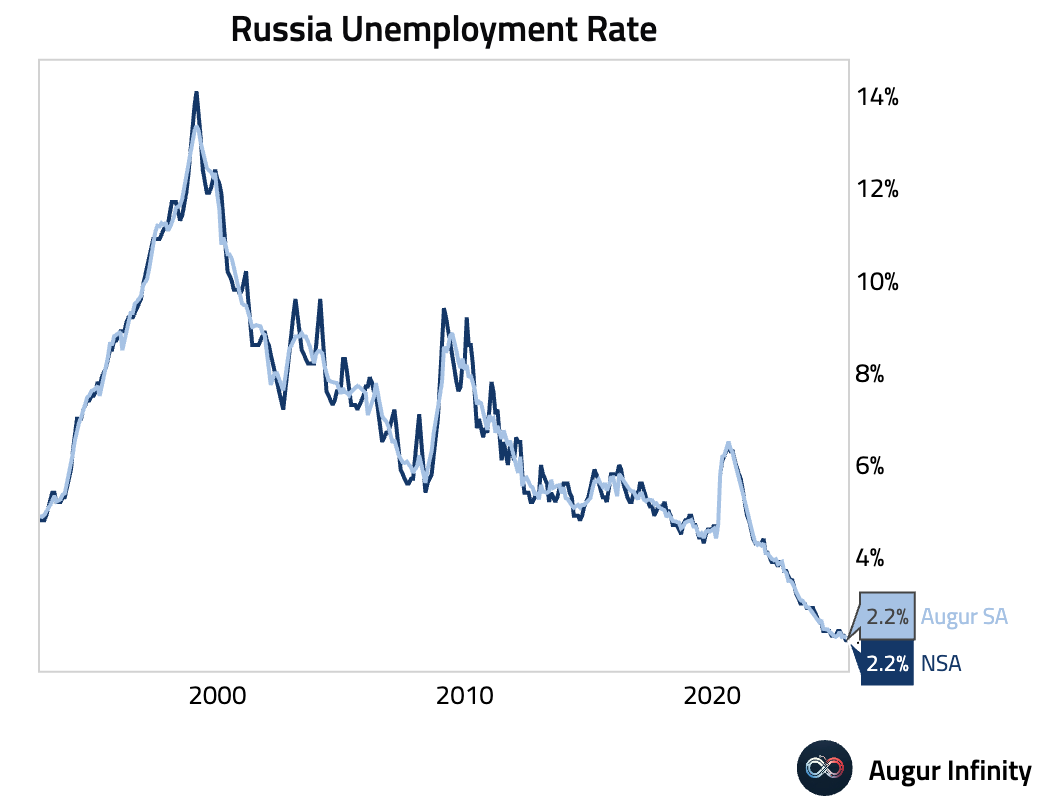
- Russia's unemployment rate fell to 2.2% in June, an all-time low.
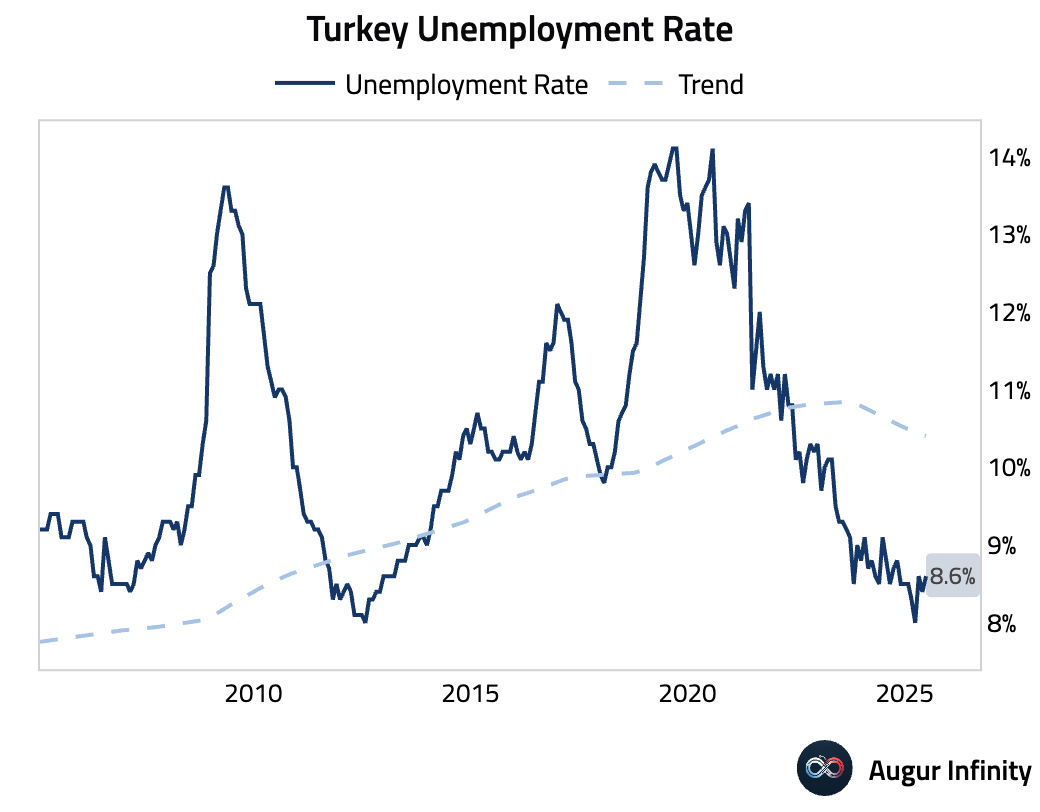
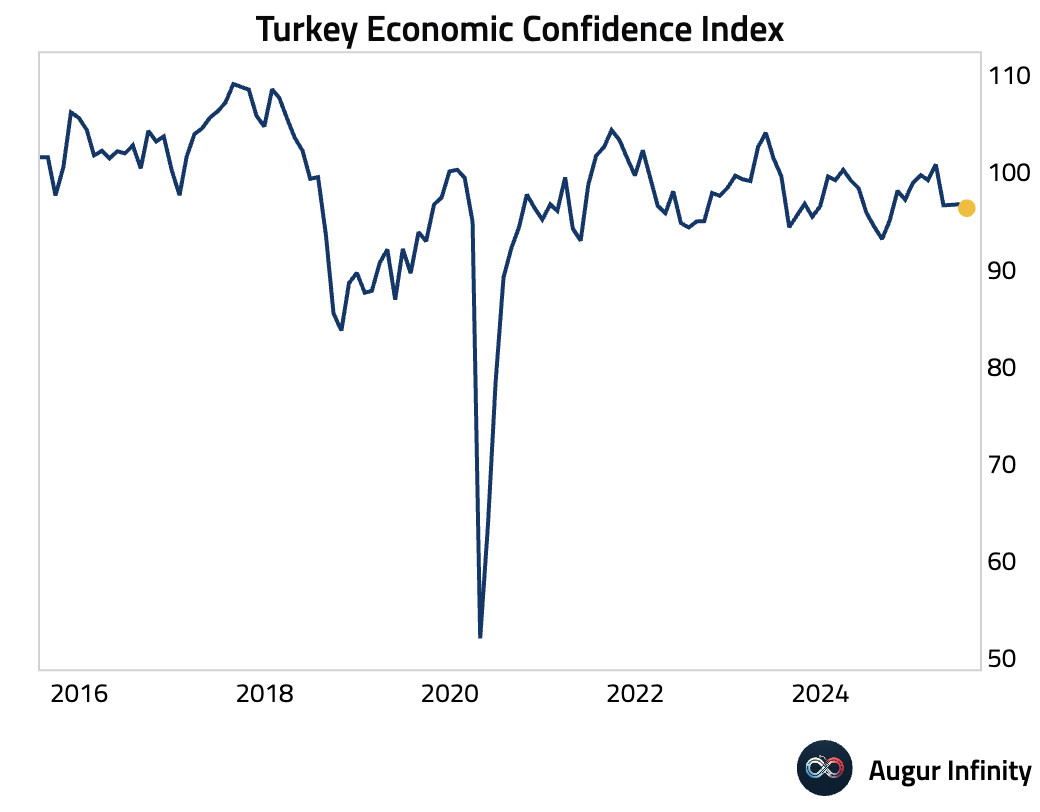
- Turkey's unemployment rate rose to 8.6% in June from 8.4% in May. Separately, the Economic Confidence Index fell to 96.3 in July from 96.7.
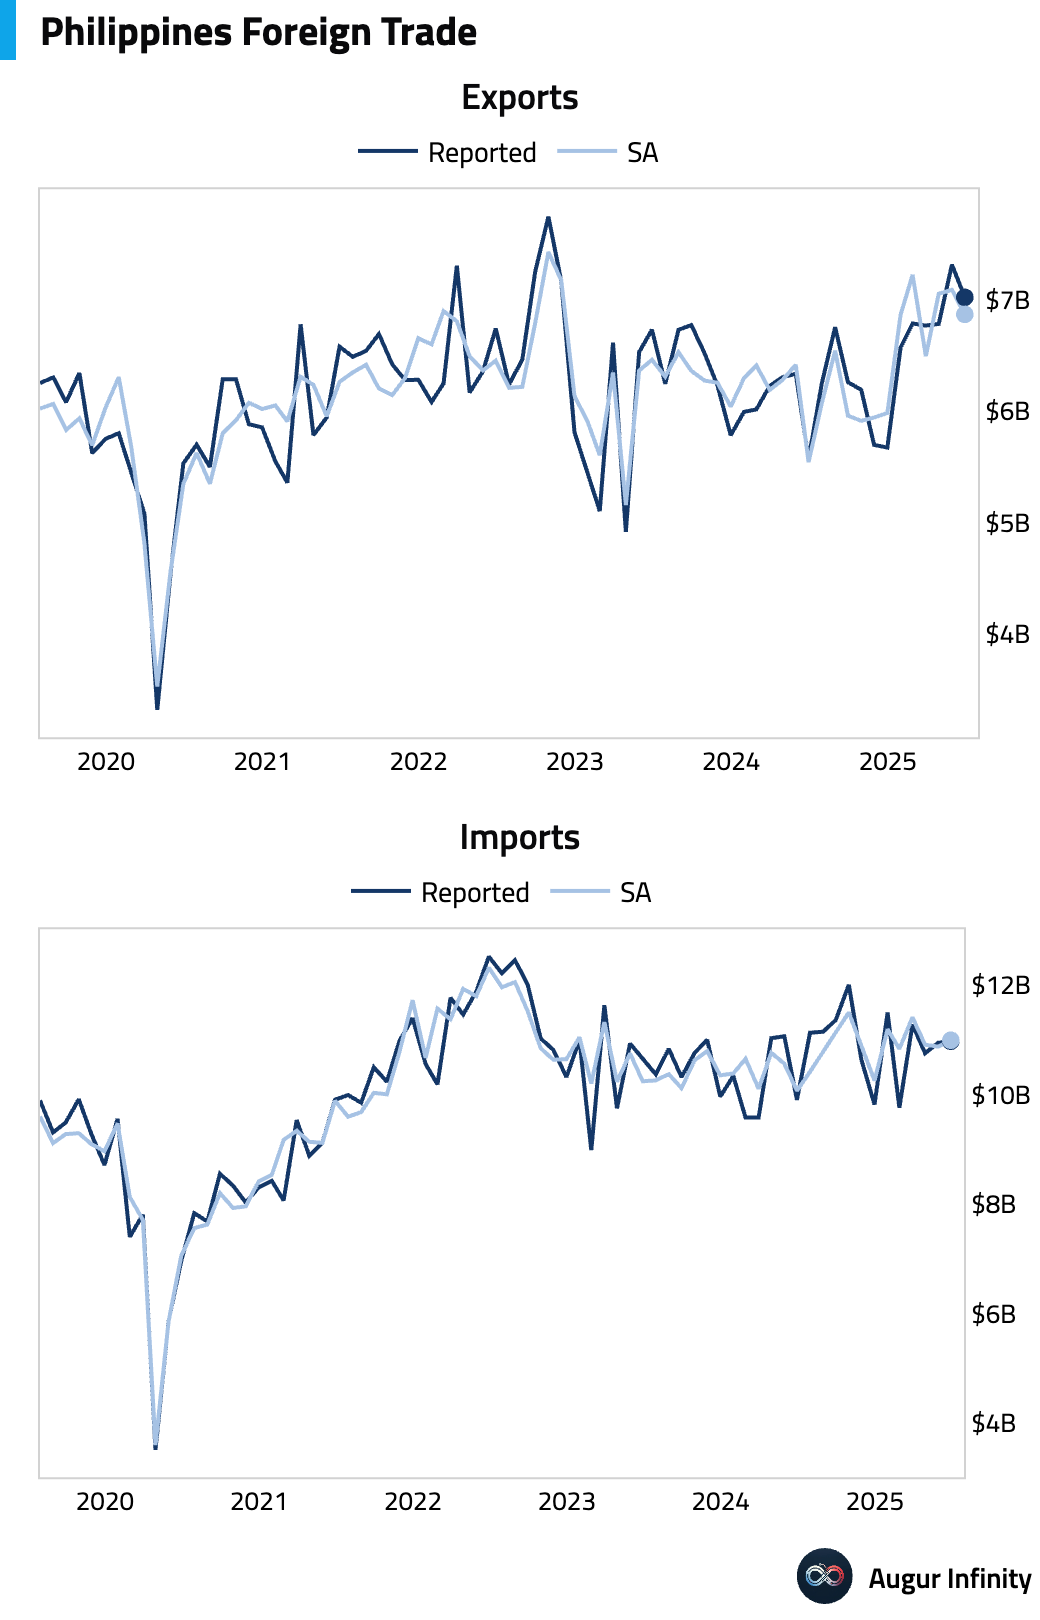
- The Philippines' trade deficit widened to $3.95 billion in June from $3.63 billion previously, as imports grew 10.8% Y/Y while exports grew 26.1% Y/Y.
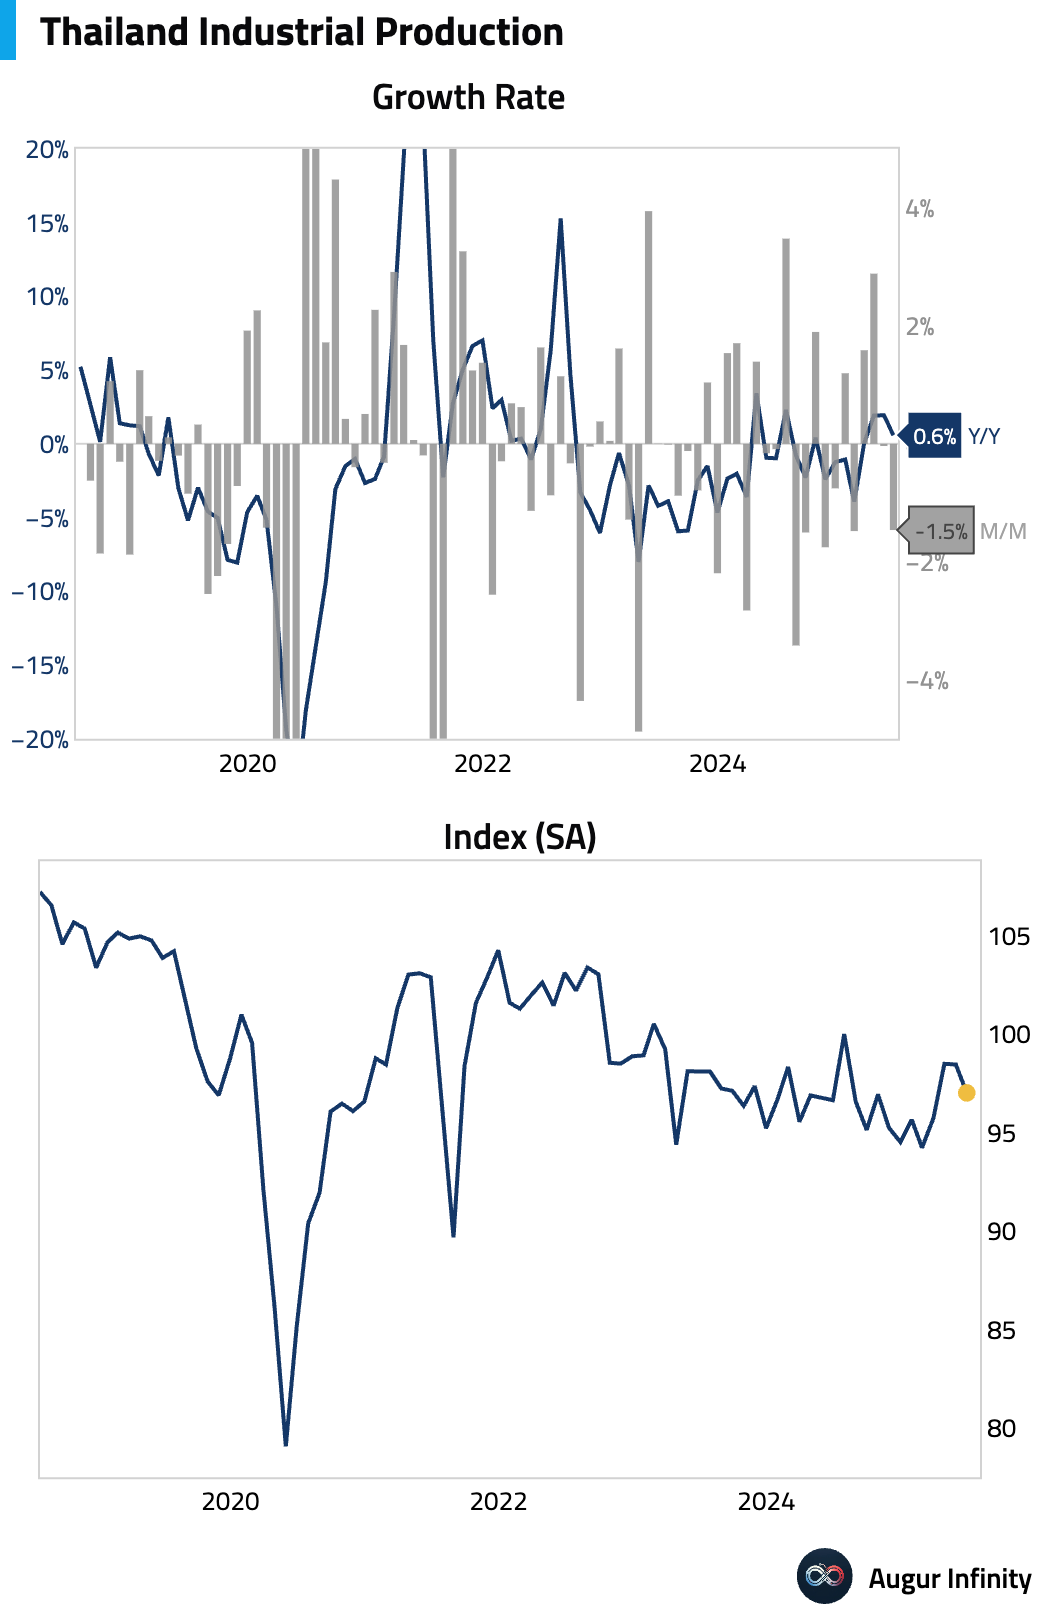
- Thai industrial production growth slowed significantly in June, rising just 0.58% Y/Y and missing the 2.0% consensus forecast.
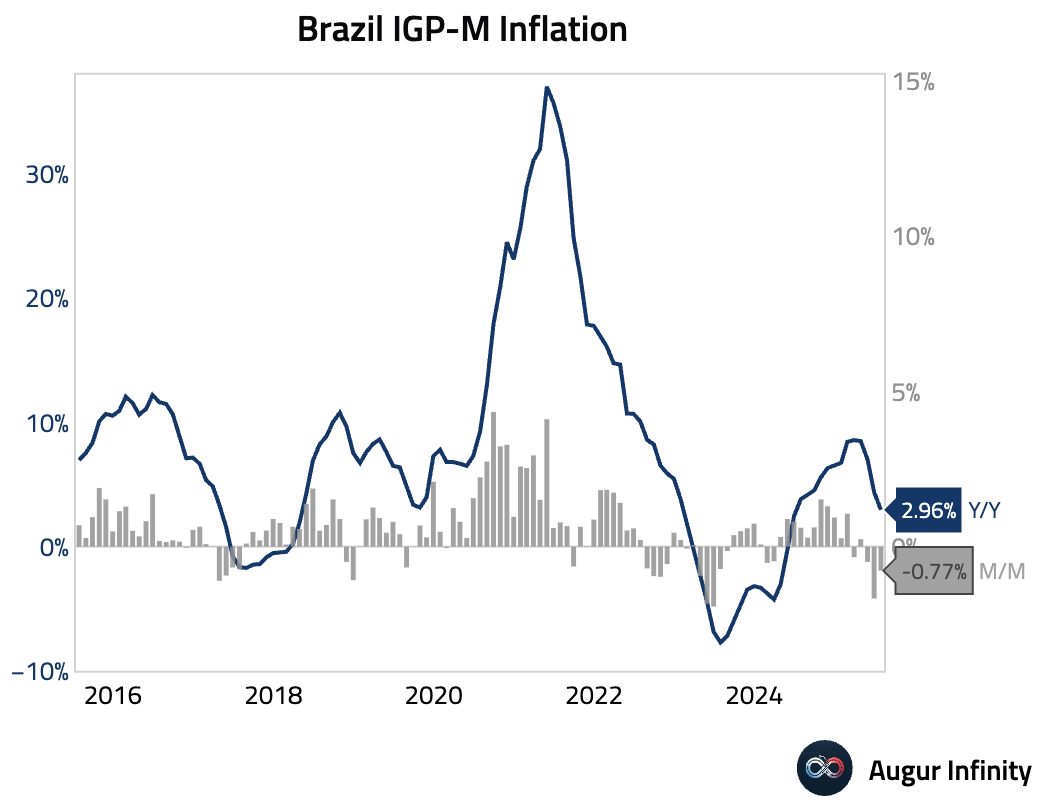
- Brazil's IGP-M monthly inflation rate came in at -0.77% in July, continuing a disinflationary trend.
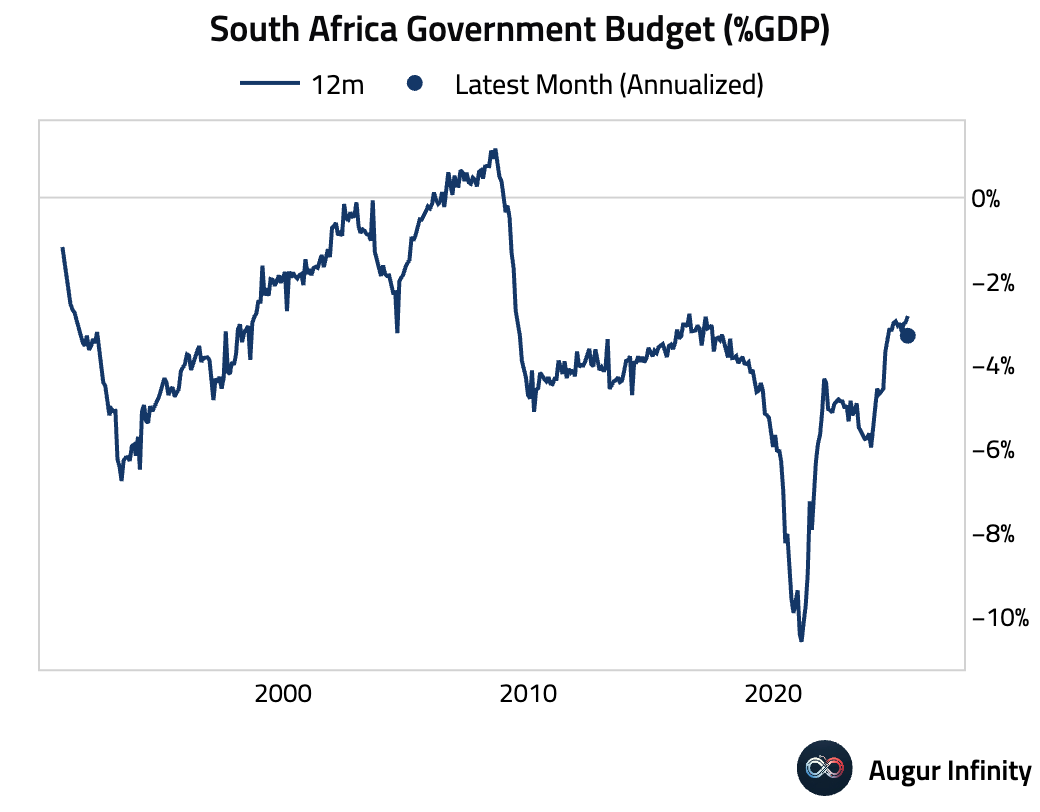
- South Africa recorded a budget surplus of ZAR 48.75 billion in June, a significant swing from the ZAR 10.12 billion deficit in May.
Global Markets
Equities
- Global equity markets were subdued, with most major indices closing modestly lower. US markets ended a multi-day winning streak, with the S&P 500 down 0.1% and the Dow falling 0.6%. In Asia, Chinese equities extended their losing streak to five consecutive days, falling 1.2%.
- Since 2020, shares of US technology companies have vastly outperformed their Chinese equivalents, a trend that continues to shape global equity flows.
- Realized correlation among S&P 500 members has fallen substantially and is now trading below implied correlation, suggesting an environment favorable for stock pickers.
Fixed Income
- Treasury yields moved higher across the curve following the Fed's policy decision and stronger-than-expected GDP data. The move was led by the front end, with the 2-year yield rising 6.7 basis points, causing a modest flattening of the yield curve. Yields on the 10-year and 30-year Treasuries rose by 4.5 bps and 3.6 bps, respectively.
Commodities
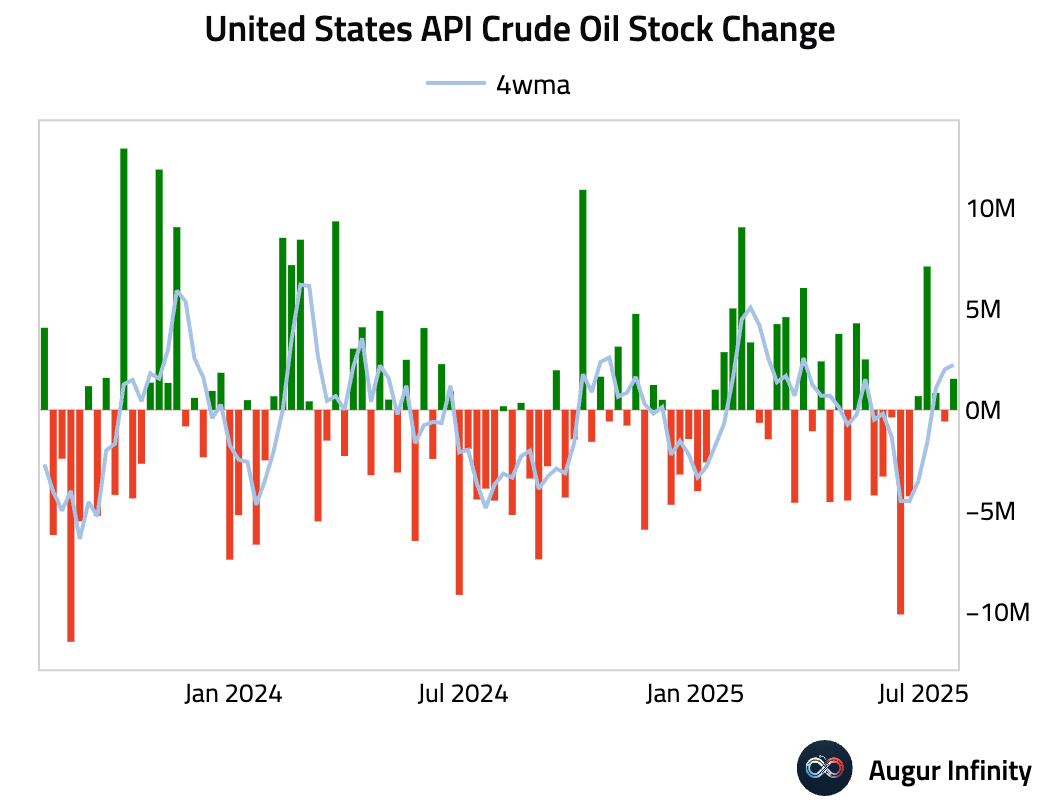
- The latest American Petroleum Institute (API) report showed a surprise build in US crude oil inventories. Stockpiles rose by 1.54 million barrels for the week, confounding expectations for a 2.5 million barrel draw.
FX
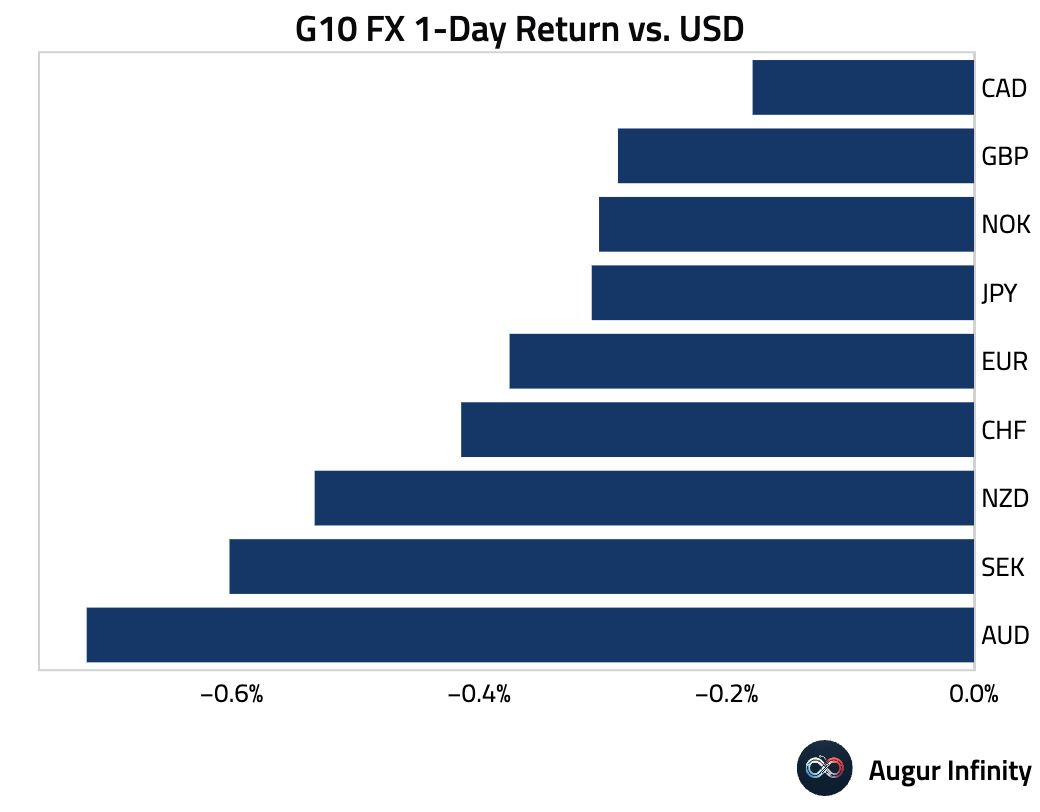
- The US dollar was the dominant force in currency markets, strengthening against all G10 peers. The Australian dollar was the weakest performer, falling 0.7%, pressured by cooling domestic inflation data. The Canadian dollar, euro, British pound, Japanese yen, and Swiss franc all posted their fifth consecutive day of losses against the greenback.
Disclaimer
Augur Digest is an automated newsletter written by an AI. It may contain inaccuracies and is not investment advice. Augur Labs LLC will not accept liability for any loss or damage as a result of your reliance on the information contained in the newsletter.