Headlines
- President Trump stated that Treasury Secretary Bessent is no longer under consideration to be the next Federal Reserve chair and that a replacement for Governor Kugler may be announced soon.
- Japan’s top trade negotiator has reportedly returned to Washington to seek written confirmation of a trade agreement reached with the United States.
- China’s Ministry of Agriculture warned that the country’s fall grain production is expected to be pressured by recent floods and droughts.
Charts of the Day
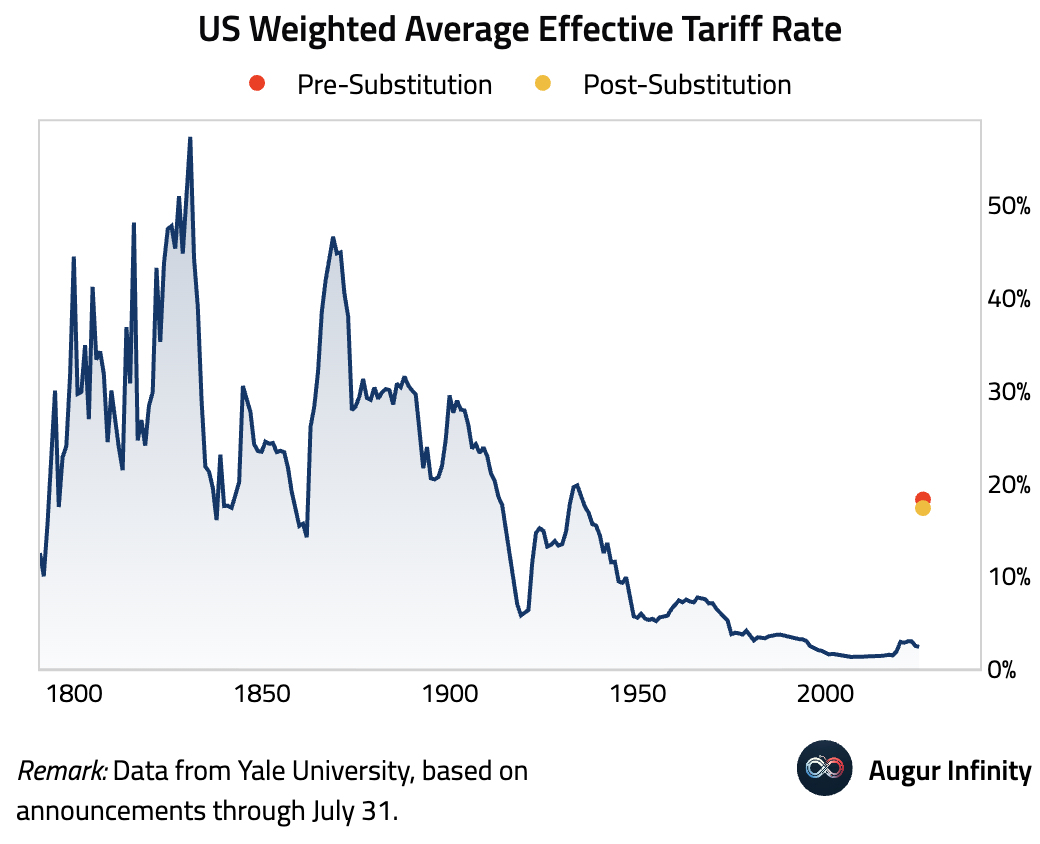
- The Budget Lab estimates that consumers face an overall average effective tariff rate of 18.3%, the highest since 1934. Even if shifts in consumption patterns are incorporated, the average tariff rate will still be 17.3%, the highest since 1935.
Global Economics
United States
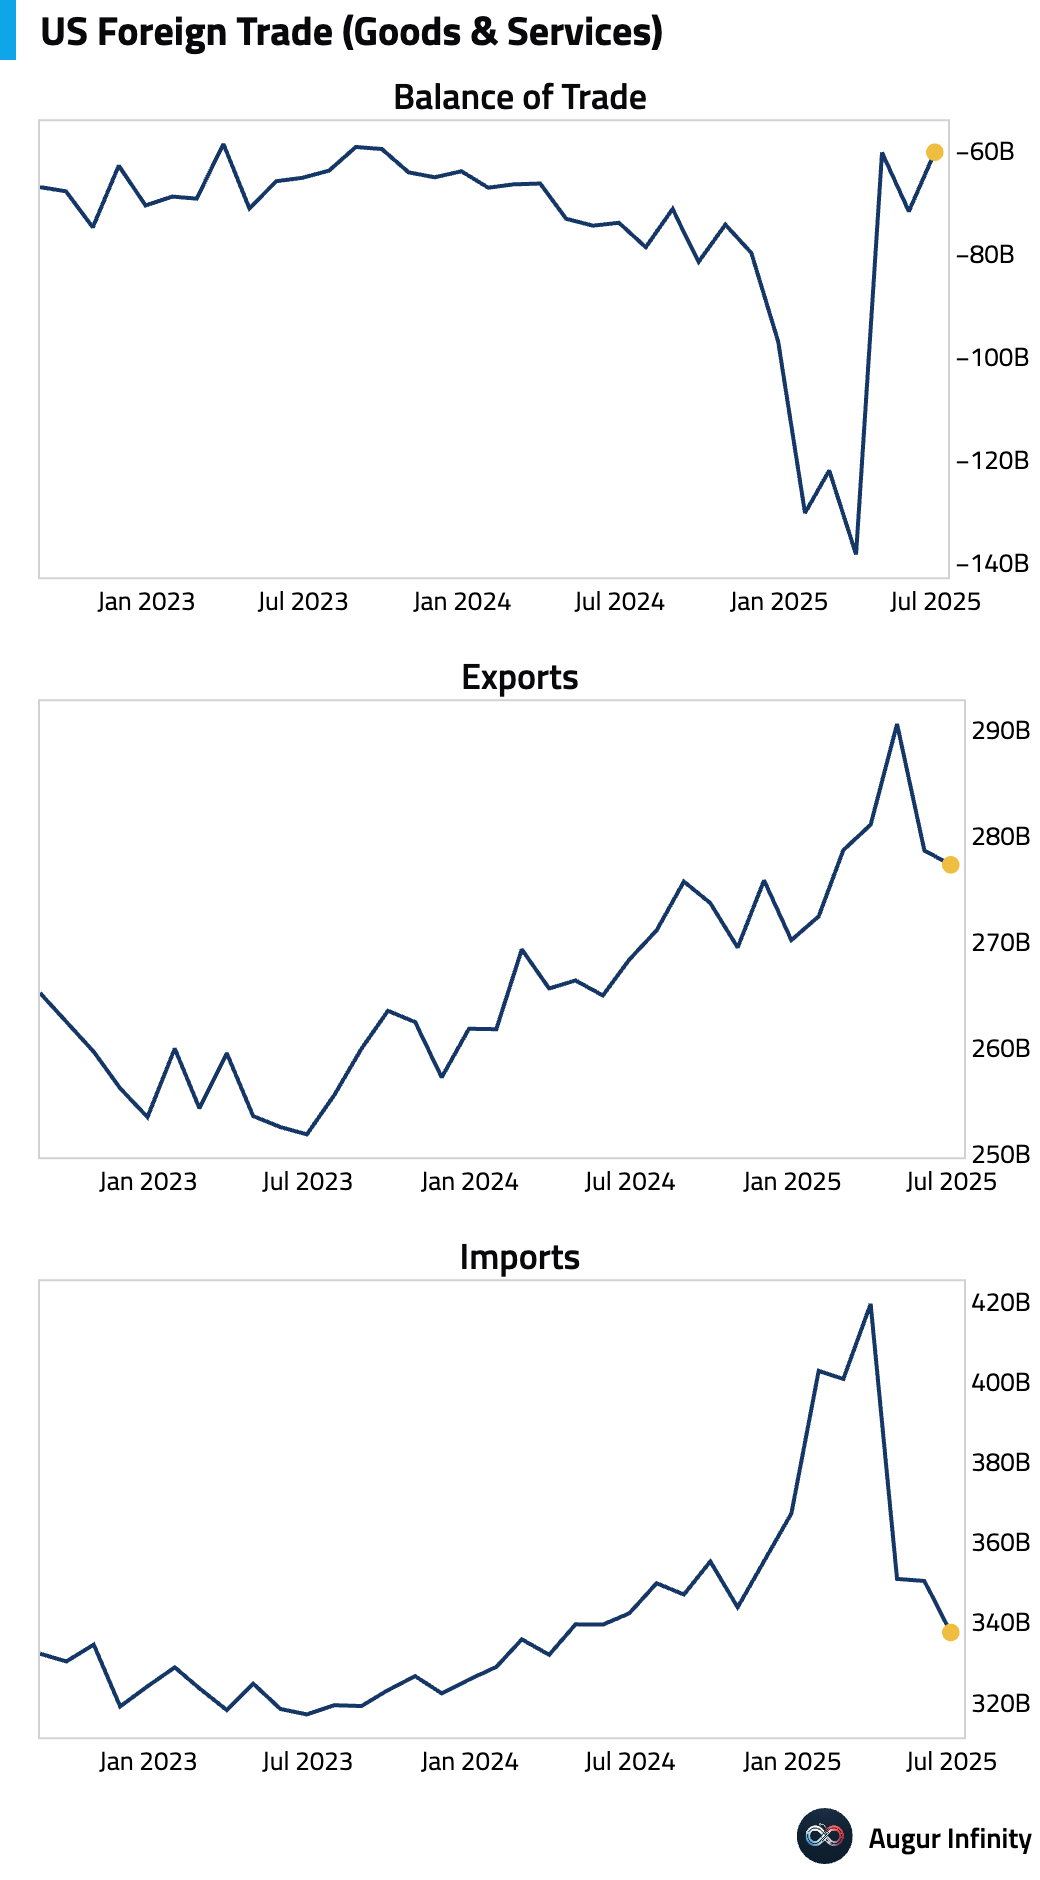
- The US trade deficit for June narrowed more than expected to $60.2 billion from a revised $71.7 billion in May. The improvement was driven by a significant $12.8 billion drop in imports, led by a $10.0 billion decline in pharmaceuticals and chemicals. Exports also fell by a smaller $1.3 billion, leading to a decrease in total trade volume.
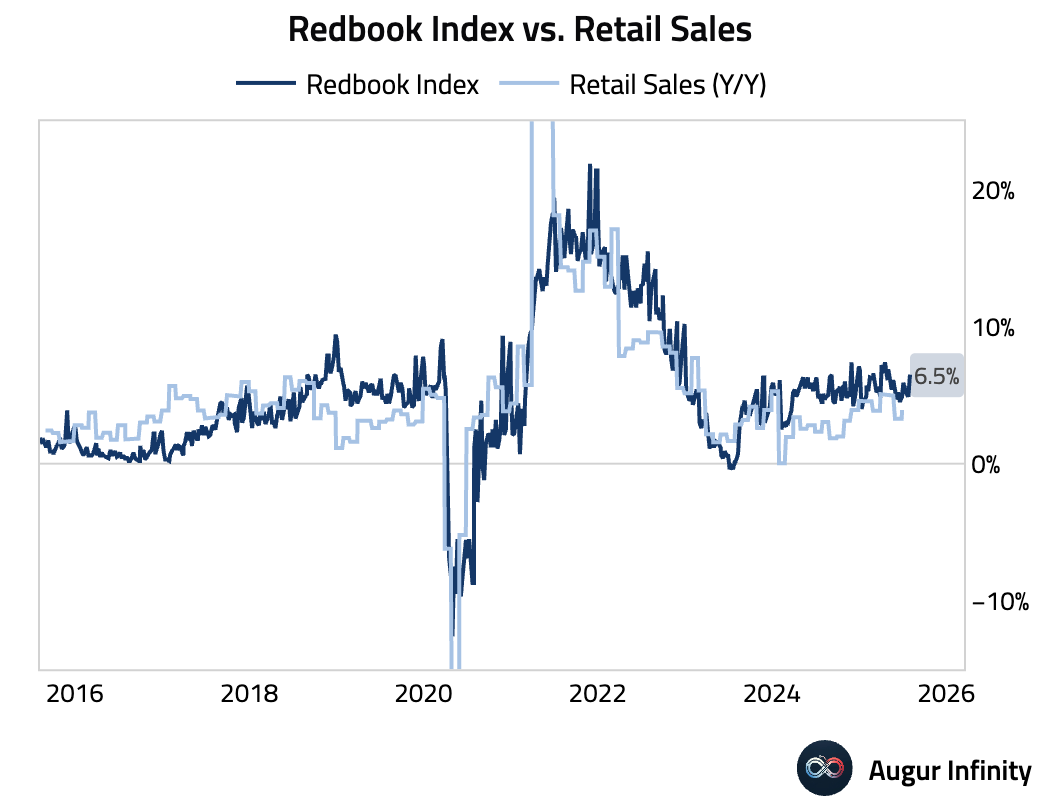
- The Redbook index of same-store sales rose 6.5% Y/Y for the week ending August 2, accelerating from the prior week's 4.9% gain.
- The final July S&P Global Services PMI was revised higher to 55.7 from a preliminary 55.2, reflecting stronger new business activity. This contrasts with the ISM survey below.
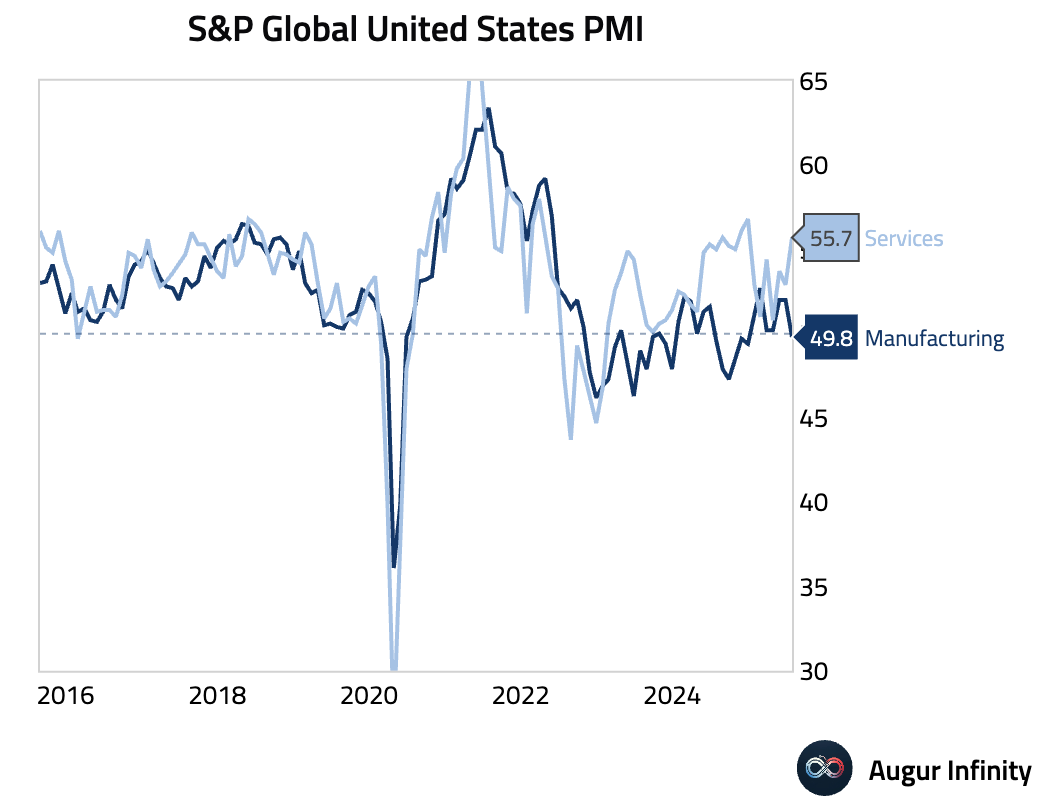
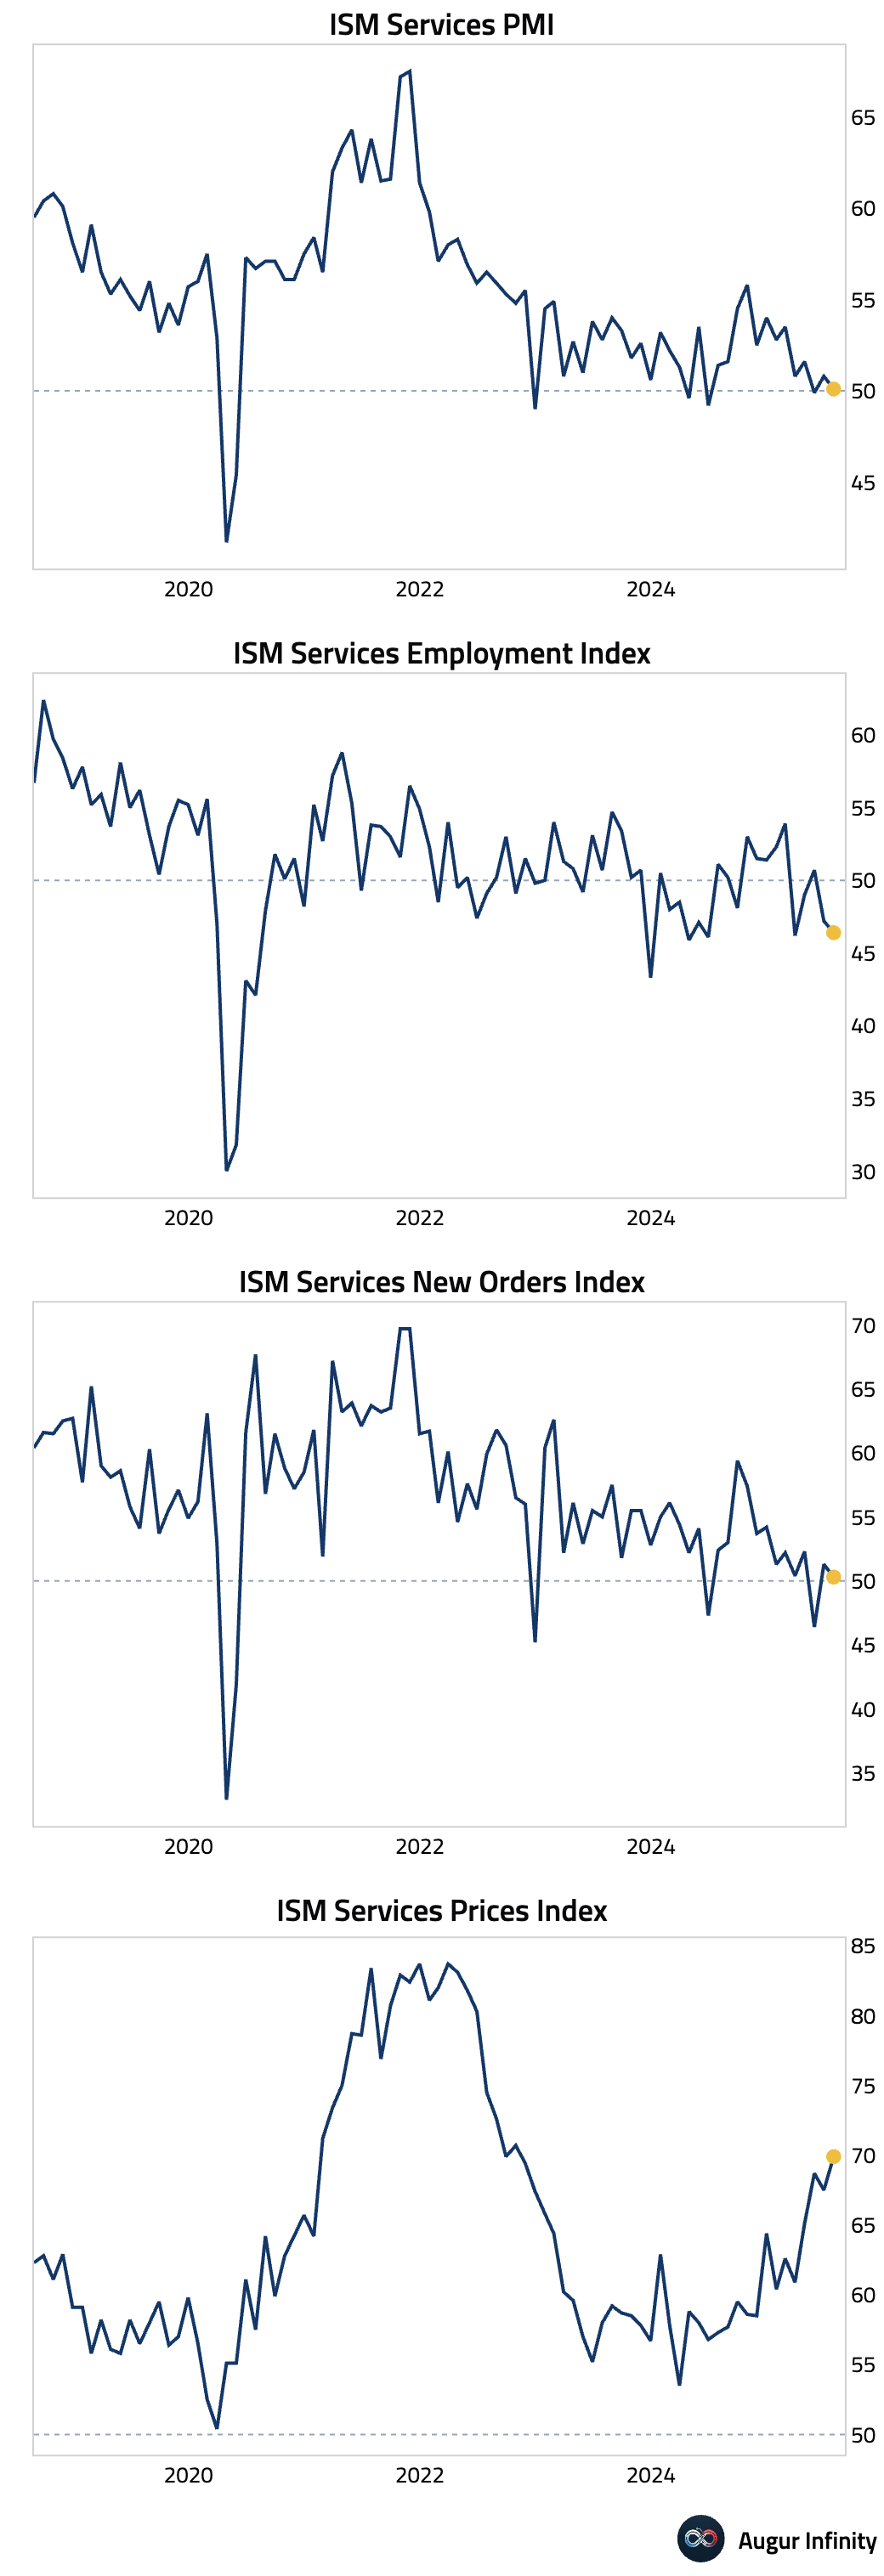
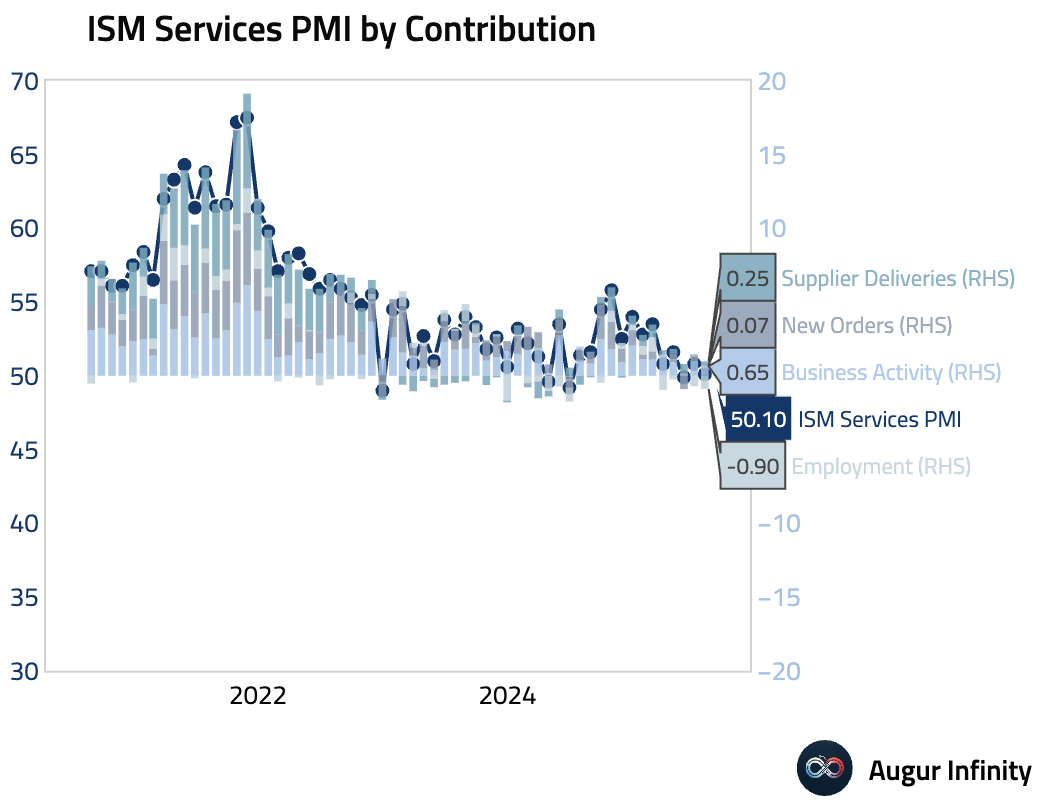
- The ISM Services PMI for July unexpectedly fell to 50.1, missing the consensus of 51.5 and slowing from June's 50.8, indicating the services sector is barely expanding. The internals were weak, with New Orders slowing to 50.3 and the Employment index falling further into contraction at 46.4. Firms reported difficulty backfilling positions, signaling persistent labor market tightness in the services sector. Notably, the Prices Paid component surged to 69.9, its highest level since October 2022, with tariffs mentioned 11 times in the report as a key driver of price pressures and uncertainty. Global trade frictions were also evident, as New Export Orders (47.9) and Imports (45.9) both fell sharply into contraction.
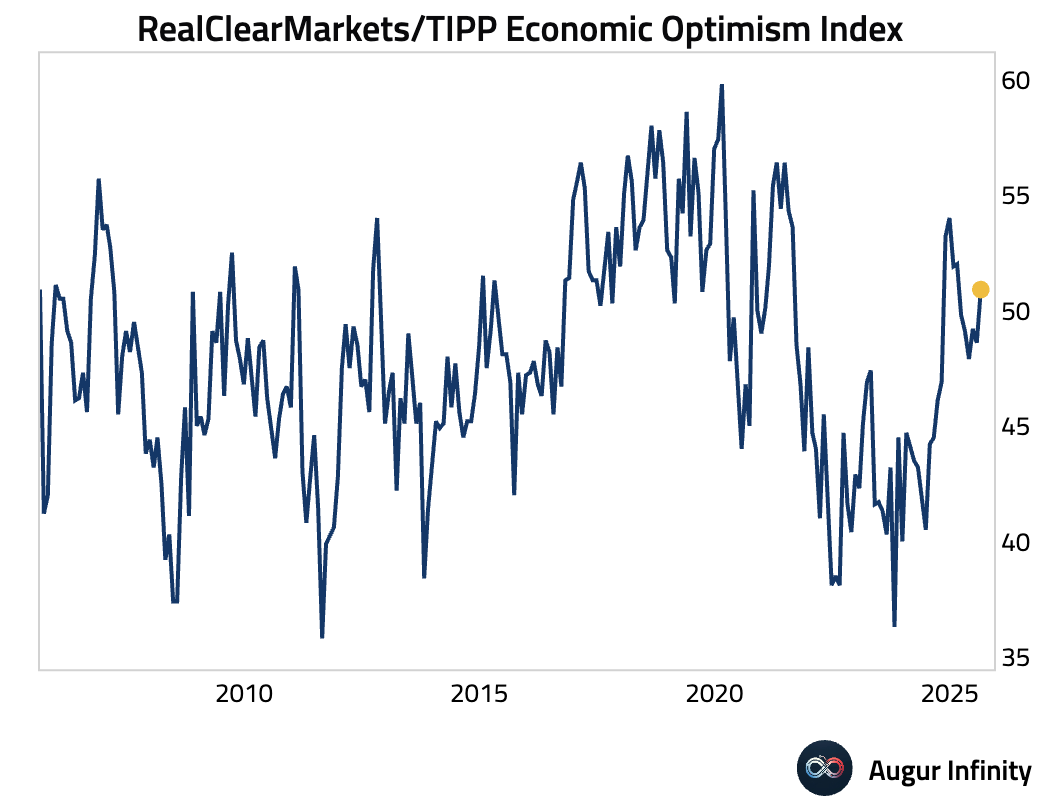
- The RCM/TIPP Economic Optimism Index for August rose to 50.9 from 48.6, moving back into optimistic territory and beating expectations of 49.2.
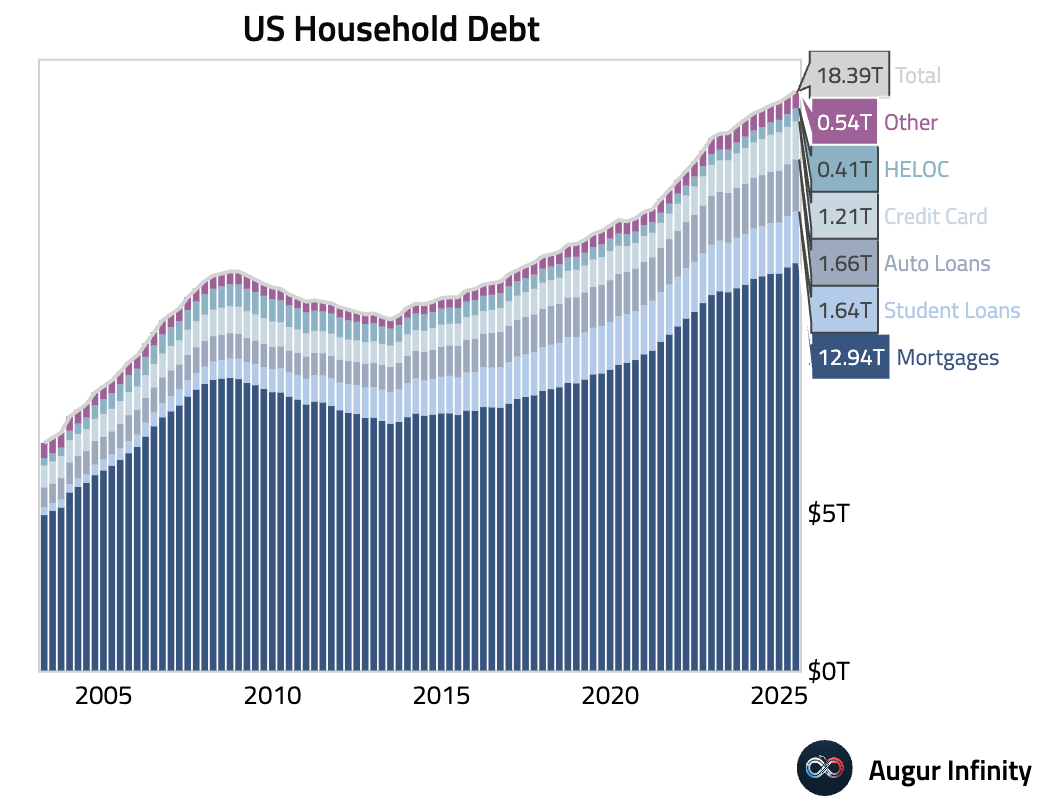
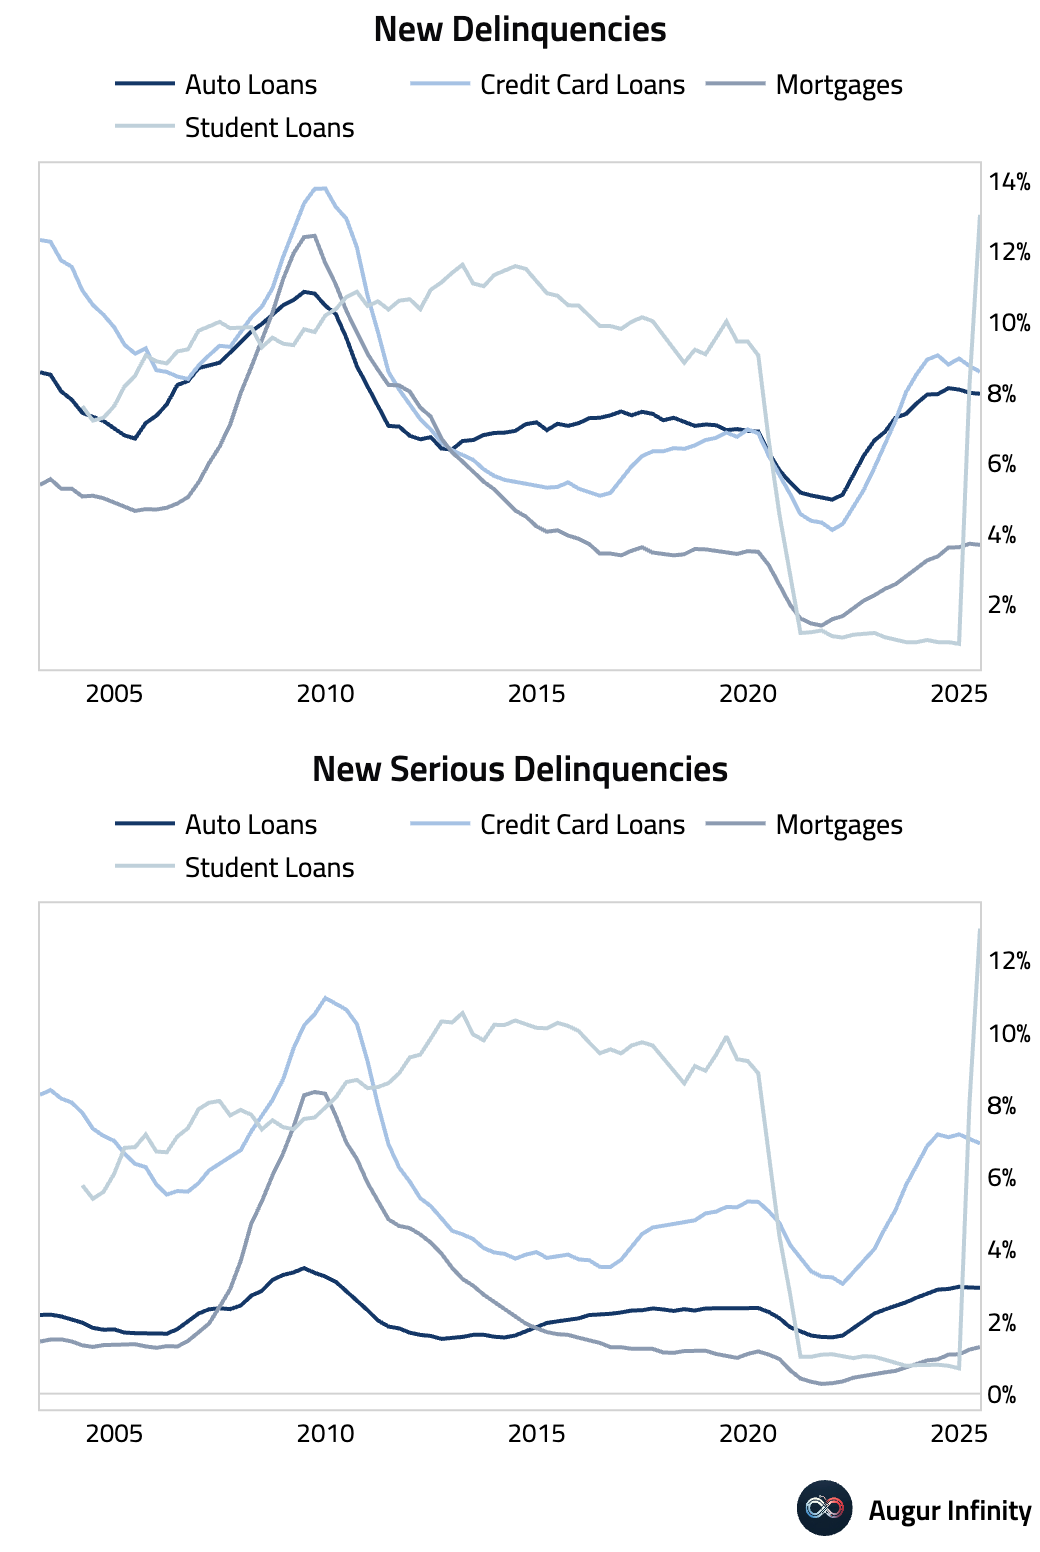
- Total US household debt rose by 1% in Q2 2025 to a new all-time high of $18.39 trillion, driven primarily by a $131 billion increase in mortgage balances. Aggregate delinquencies remained elevated at 4.4%. Student loan serious delinquencies surged to 12.9% (the level break is the result of previously unreported missed payments now appearing in credit reports). In contrast, auto loan originations accelerated to $188 billion, but serious delinquency rates held stable at 2.9%.
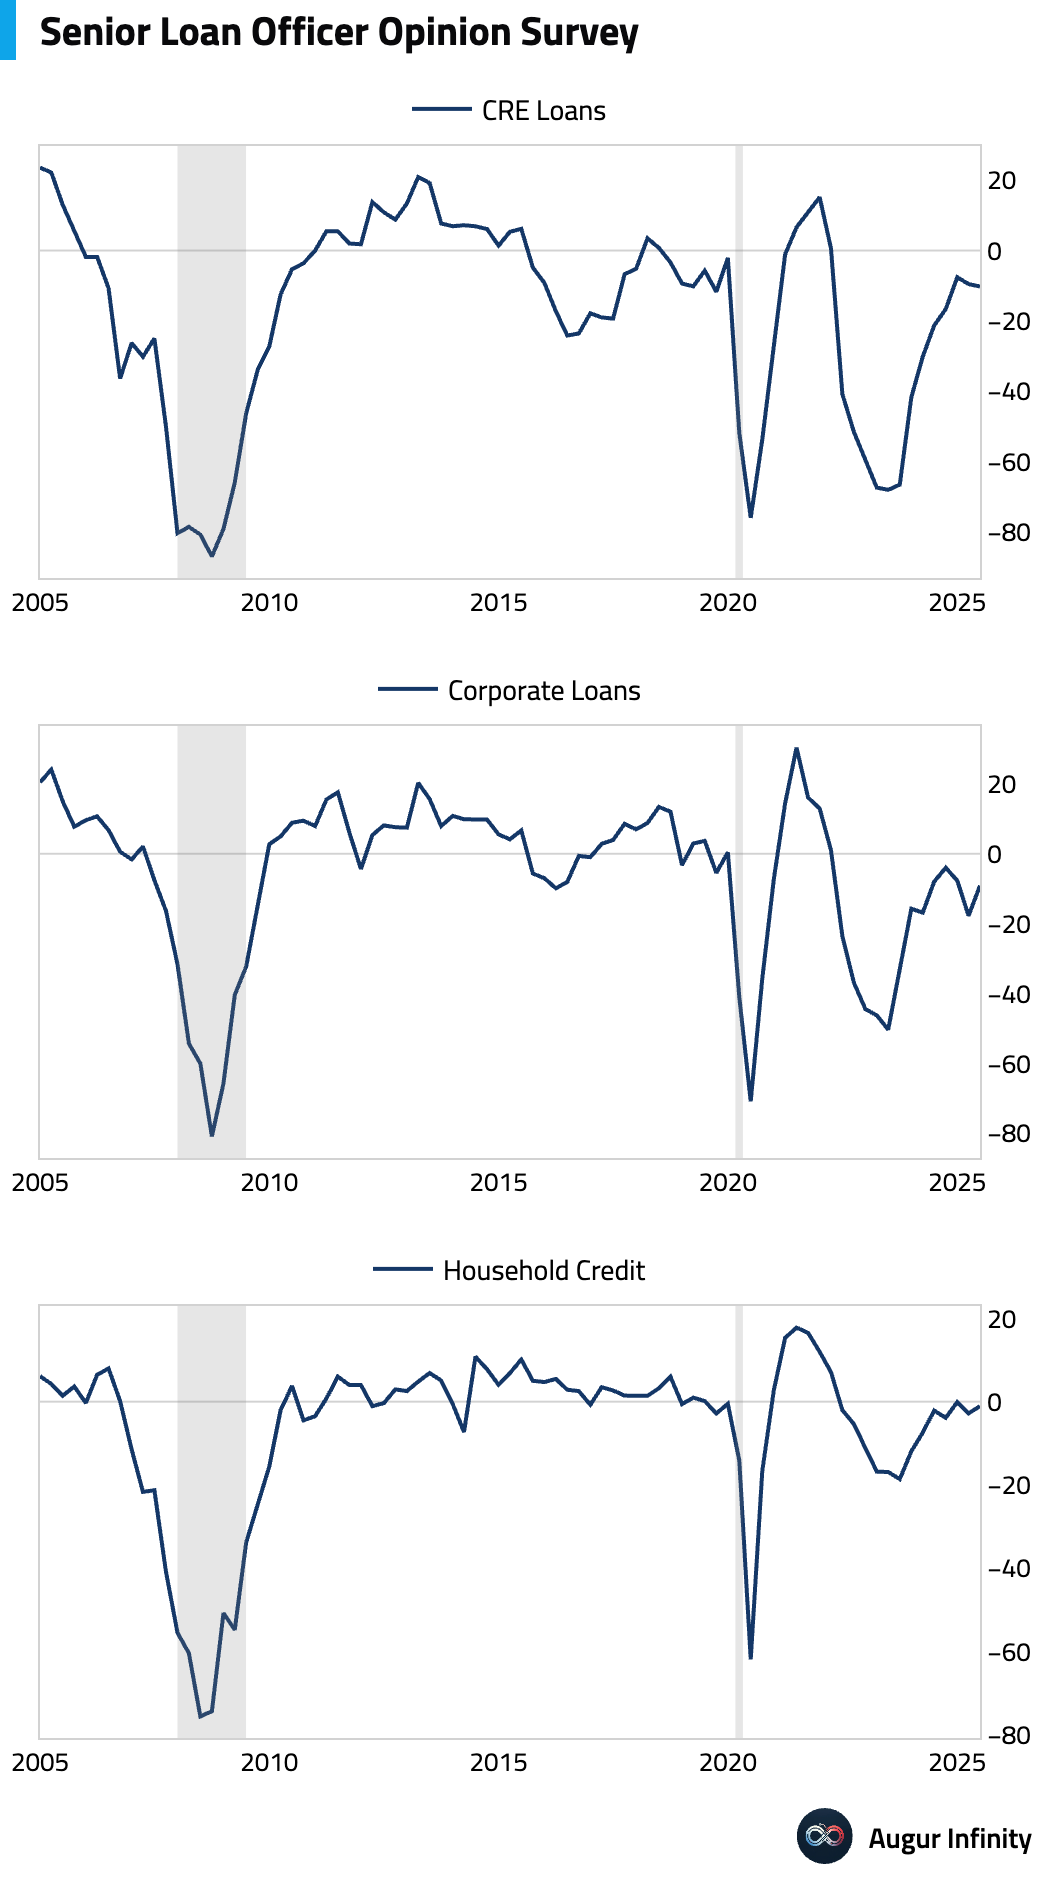
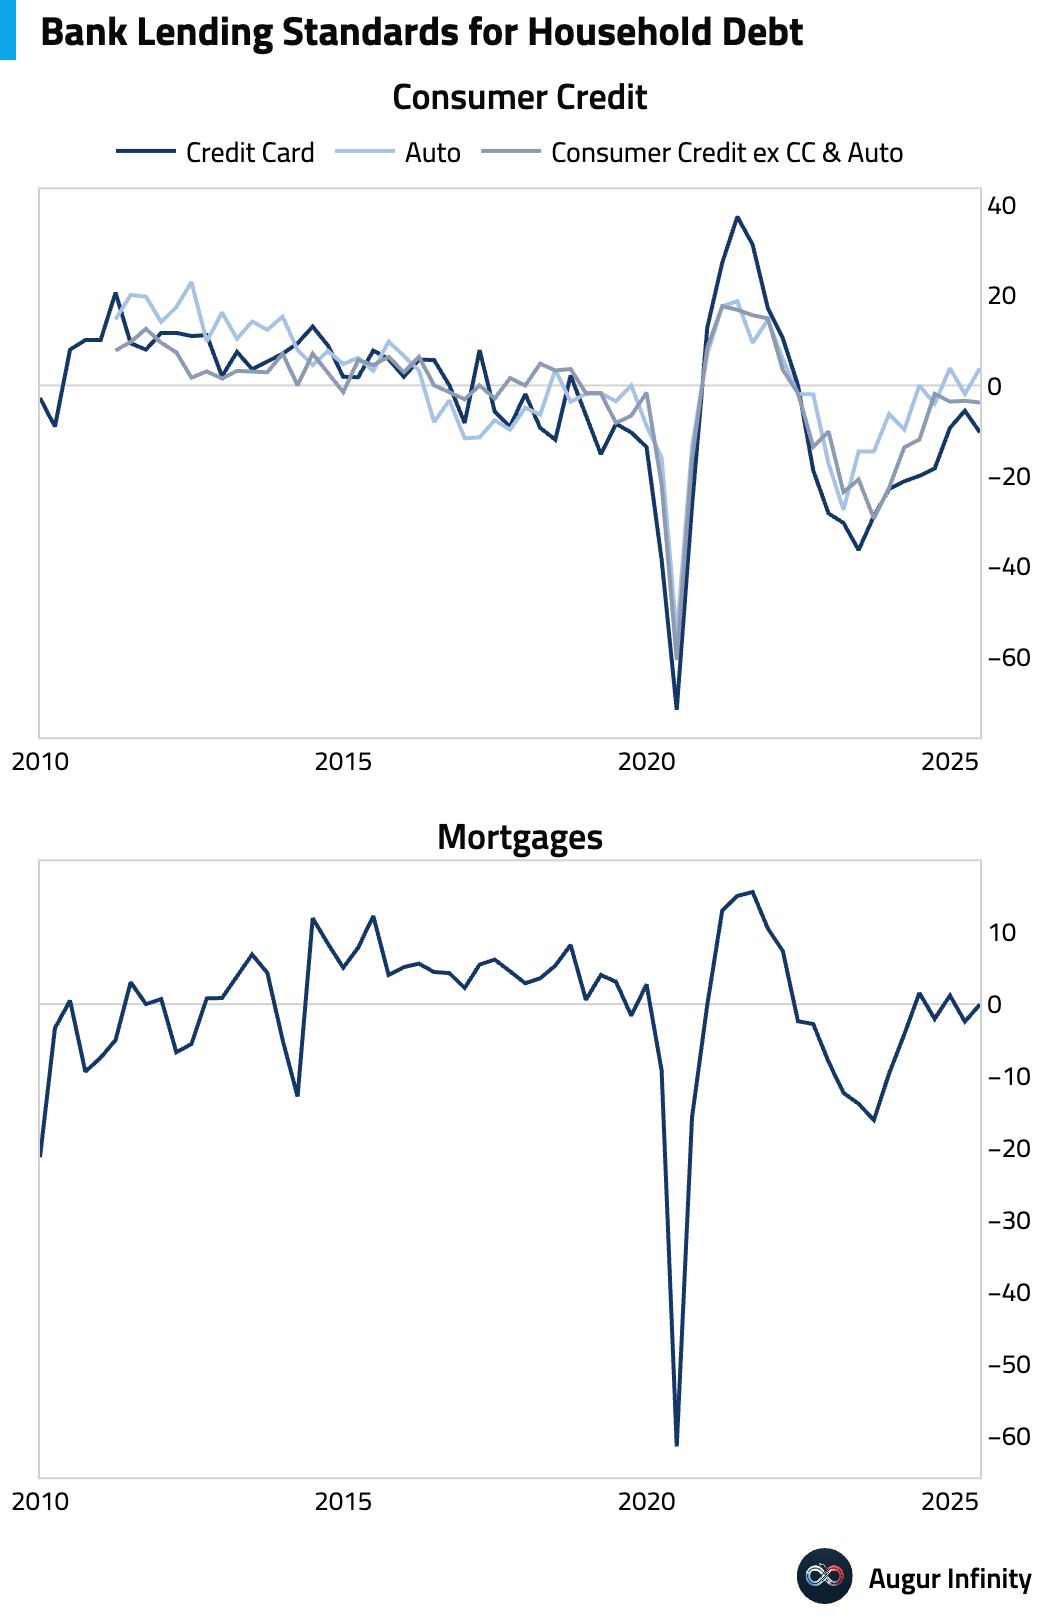
- The July Senior Loan Officer Opinion Survey (SLOOS) showed banks continue to tighten standards for commercial loans amid weaker demand, driven by a less favorable economic outlook. For consumers, standards tightened for credit cards, but were stable for auto loans, which saw stronger demand. Lending standards for mortgages were roughly unchanged.
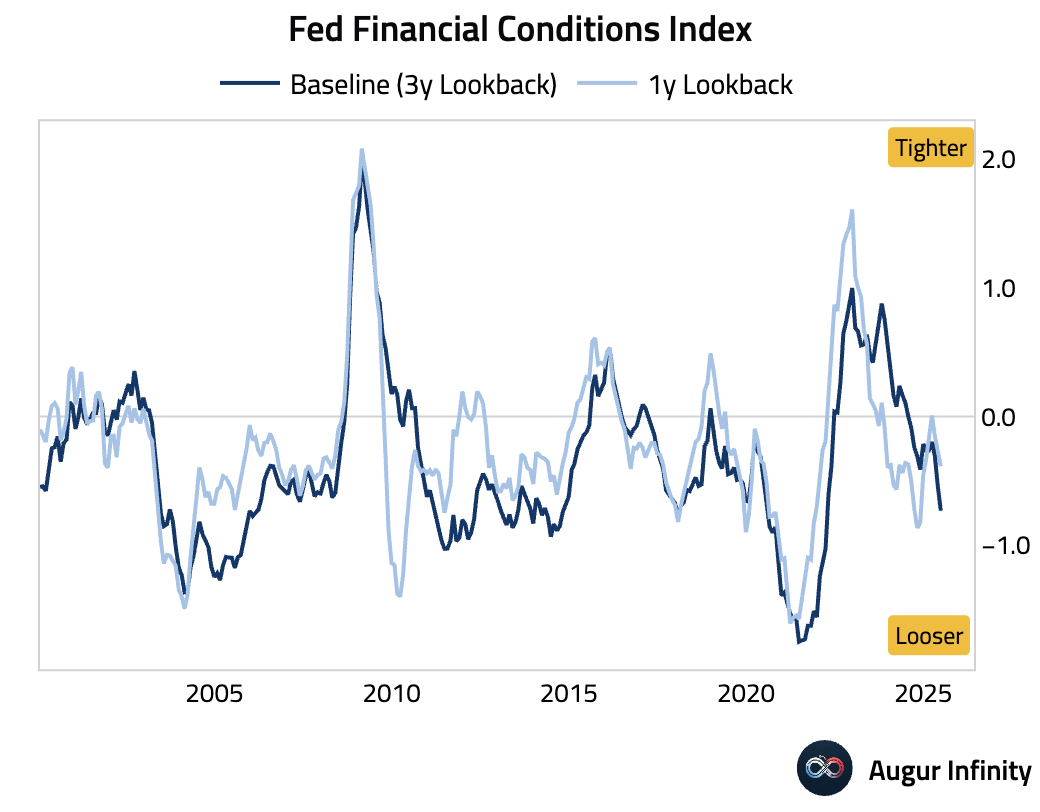
- According to the Fed’s FCI-G Index, financial conditions loosened further in July, reaching their most accommodative level since March 2022.
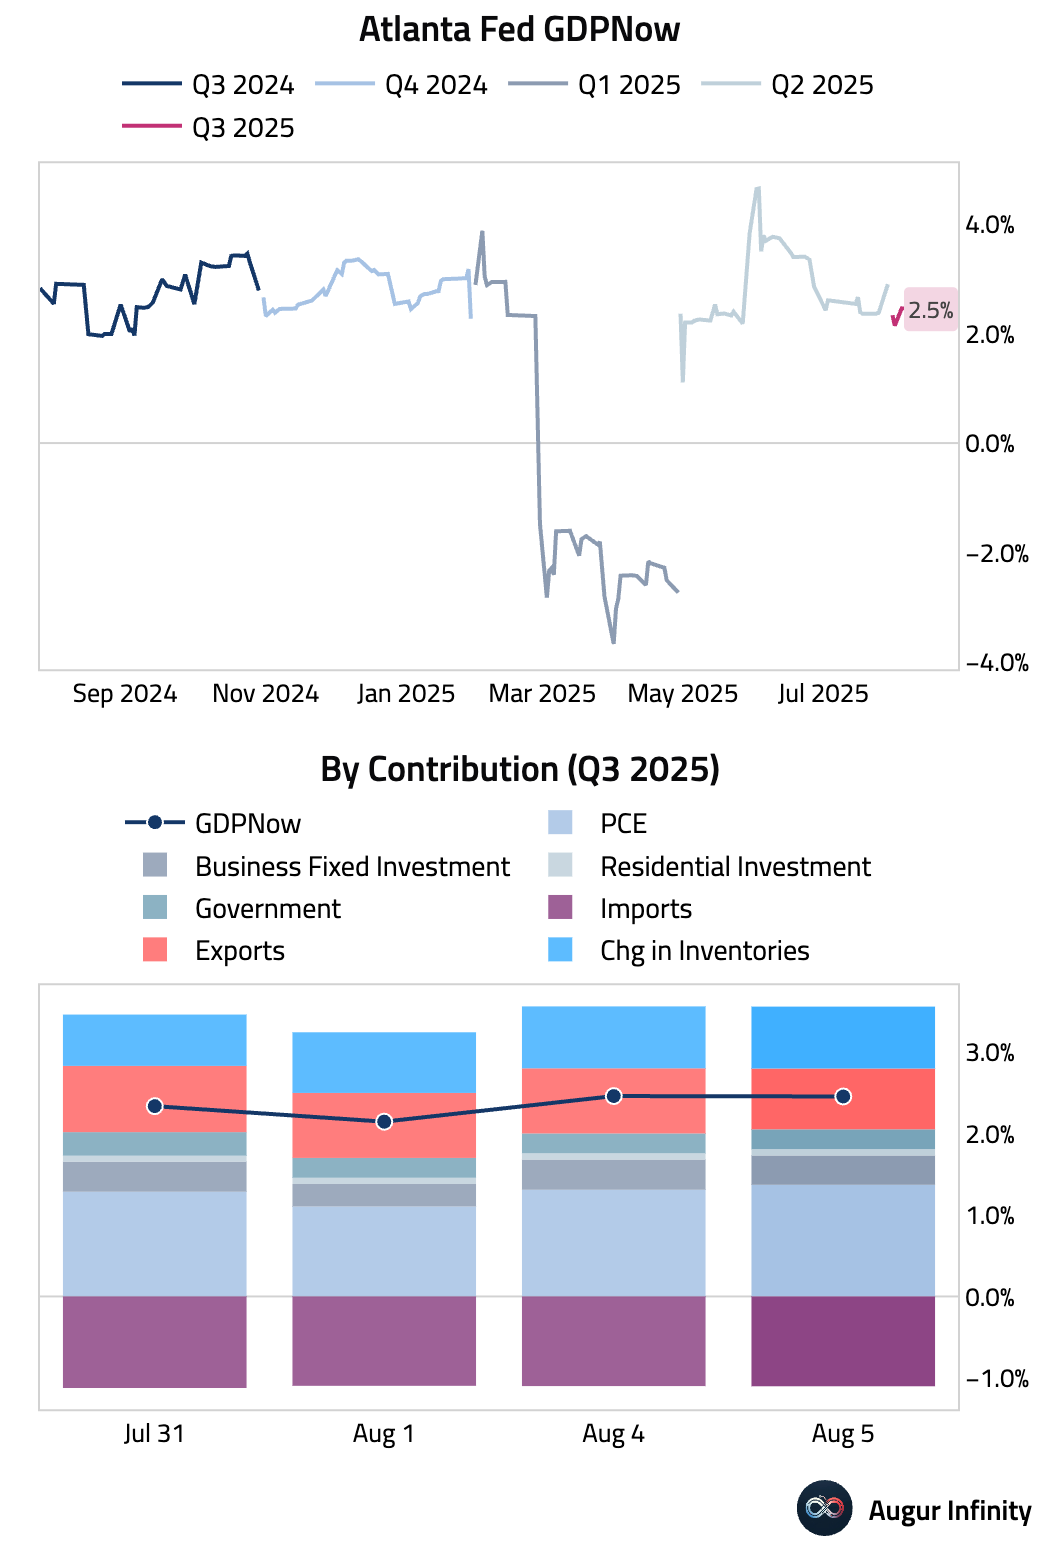
- The Atlanta Fed's GDPNow model is now tracking Q3 GDP at 2.5%, up from 2.1% on August 1.
Canada
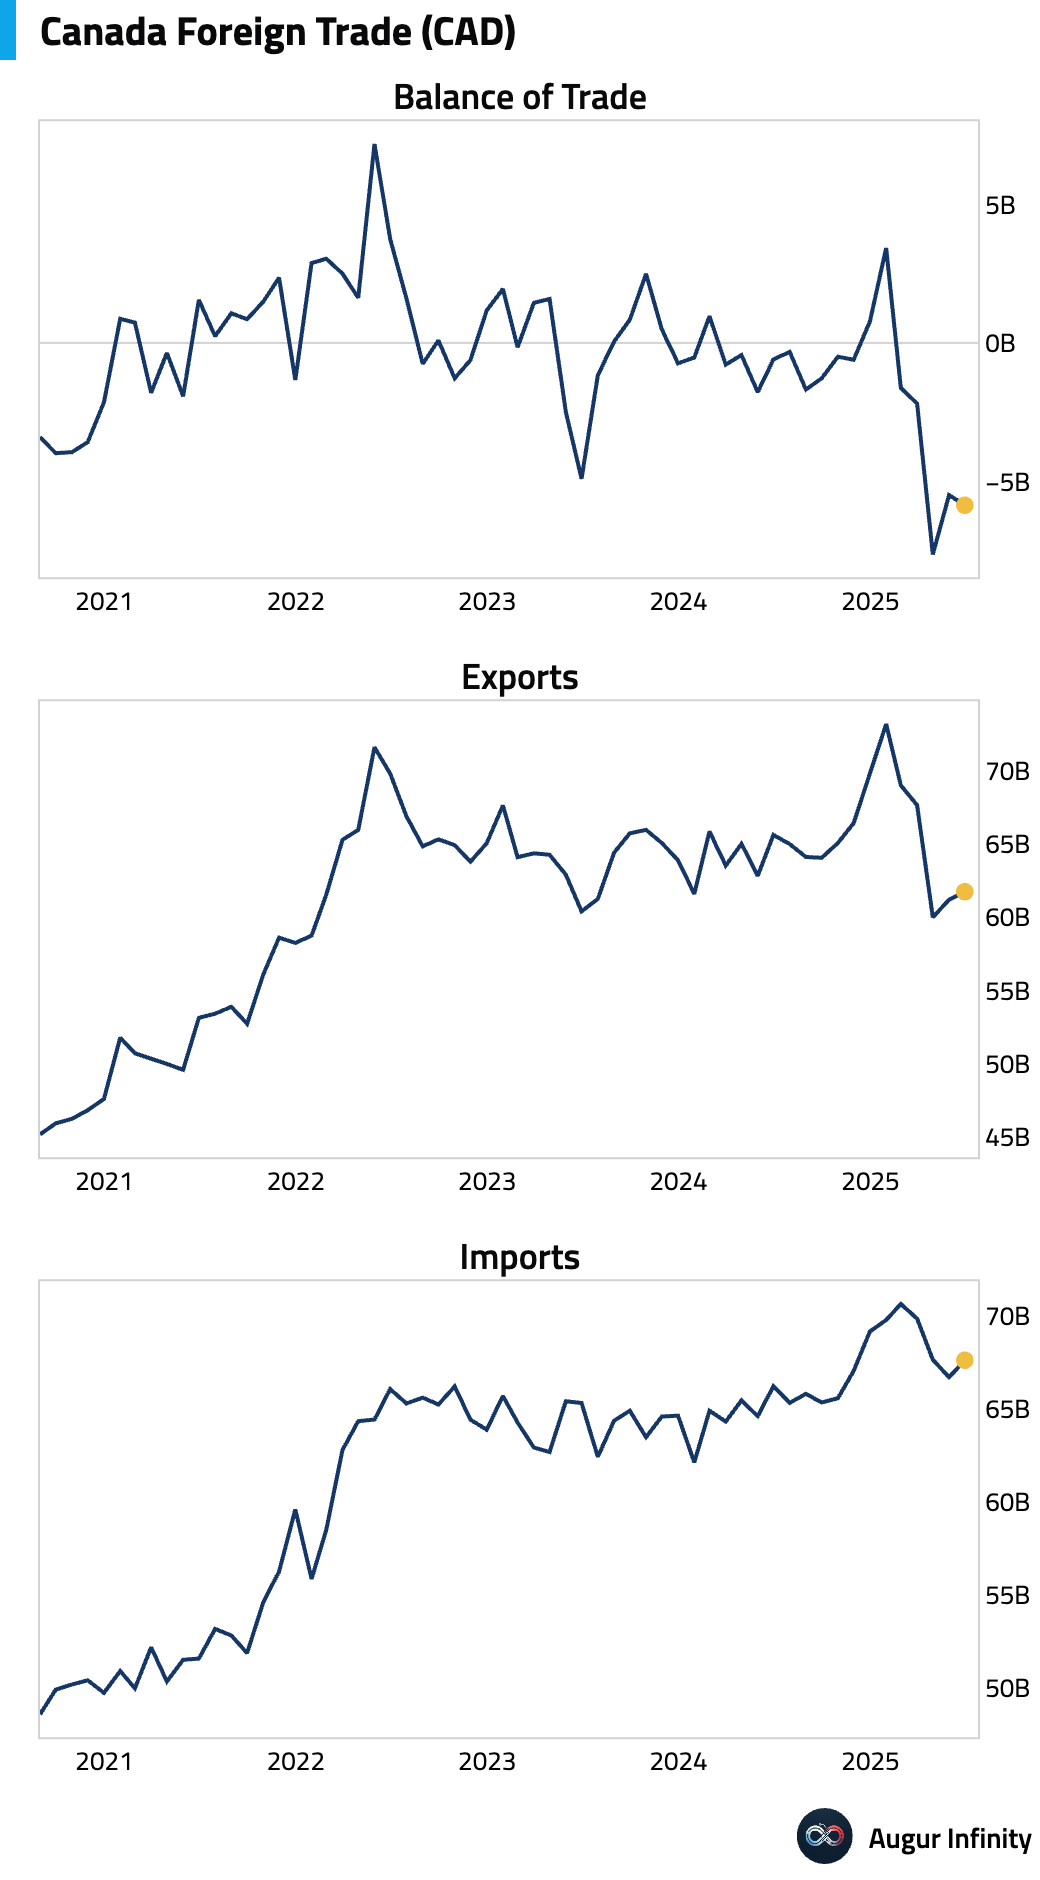
- Canada’s trade deficit widened to C$5.86 billion in June from C$5.49 billion in May, a slightly larger deficit than the C$5.80 billion consensus. The change was driven by a 1.5% rise in imports to C$67.6 billion, which outpaced a 0.9% increase in exports to C$61.7 billion.
Europe
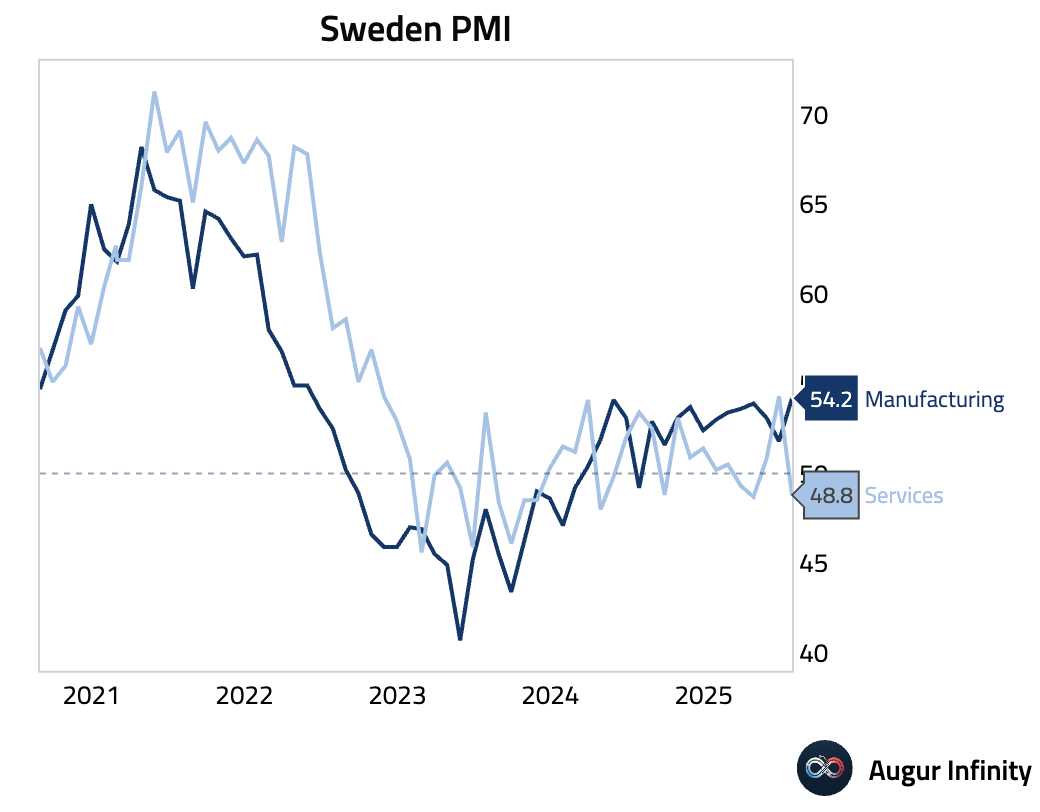
- Sweden’s Services PMI plummeted into contractionary territory, falling to 48.8 in July from 54.3 in June.
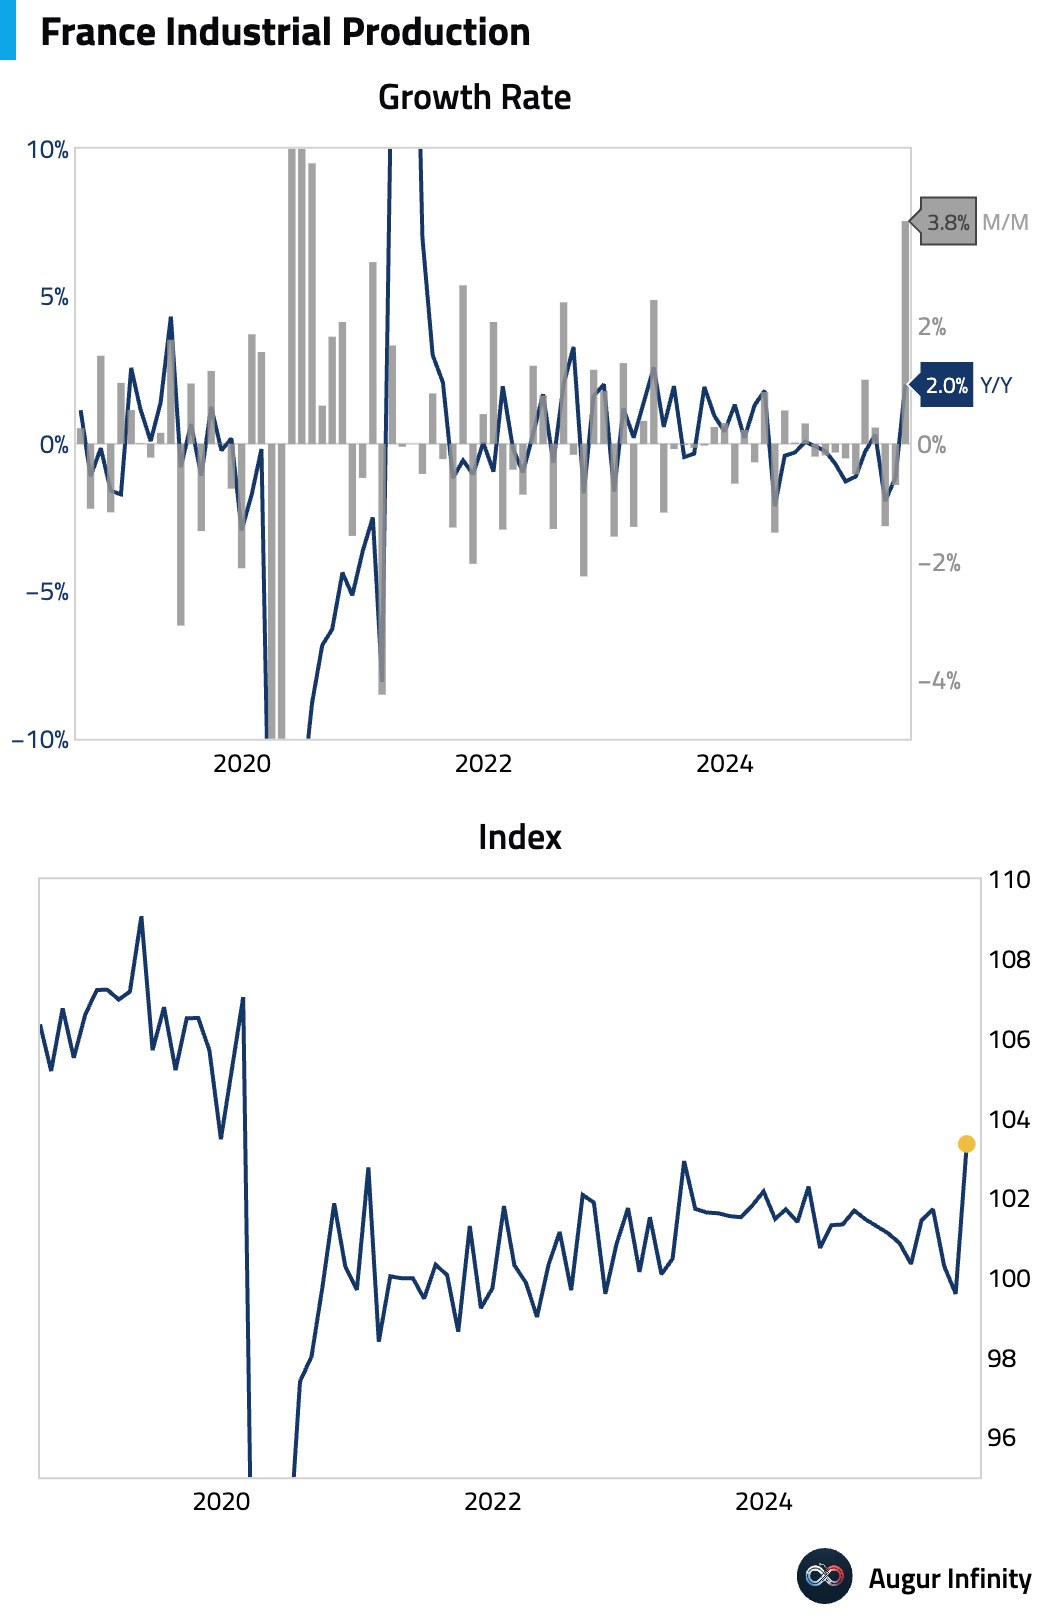
- French industrial production surged 3.8% M/M in June, dramatically exceeding the 0.8% consensus and rebounding from a 0.7% decline in May. The jump was driven by aerospace and transport manufacturing as supply-chain issues eased. The print marks the strongest monthly growth since July 2020.
- France's year-to-date budget deficit widened to €100.4 billion in June from €94.0 billion in May.

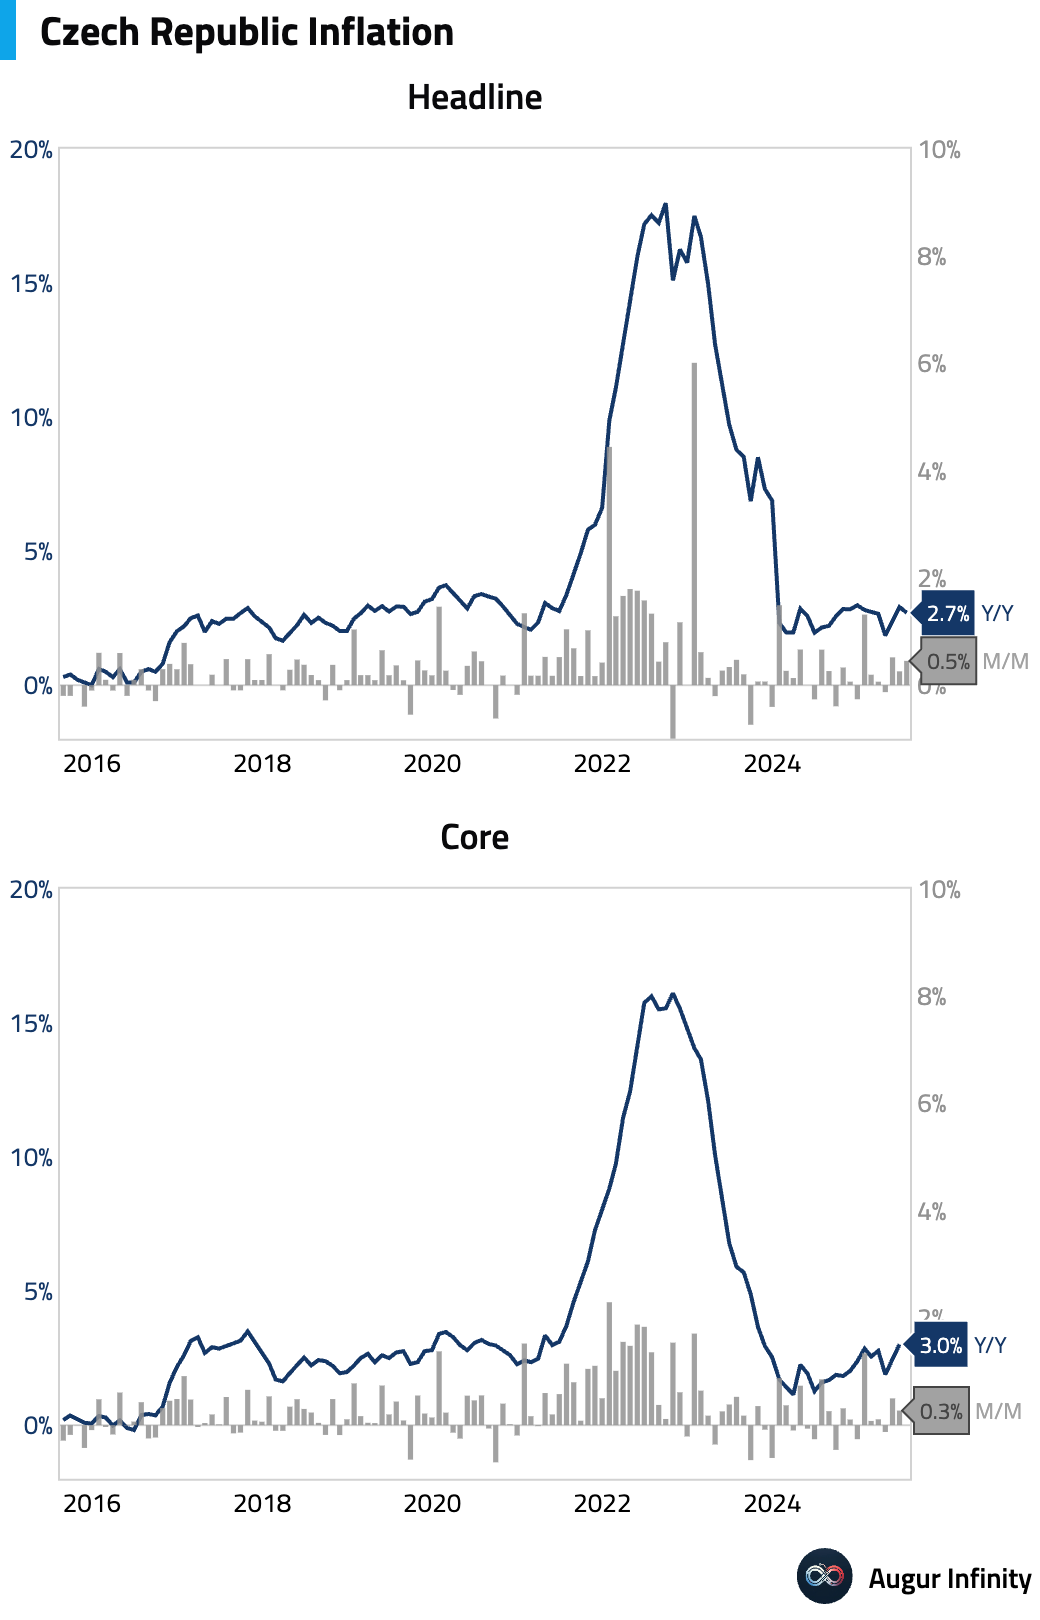
- The preliminary Czech inflation rate for July cooled to 2.7% Y/Y, in line with consensus, from 2.9% in June. On a monthly basis, prices rose 0.5%. While the headline figure eased on base effects and slowing food inflation, underlying details suggest persistent pressure, with services moderation also driven by base effects and a rise in energy costs.
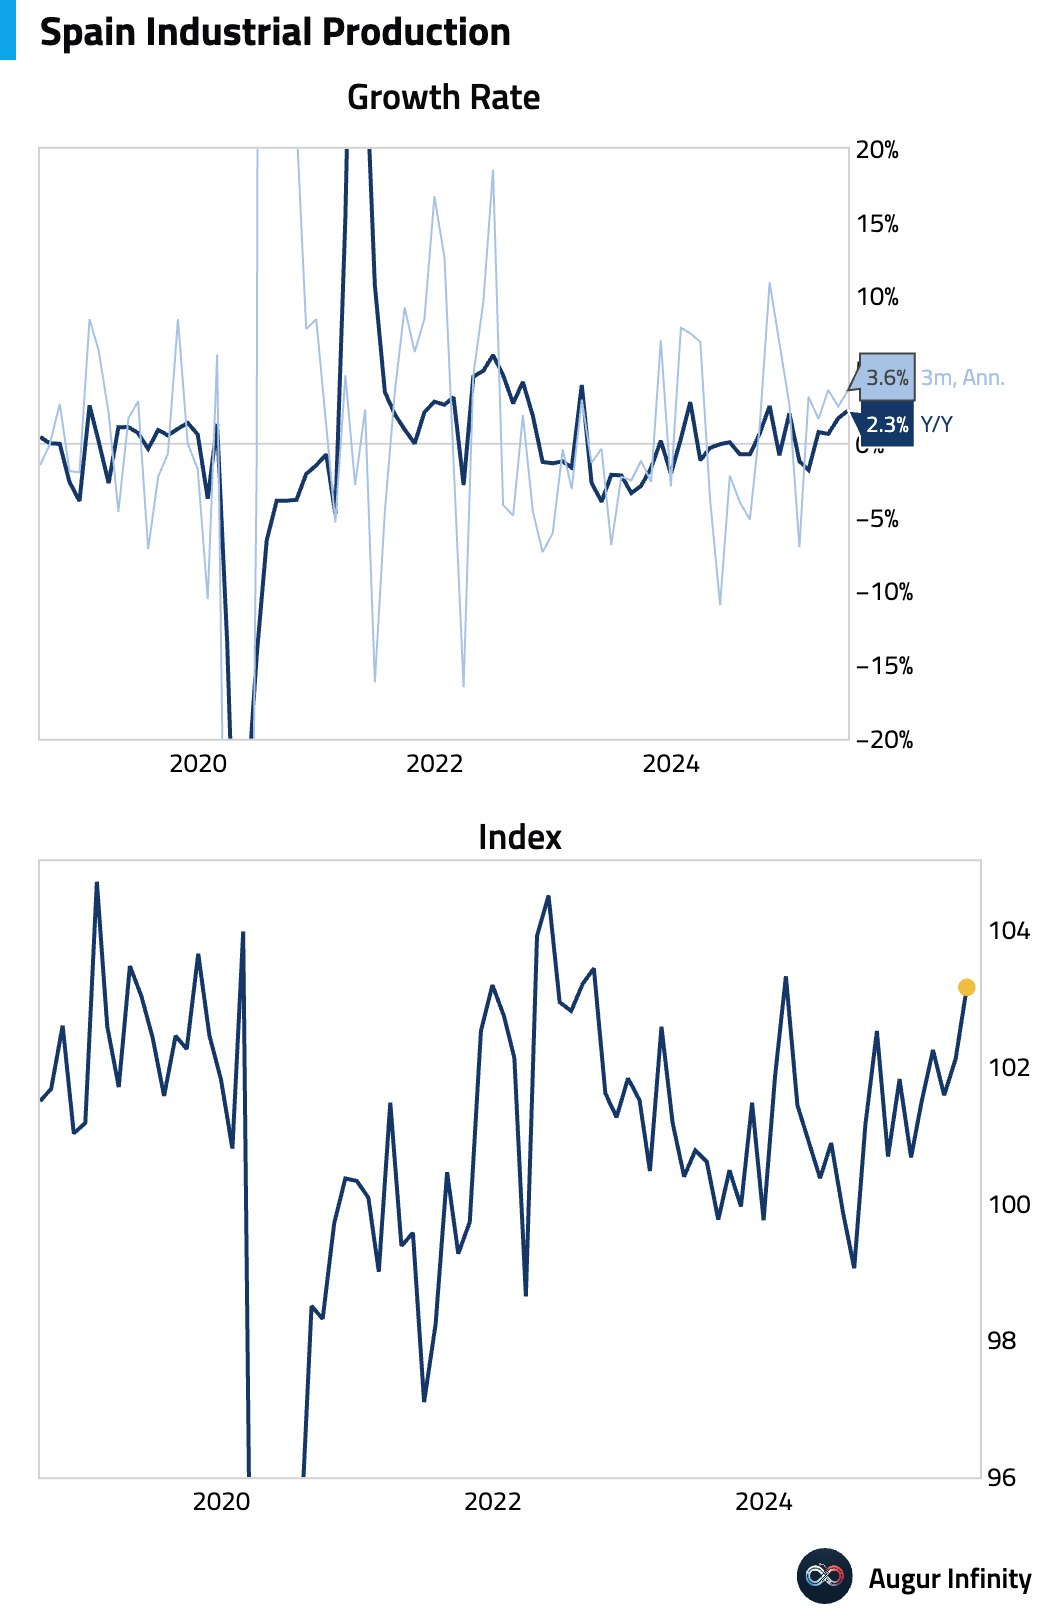
- Spanish industrial production grew 2.3% Y/Y in June, accelerating from a 1.7% pace in May.
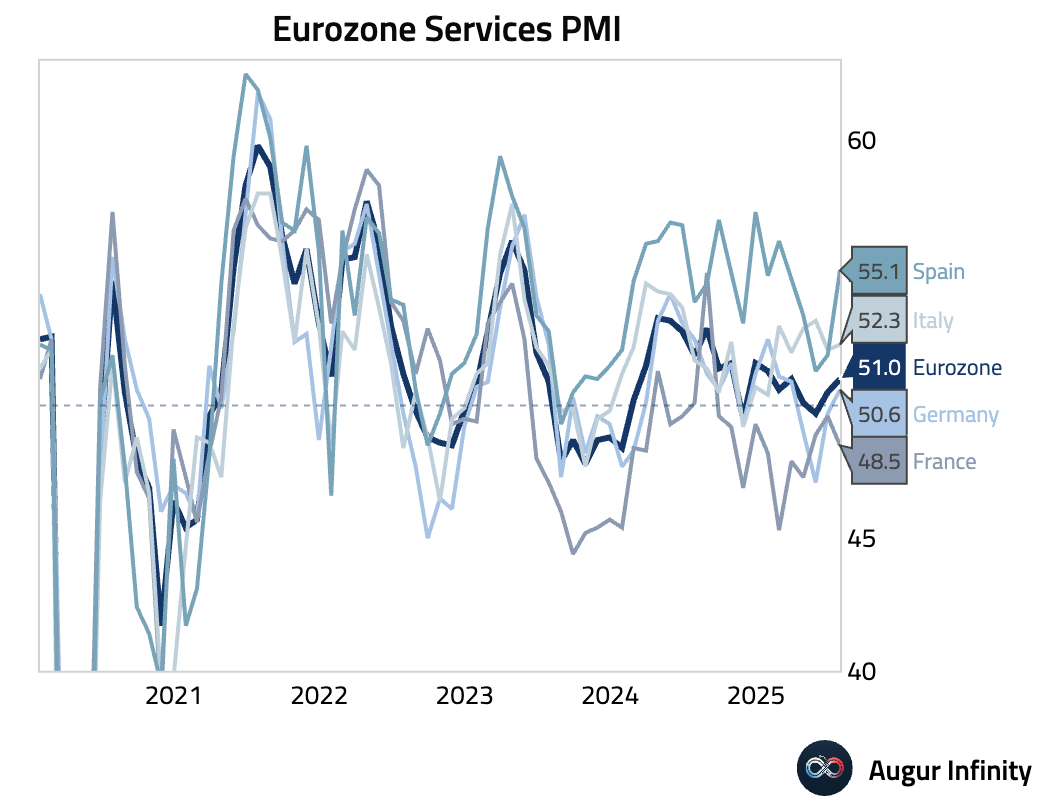
- Final July Services PMI data for the Eurozone showed mixed results, though the aggregate index edged up to 51.0 from 50.5. Spain was a notable outperformer, with its PMI jumping to 55.1, well ahead of the 52.5 consensus. Germany’s PMI rose to 50.6 (vs. 50.1 consensus), while Italy’s reading of 52.3 was slightly below its 52.6 consensus. France’s services sector contracted more than expected, with the PMI falling to 48.5 against a 49.7 forecast.
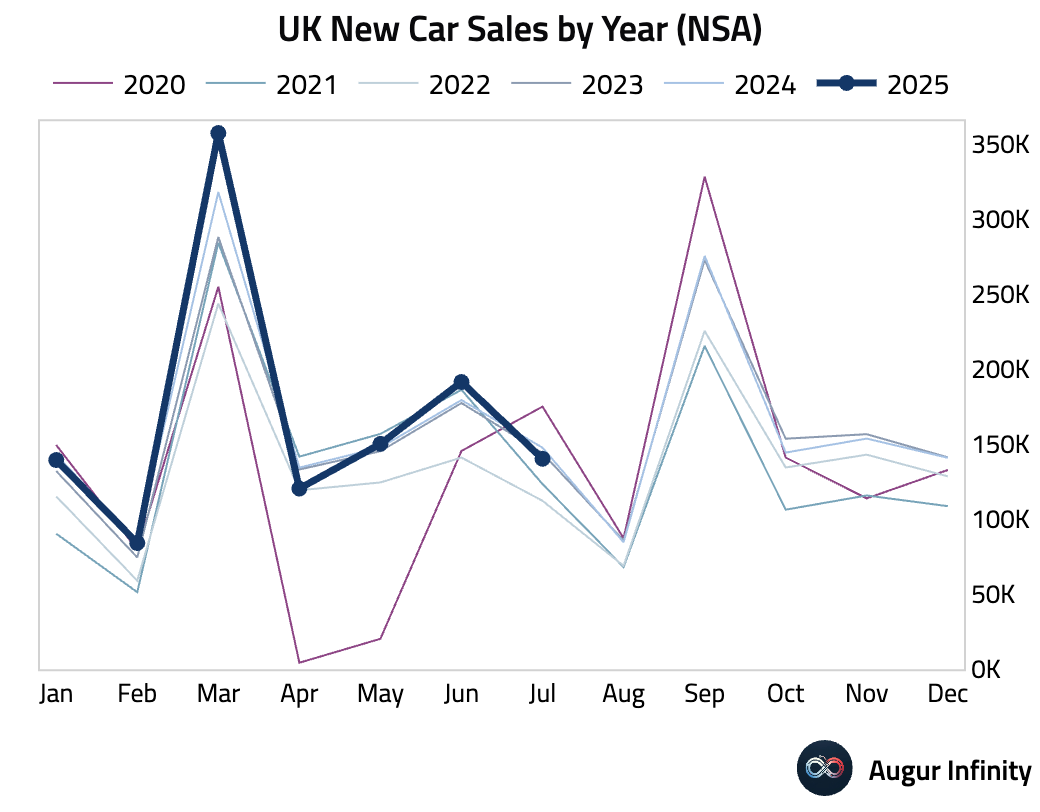
- UK new car sales fell 5.0% Y/Y in July, a sharp reversal from the 6.7% growth seen in June.
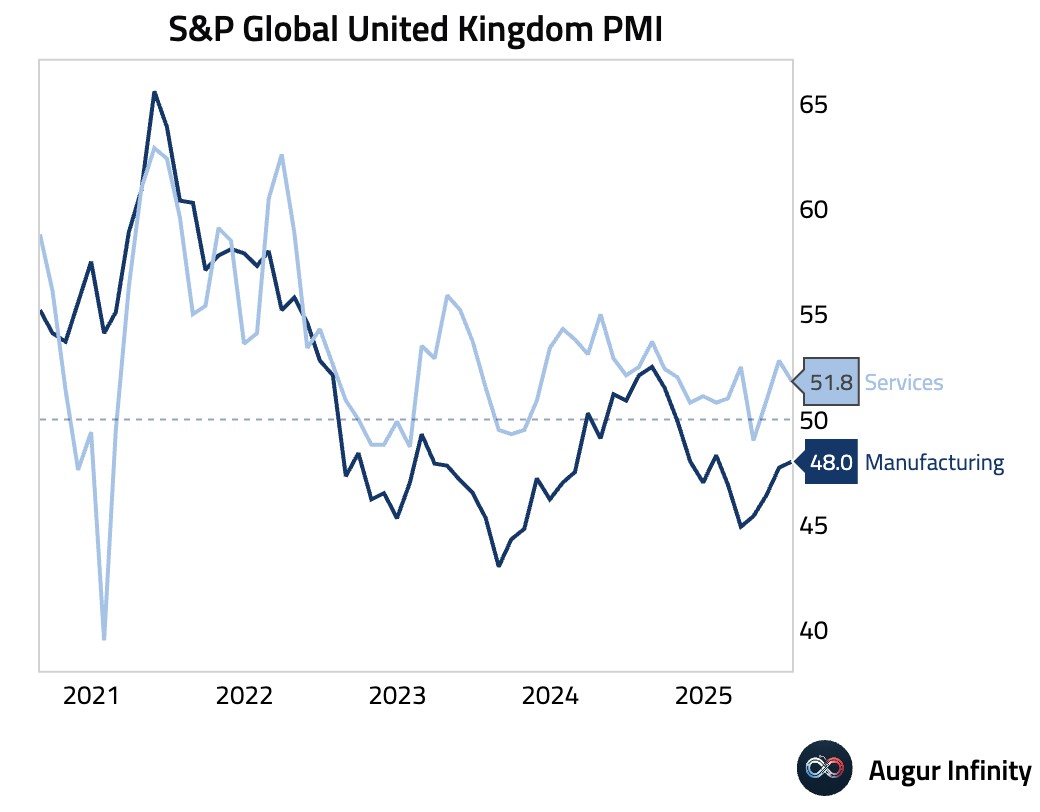
- The UK's final S&P Global Services PMI for July was confirmed at 51.8, slightly above the 51.2 consensus but down from 52.8 in June, indicating a continued but slower expansion in the services sector.
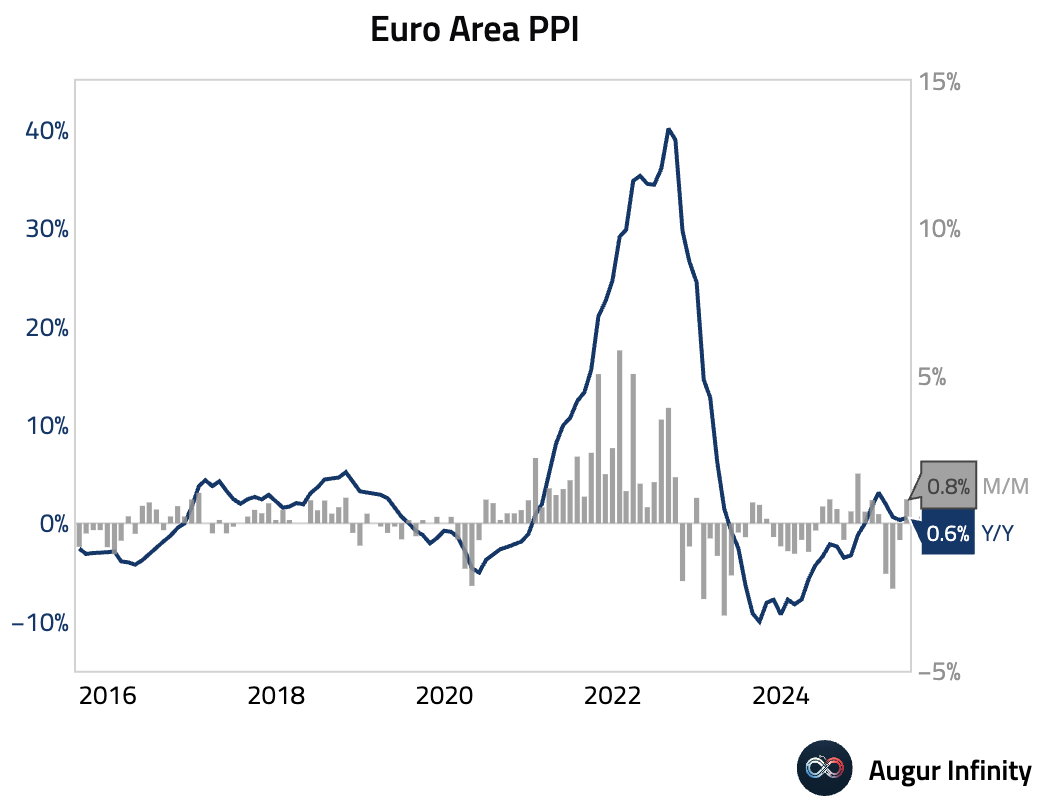
- Euro Area producer prices rose 0.6% Y/Y in June, accelerating from 0.3% in May and slightly above the 0.5% consensus. The monthly figure of 0.8% matched expectations, reversing a 0.6% decline from the prior month.
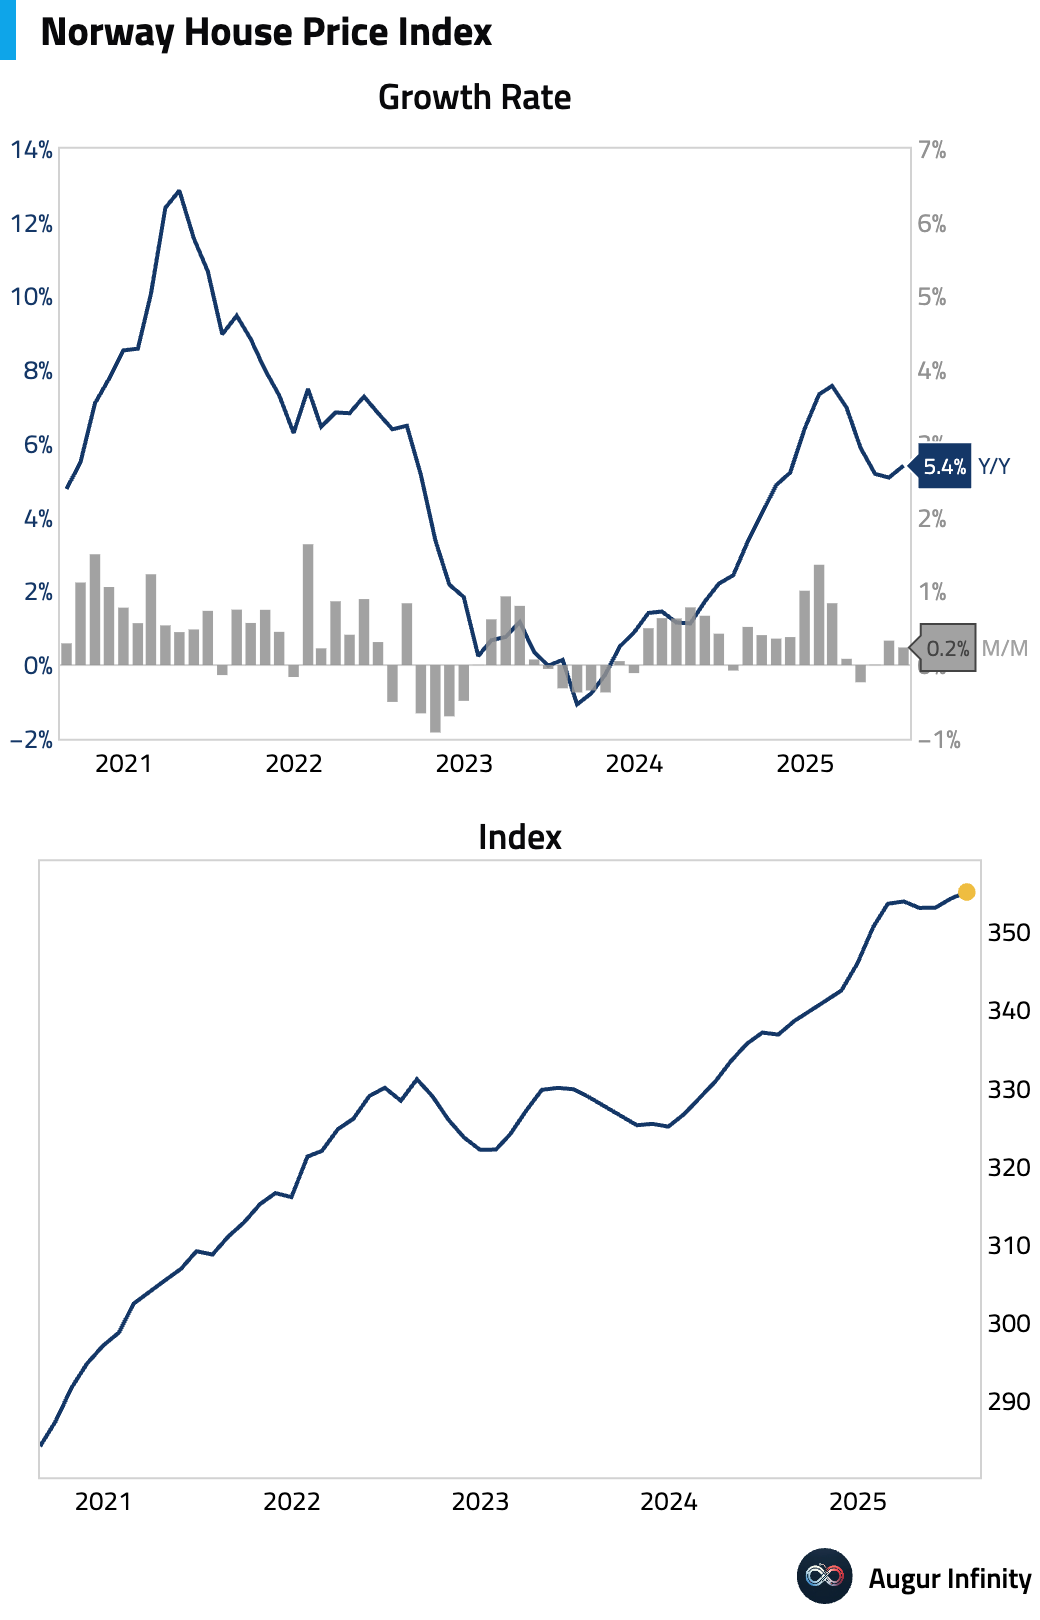
- Norway's House Price Index rose 5.4% Y/Y in July, accelerating from June's 5.1% increase. The M/M gain slowed to 0.2% from 0.3%.
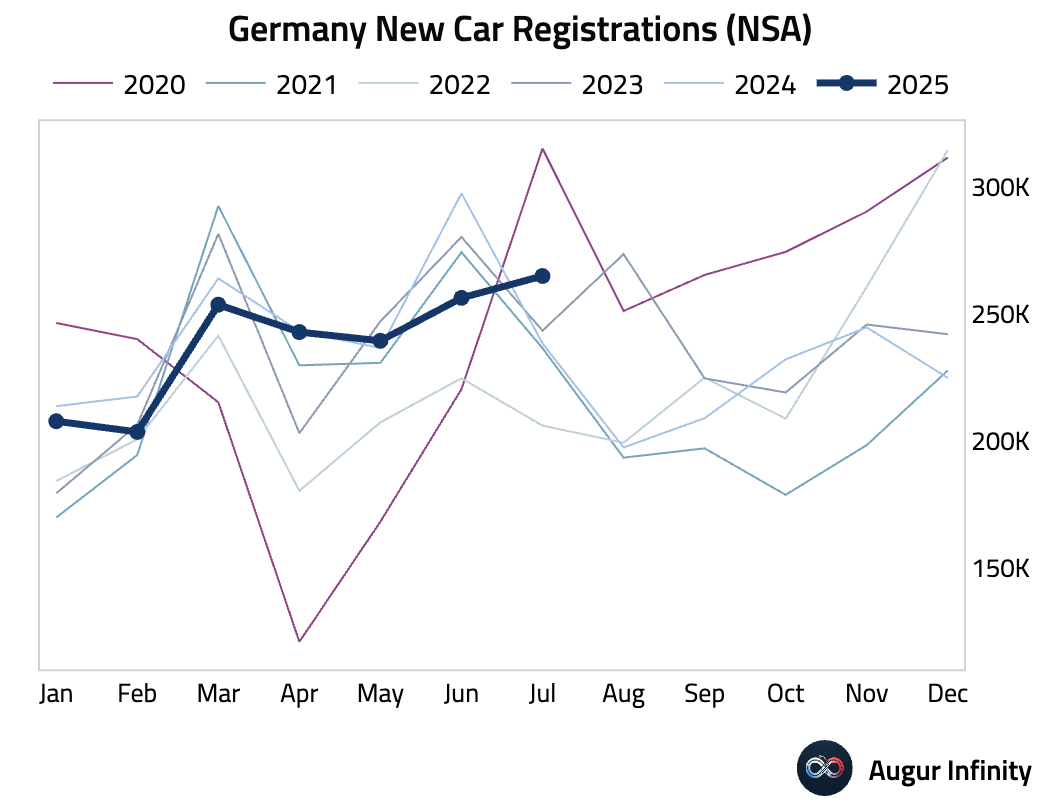
- German new car registrations rebounded sharply in July, rising 11.0% Y/Y after a 13.8% decline in June.
Asia-Pacific
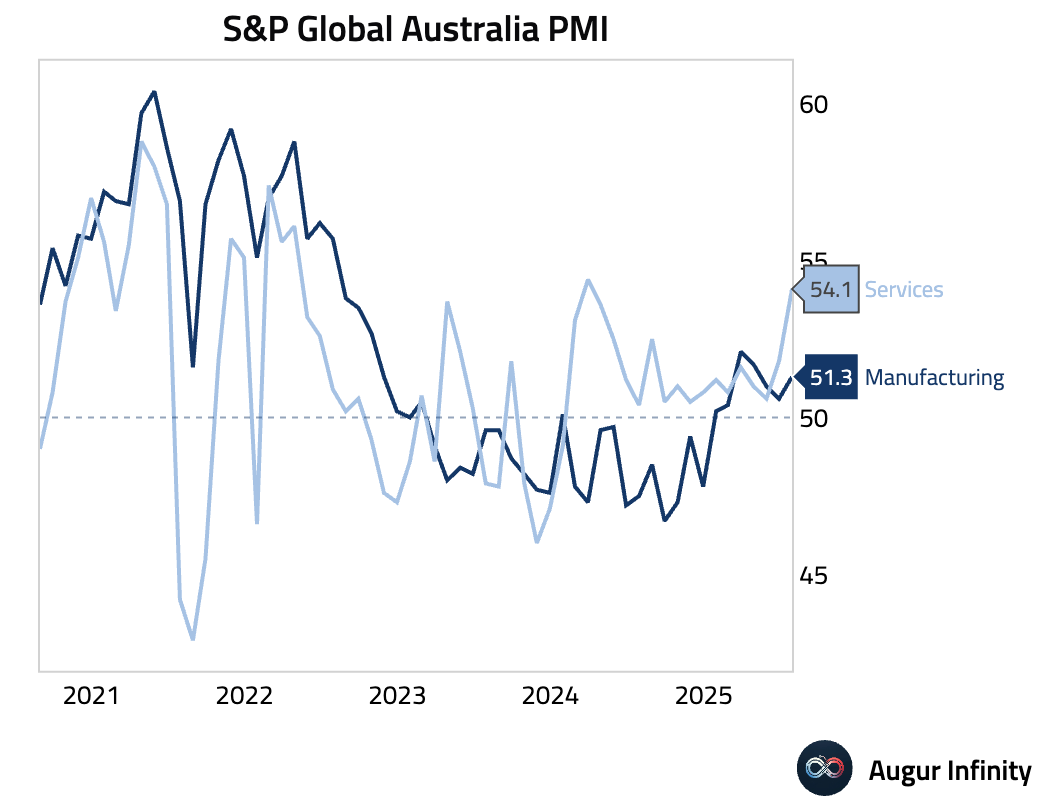
- Australia’s final S&P Global Services PMI for July was confirmed at 54.1, a 16-month high. The surge was driven by the fastest growth in new business in over three years, which prompted accelerated hiring. However, this led to output prices rising at the fastest rate in 23 months, and business confidence fell to a nine-month low, creating a divergence between strong current activity and a cautious outlook.
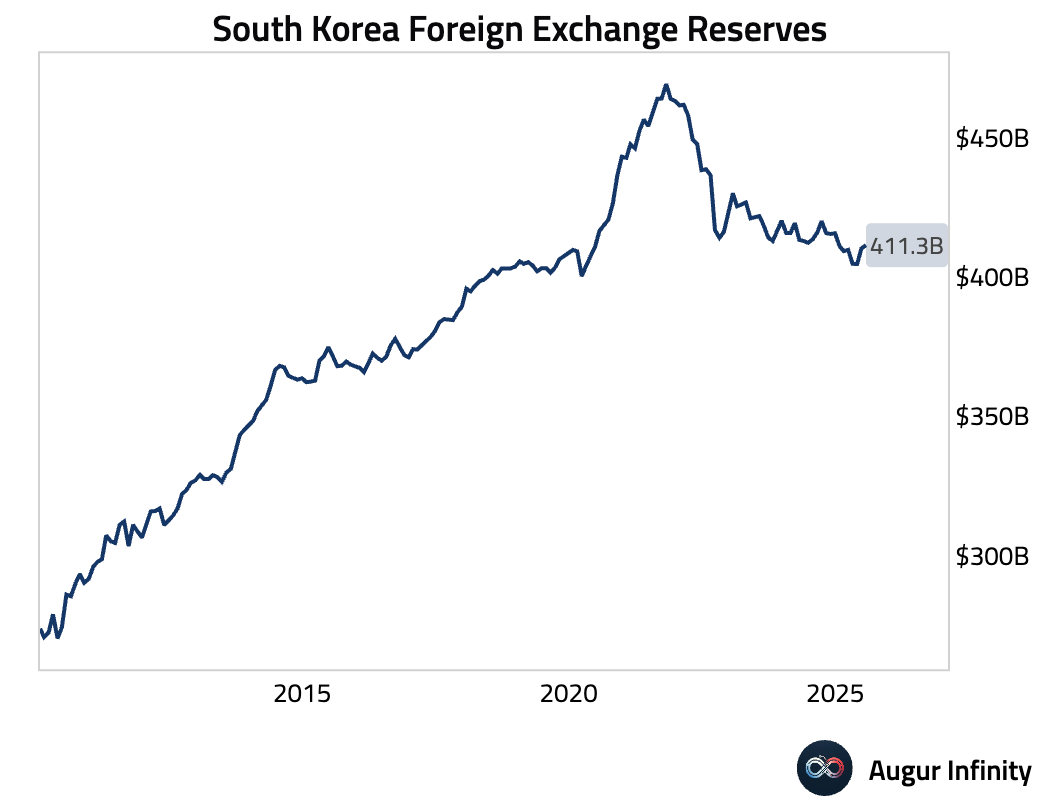
- South Korea’s foreign exchange reserves increased to $411.33 billion in July from $410.20 billion in June.
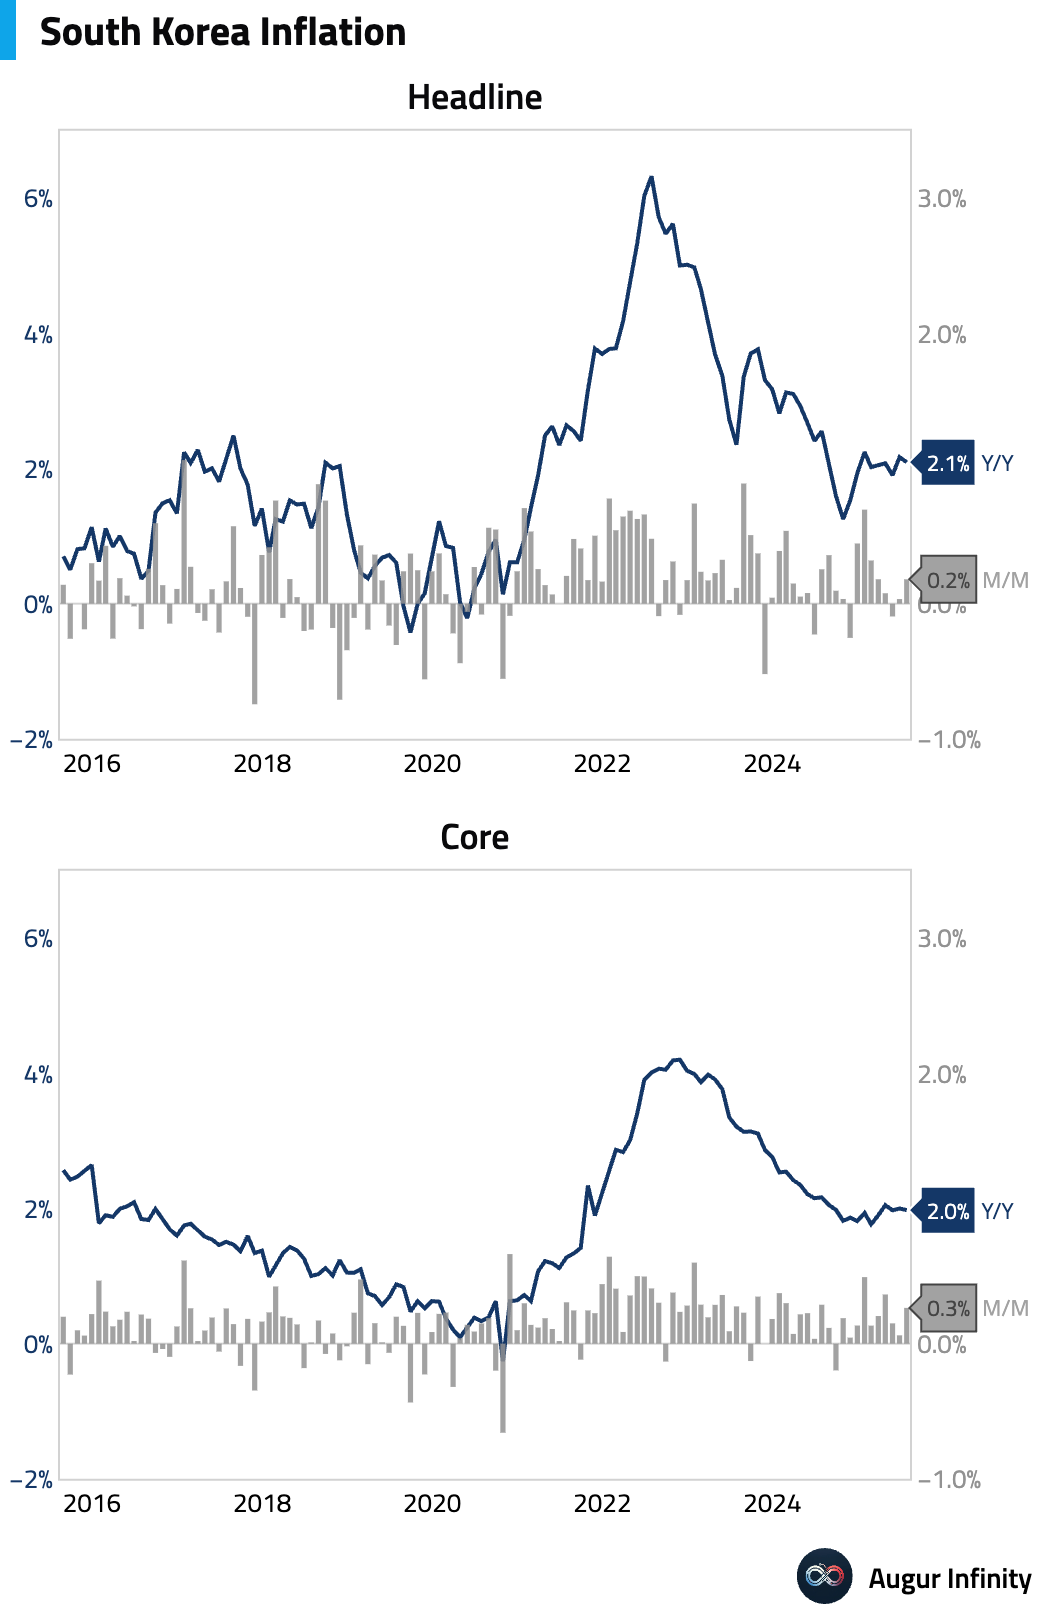
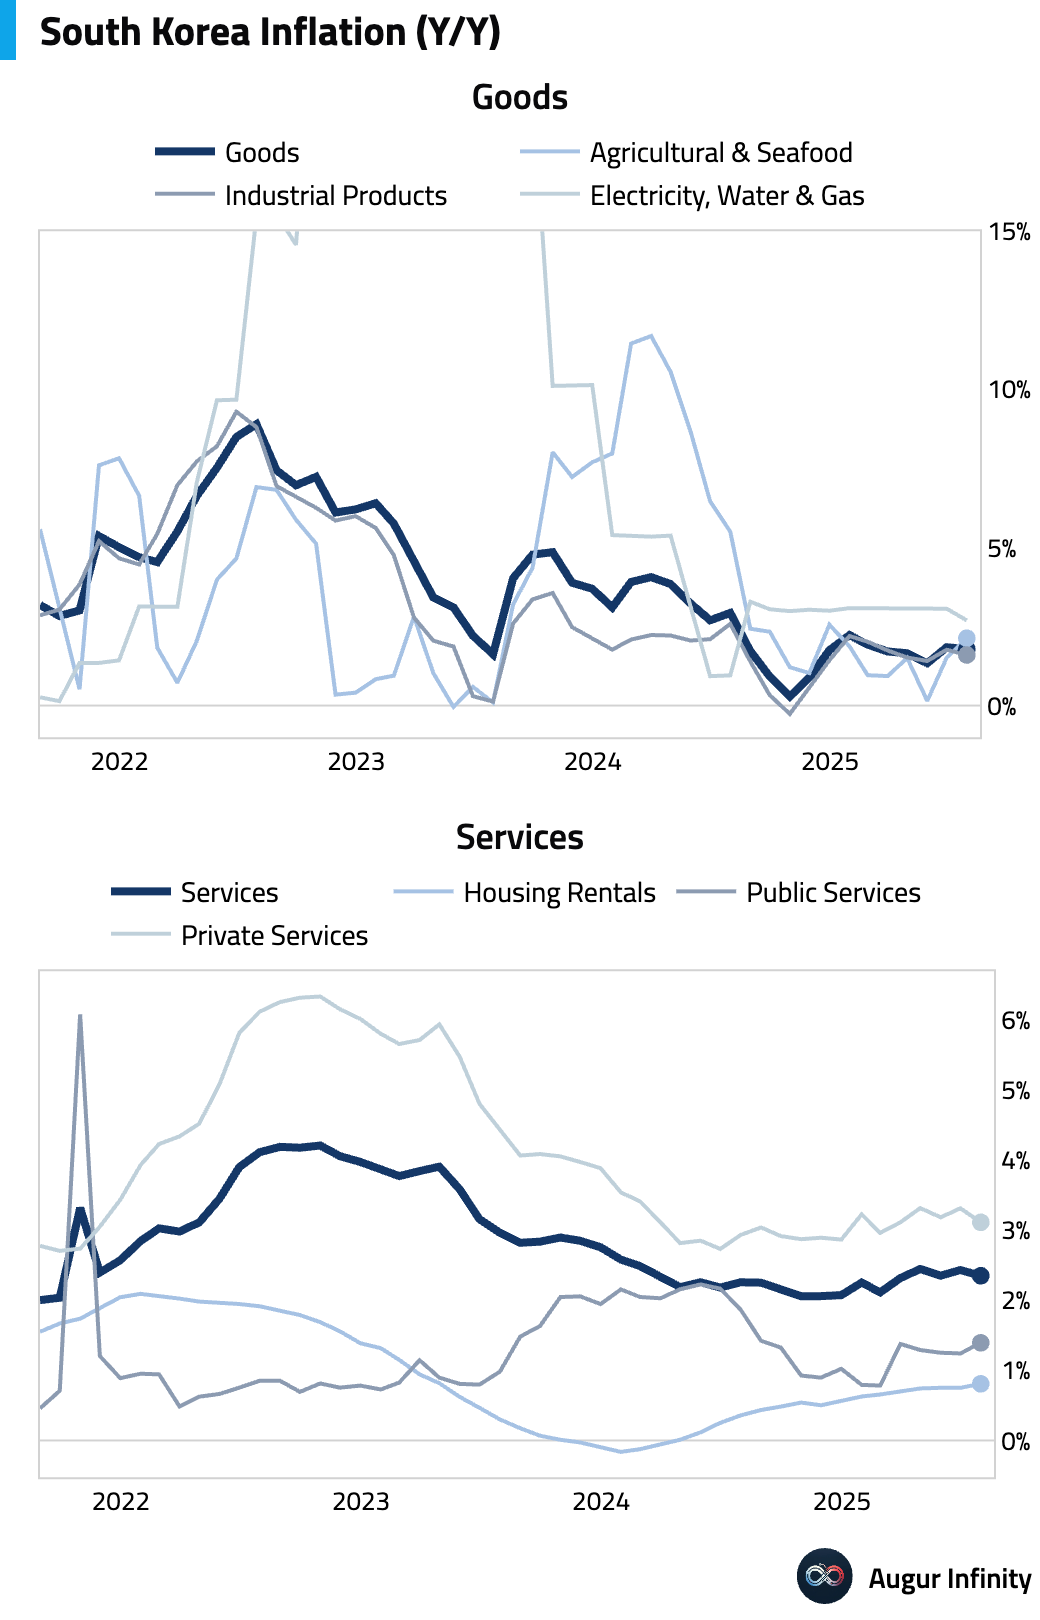
- South Korea's headline inflation moderated to 2.1% Y/Y in July, meeting consensus and down slightly from 2.2% in June. The stable monthly price increase of 0.2% was driven by rising agricultural prices and subway fares being offset by falling fuel prices. Core inflation remained steady at 2.0% Y/Y, with an alternative core measure excluding food services softening to 1.7%, suggesting underlying inflation remains well-contained.
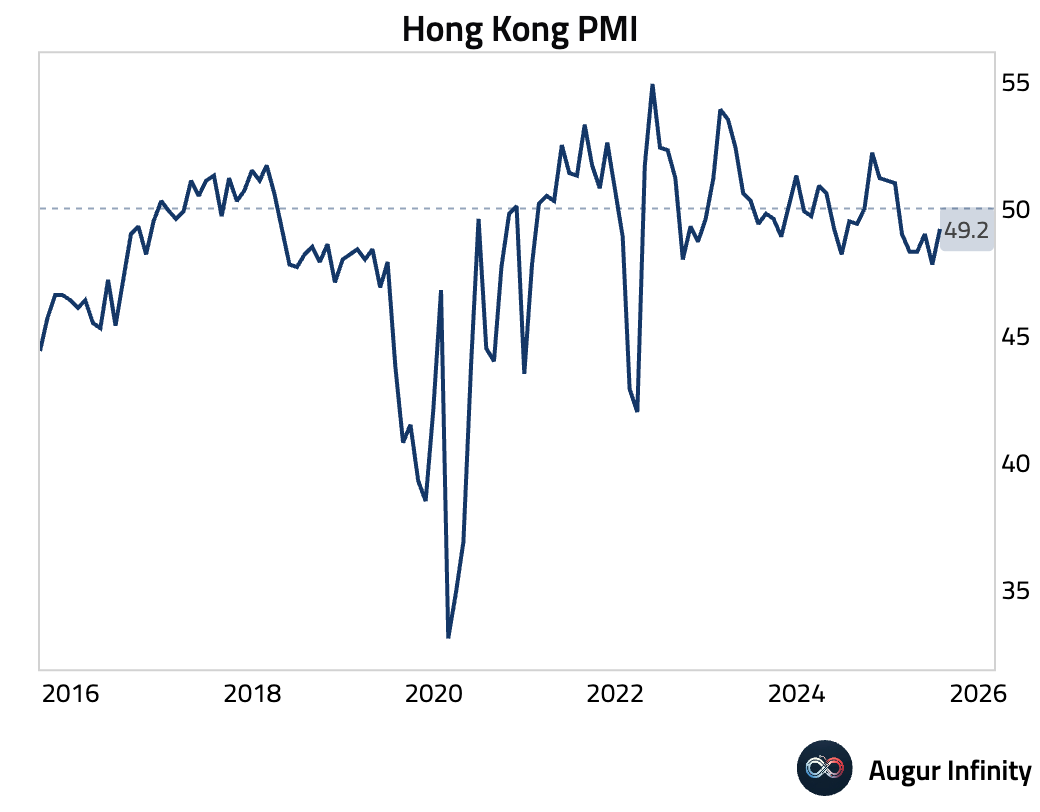
- Hong Kong's S&P Global PMI rose to a six-month high of 49.2 in July from 47.8, but remained in contractionary territory for the sixth consecutive month. The improvement was driven by rebounds in output and new orders, but external demand from mainland China fell further. A renewed drop in employment and the sharpest rise in purchase costs in 3.5 years highlight significant margin pressure, as firms kept selling prices flat to support demand.
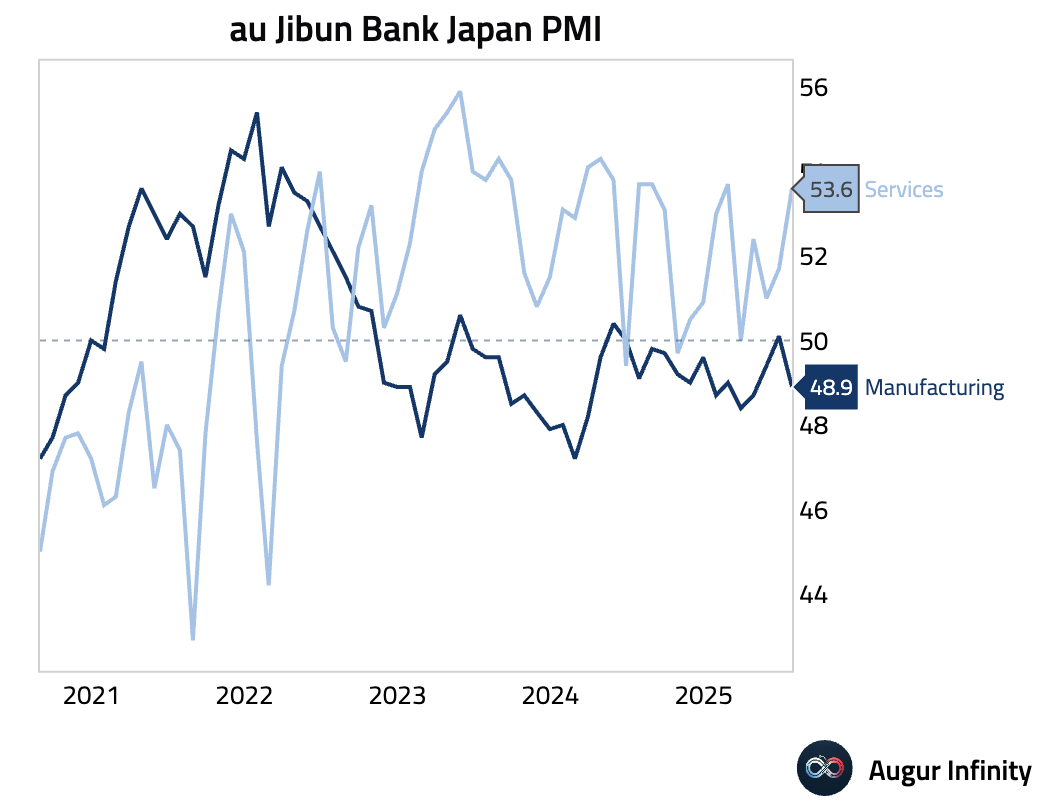
- Japan's final S&P Global Services PMI for July rose to a four-month high of 53.6, supported by stronger domestic new orders. However, new export orders contracted at the fastest pace in over three years, with firms citing lower tourist numbers amid earthquake concerns. Employment growth also stalled for the first time in 21 months, and business confidence dipped to a three-month low, suggesting a cautious outlook.
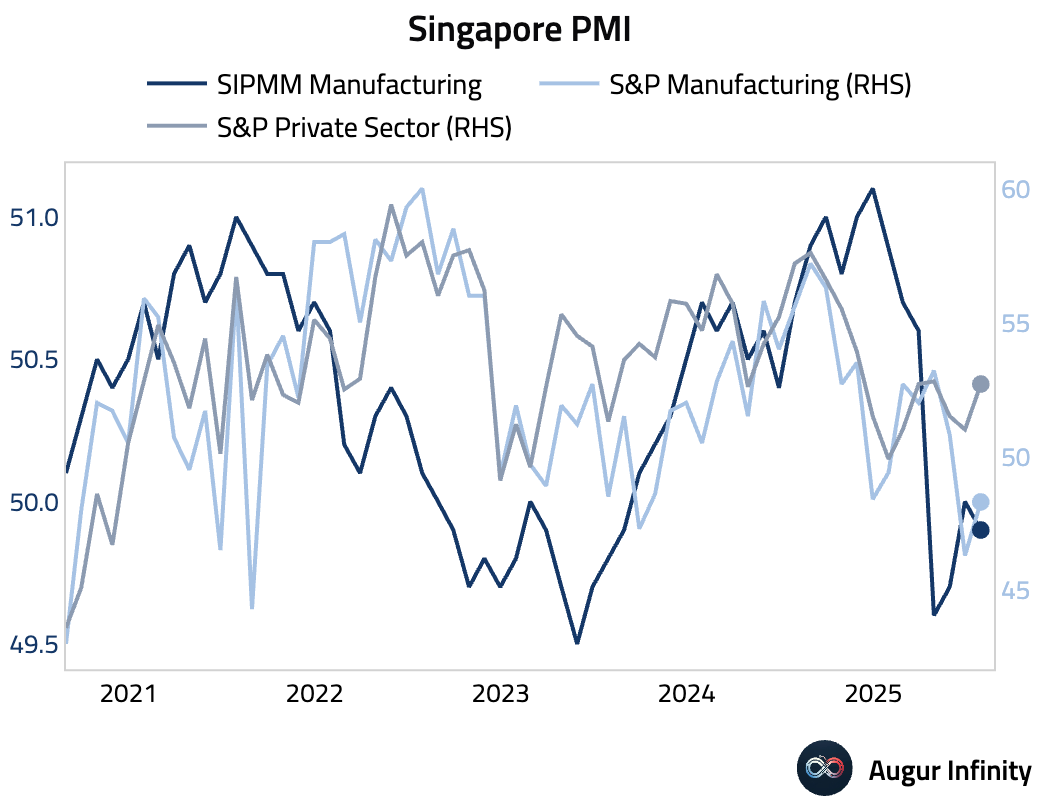
- Singapore's S&P Global PMI reached a three-month high of 52.7 in July, up from 51.0. The rise was driven by sharp growth in new orders and the fastest activity expansion in eight months. This prompted firms to hire for the first time since November 2024. Despite the hiring, a divergence appeared as input costs hit a six-month high while selling prices remained flat due to competition, indicating a significant margin squeeze.
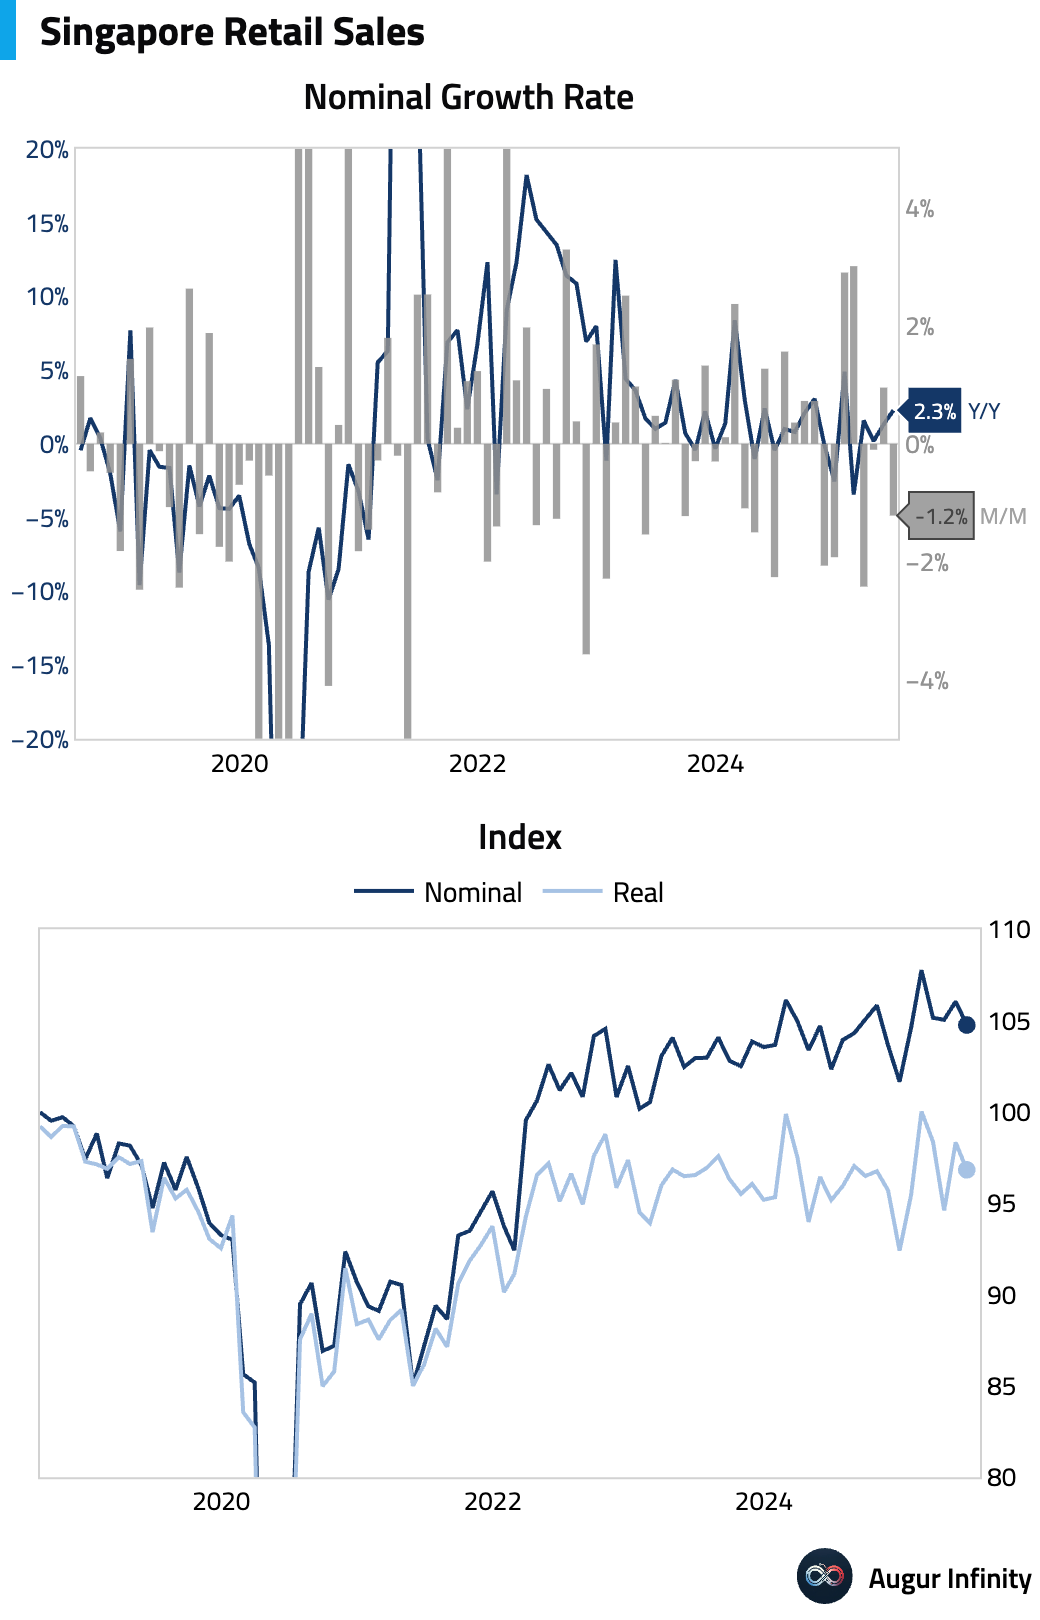
- Singapore's retail sales fell 1.2% M/M in June, reversing a 1.0% gain in May. The year-over-year figure accelerated to 2.3% from 1.3%.
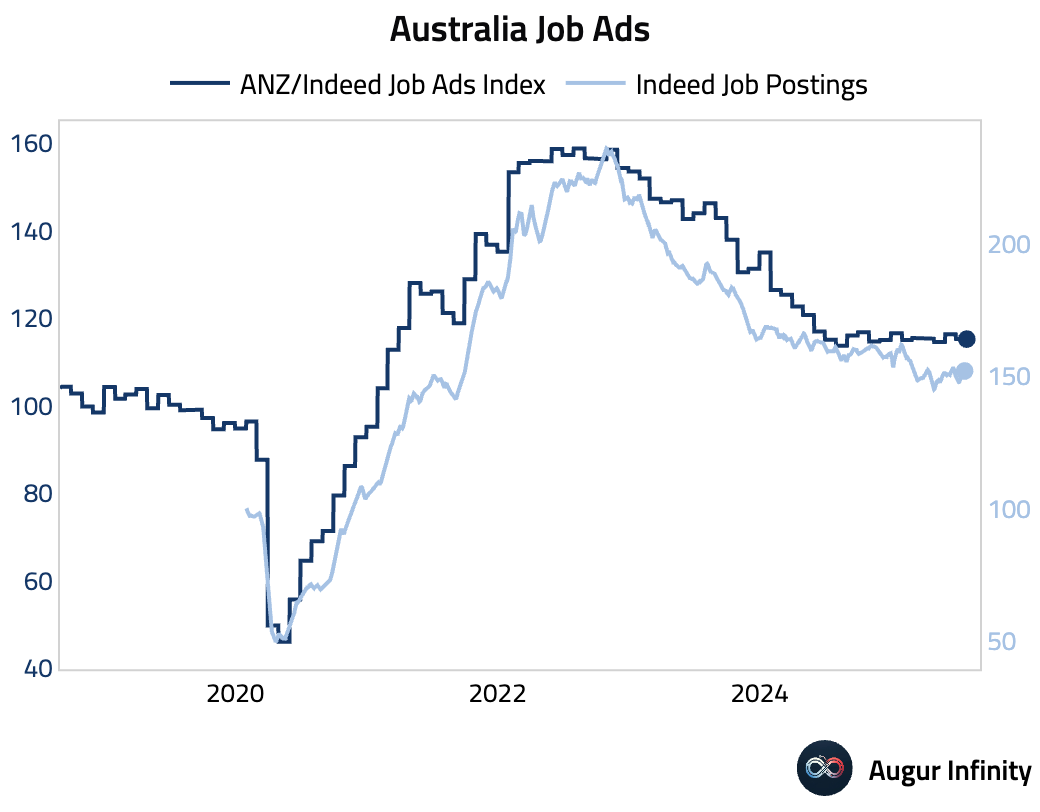
- Australian job advertisements tracked by ANZ-Indeed fell 1.0% M/M in July, following a 1.6% rise in June.
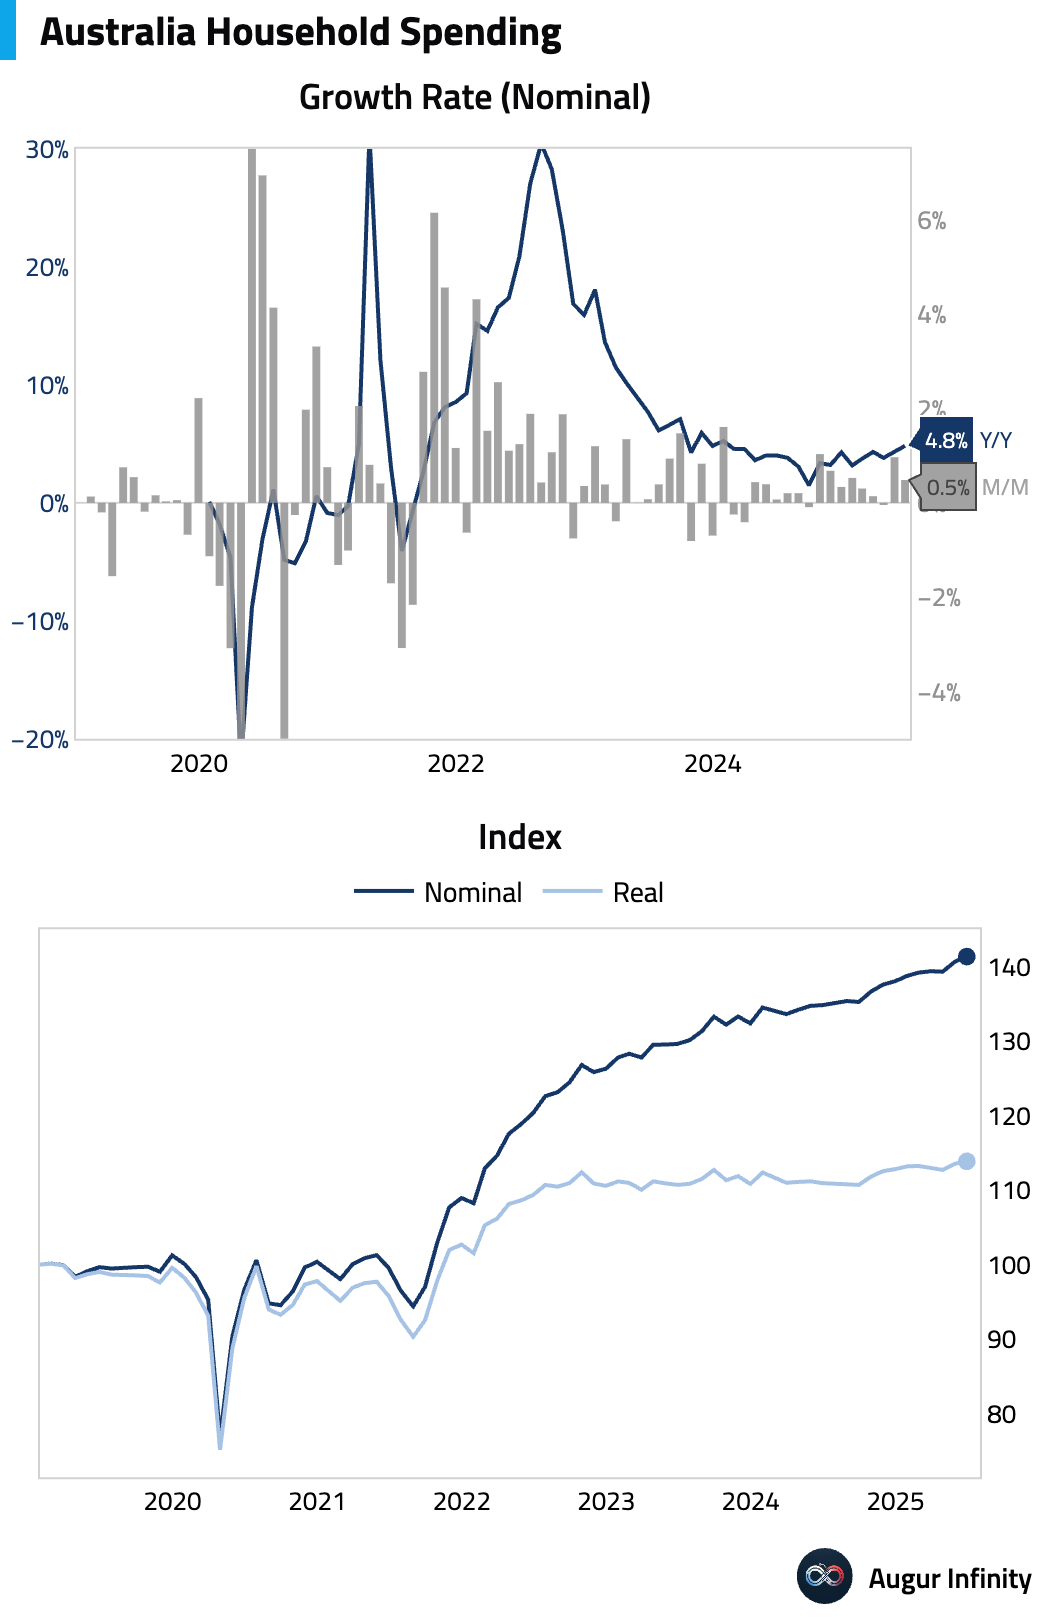
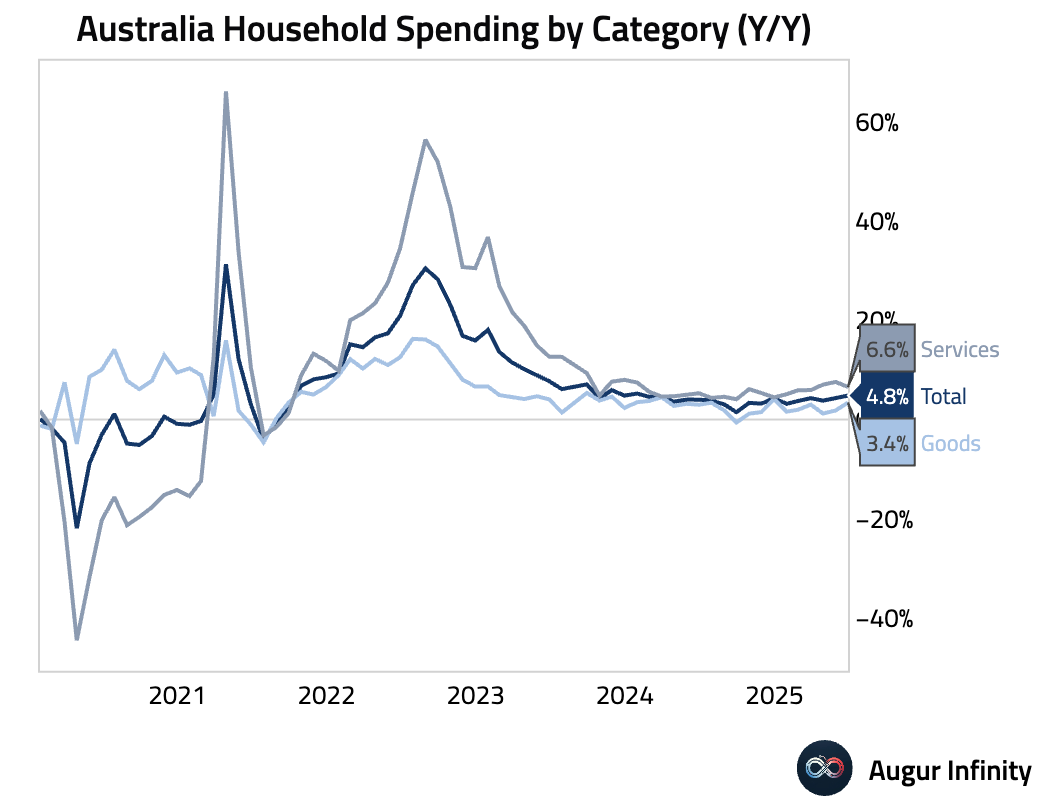
- Australian household spending rose 0.5% M/M in June, driven by end-of-financial-year sales for furniture and clothing. Year-over-year spending accelerated to 4.8%. The data resulted in a surprisingly strong 0.7% Q/Q rise in spending volumes for Q2, well above expectations.
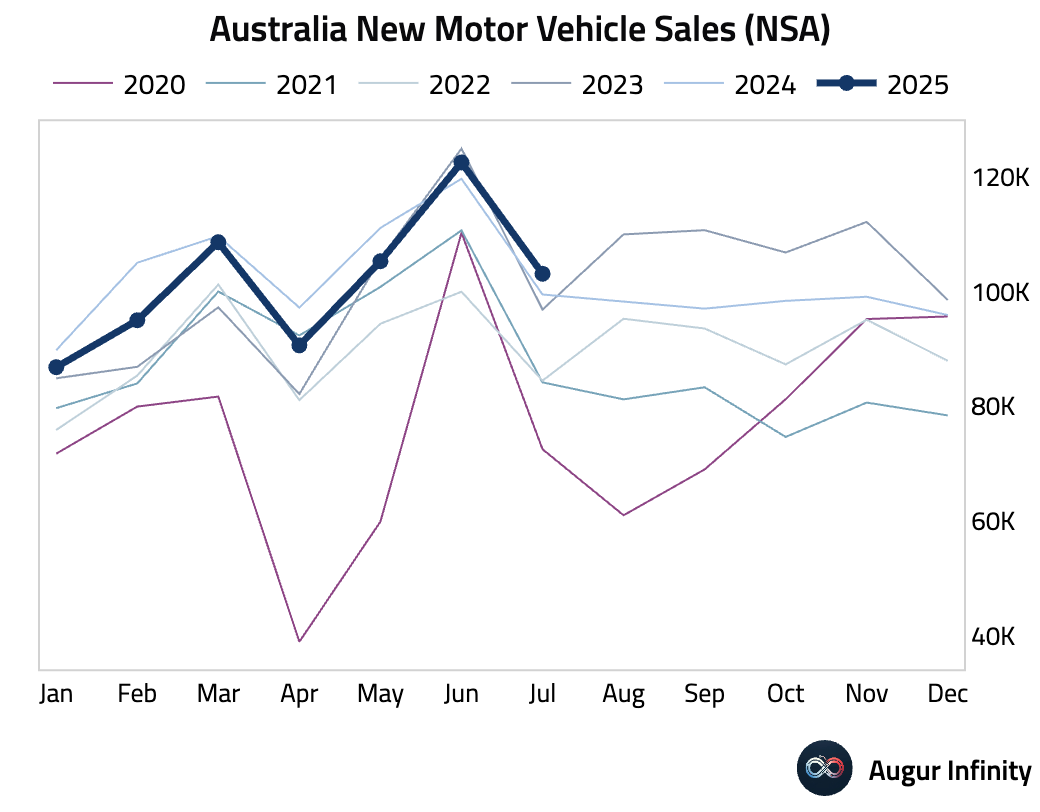
- Australians showed strong demand for new motor vehicles in July, with 103k delivered, up 3.6% Y/Y. This is the strongest July vehicle sales on record.
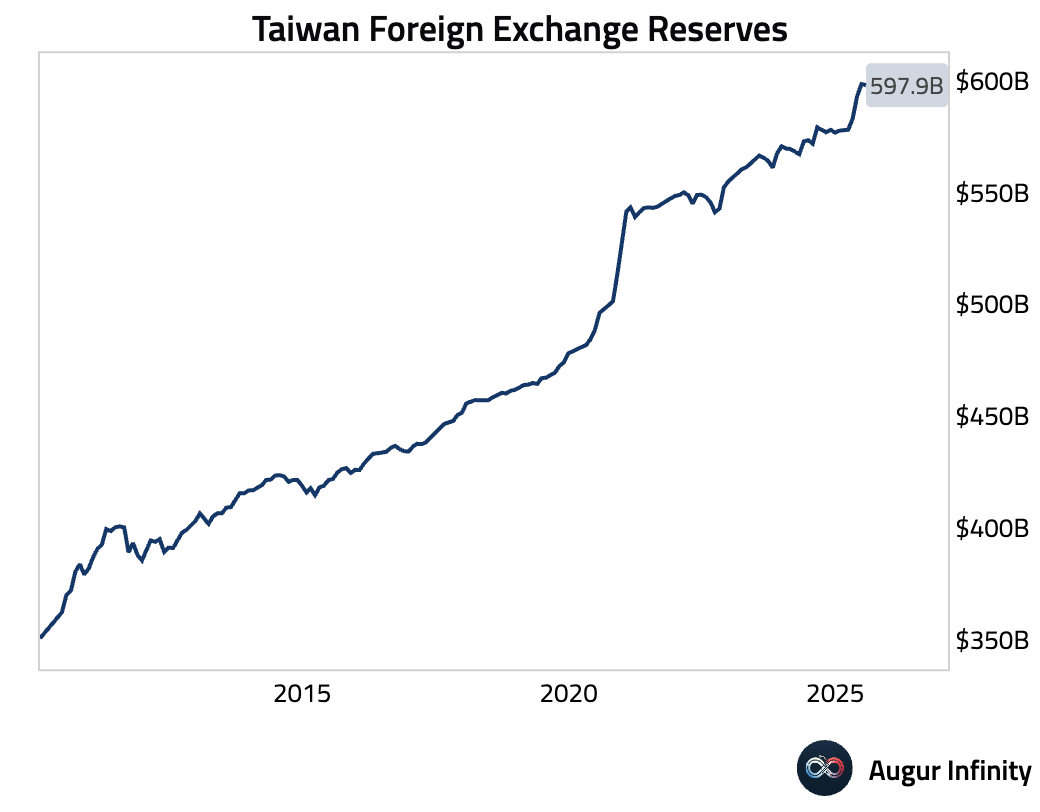
- Taiwan's official reserve assets declined slightly to $597.87 billion in July from $598.43 billion in June.
China
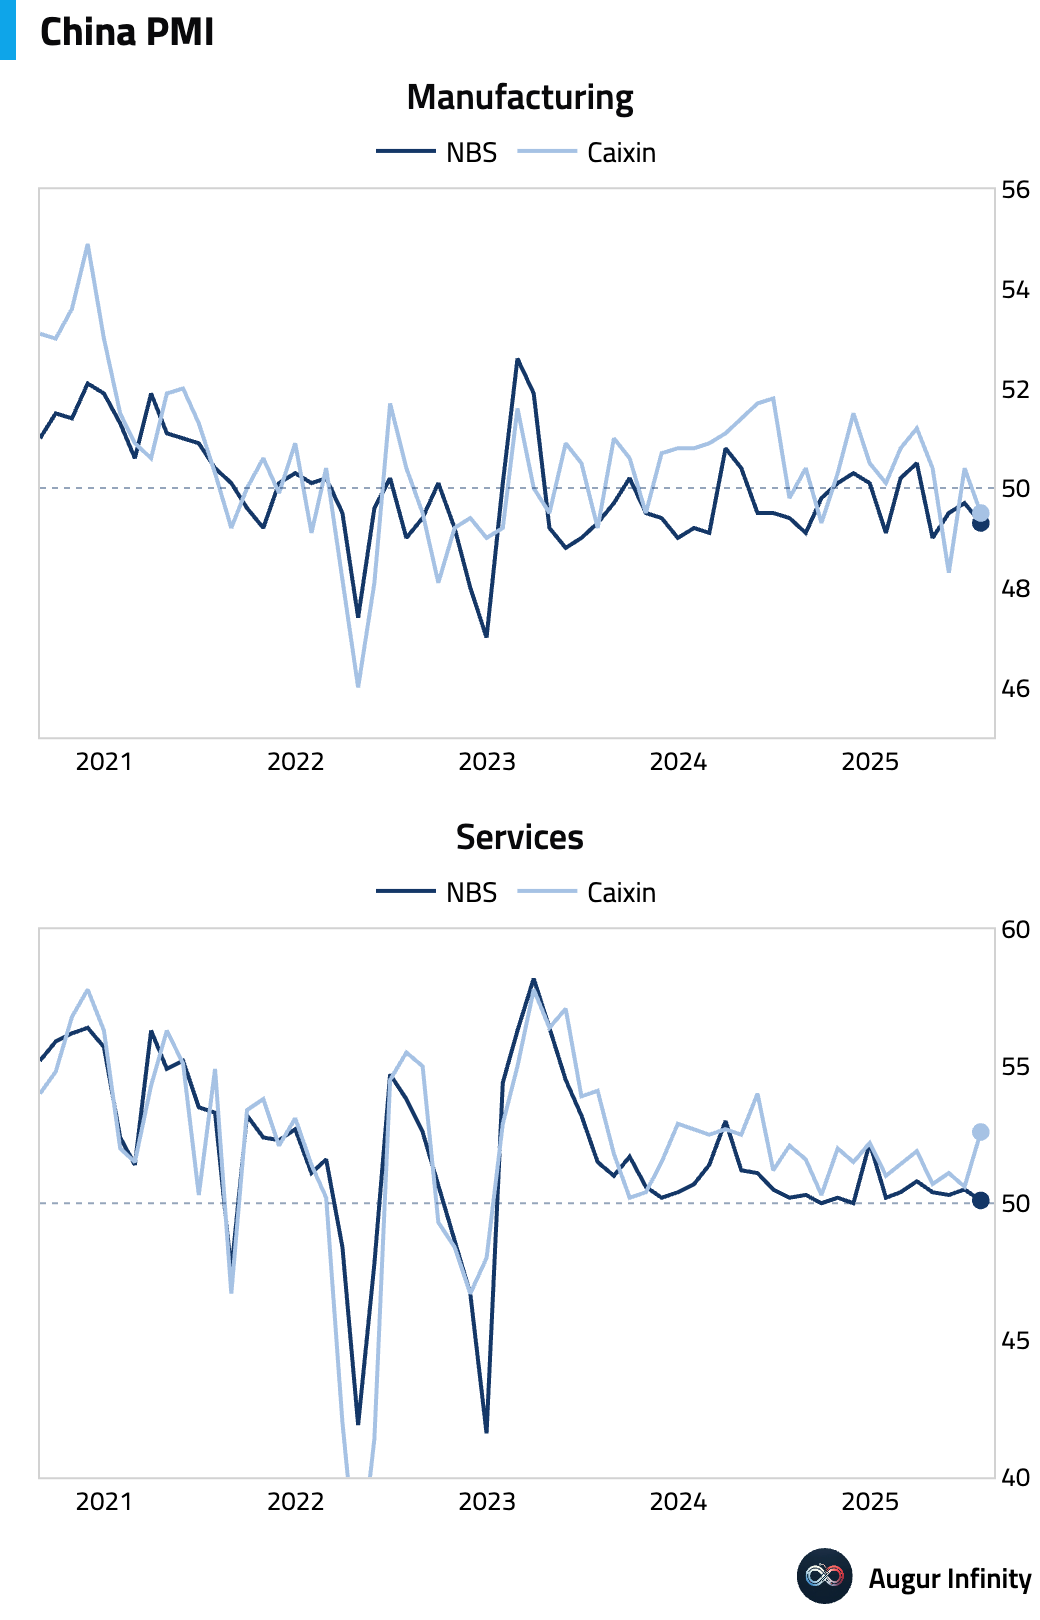
- China’s Caixin Services PMI for July jumped to 52.6, significantly beating the 50.4 consensus and up from 50.6 in June. The result marks the fastest expansion since May 2024. Growth was driven by the strongest new business in a year, fueled by a rebound in new export orders attributed to increased tourism. The strong services reading masked a decline in manufacturing production, with the Composite PMI slowing to 50.8 from 51.3. This divergence points to a two-speed recovery where services are robust but manufacturing demand remains weak.
Emerging Markets ex China
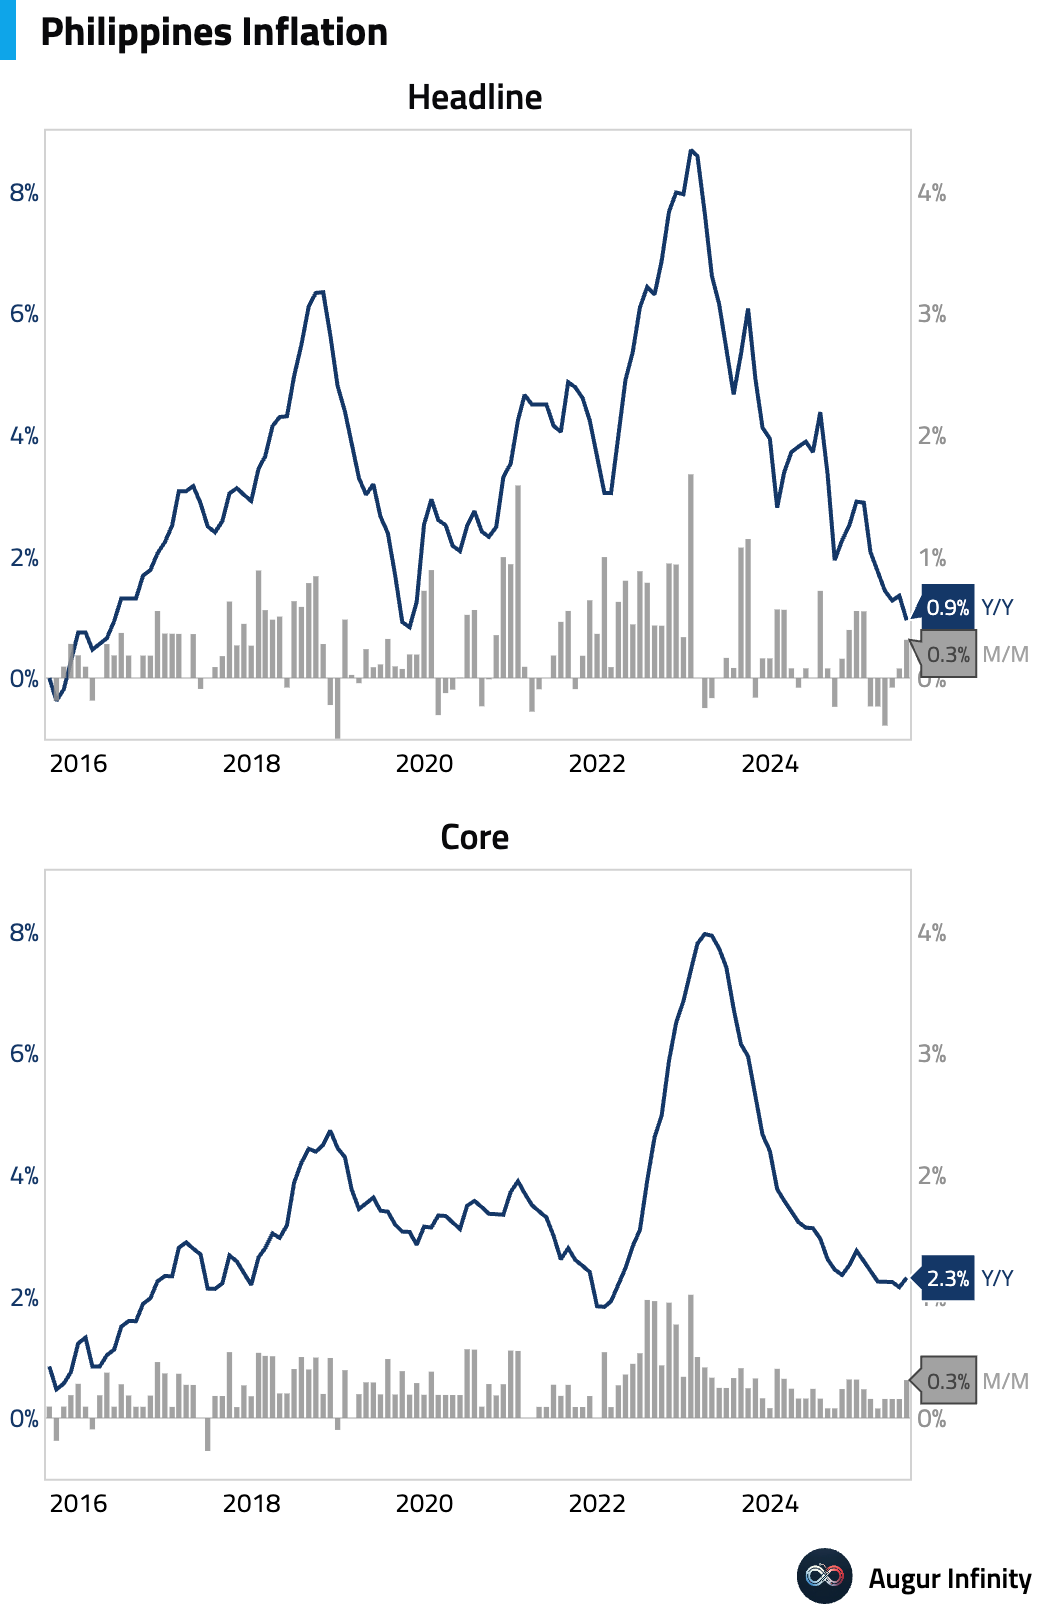
- Philippine headline inflation decelerated to 0.9% Y/Y in July, below the 1.1% consensus and the slowest pace since October 2019. The slowdown was driven by lower electricity tariffs and a drop in food inflation. However, core inflation, which excludes food and energy, bucked the trend and accelerated to 2.3% Y/Y from 2.2%.
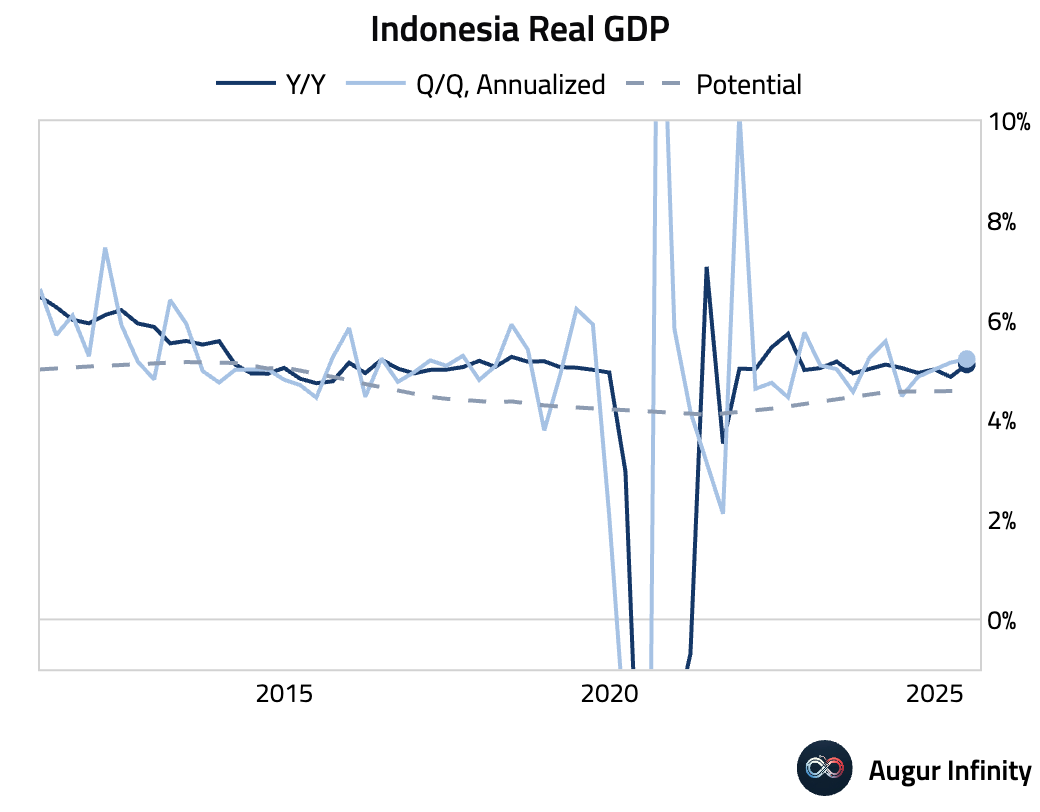
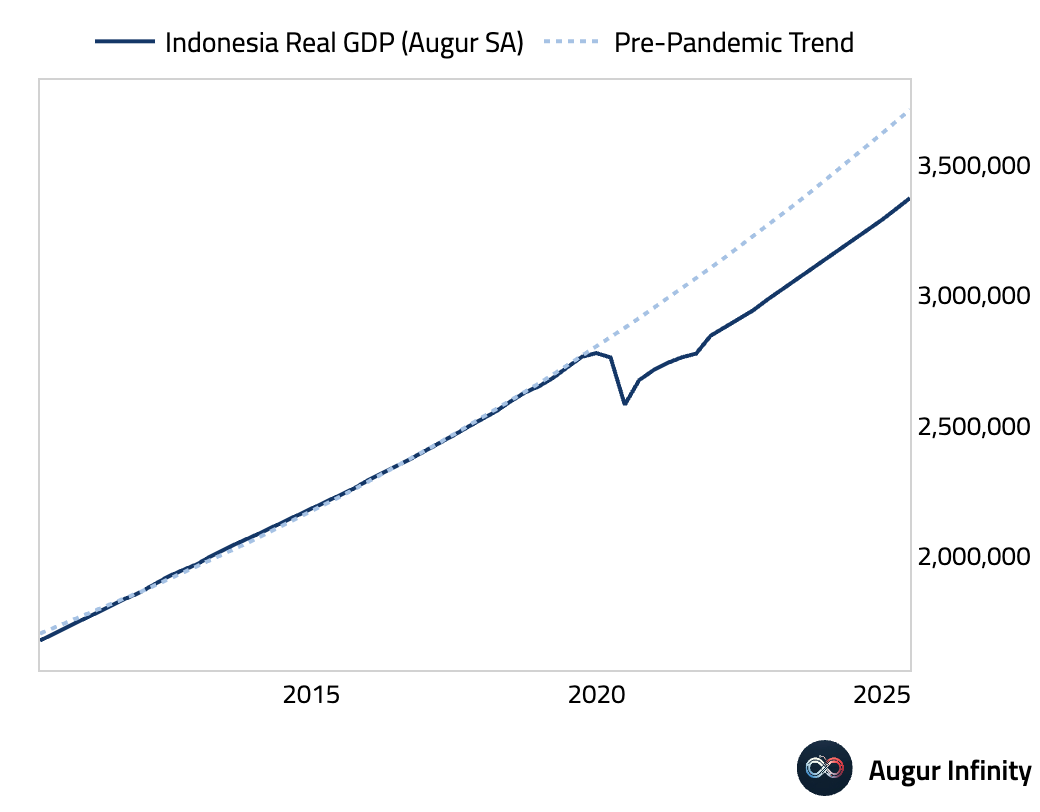
- Indonesia’s Q2 GDP grew 5.12% Y/Y, accelerating from 4.87% in Q1 and significantly beating the 4.8% consensus. The surprise strength was driven by a 30.4% Y/Y surge in government investment, which offset a drag from the external sector.
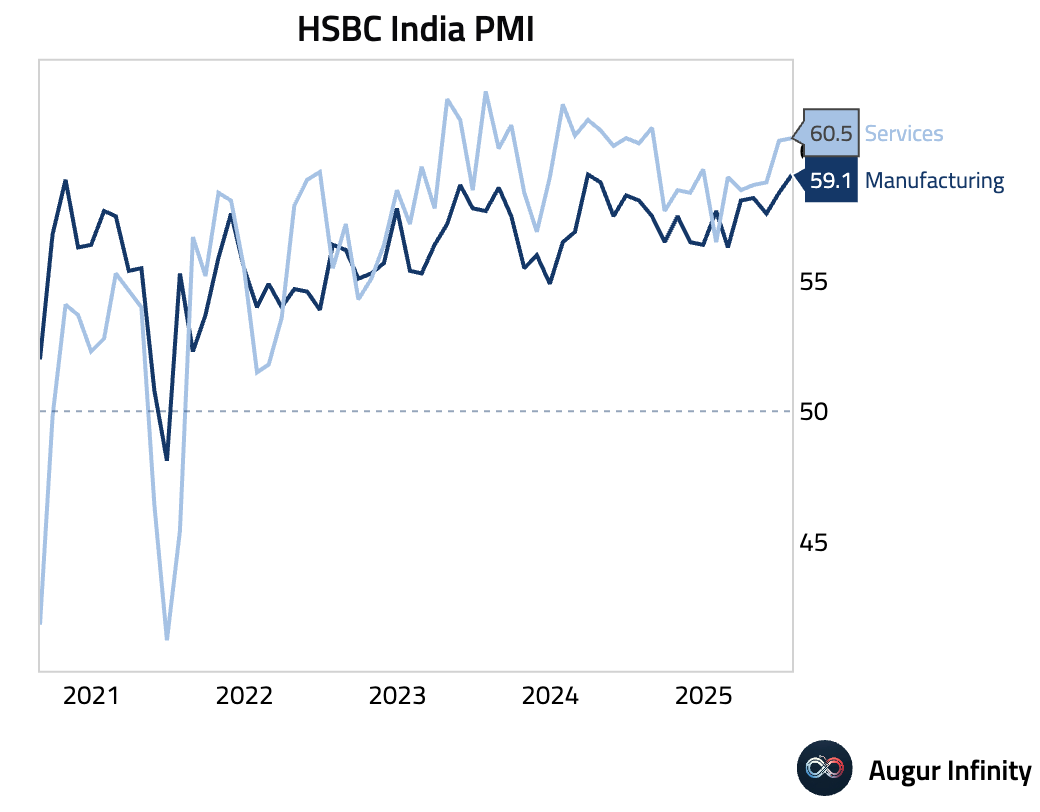
- India’s HSBC Services PMI rose to an 11-month high of 60.5 in July. The strength was driven by a surge in new export orders, pointing to strong foreign demand. However, the employment sub-index fell sharply to a 15-month low, indicating a significant slowdown in hiring despite the robust activity.
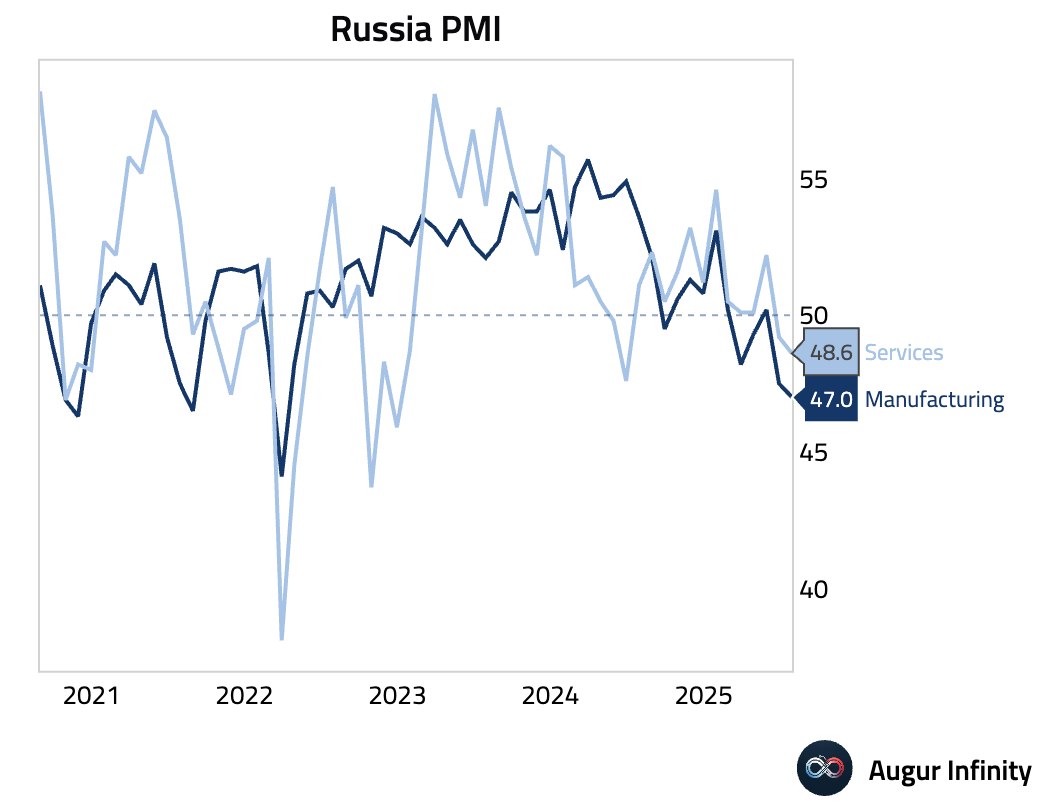
- Russia's S&P Global Services PMI slipped to 48.6 in July from 49.2, indicating a faster pace of contraction in the services sector.
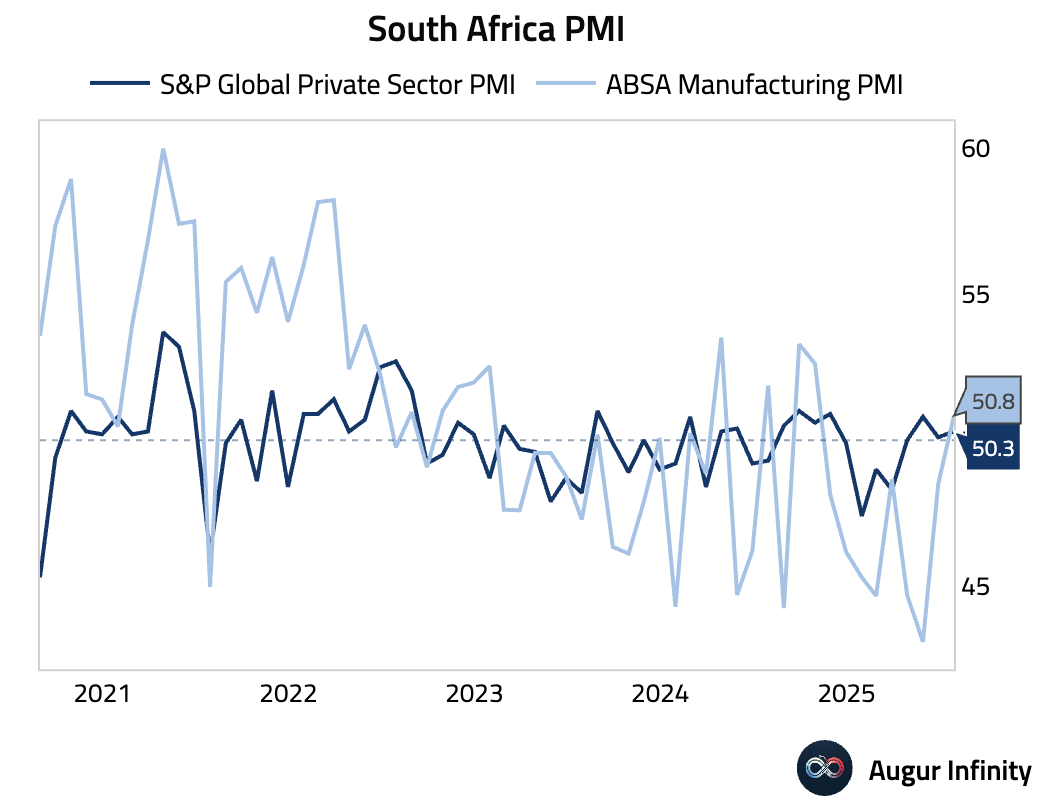
- South Africa's S&P Global PMI edged up to 50.3 in July from 50.1, signaling a marginal improvement in private sector conditions.
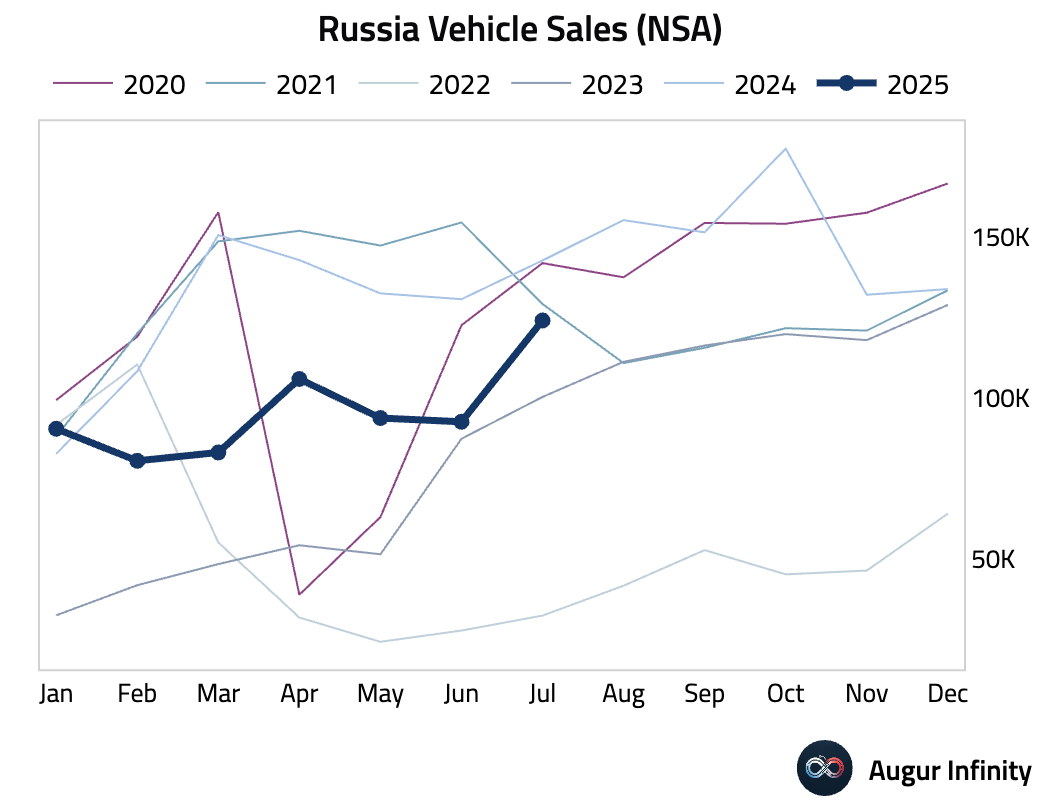
- Russian vehicle sales declined 13.0% Y/Y in July, an improvement from the 29.0% drop recorded in June.
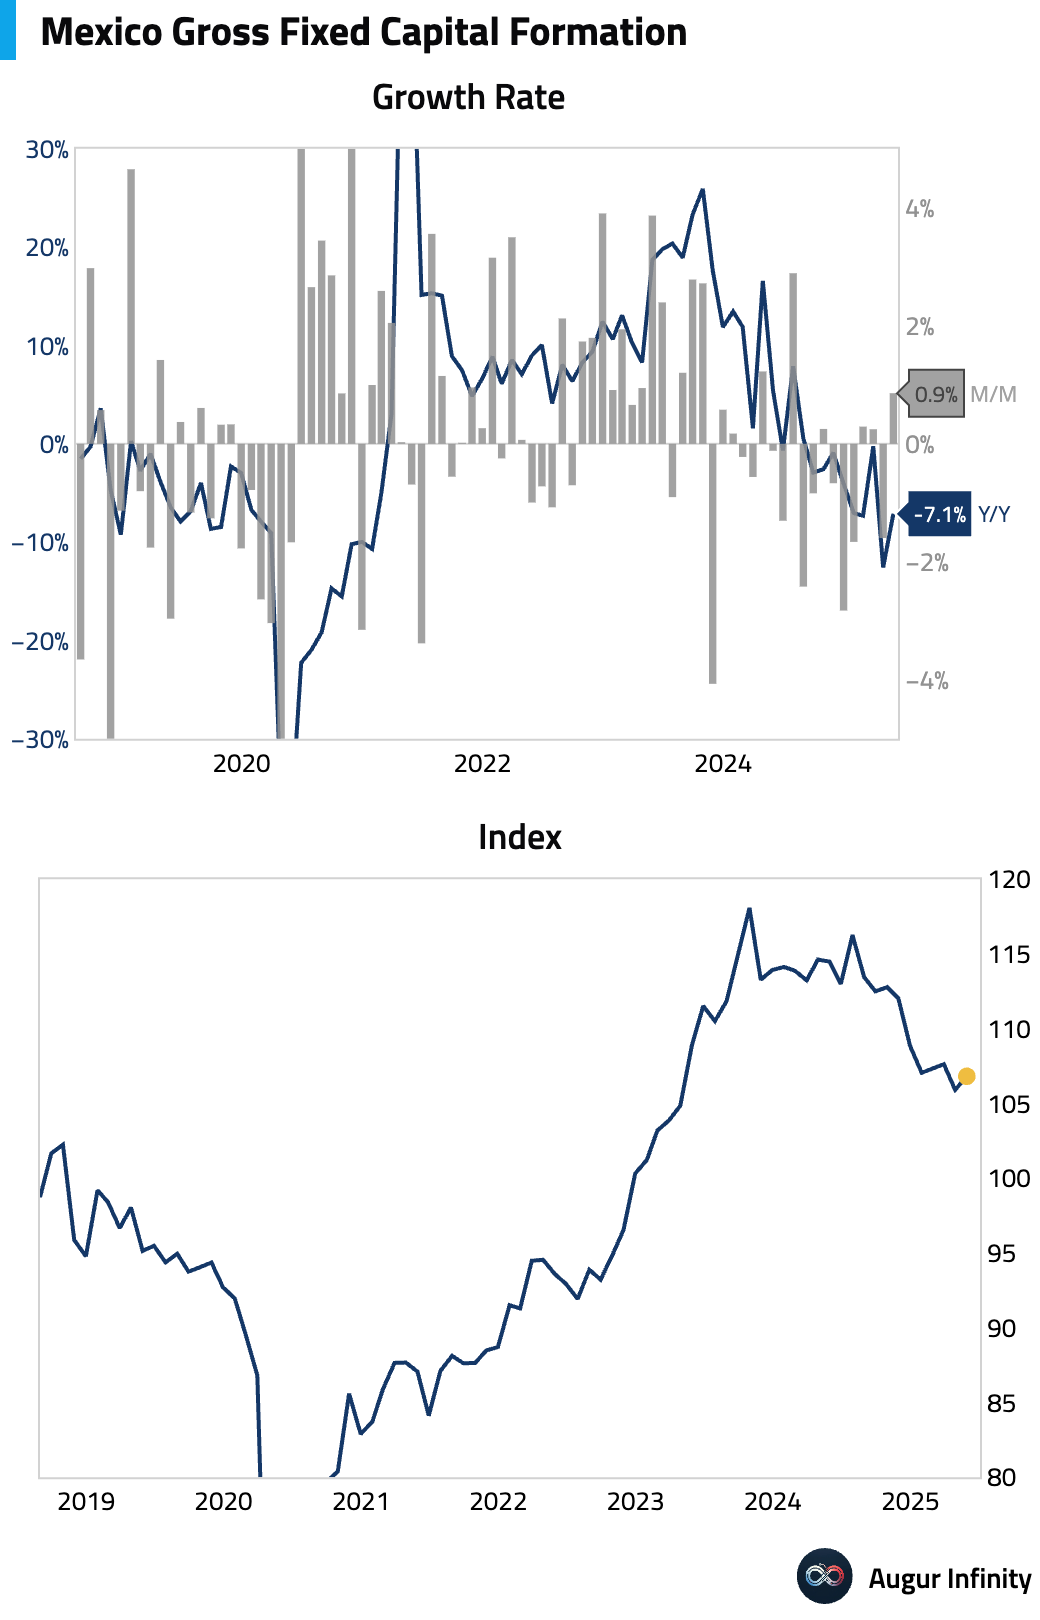
- Mexico's gross fixed investment rose 0.9% M/M in May, recovering from a 1.6% decline in April. The gain was driven entirely by a 7.8% jump in residential construction. The year-over-year figure remained deeply negative at -7.1%, reflecting a steep drop in public investment.
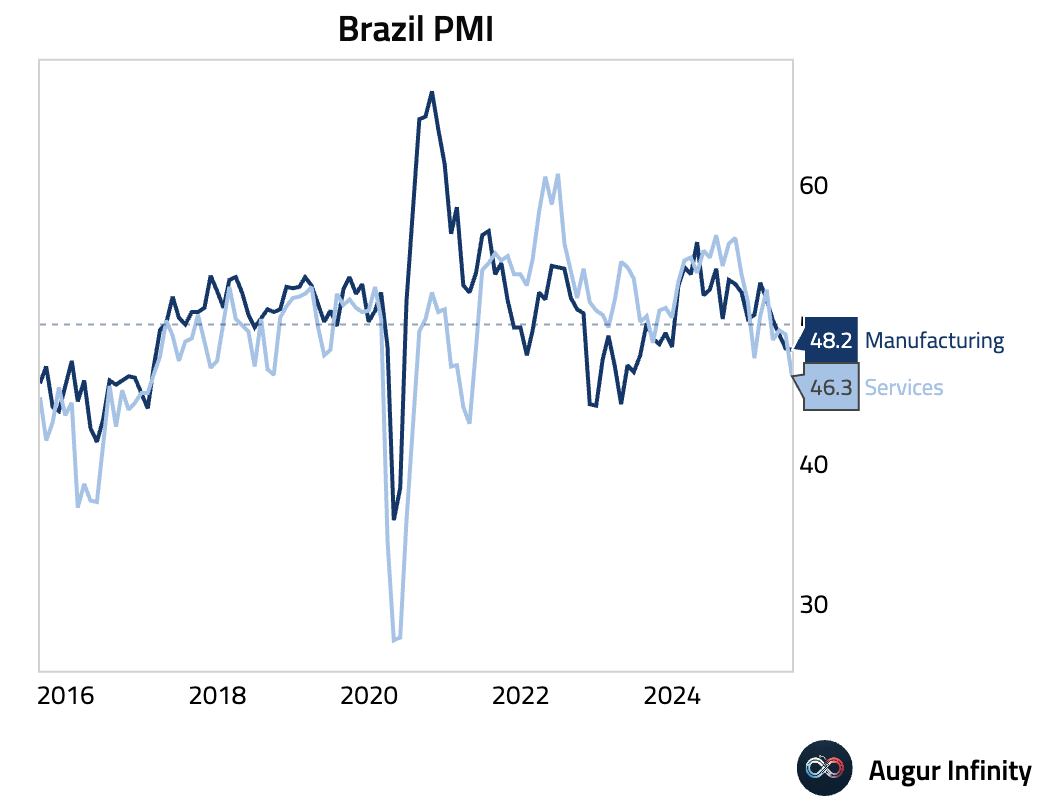
- Brazil's S&P Global Services PMI plunged to 46.3 in July from 49.3 in June, its lowest reading since April 2021. The sharp contraction was driven by weaker new business and a return to contraction in employment. Despite slowing activity, firms increased prices charged at a faster rate, a potentially stagflationary signal.
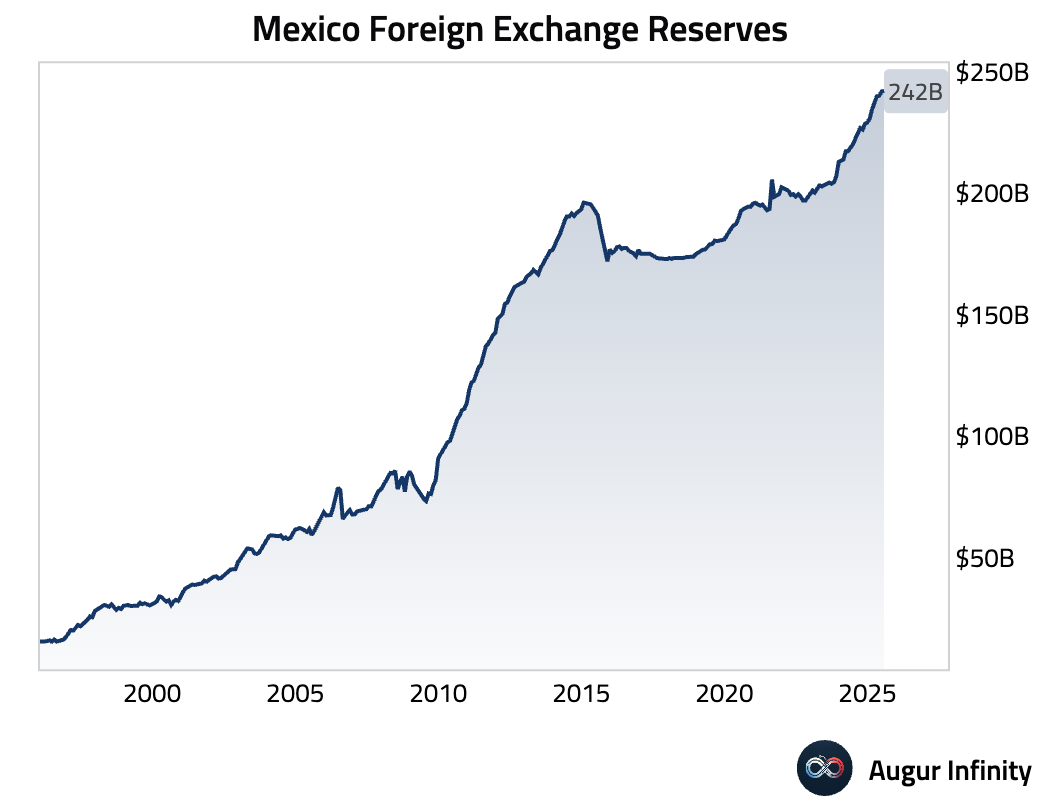
- Mexico's foreign exchange reserves rose to a new all-time high of $242.0 billion as of the end of July, up from $241.7 billion at the end of June.
Global Markets
Equities
- U.S. equities edged lower on Tuesday, with the broader market down 0.5% and the Nasdaq Composite falling 0.7%. The move contrasted with gains in some international markets, including the United Kingdom and Brazil, which both recorded their third consecutive day of gains.
Fixed Income
- The US Treasury sold $58 billion of 3-year notes to lukewarm demand. The auction tailed by 0.7 bps, and dealer uptake rose, signaling weaker interest. However, strong indirect bidding and a stable bid-to-cover ratio provided some offsetting support.
- The market’s implied terminal rate for the Federal Reserve’s easing cycle has declined to 2.9%, reflecting increased expectations for monetary policy accommodation following recent weak economic data.
- The U.S. Treasury curve flattened as yields on the short end rose while long-end yields fell. The 2-year yield climbed 4.2 bps, while the 30-year yield declined 1.9 bps, marking its fourth consecutive daily decrease.
FX
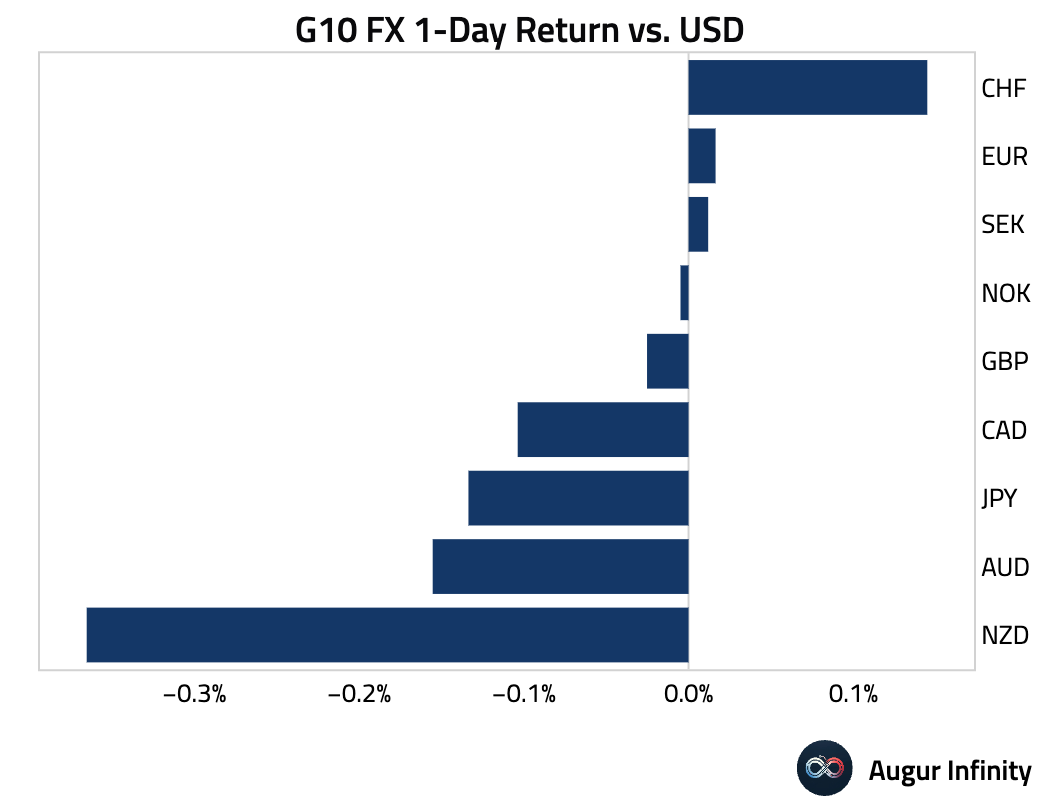
- The U.S. dollar had a mixed session against its G10 peers amid shifting Federal Reserve policy expectations and trade uncertainty. The Euro and the Swedish Krona were notable performers, both posting their third straight day of gains. At the other end of the spectrum, the New Zealand and Australian dollars were the primary laggards, falling 0.4% and 0.2% respectively.
Disclaimer
Augur Digest is an automated newsletter written by an AI and edited by humans. It may contain inaccuracies and is not investment advice. Augur Labs LLC will not accept liability for any loss or damage as a result of your reliance on the information contained in the newsletter.