Note: This is the August Digest Flash—an early look at today’s economic developments. The full edition will be released at 4 p.m.
Global Economics
Global
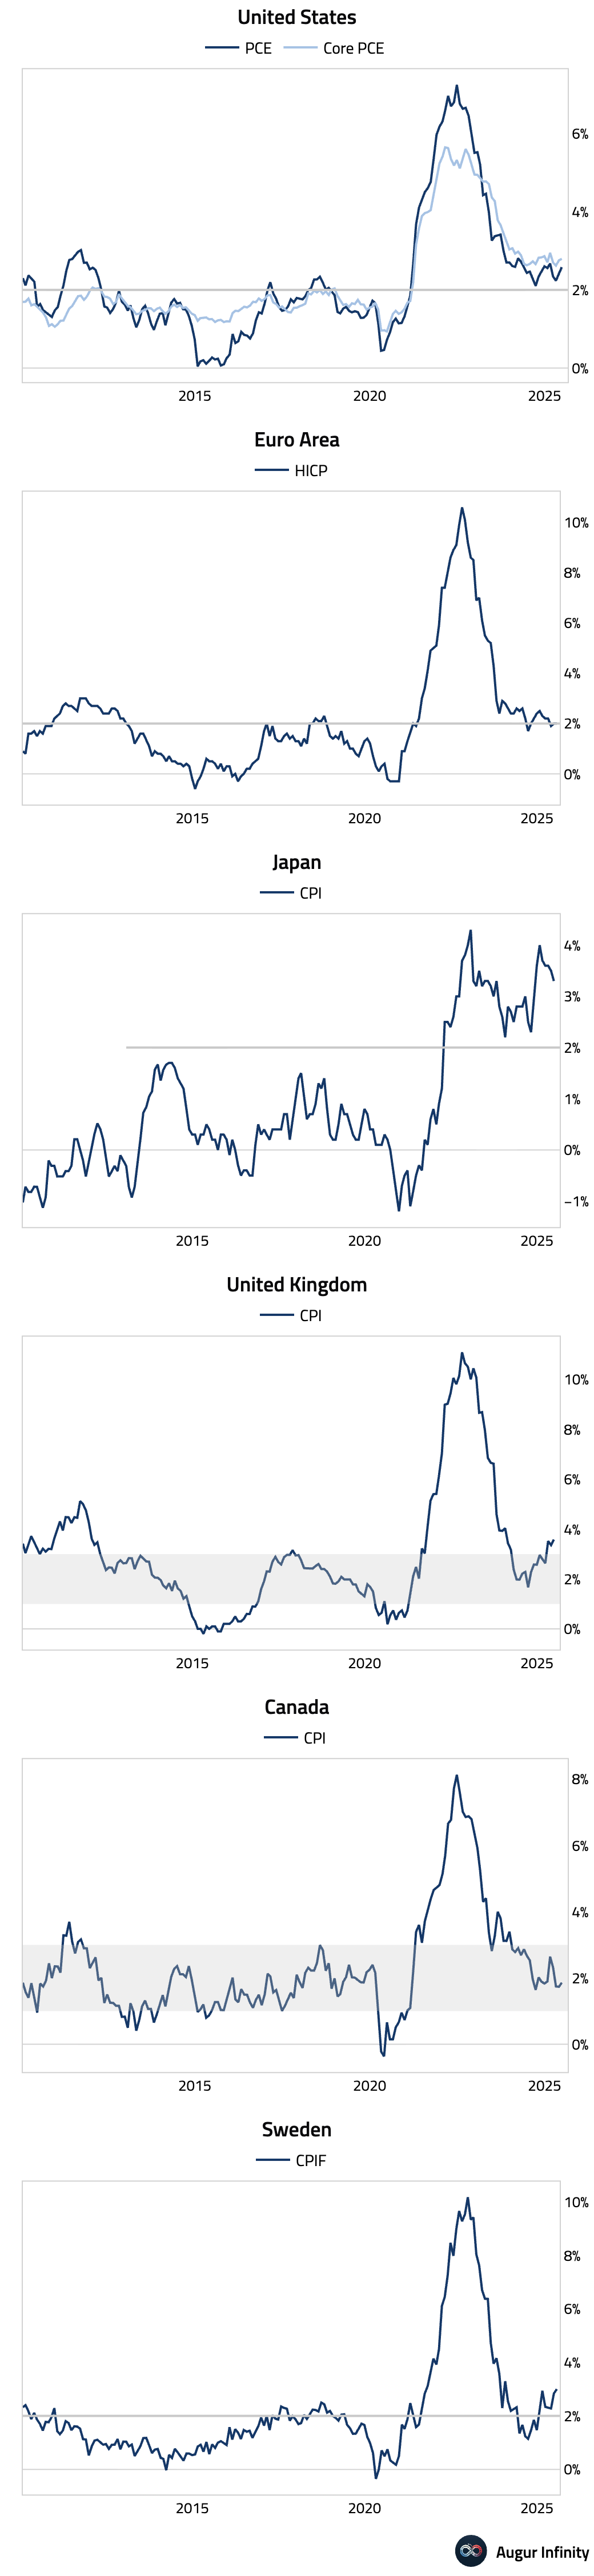
- Inflation rates in the euro area and Canada have more or less returned to central bank targets, while elsewhere inflation remains above target.
United States
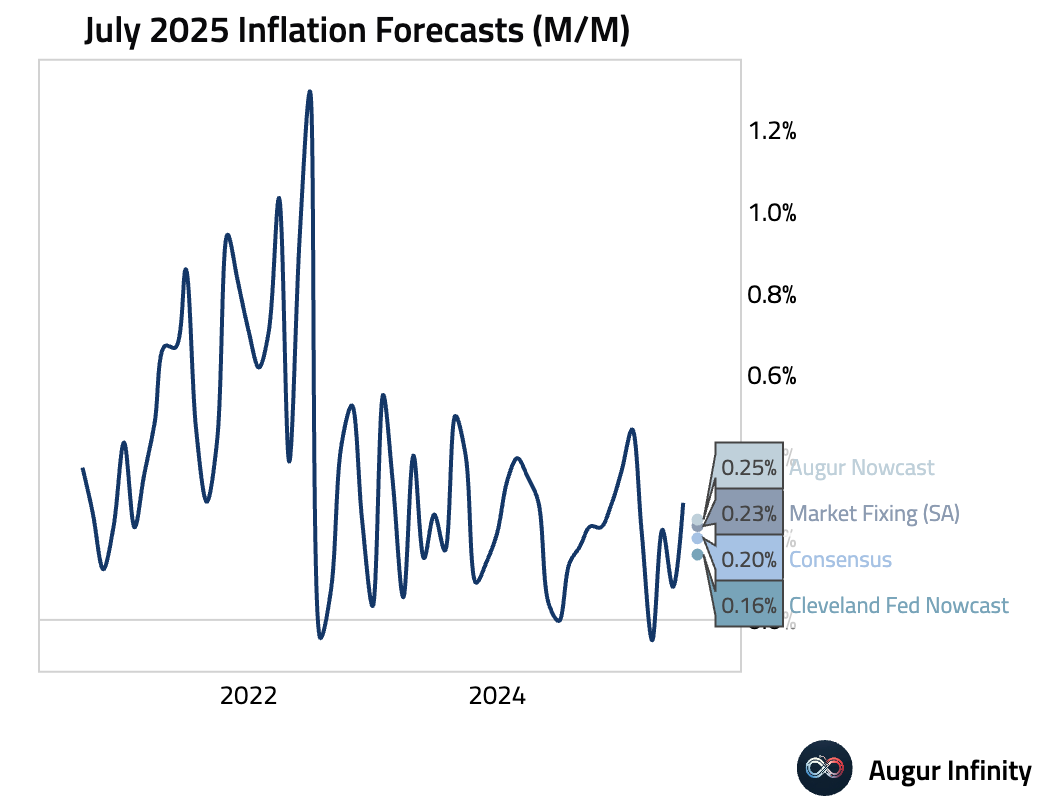
- The BLS will release July inflation data tomorrow. For headline inflation, consensus expects 0.2% M/M, the market is pricing for 0.23%, and our in-house nowcast is also above consensus at 0.25%. For core inflation, consensus is calling for 0.3% M/M, roughly in line with our estimate of market pricing (0.31%).
- The Visa US Spending Momentum Indices climbed above 100 for July, signaling rising consumer spending momentum relative to the previous year.
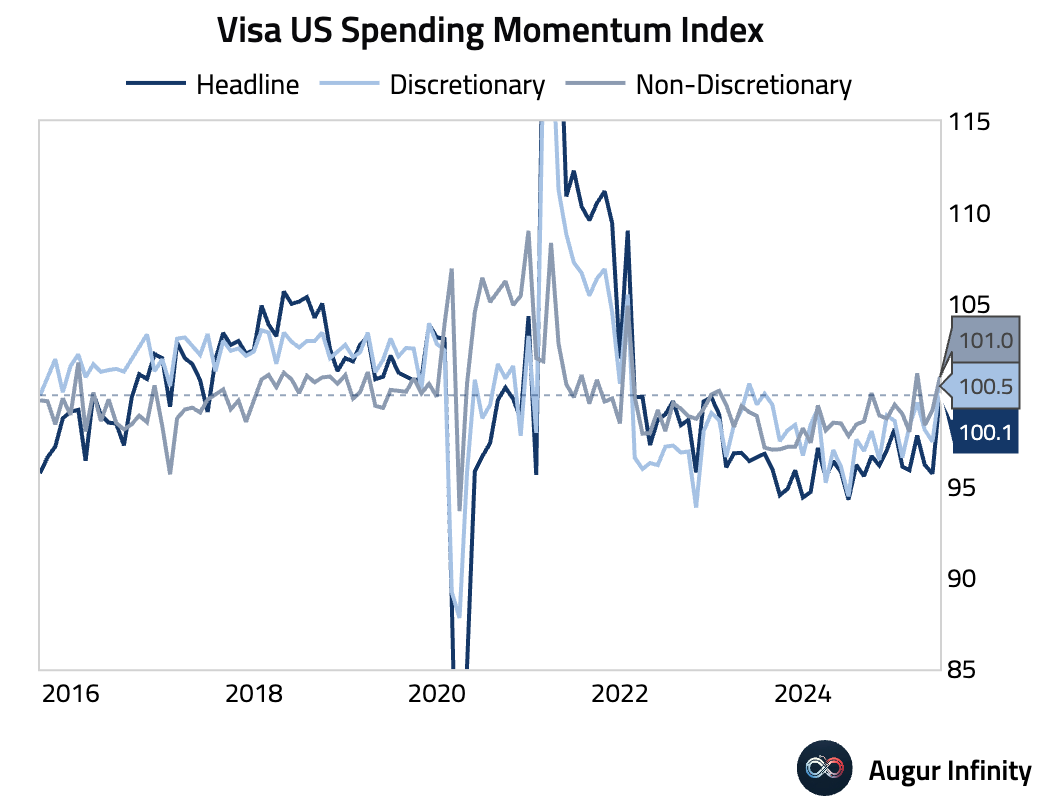
Source: Visa
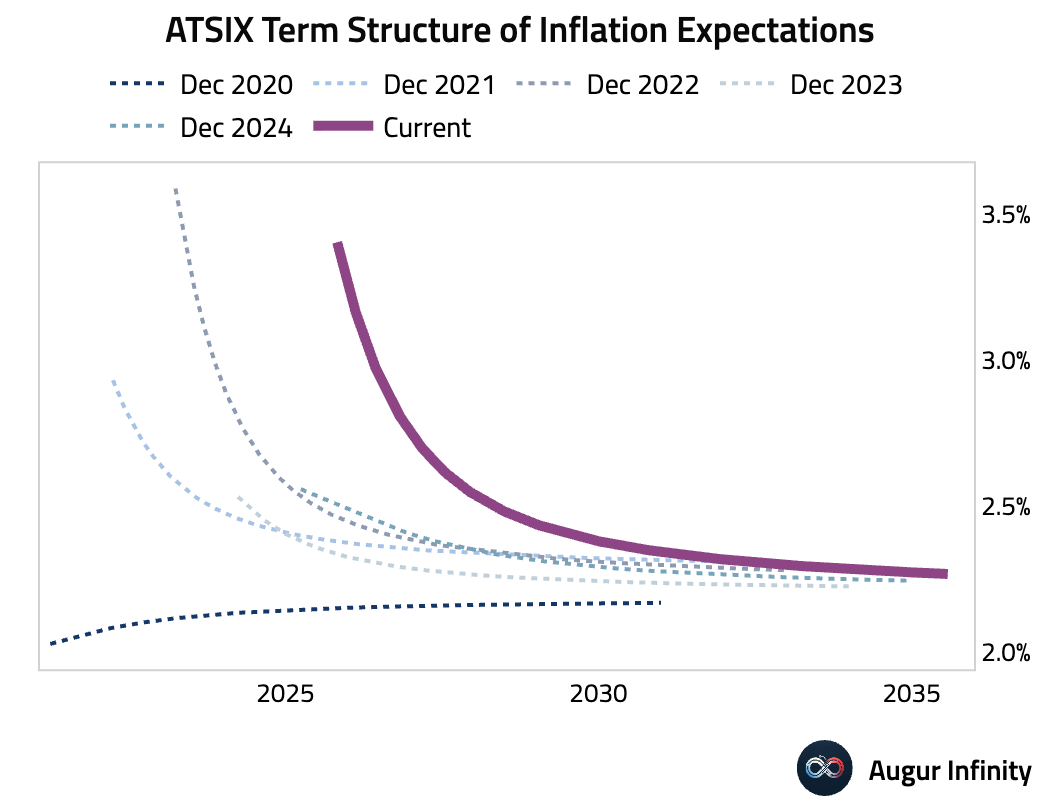
- The Aruoba Term Structure of Inflation Expectations, which optimally combines major surveys to provide inflation expectations from three months to ten years ahead, shows inflation expectations remain elevated across all horizons.
Europe
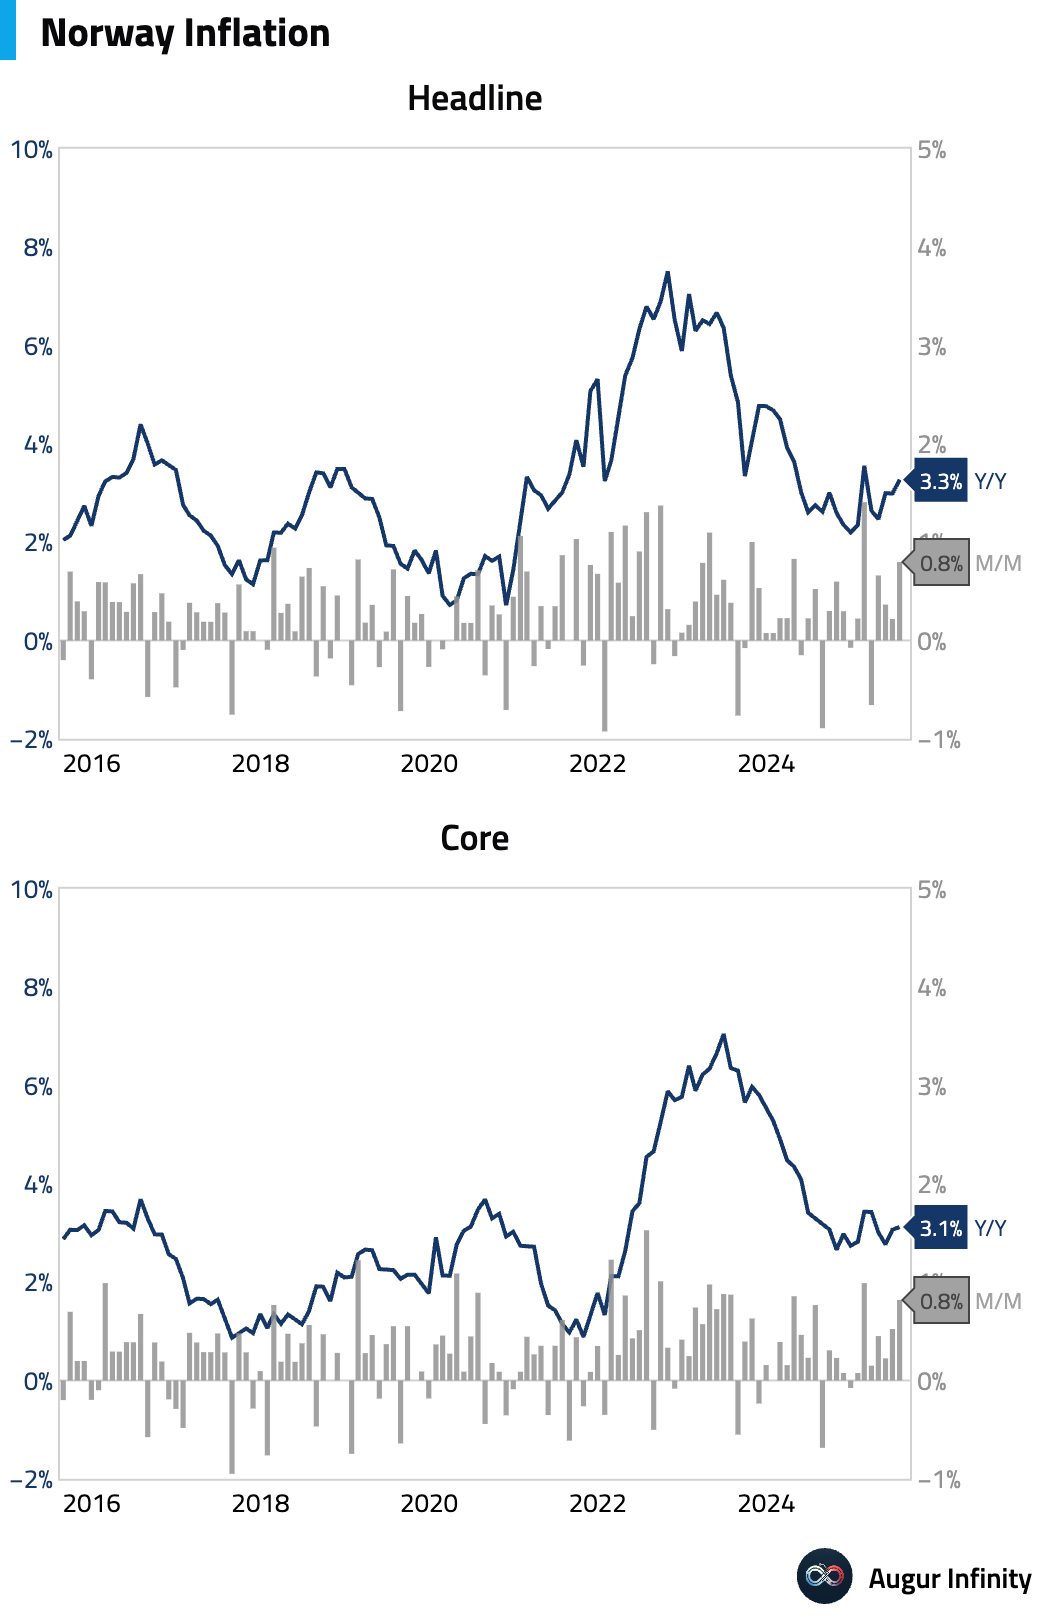
- Norway’s July inflation accelerated more than expected, with the headline rate rising to 3.3% Y/Y from 3.0% and the core rate holding steady at 3.1% Y/Y. Month-over-month, headline and core inflation rose 0.8%, both ahead of forecasts. The upside surprise was driven by a large rise in food prices and a smaller-than-typical seasonal decline in clothing. The sticky data supports a Norges Bank hold on August 14, but as the print was in line with the central bank’s own forecast, a 25 basis point cut in September may still be on the table.
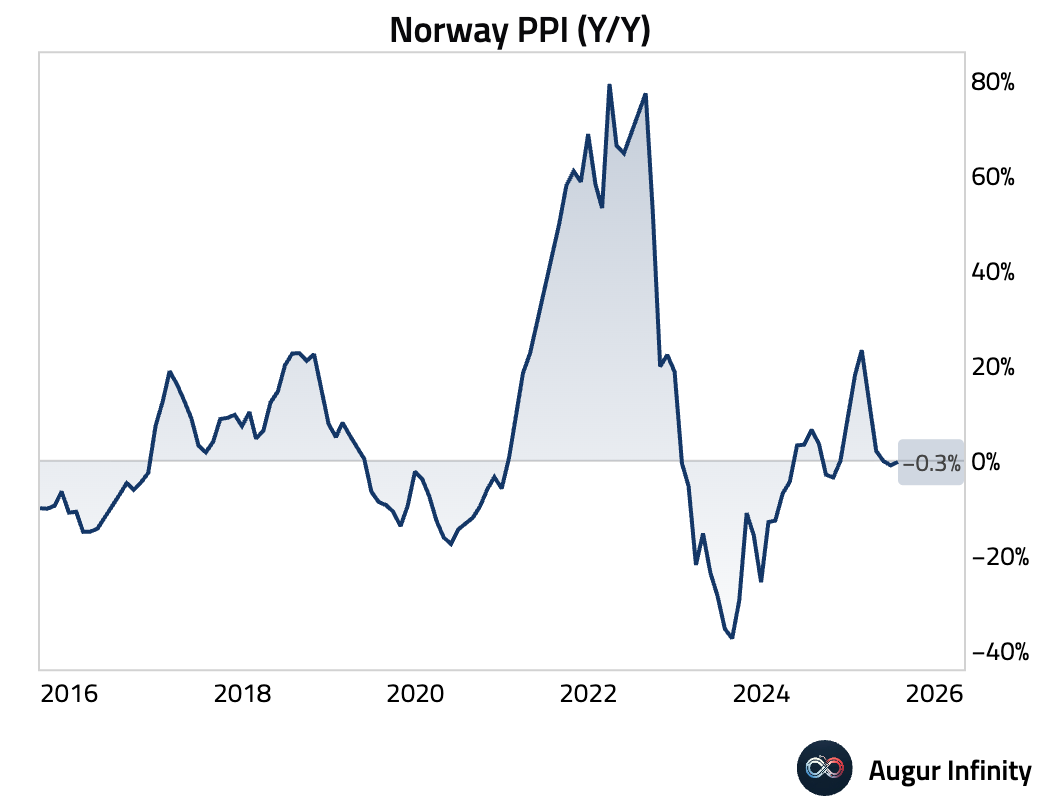
- Norway’s Producer Price Index (PPI) deflation eased in July, with prices falling 0.3% Y/Y compared to a 1.0% decline in June.
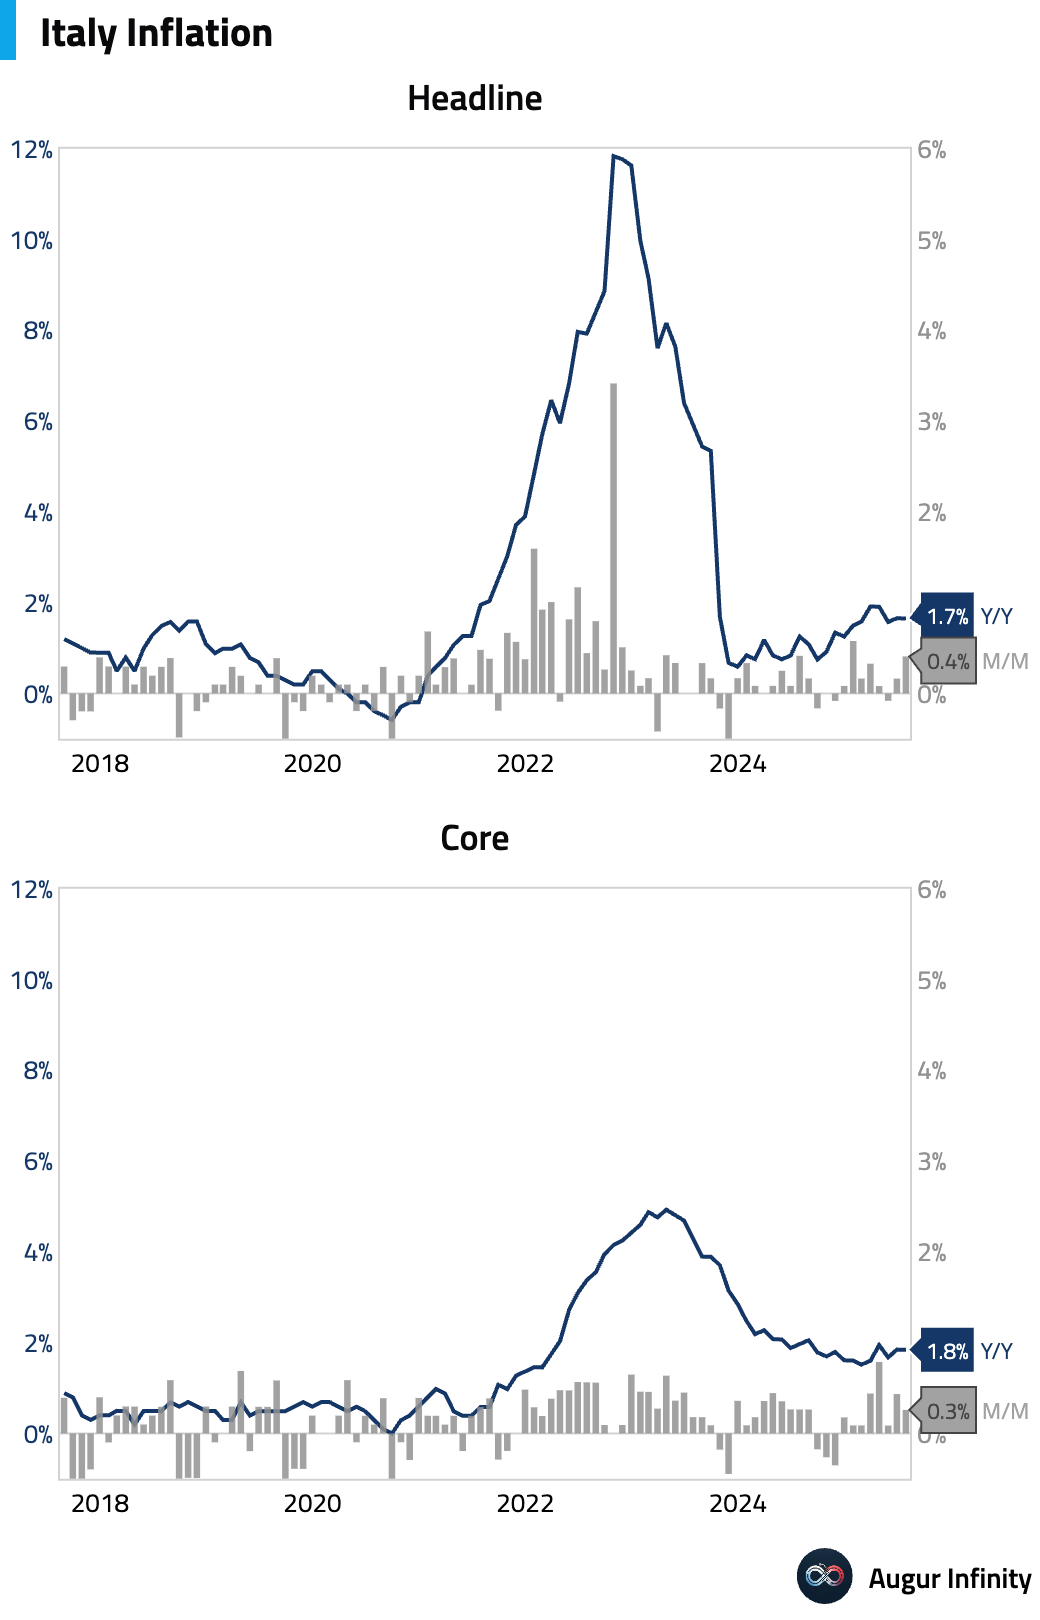
- Italy’s final inflation rate for July was confirmed at 0.4% M/M and 1.7% Y/Y, matching preliminary figures.
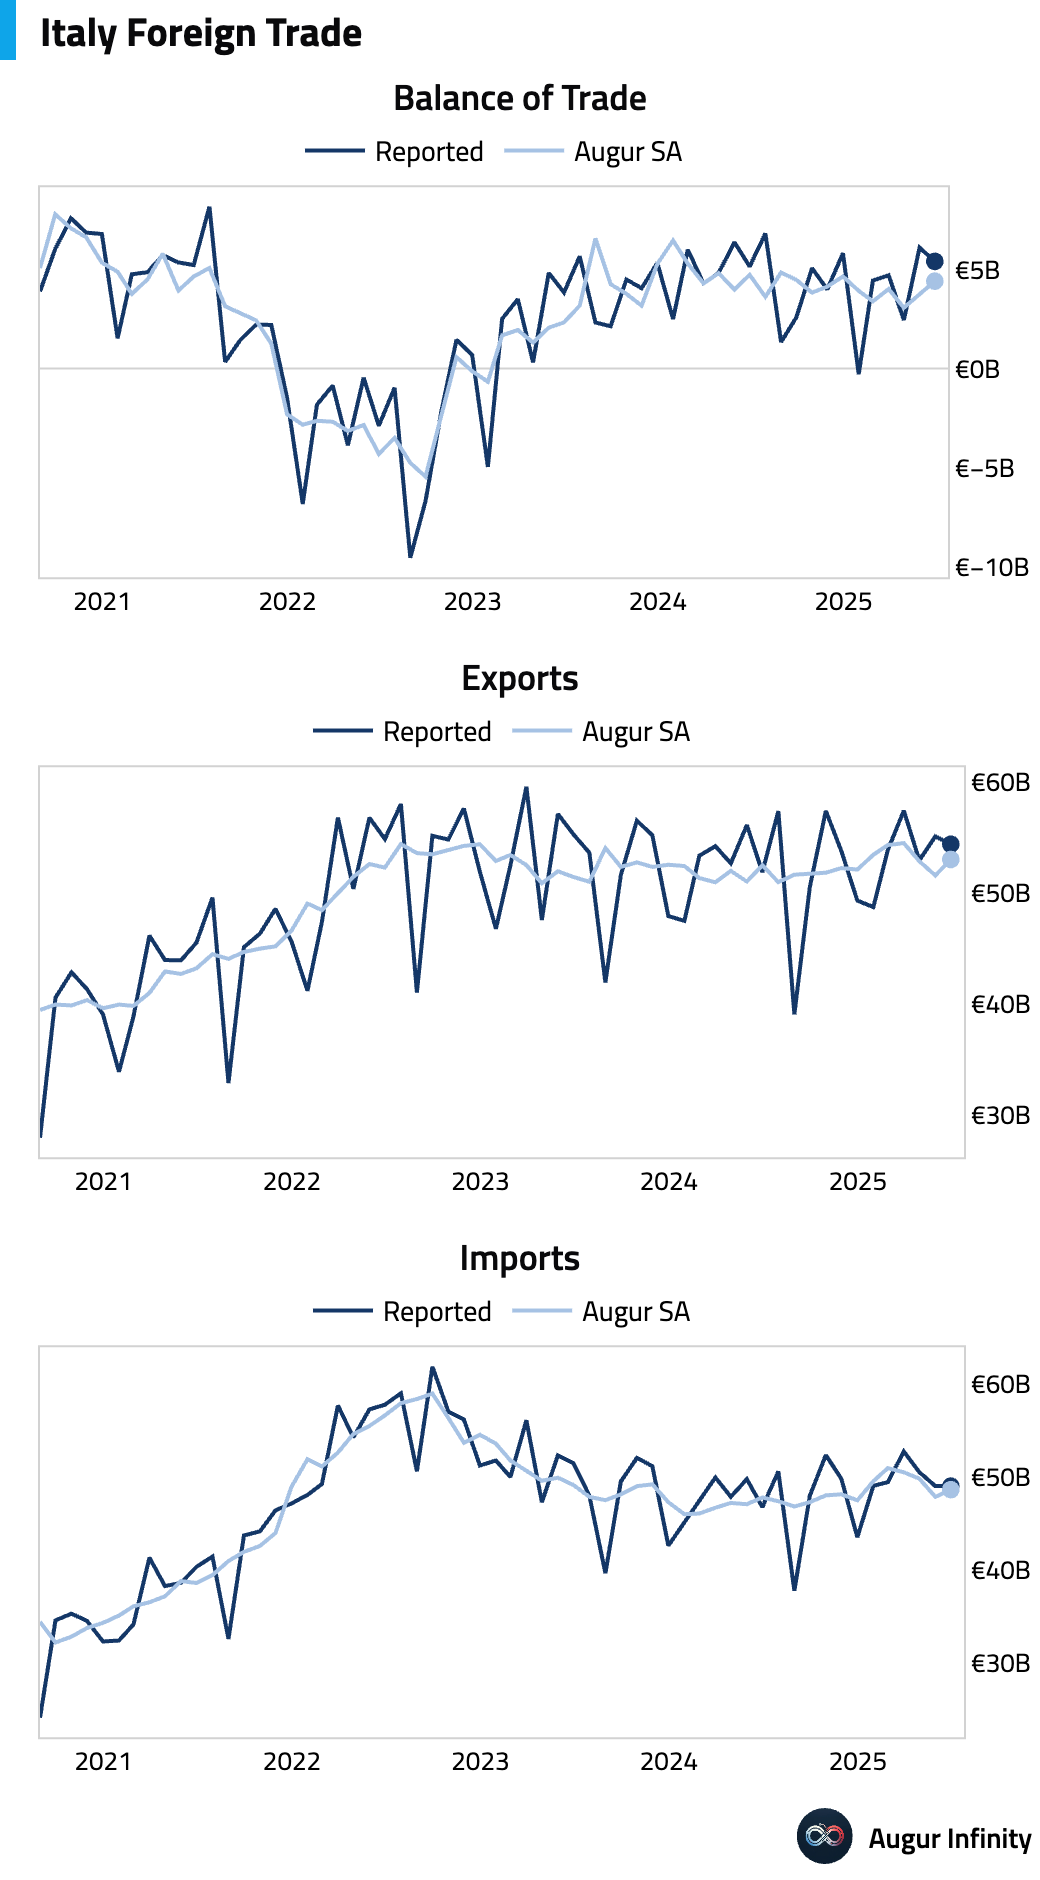
- Italy’s trade surplus narrowed to €5.41 billion in June, falling short of the €7.12 billion consensus and down from €6.10 billion in May.
China
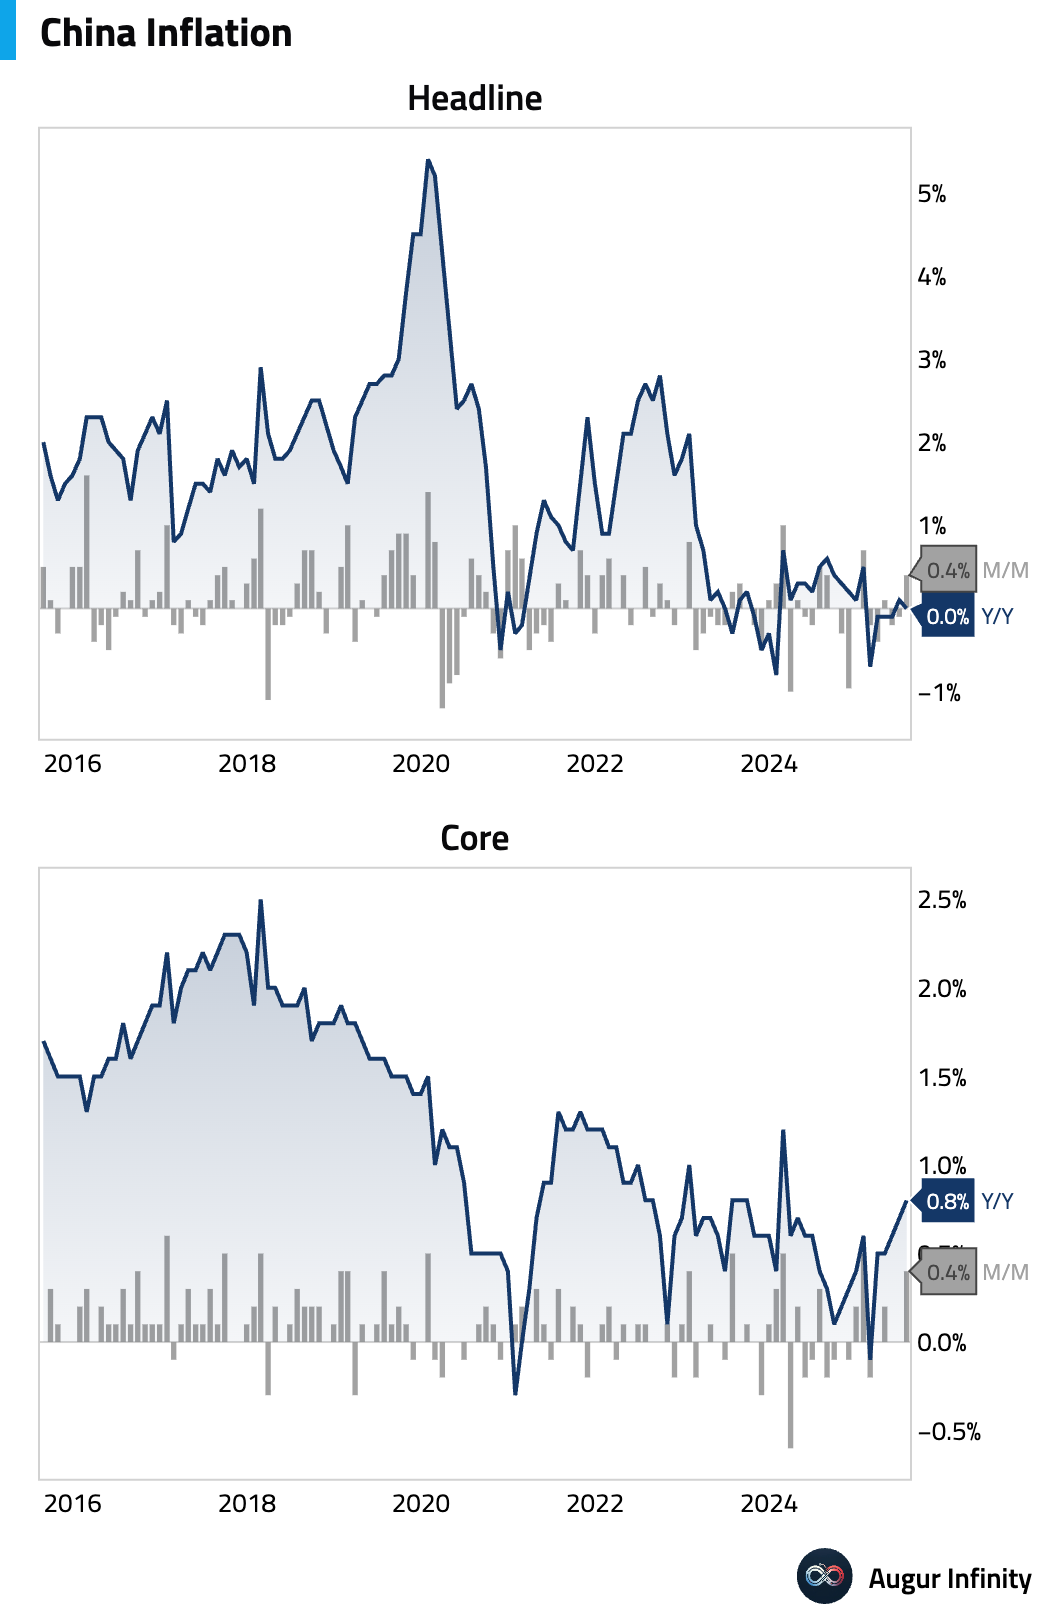
- China's consumer price index (CPI) was flat in July at 0.0% Y/Y, beating the consensus expectation of a 0.1% decline. The M/M rate rose 0.4%, also above the 0.3% forecast. A drop in food prices was offset by resilient non-food inflation, with core CPI rising to 0.8% Y/Y from 0.7%. The non-food strength was driven by a surge in gold and platinum jewelry prices, suggesting targeted rather than broad-based demand.
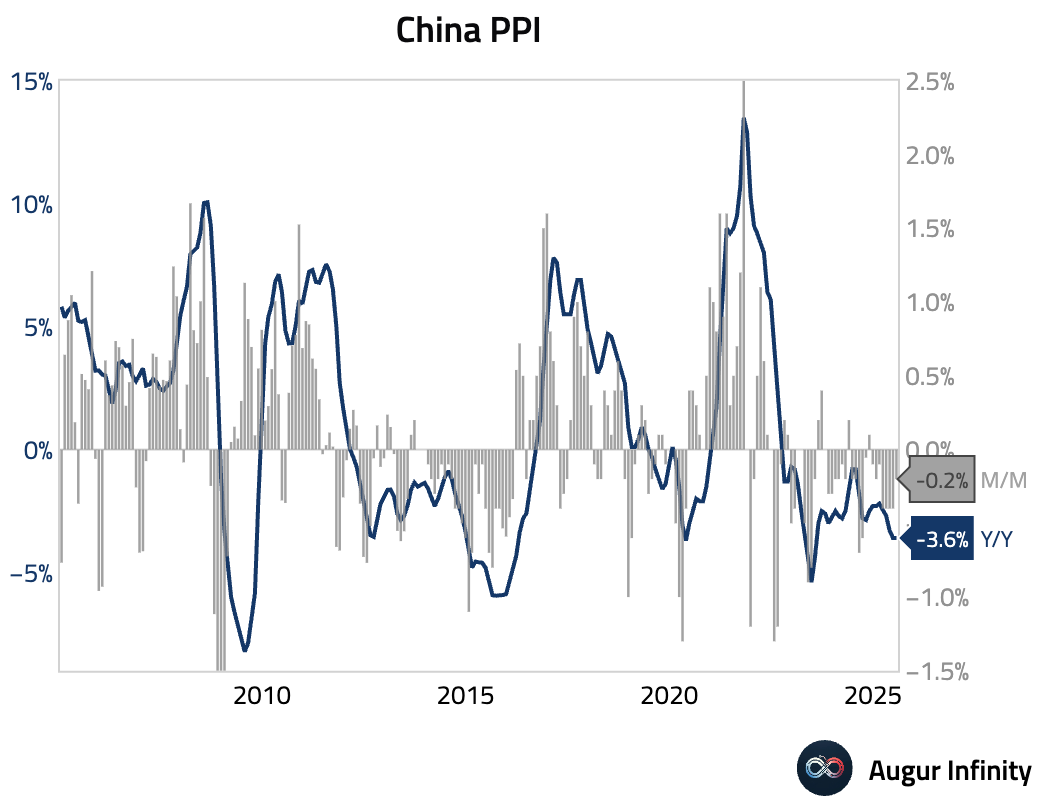
- Producer price index (PPI) deflation in July remained at -3.6% Y/Y, worse than the -3.3% consensus, indicating persistent industrial weakness. Deflation in downstream consumer goods worsened to -1.6% Y/Y. Without a resolution to the property crisis, broad deflationary pressures are expected to persist, as external factors like falling export prices and weather-related construction delays also weigh on demand for raw materials.
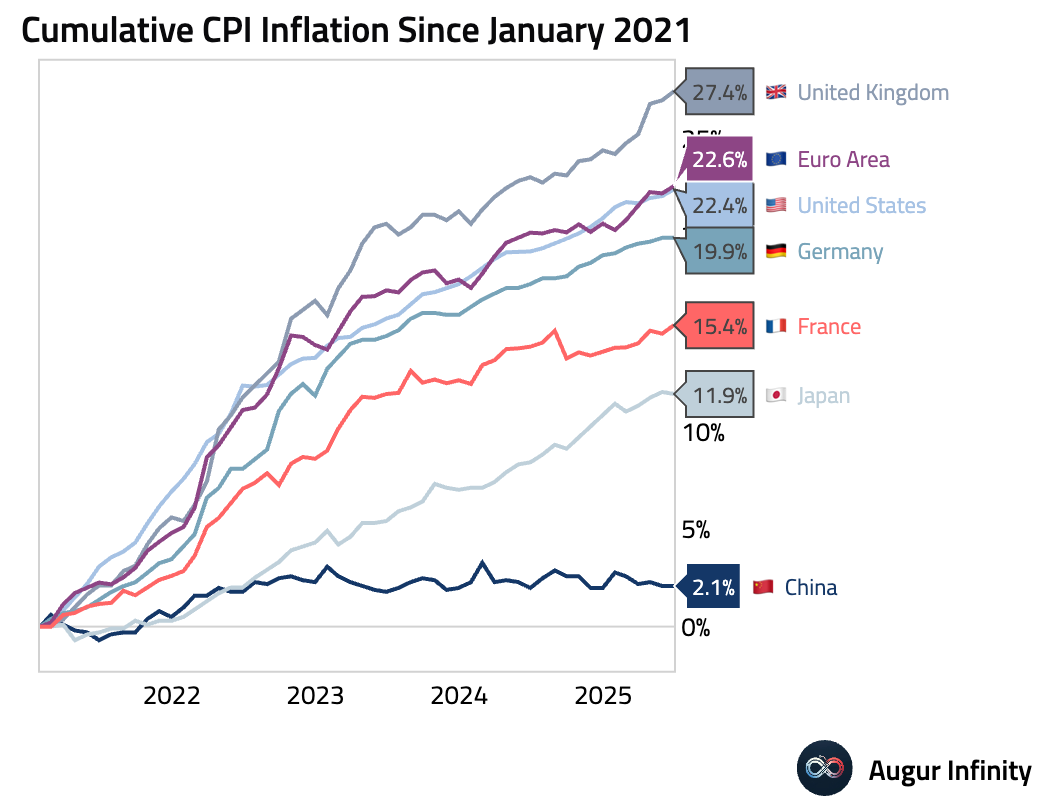
- Here's the cumulative CPI inflation since 2021 for a sample of countries. China's inflation path has significantly diverged from that of global peers.
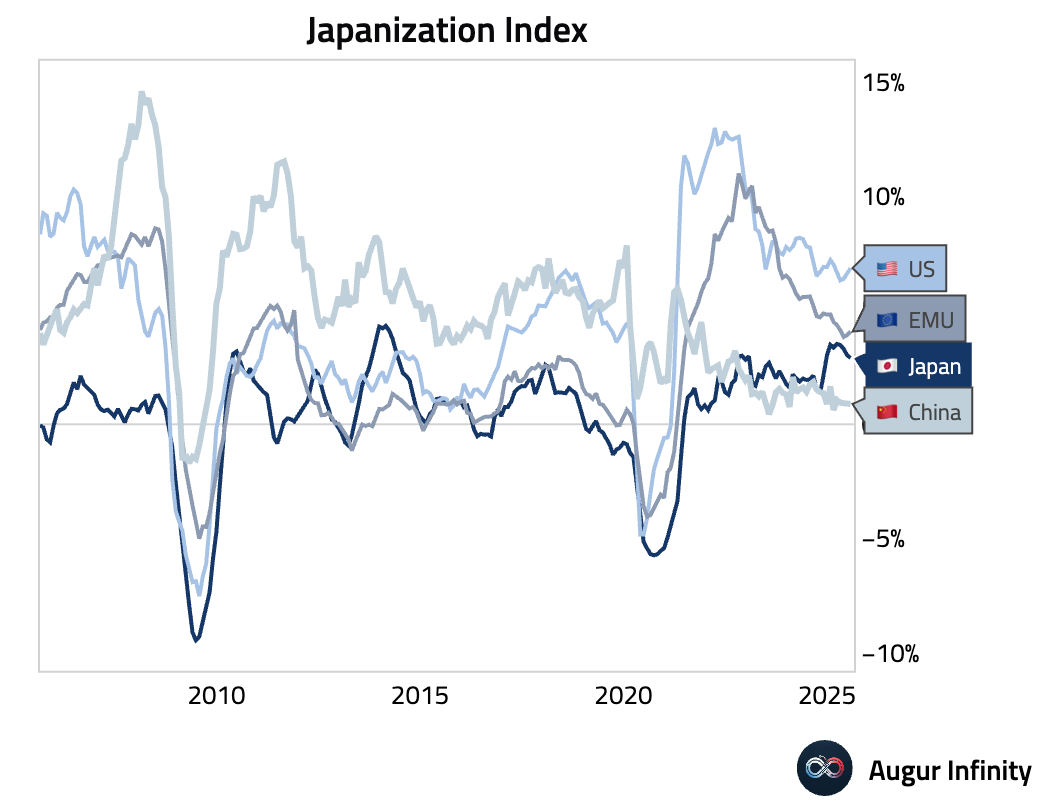
- According to Professor Takatoshi Ito's Japanization indices, China remains more "Japanized" than Japan.
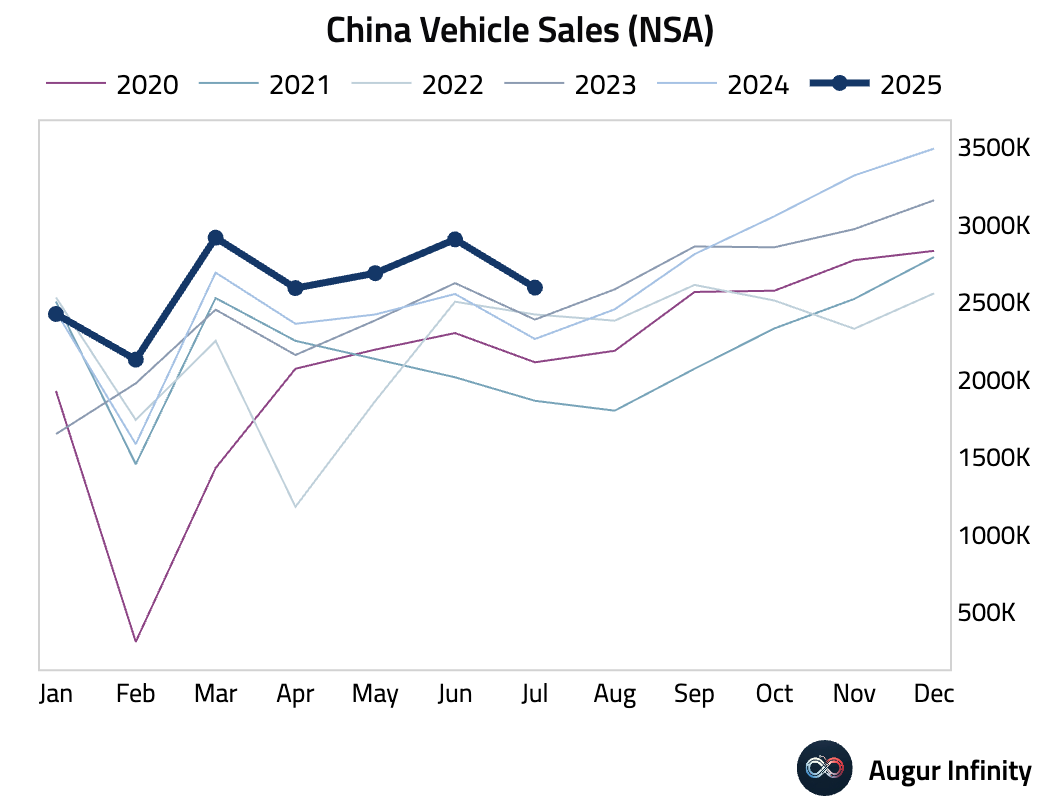
- Vehicle sales growth accelerated to 14.7% Y/Y in July from 13.8% in June.
Emerging Markets ex China
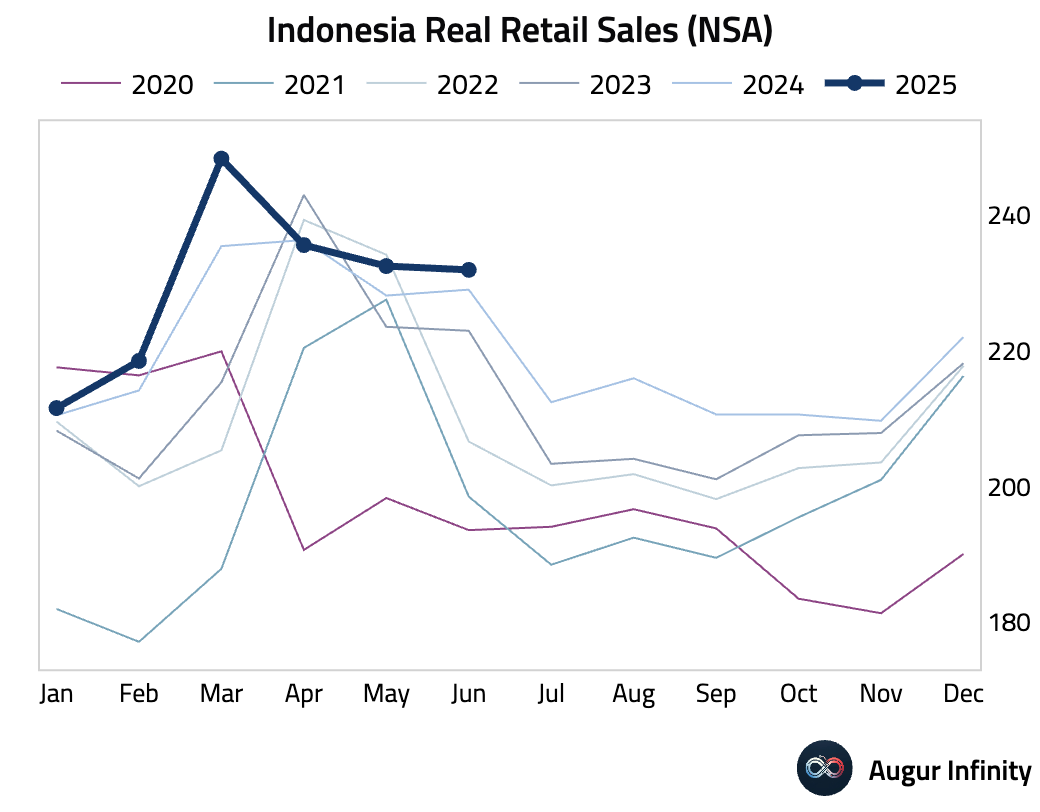
- Indonesia’s retail sales growth slowed to 1.3% Y/Y in June, down from 1.9% in the prior month.
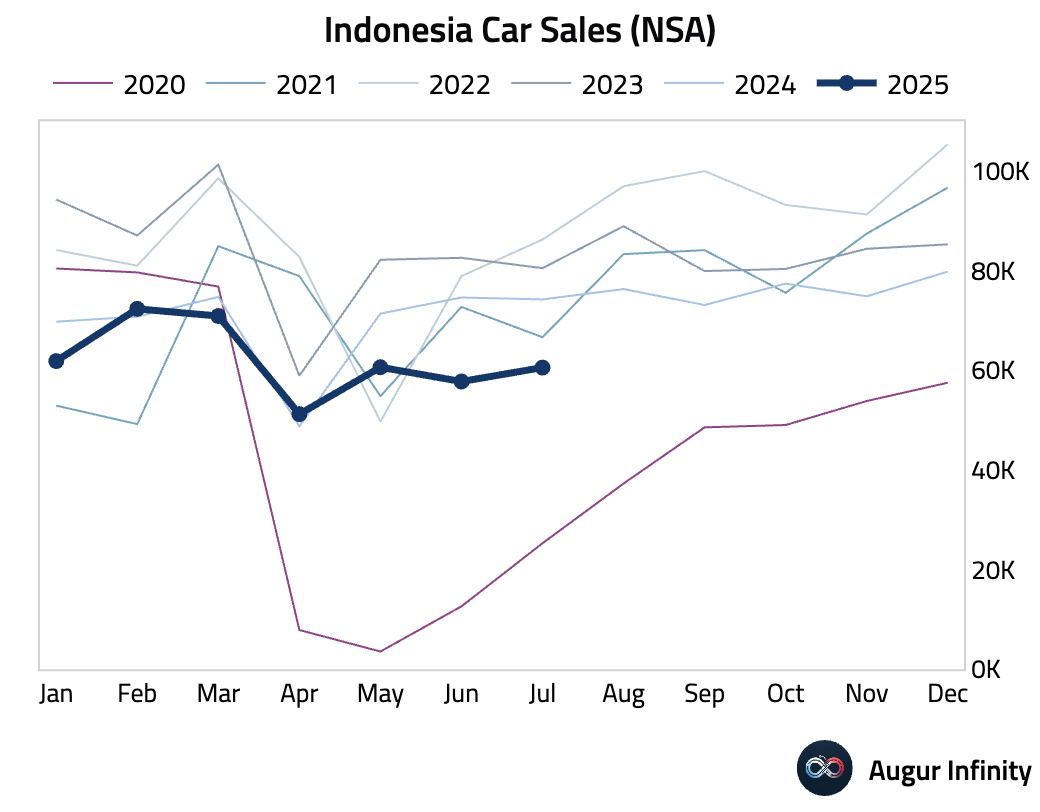
- Indonesia’s car sales contracted 18.4% Y/Y in July, improving slightly from a 22.6% fall in June.
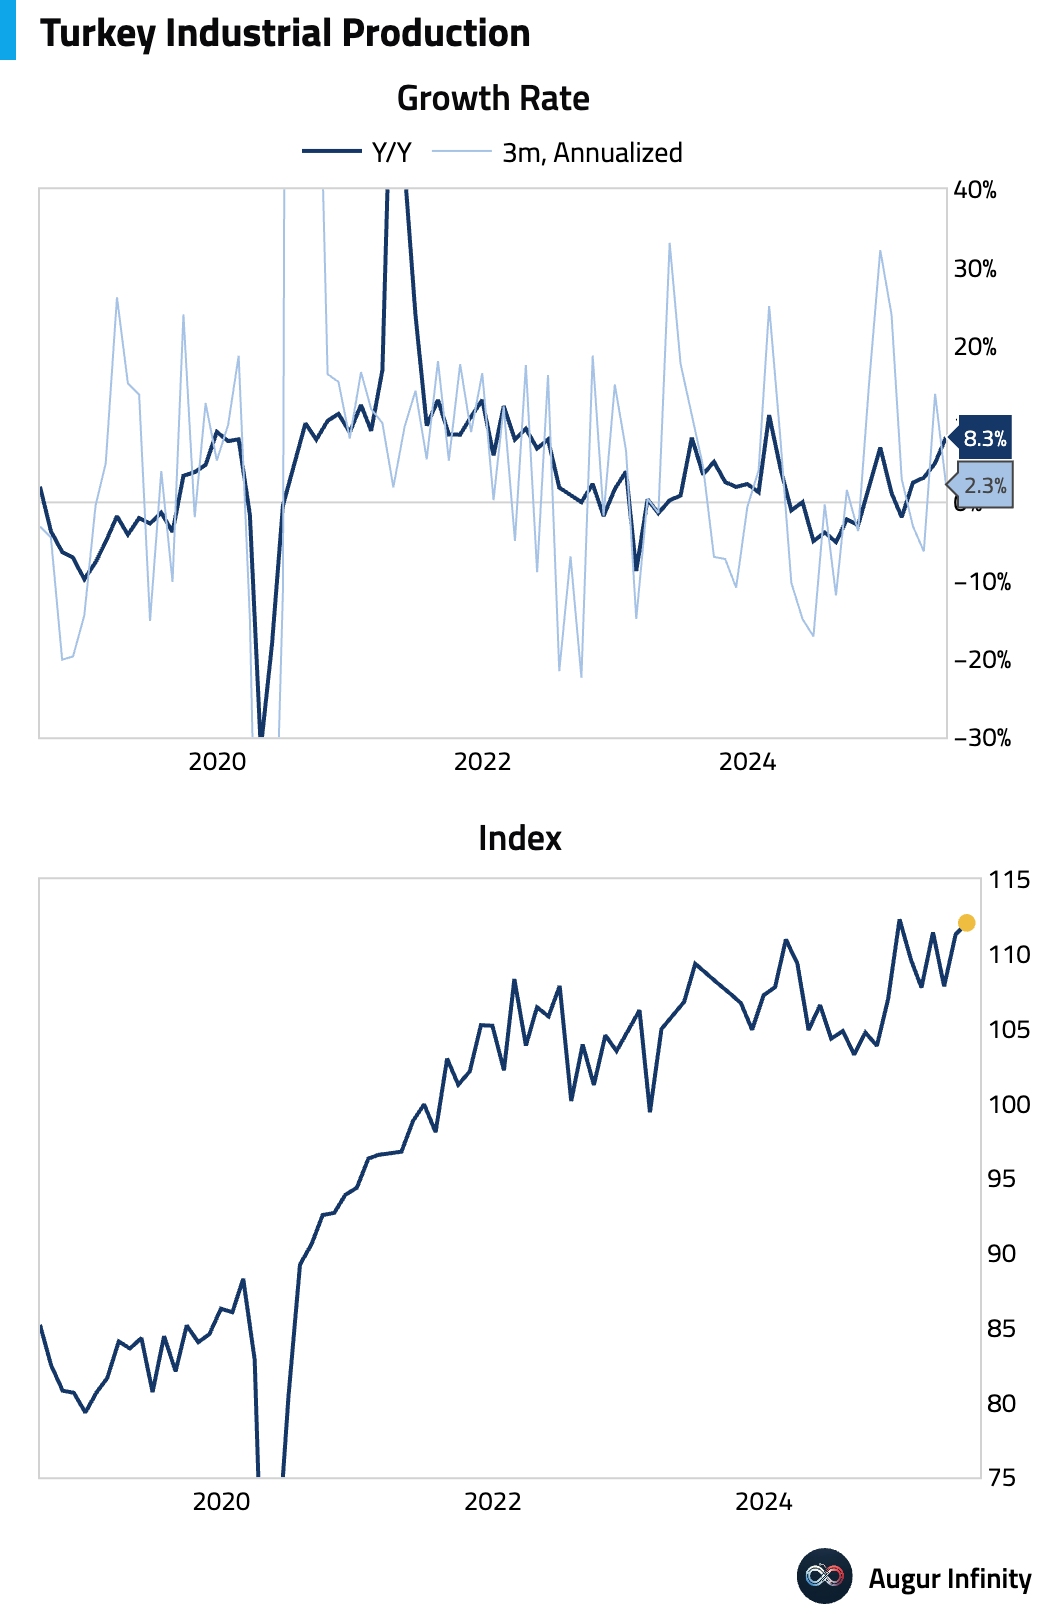
- Turkey industrial production growth surged to 8.3% Y/Y in June from 5.0% previously. On a M/M basis, growth moderated to 0.7% from 3.2%.
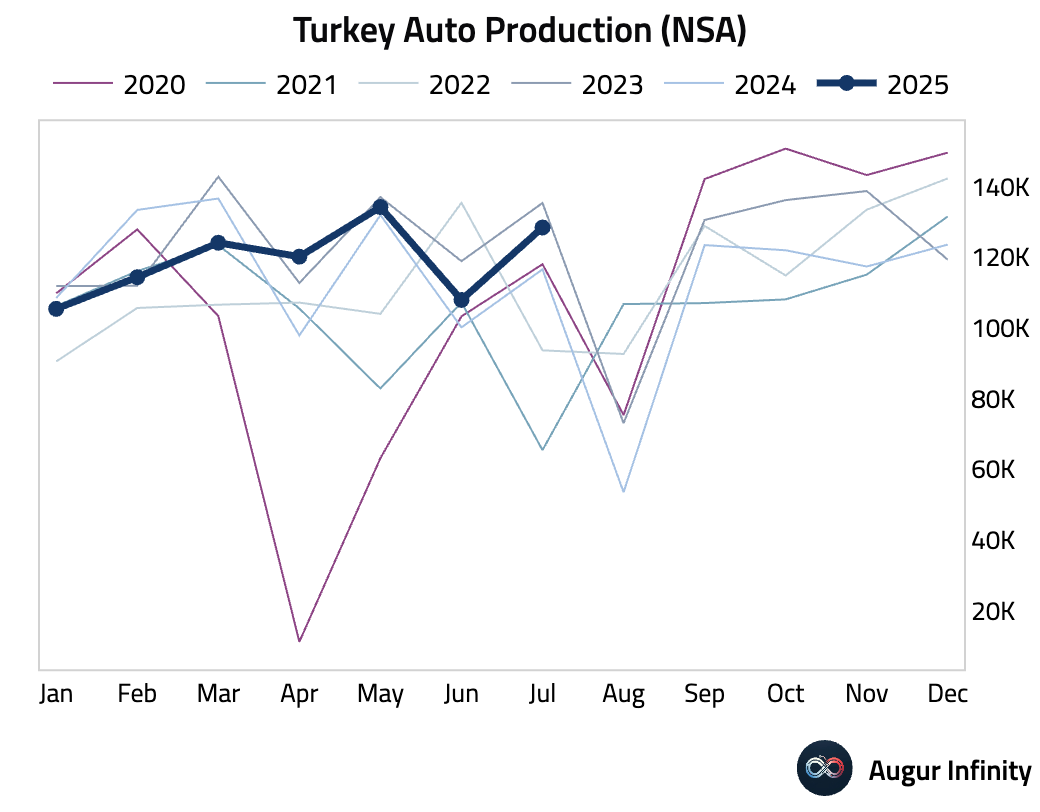
- Auto production in Turkey rose 10.1% Y/Y in July, accelerating from 7.8% growth in June.
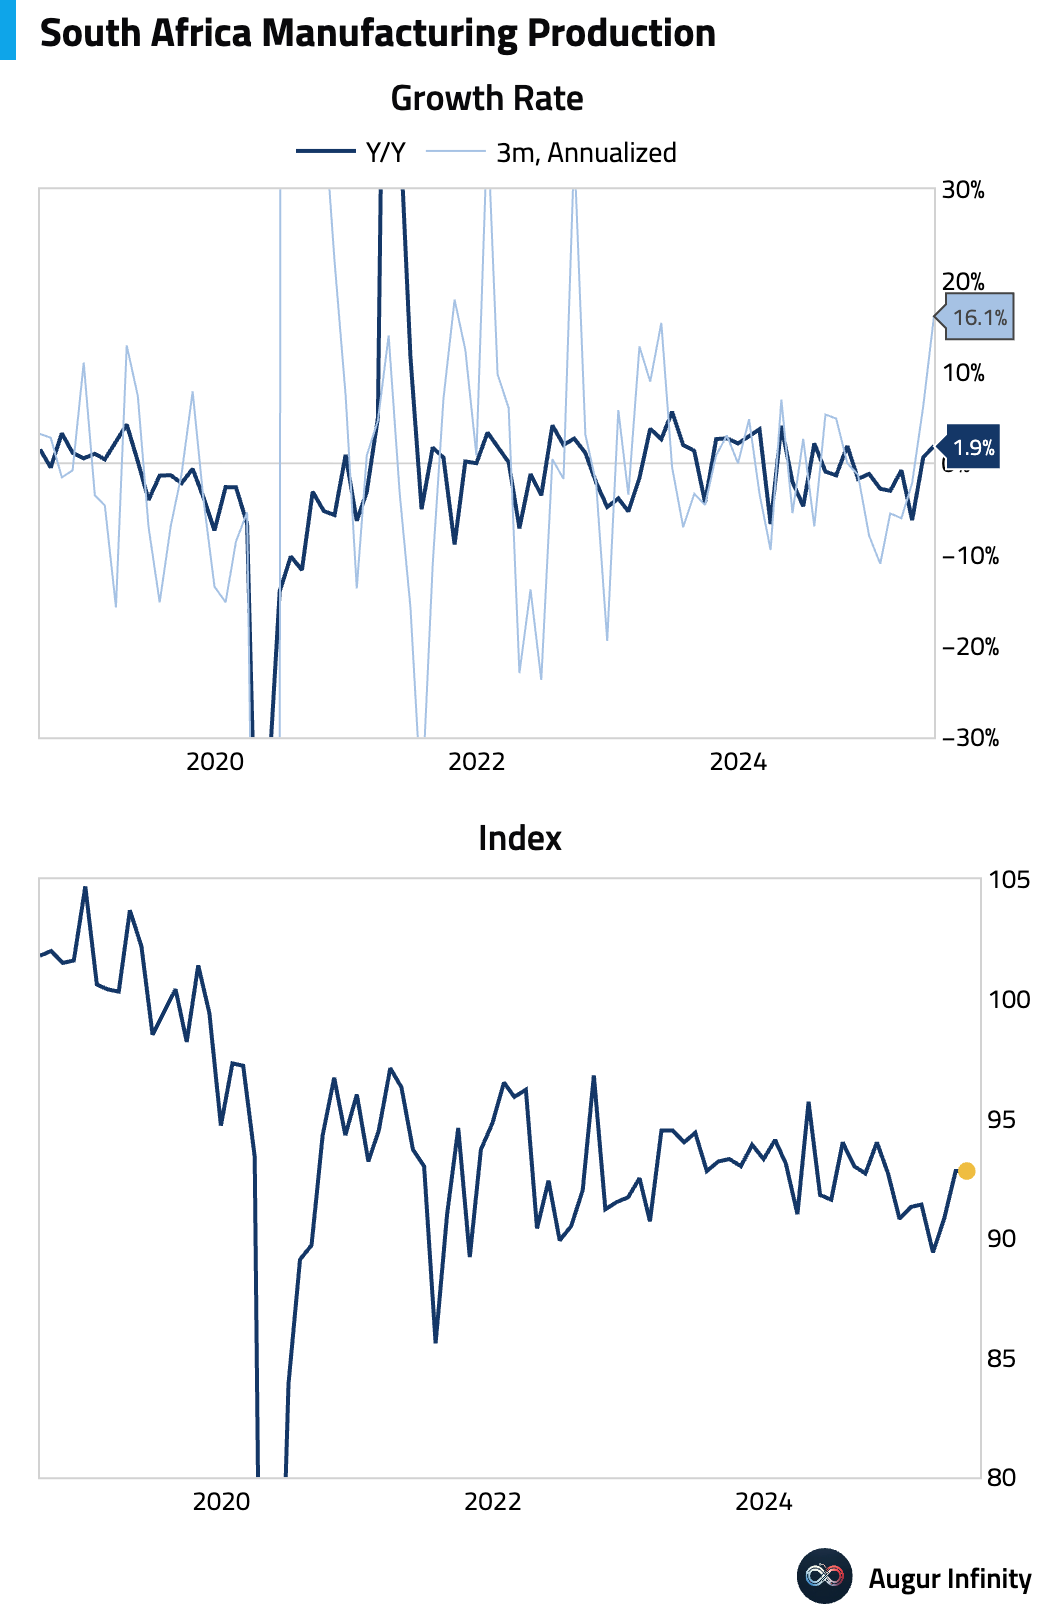
- South Africa manufacturing production expanded 1.9% Y/Y in June, beating the 1.0% consensus. The M/M figure was flat at 0.0%.
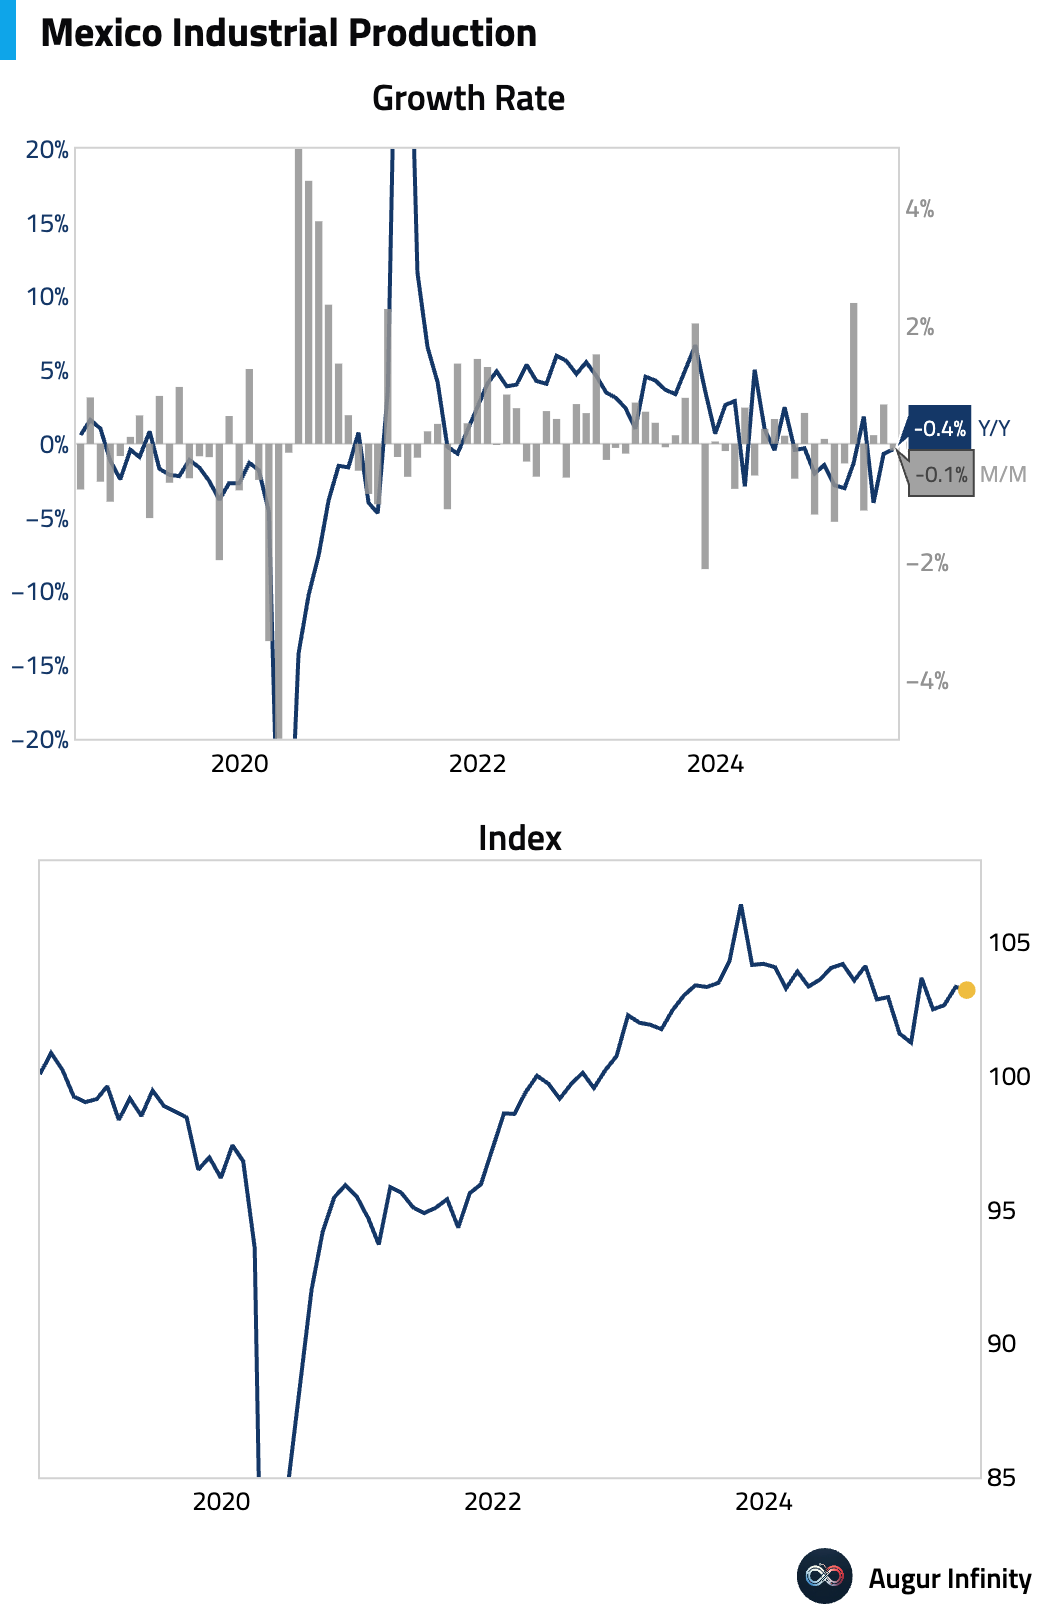
- Mexico’s industrial production unexpectedly contracted by 0.1% M/M in June, missing the consensus forecast for a 0.3% expansion. The Y/Y rate was -0.4%. The surprise downturn was driven by weakness in mining (-1.4%), construction (-0.2%), and utilities (-0.2%), which offset modest manufacturing growth (+0.3%). The mining sector has now declined for eight consecutive quarters, reflecting a challenged oil sector.
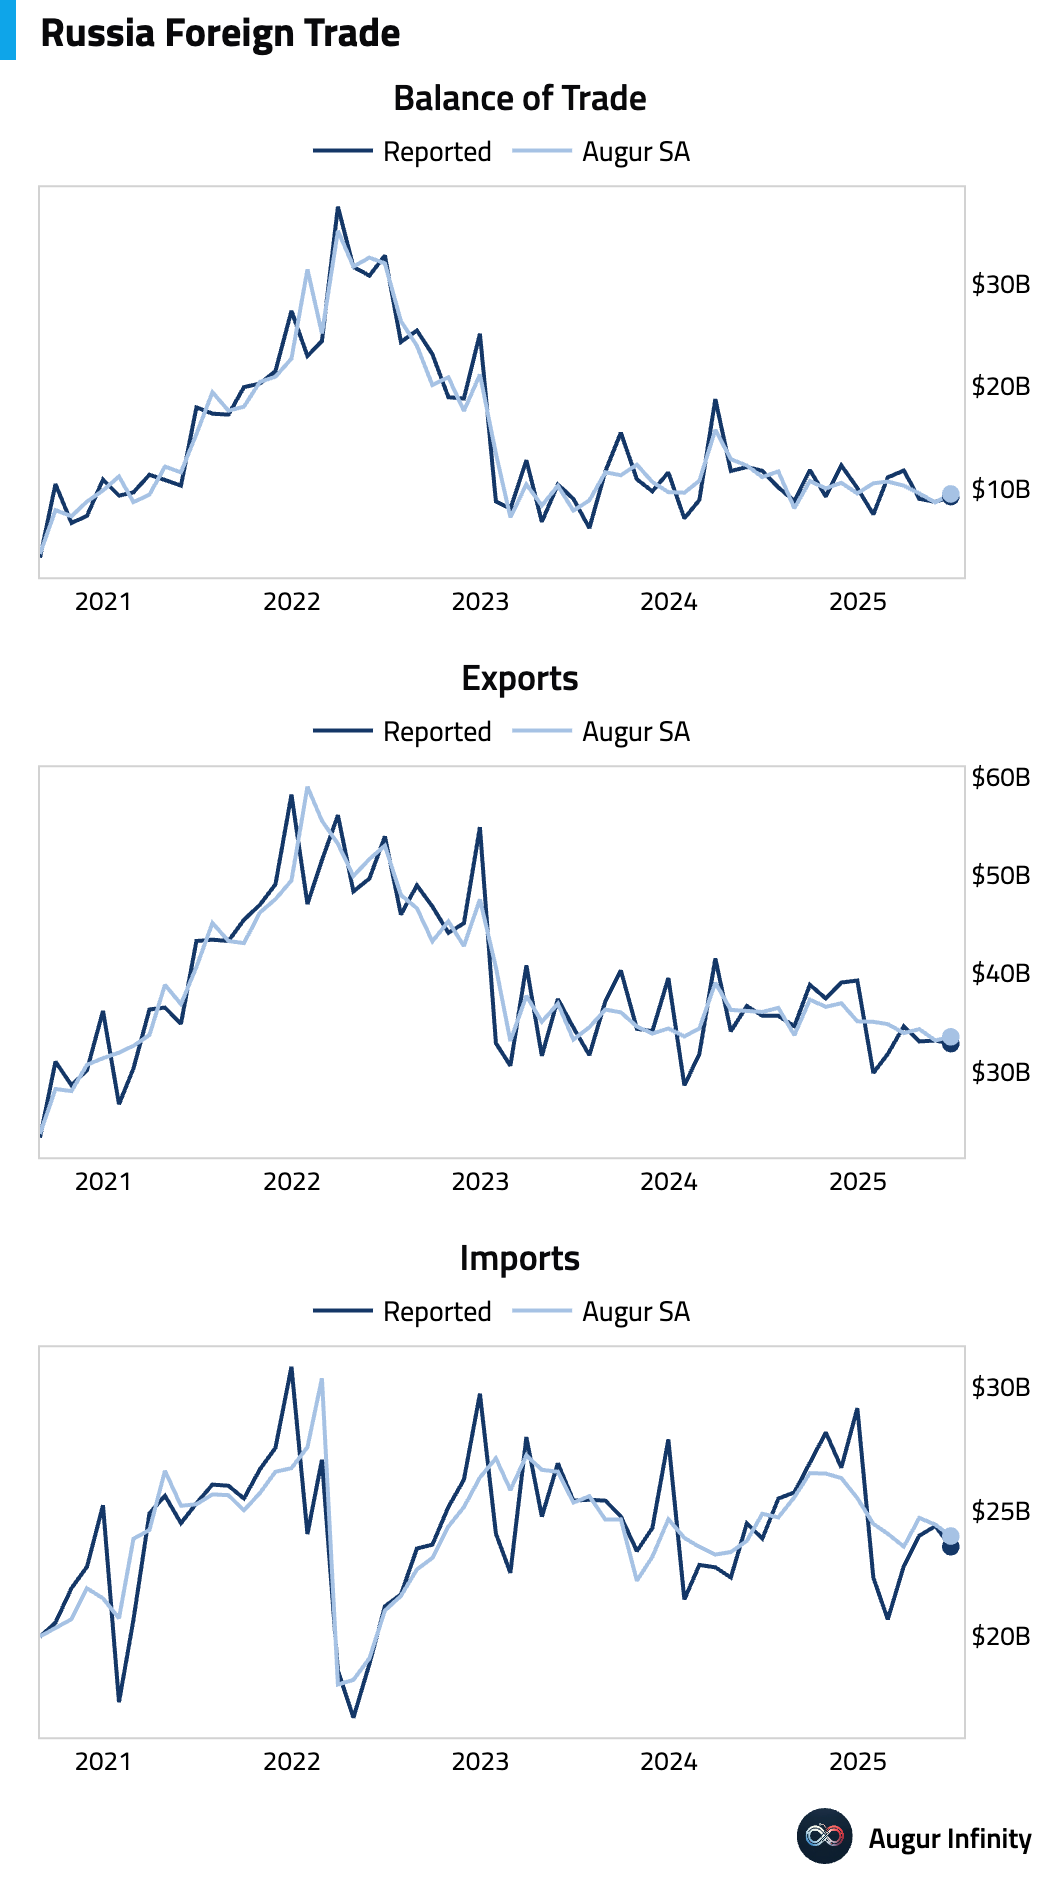
- Russia trade surplus widened to $9.26 billion in June from $8.74 billion in May.
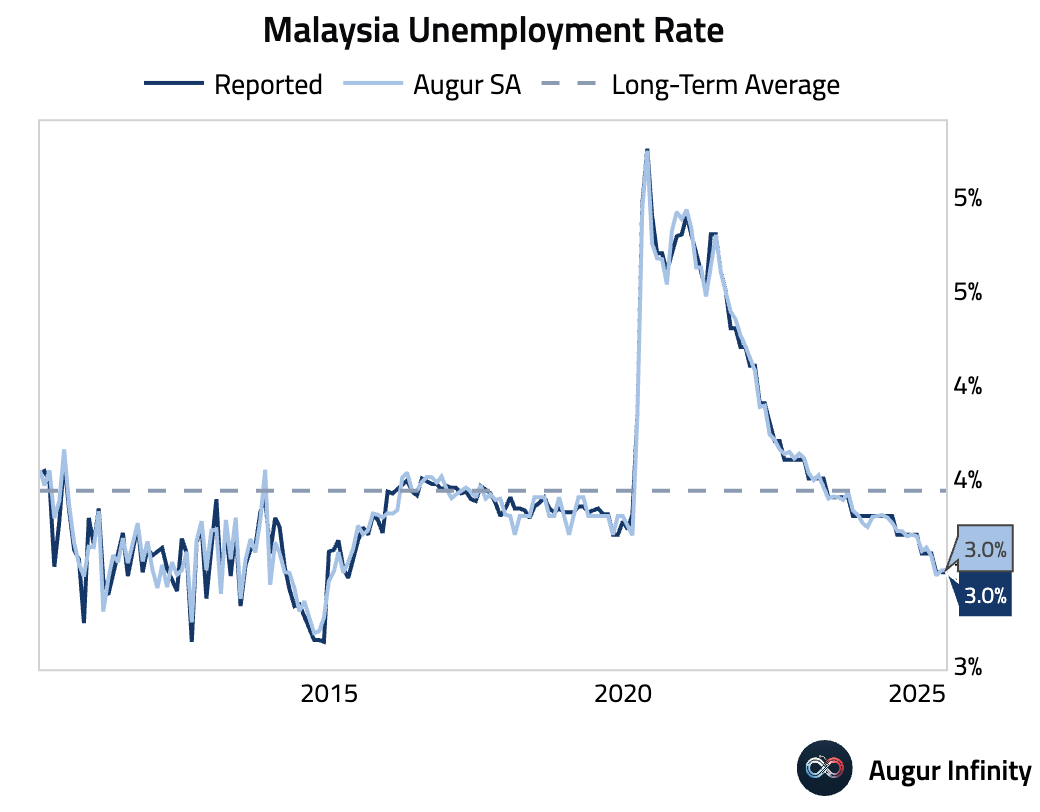
- Unemployment rate in Malaysia remained unchanged at 3.0% in June.
Global Markets
Equities
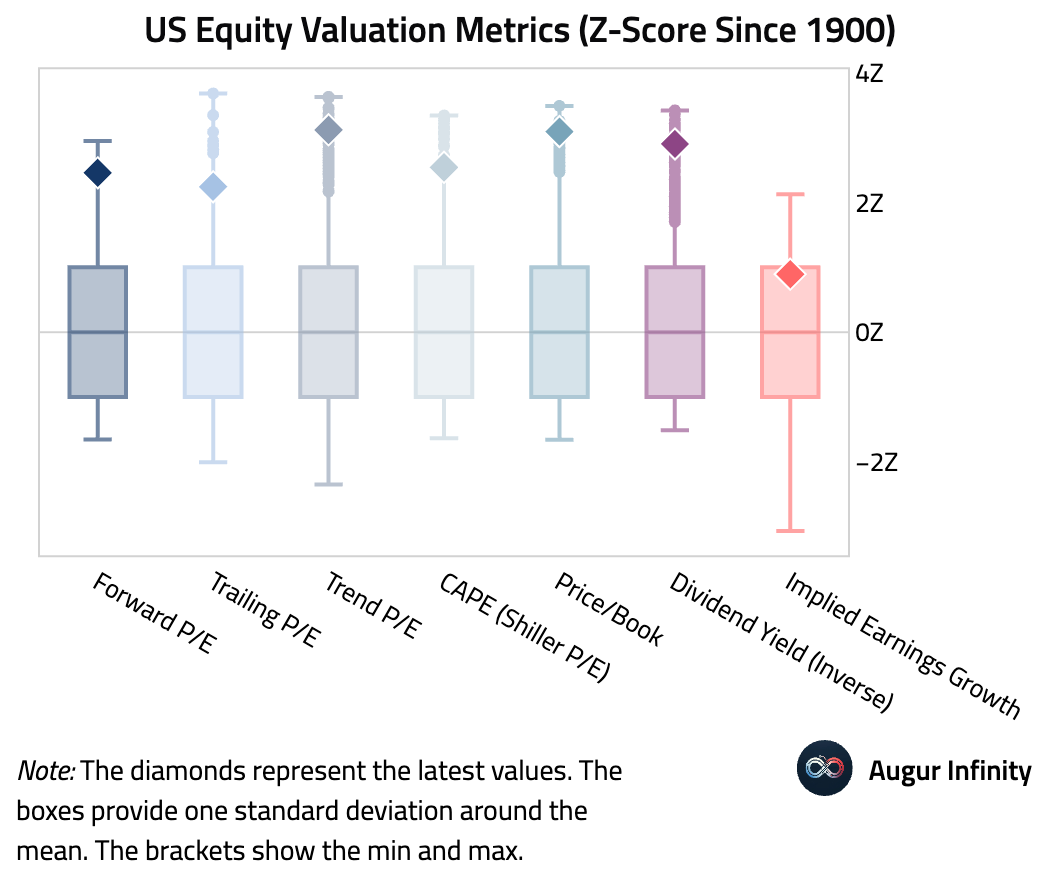
- US equity valuation is elevated across all major measures, with most metrics more than two standard deviations above their long-term averages since 1900.
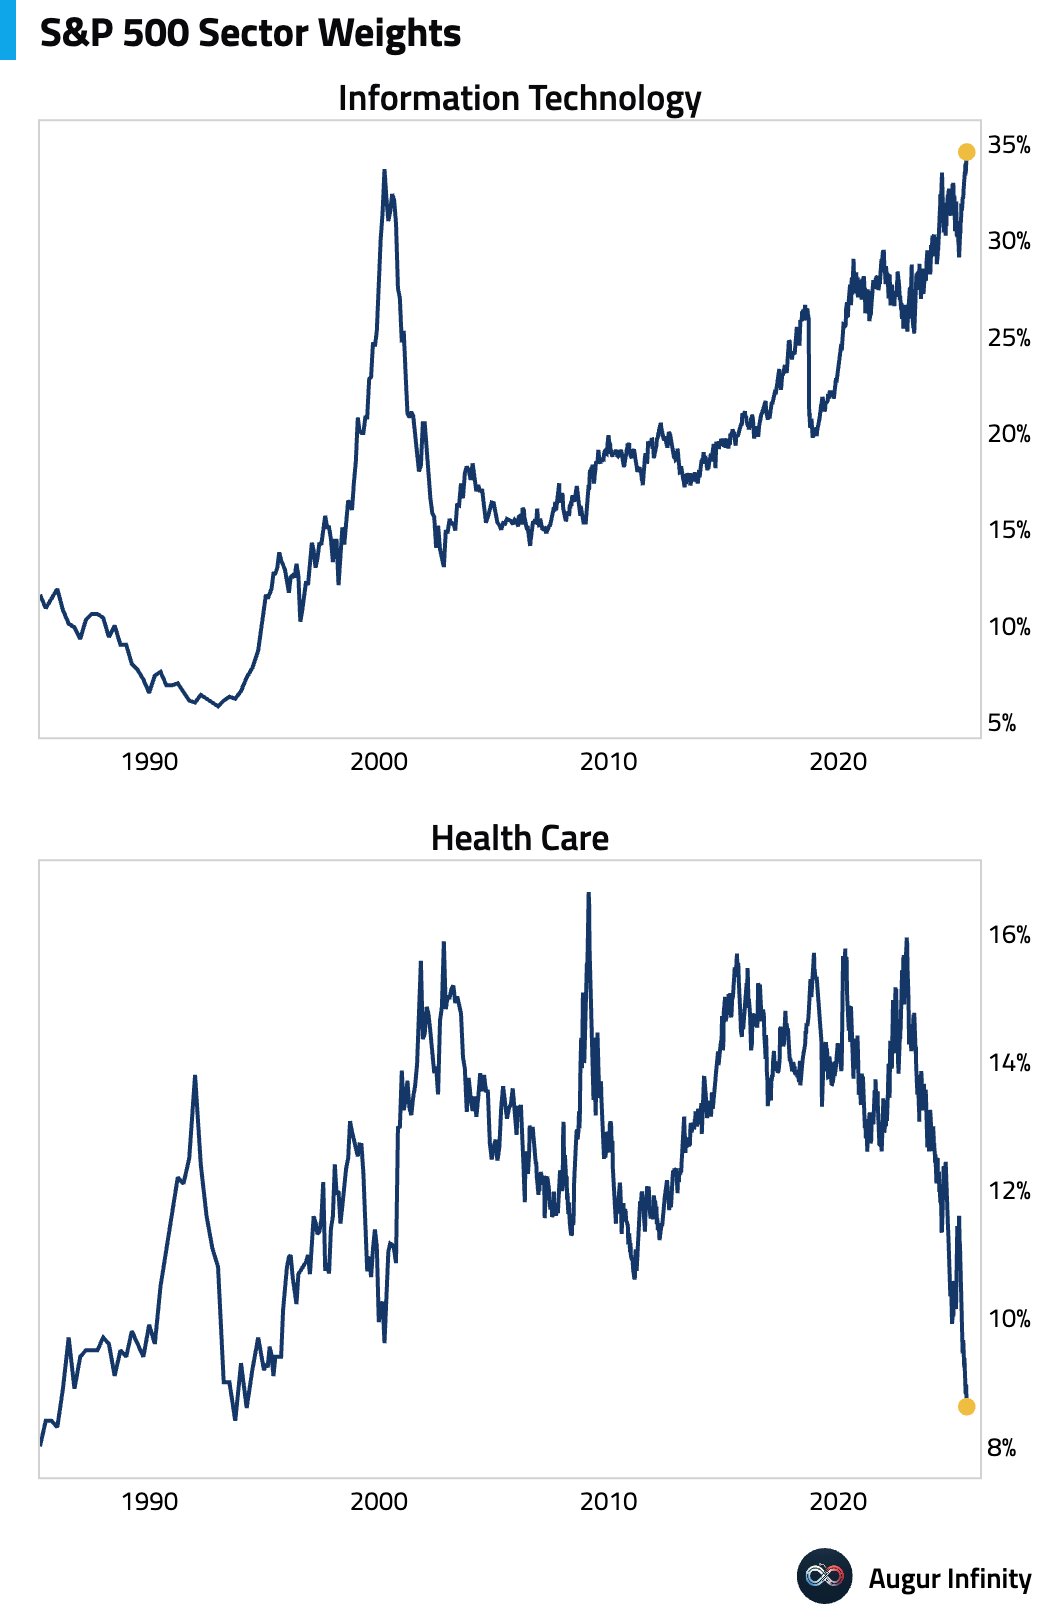
- The weight of the Information Technology sector in the S&P 500 Index has reached a new all-time high of over 34%. In contrast, the Health Care sector's weight has fallen below 9%, hovering near a 30-year low.
Fixed Income
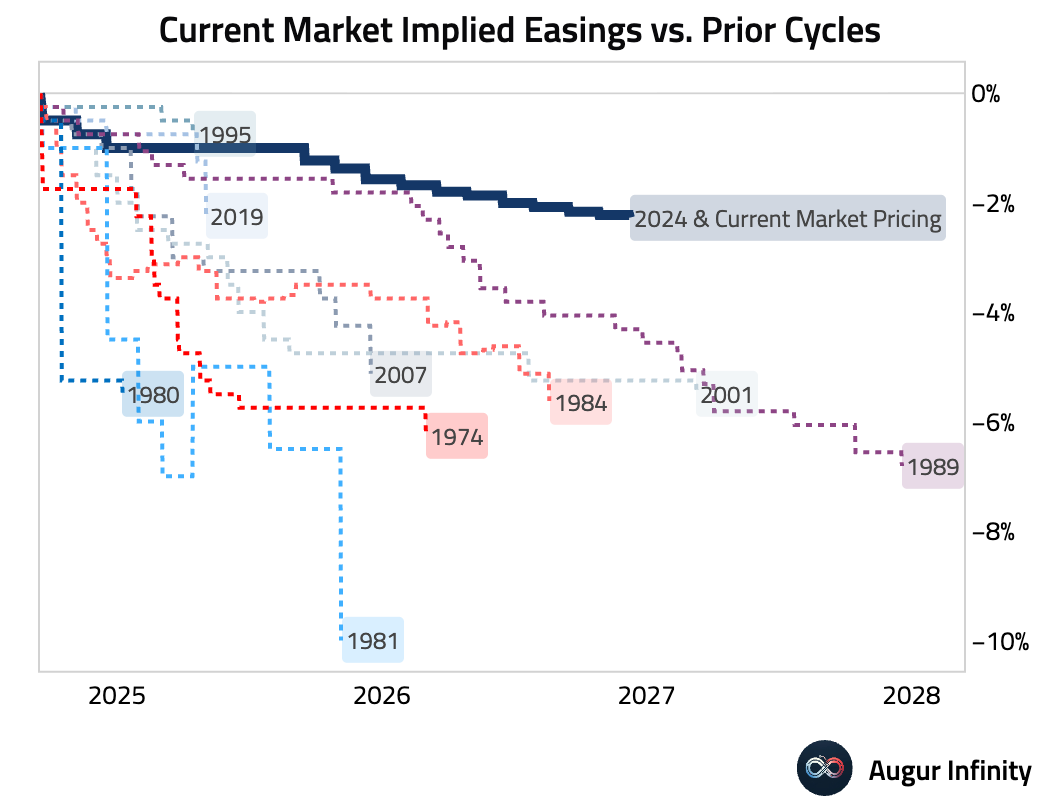
- The market is pricing for just over 100 bps of rate cuts in the US over the next twelve months, bringing the total easings since September 2024 to a little more than 200 bps. Here’s how that pace of rate cuts compares with historical easing cycles.
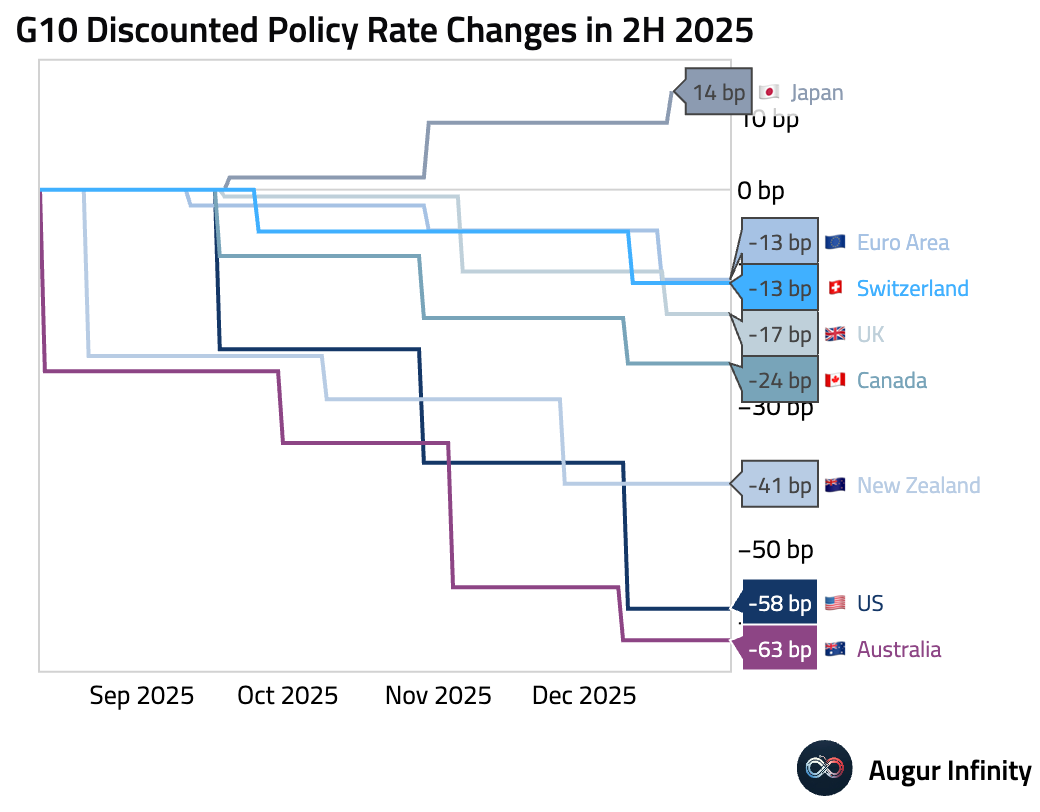
- Here’s how markets are pricing central bank policy rate changes across G10 economies for the remainder of the year.
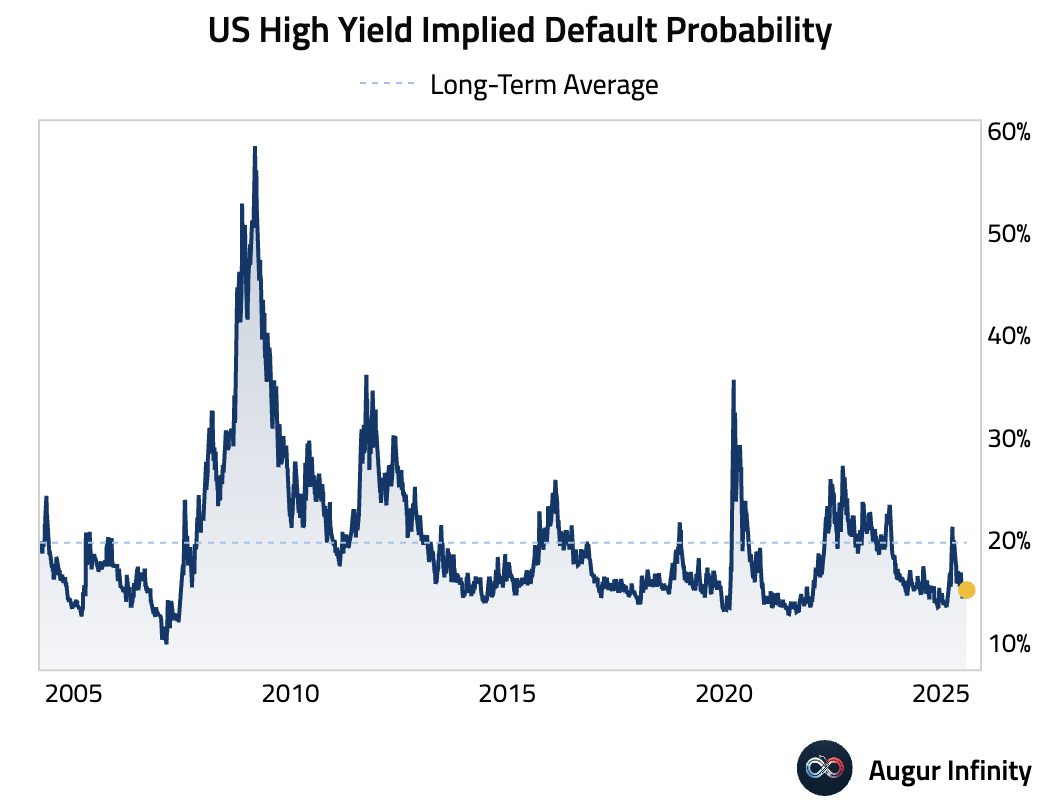
- The US credit market remains highly optimistic, pricing in high-yield bond default probabilities that are well below long-term averages.
Musings
- Income share of the top 1% over the past 200 years visualized.
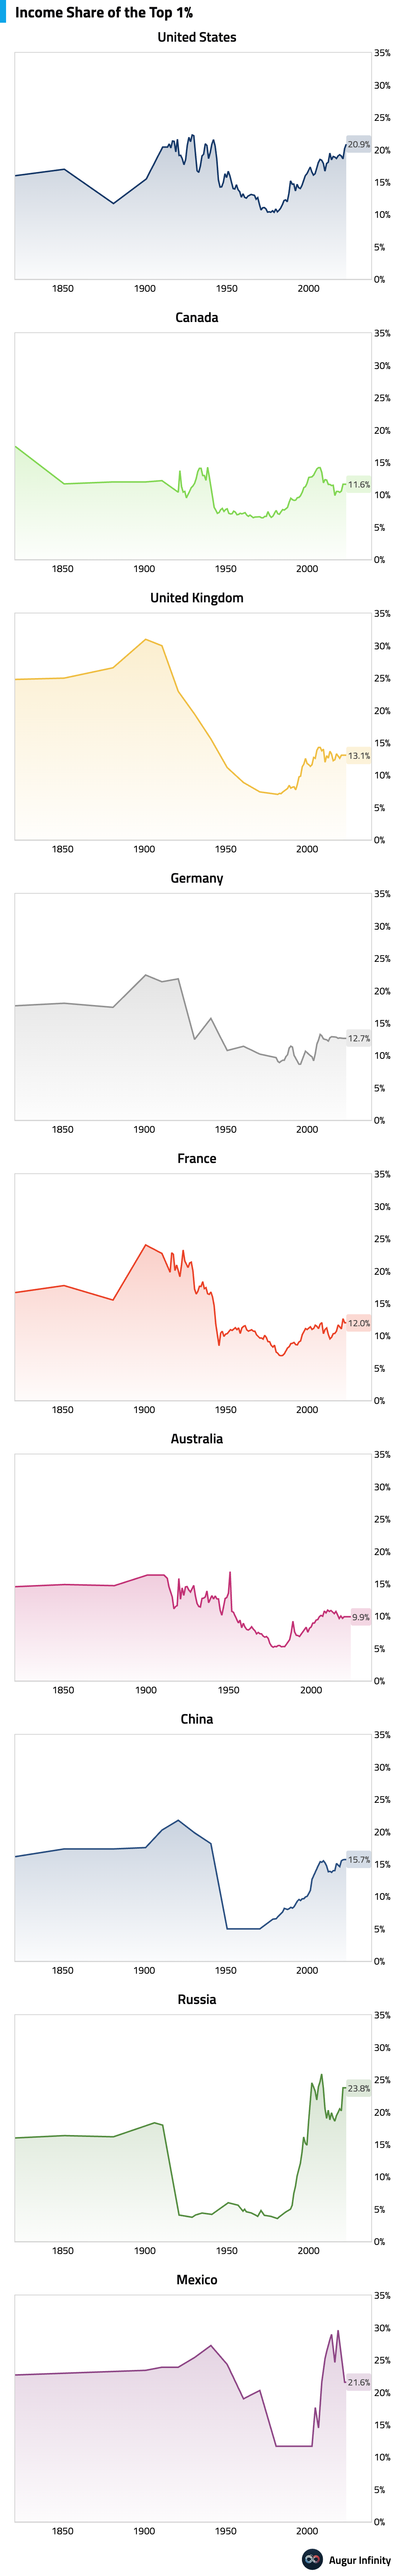
Source: World Inequality Lab
Disclaimer
Augur Digest is an automatically generated newsletter edited by humans. It may contain inaccuracies and is not investment advice. Augur Labs LLC will not accept liability for any loss or damage as a result of your reliance on the information contained in the newsletter.