- Augur Digest
- Posts
- Augur Digest #59 (Flash)
Augur Digest #59 (Flash)
Note: This is the August Digest Flash—an early look at today’s economic developments. The full edition will be released at 4 p.m.
Charts of the Day
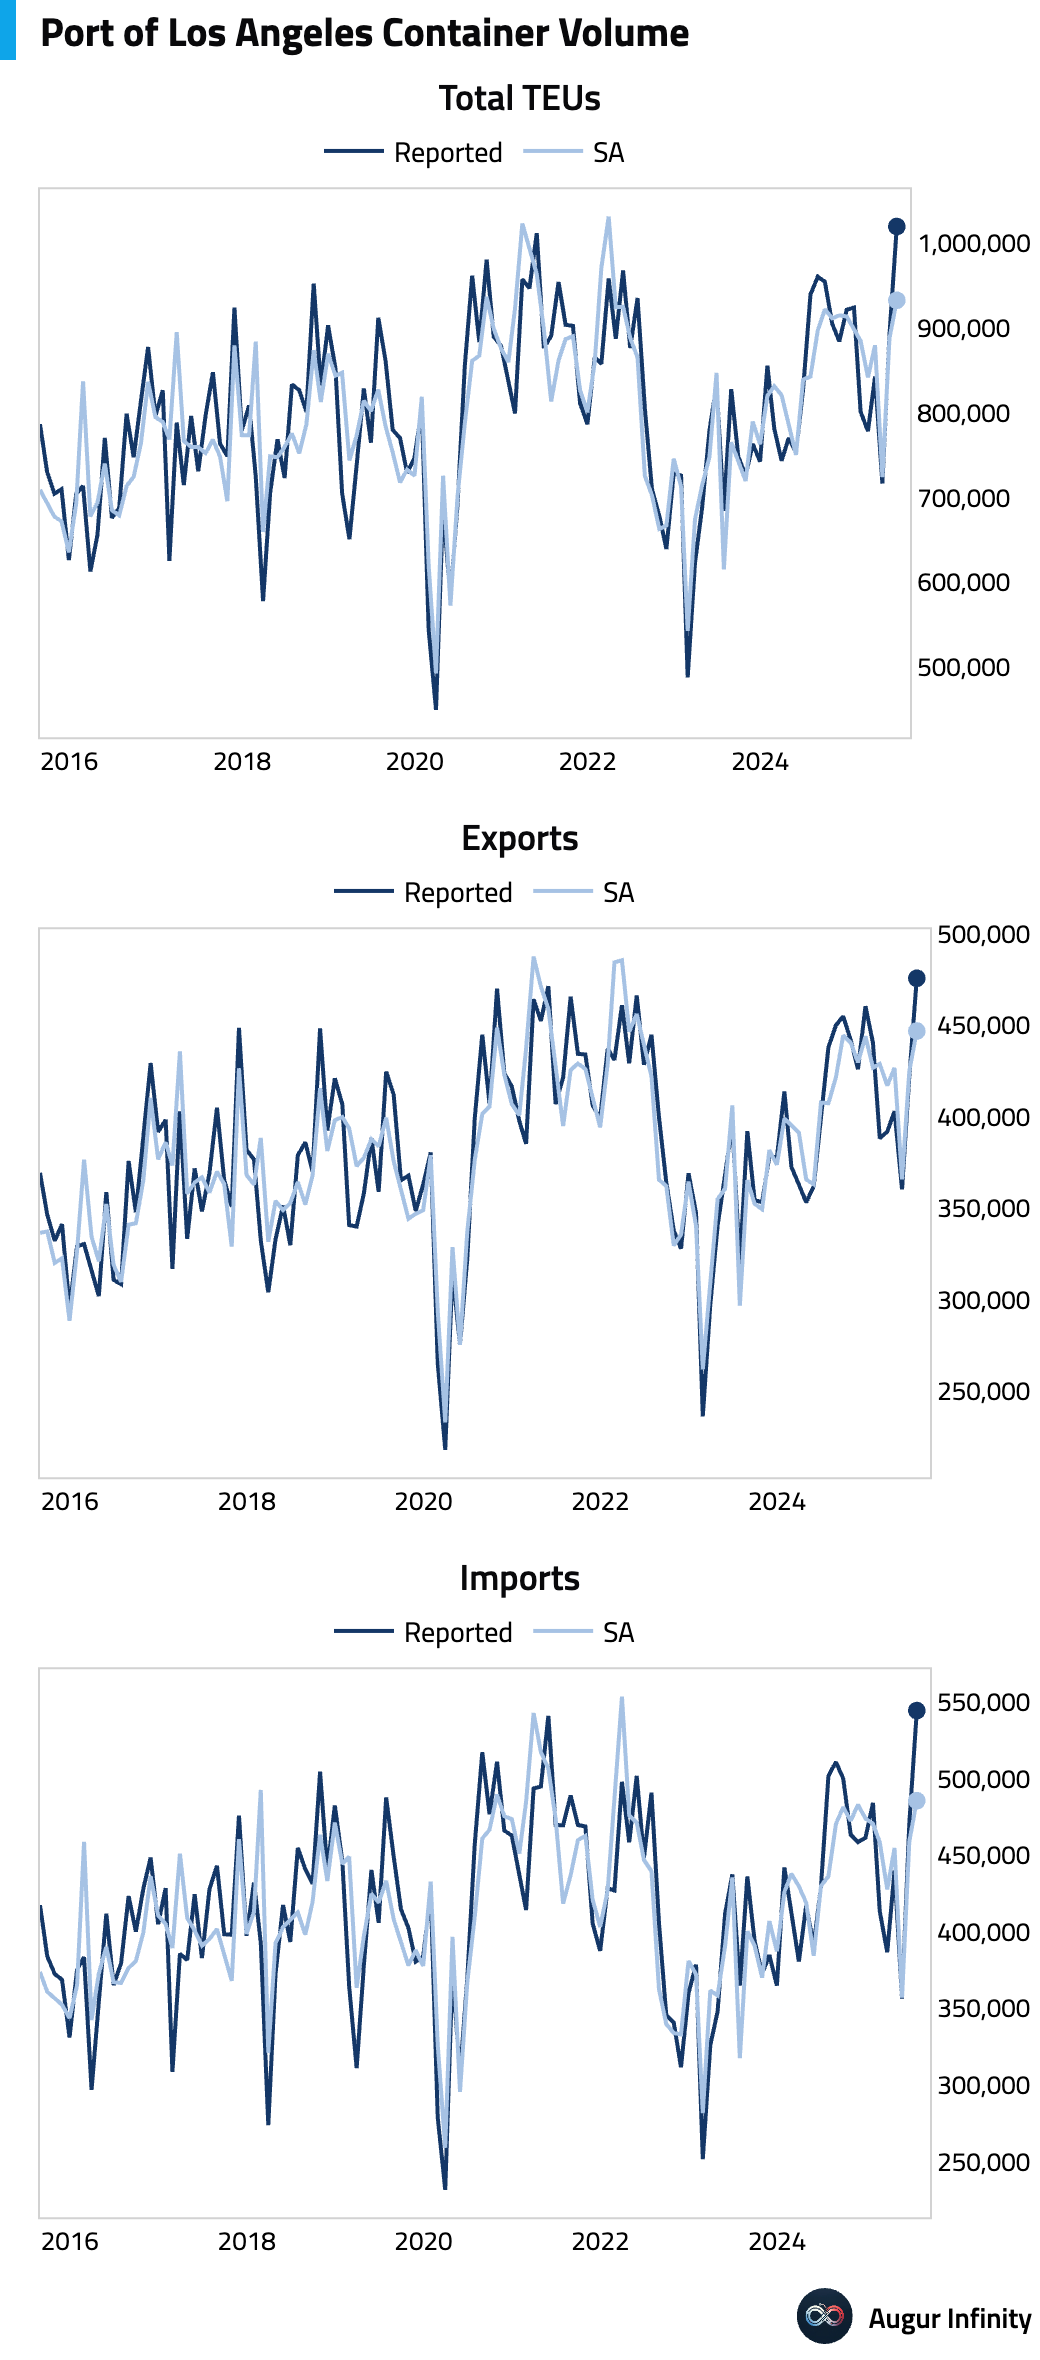
- Container volume at the Port of Los Angeles hit a record high in July. Even after seasonal adjustment, the July reading was still the highest since March 2022.
Global Economics
United States
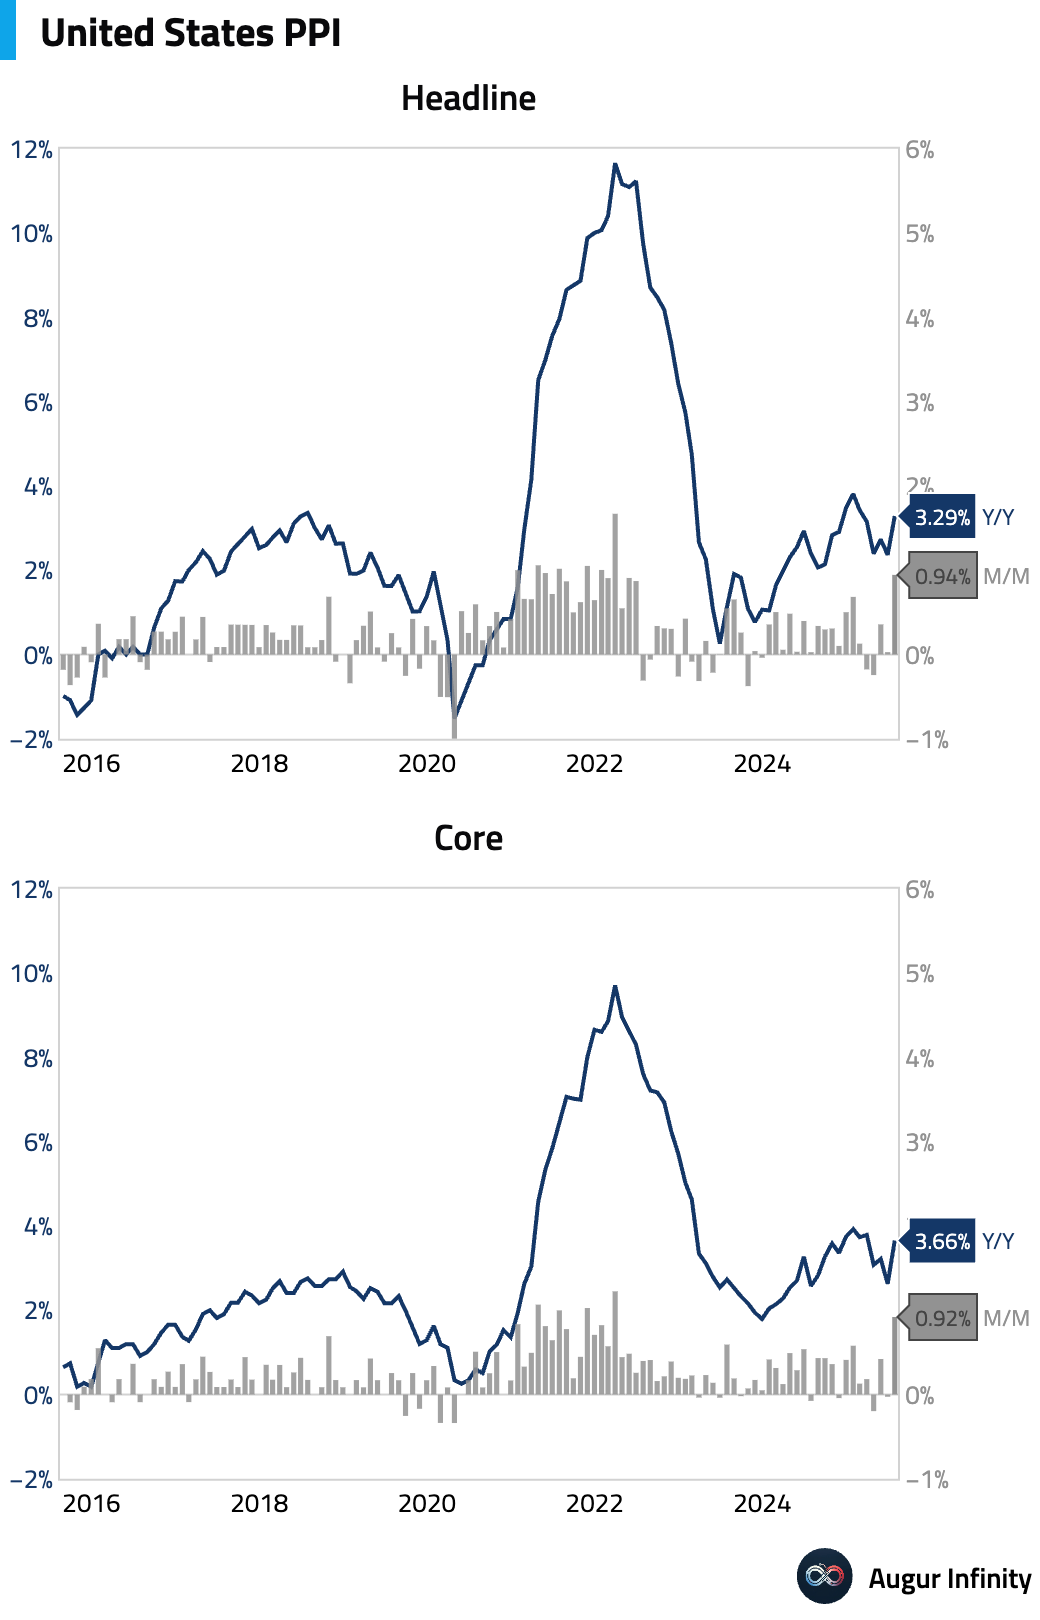
- The Producer Price Index (PPI) for final demand surged 0.9% M/M in July, a significant acceleration from June’s flat reading and well above the +0.2% consensus forecast. The core index, excluding food and energy, also rose sharply by 0.9% M/M. Year-over-year, the headline PPI increased to 3.3% from 2.4%, while the core measure jumped to 3.7% from 2.6%. The surprise was driven by a 2% jump in retailer/wholesaler margins and strong gains in portfolio management services.
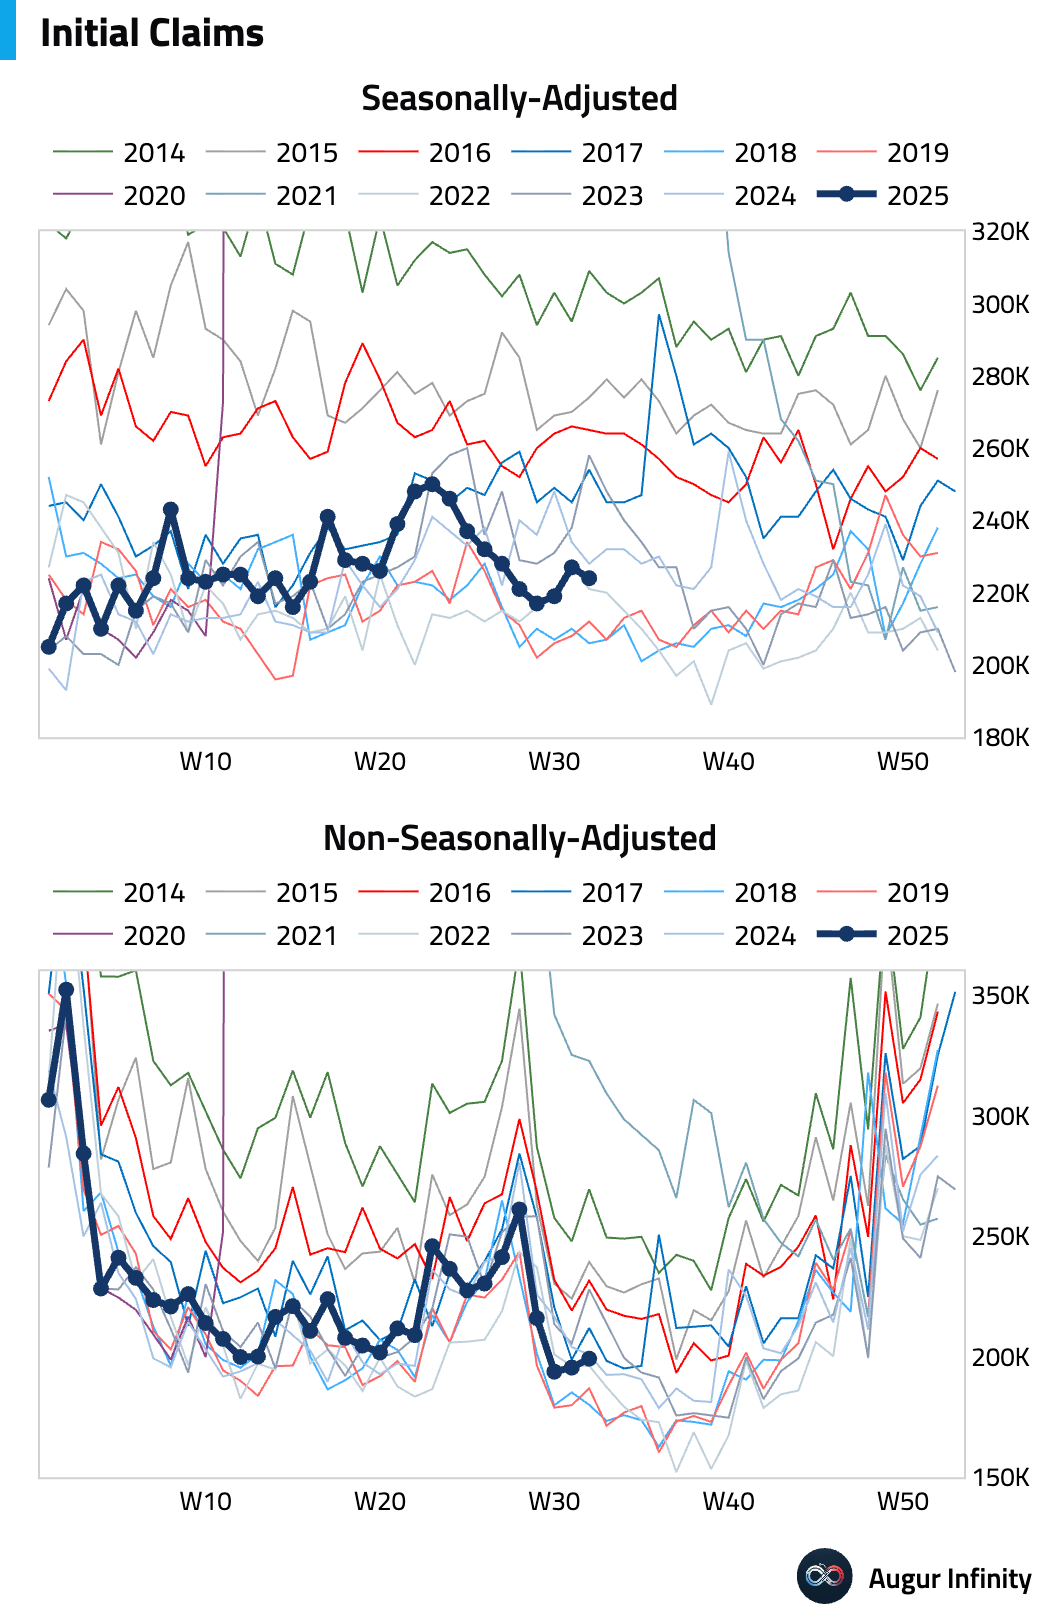
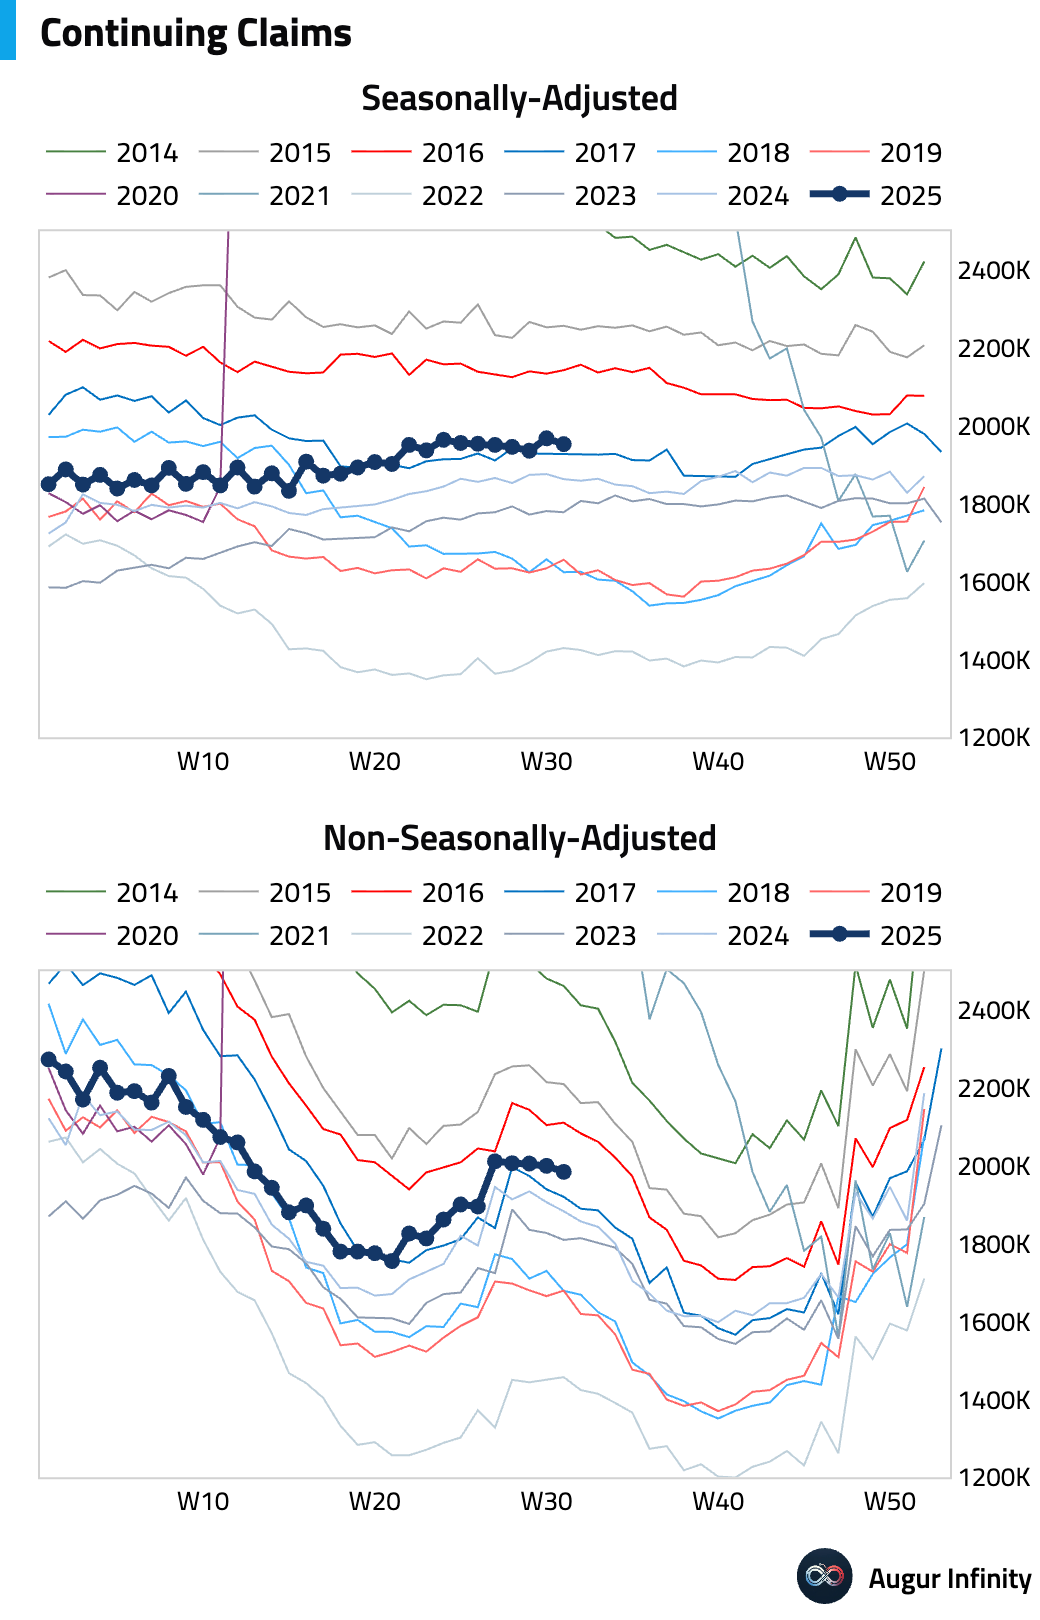
- Initial jobless claims for the week ending August 9 were 224,000, slightly below the prior week's 227,000 and in line with consensus, suggesting continued labor market stability. Continuing claims for the week ending August 2 also edged down to 1.953 million from 1.968 million. The four-week moving average ticked up slightly to 221,750, reinforcing a steady underlying trend with no significant state-level drivers.
Europe
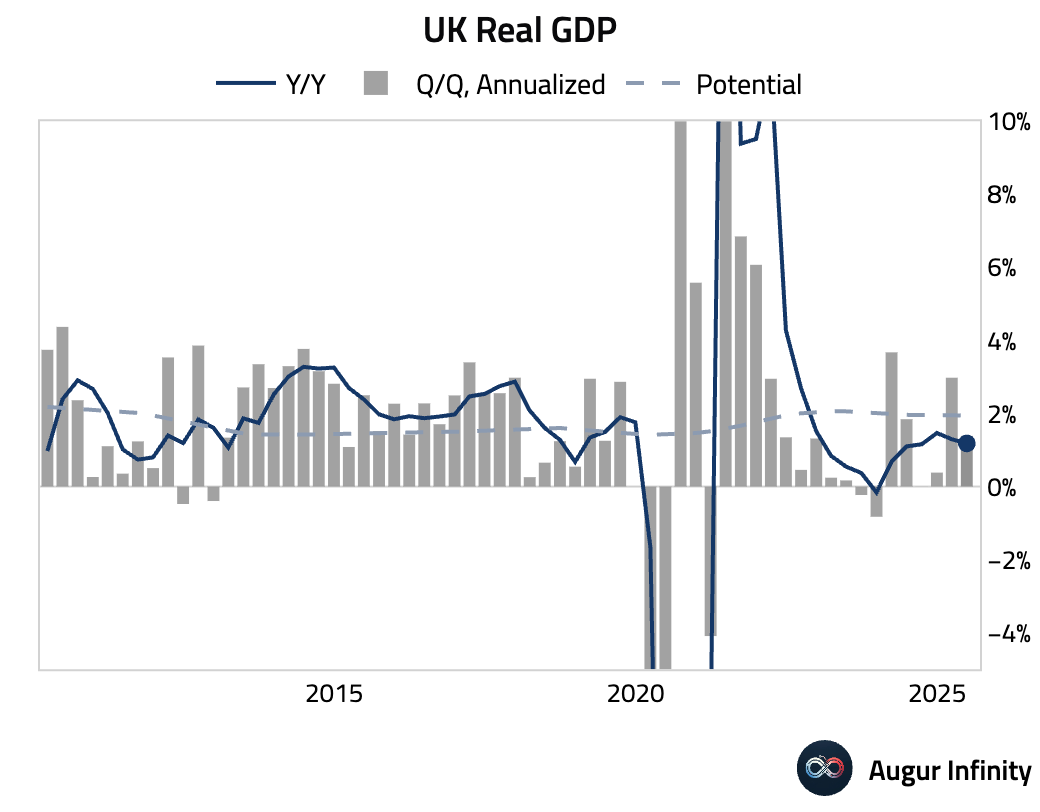
- Preliminary UK GDP for Q2 grew 0.3% Q/Q, above the +0.1% consensus but slowing from Q1's +0.7%. The Y/Y rate was 1.2%. However, the composition was soft, with growth driven by a 1.2% jump in government spending and inventory accumulation. Household consumption was muted at +0.1%, and business investment fell sharply.
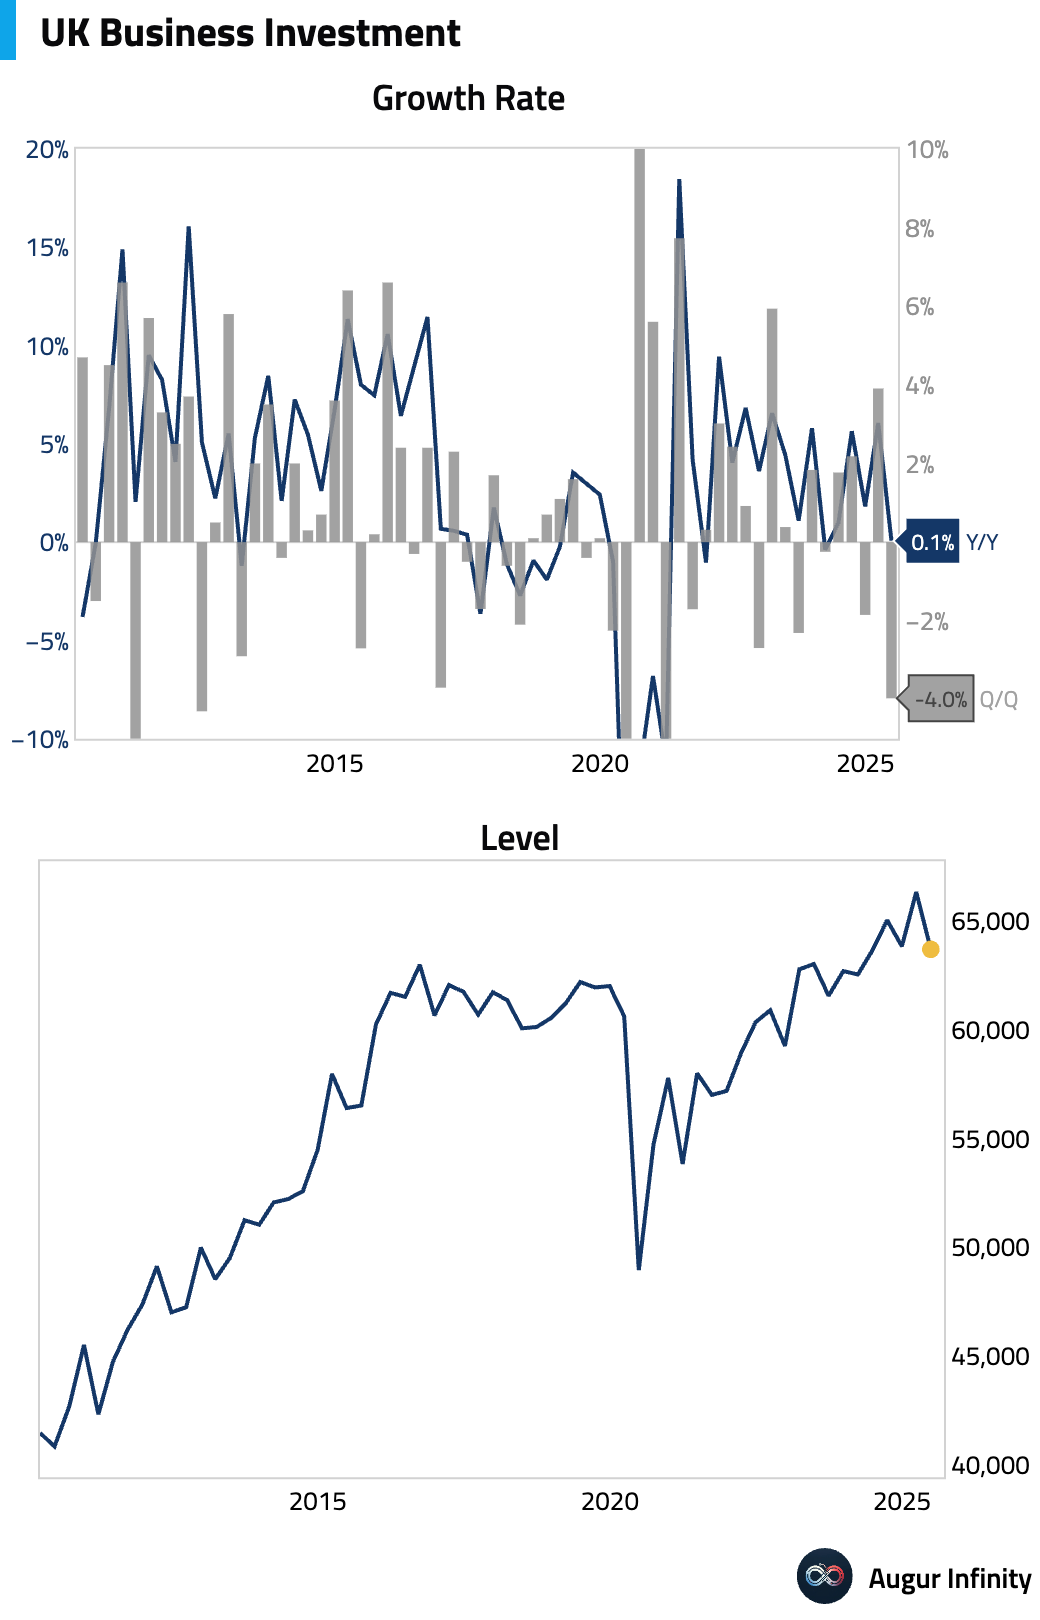
- Q2 business investment in the UK contracted by a sharp 4.0% Q/Q, a significant reversal from the 3.9% expansion in Q1 and a substantial miss against the +0.1% consensus. The year-over-year figure fell to just 0.1%.
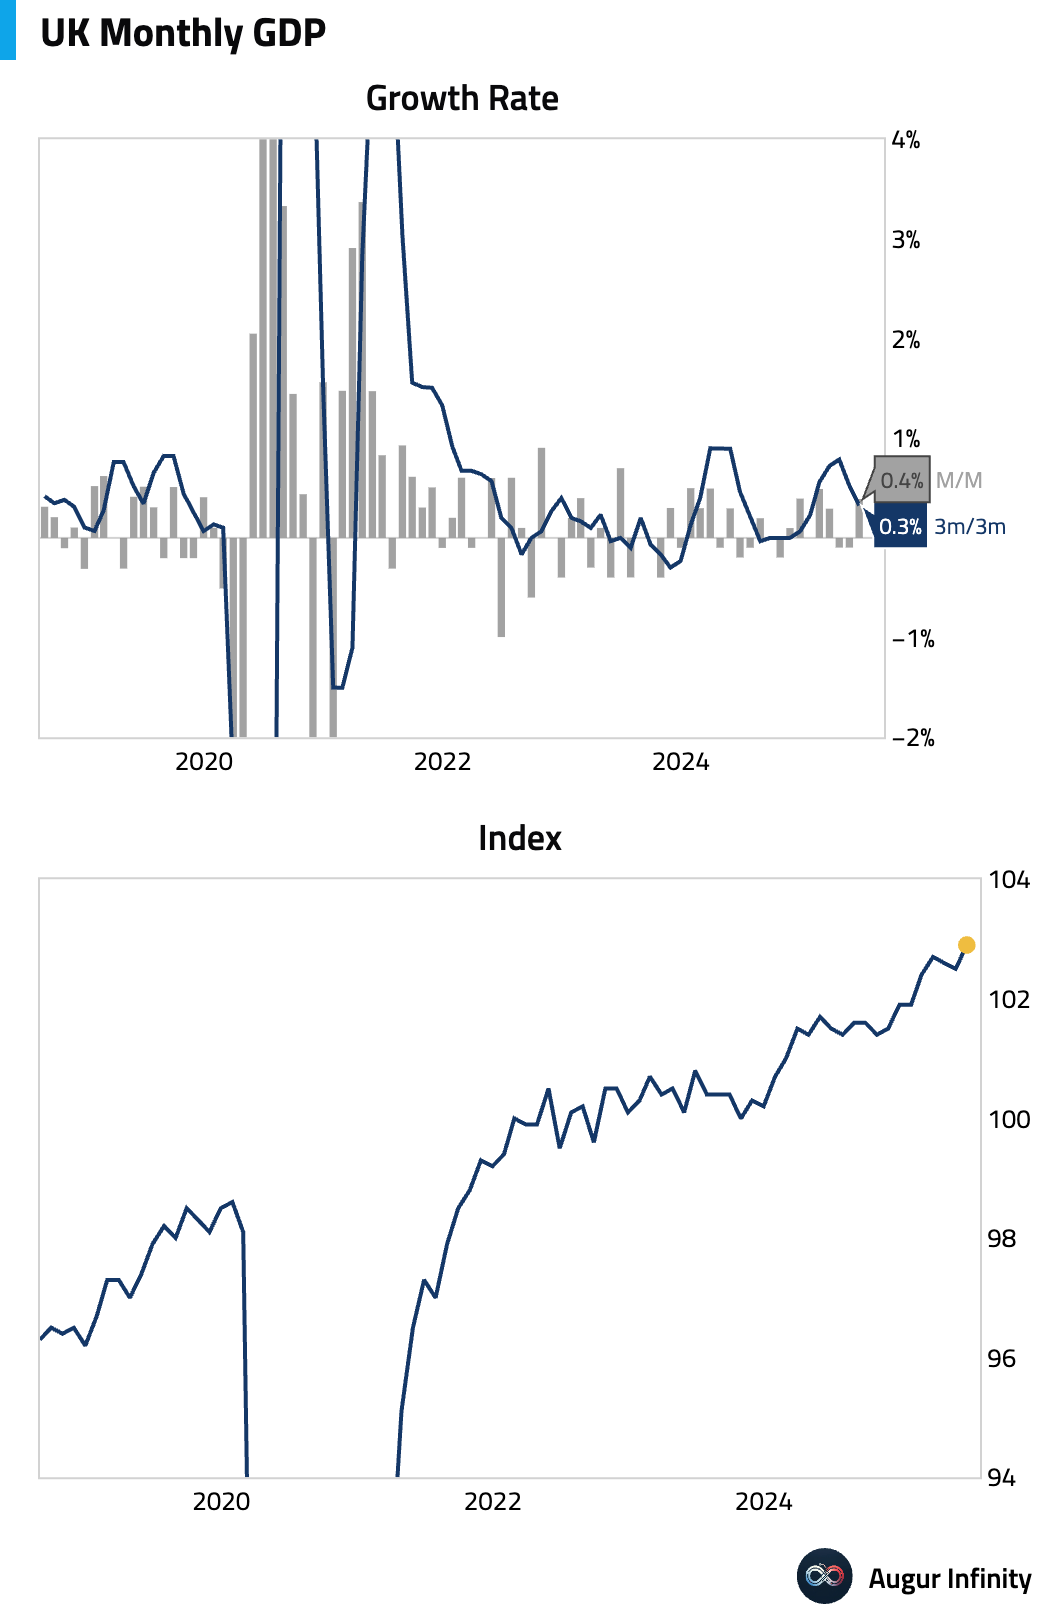
- UK monthly GDP for June rose 0.4% M/M, doubling the consensus forecast and rebounding from a 0.1% decline in May. Growth was broad-based across services, production, and construction, with the ONS noting some manufacturers saw increased demand for military-related products. The three-month average growth rate eased to 0.3%. The Y/Y rate accelerated to 1.4%.
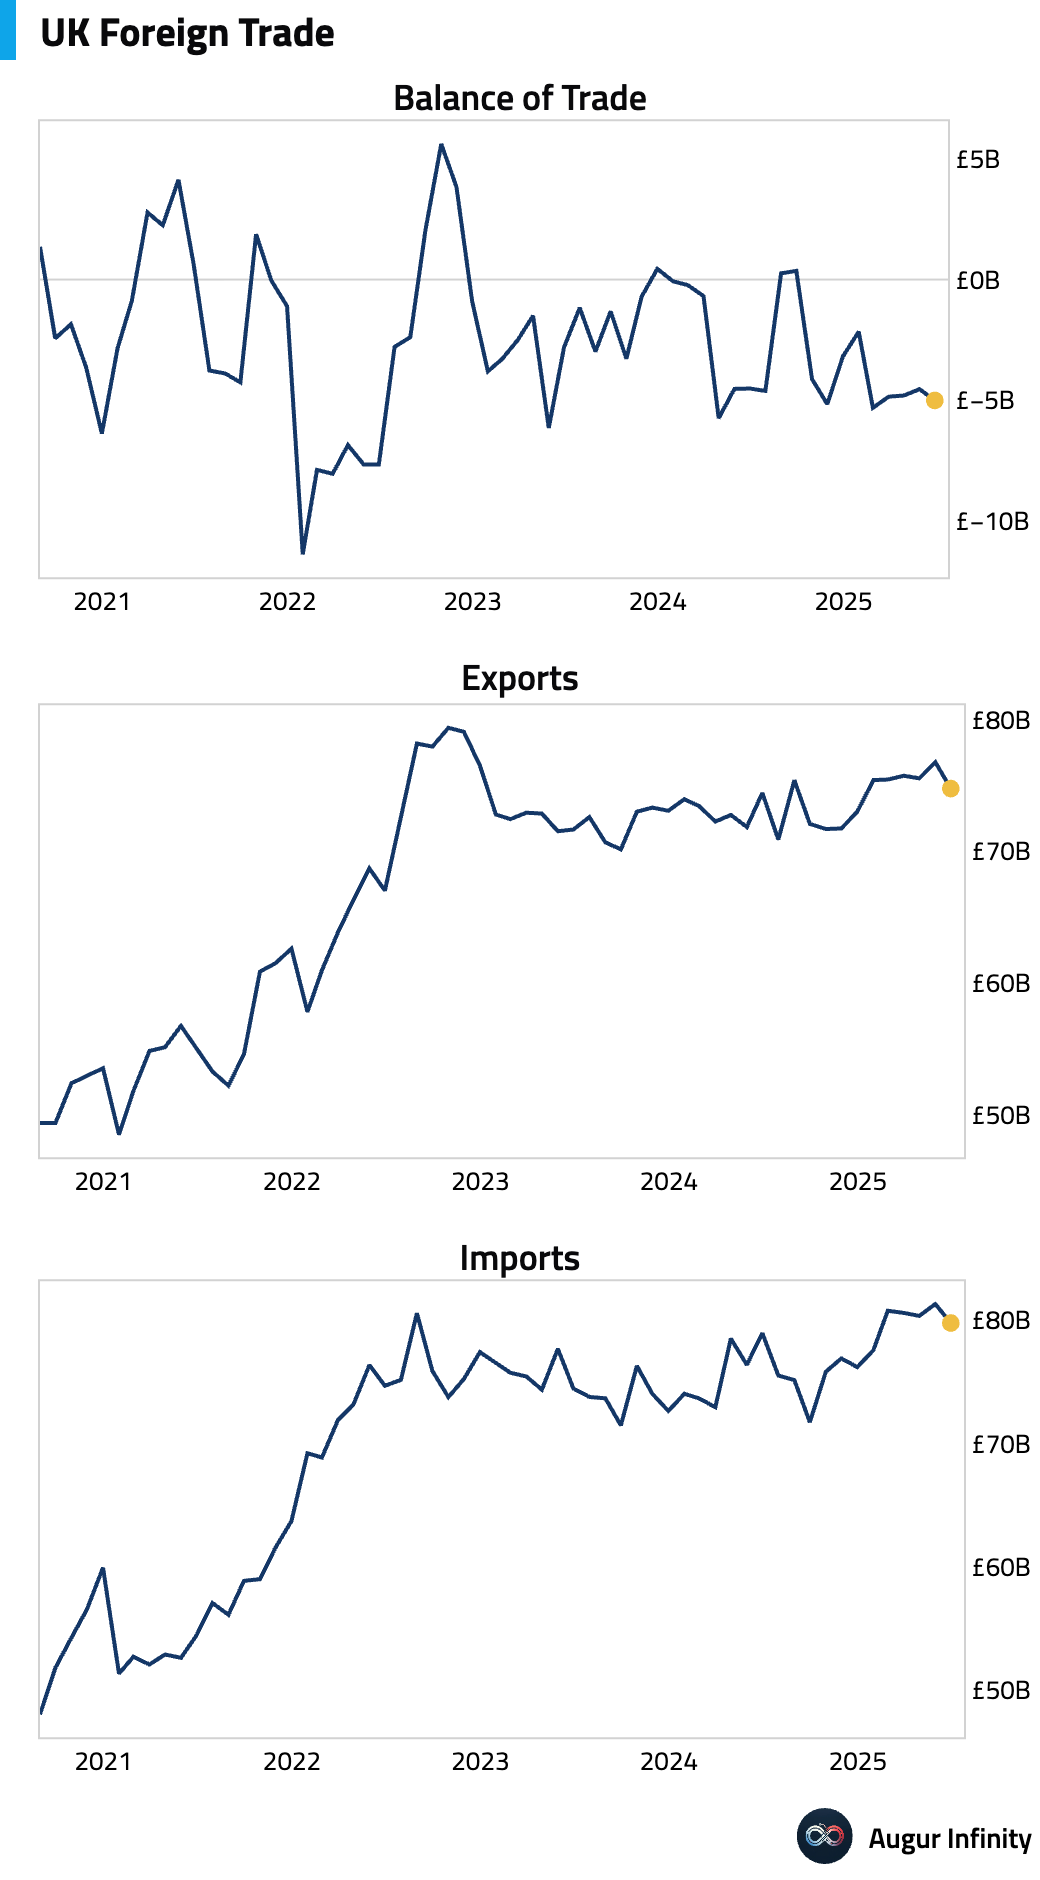
- The UK's total trade deficit widened to £5.0 billion in June. The goods trade deficit also expanded to £22.2 billion, with the deficit with non-EU countries widening to £10.8 billion, its largest since June 2022.
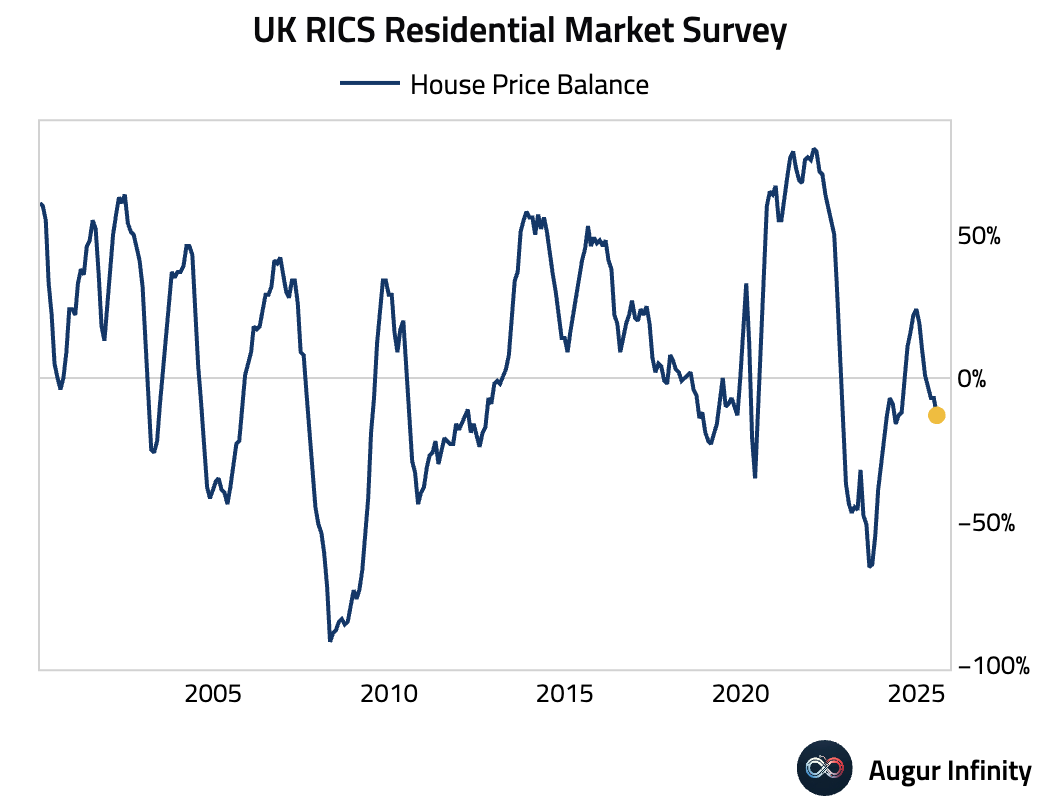
- The UK's RICS House Price Balance fell to -13.0% in July, a steeper decline than the -7.0% seen in June and well below the -5.0% consensus. This marks the lowest reading in over a year.
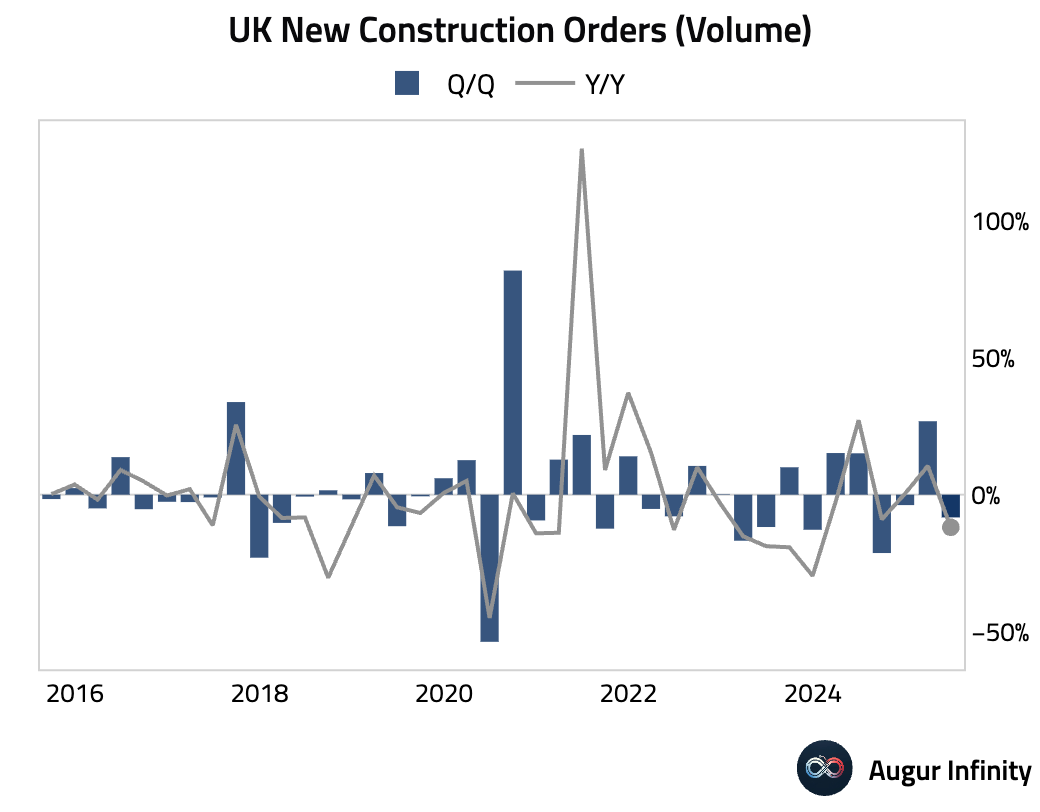
- UK new construction orders fell 11.9% Y/Y in Q2, a sharp reversal from the 10.5% growth in Q1.
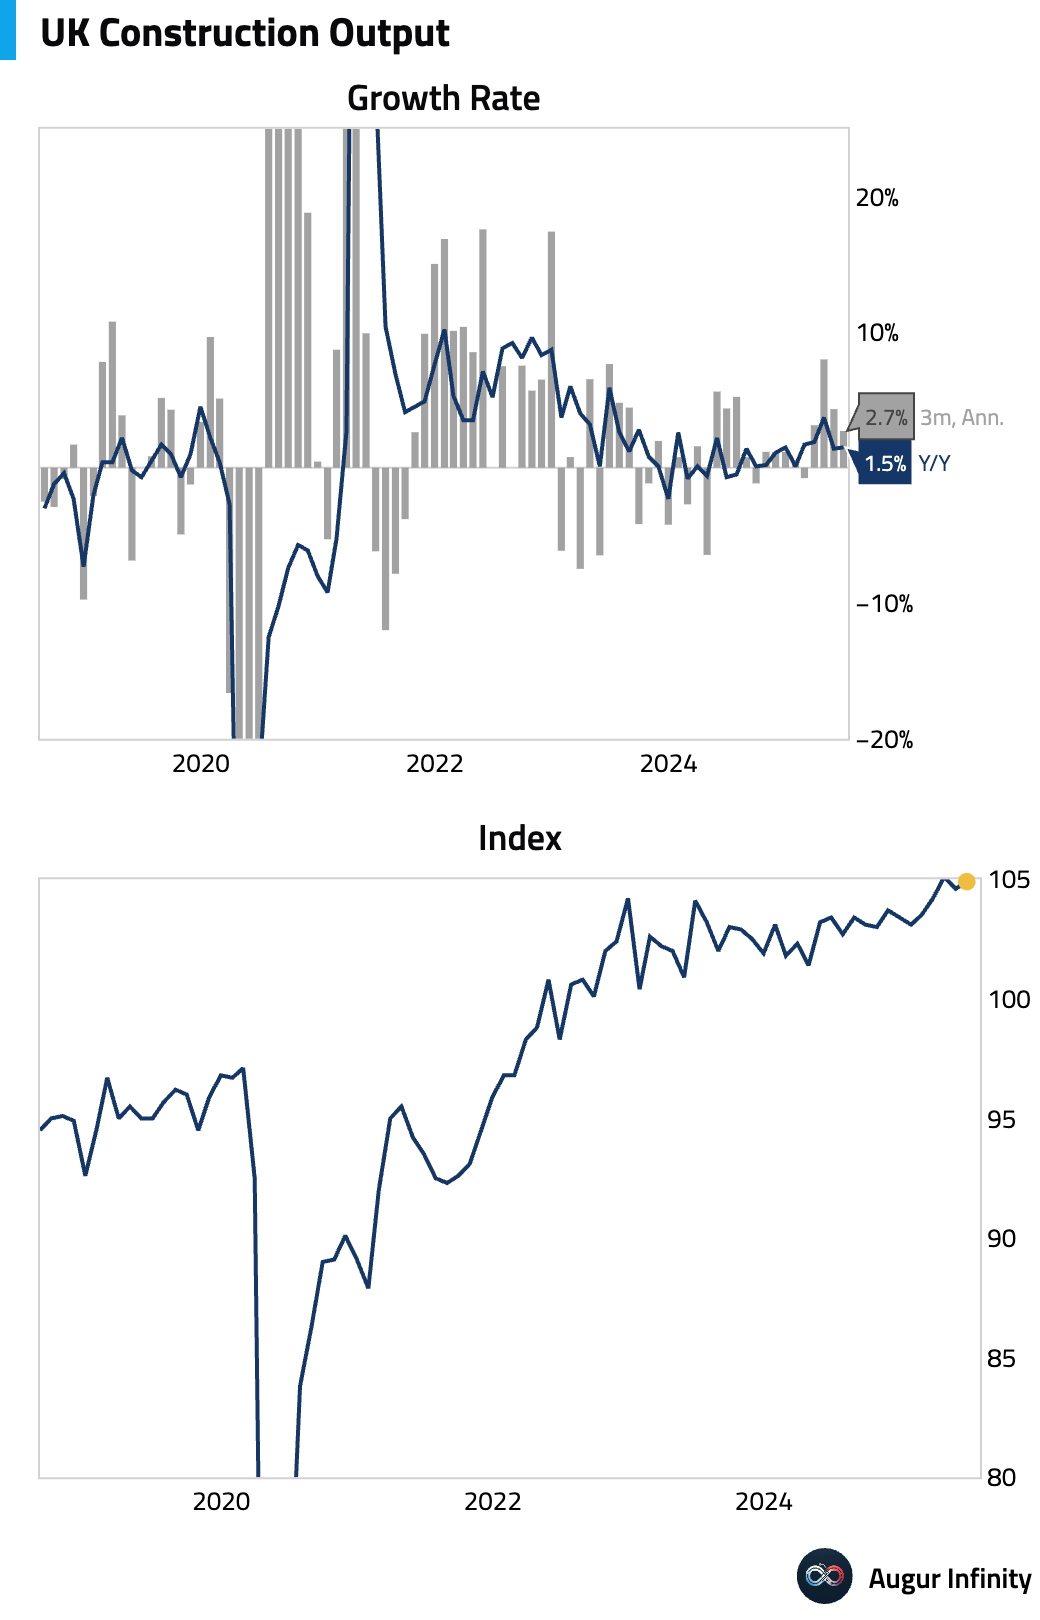
- UK construction output rose 1.5% Y/Y in June, slightly ahead of the 1.3% consensus.
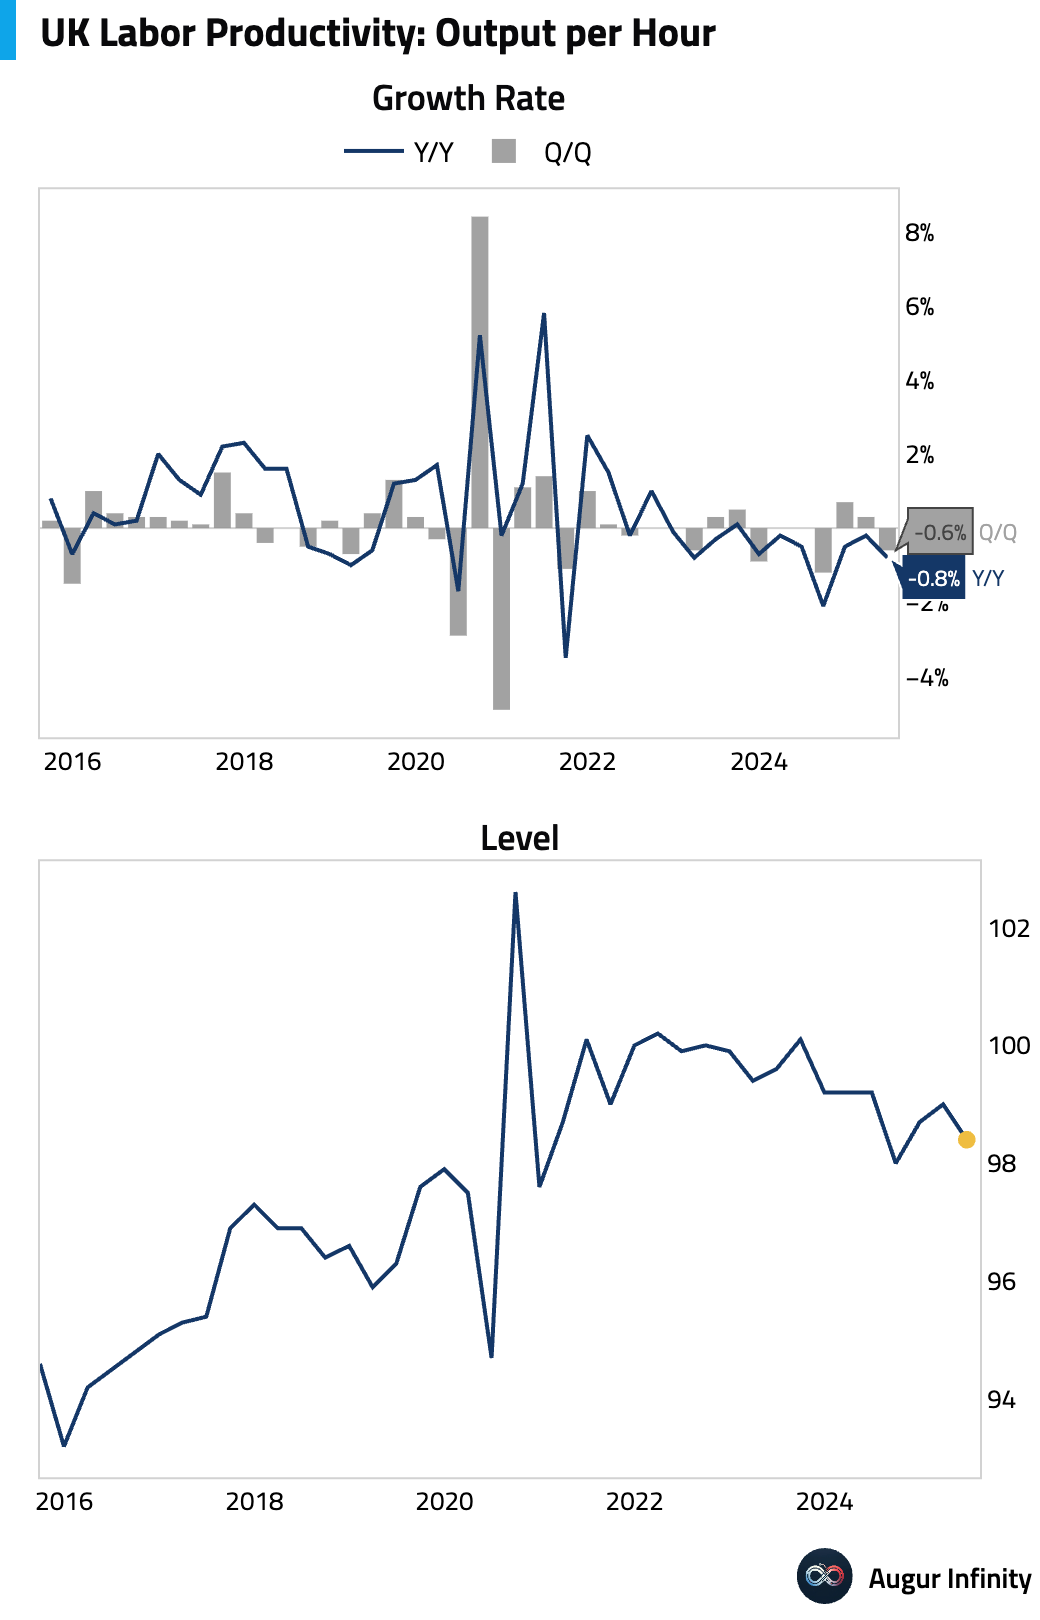
- UK labor productivity declined 0.6% Q/Q in the second quarter, following a 0.3% increase in Q1.
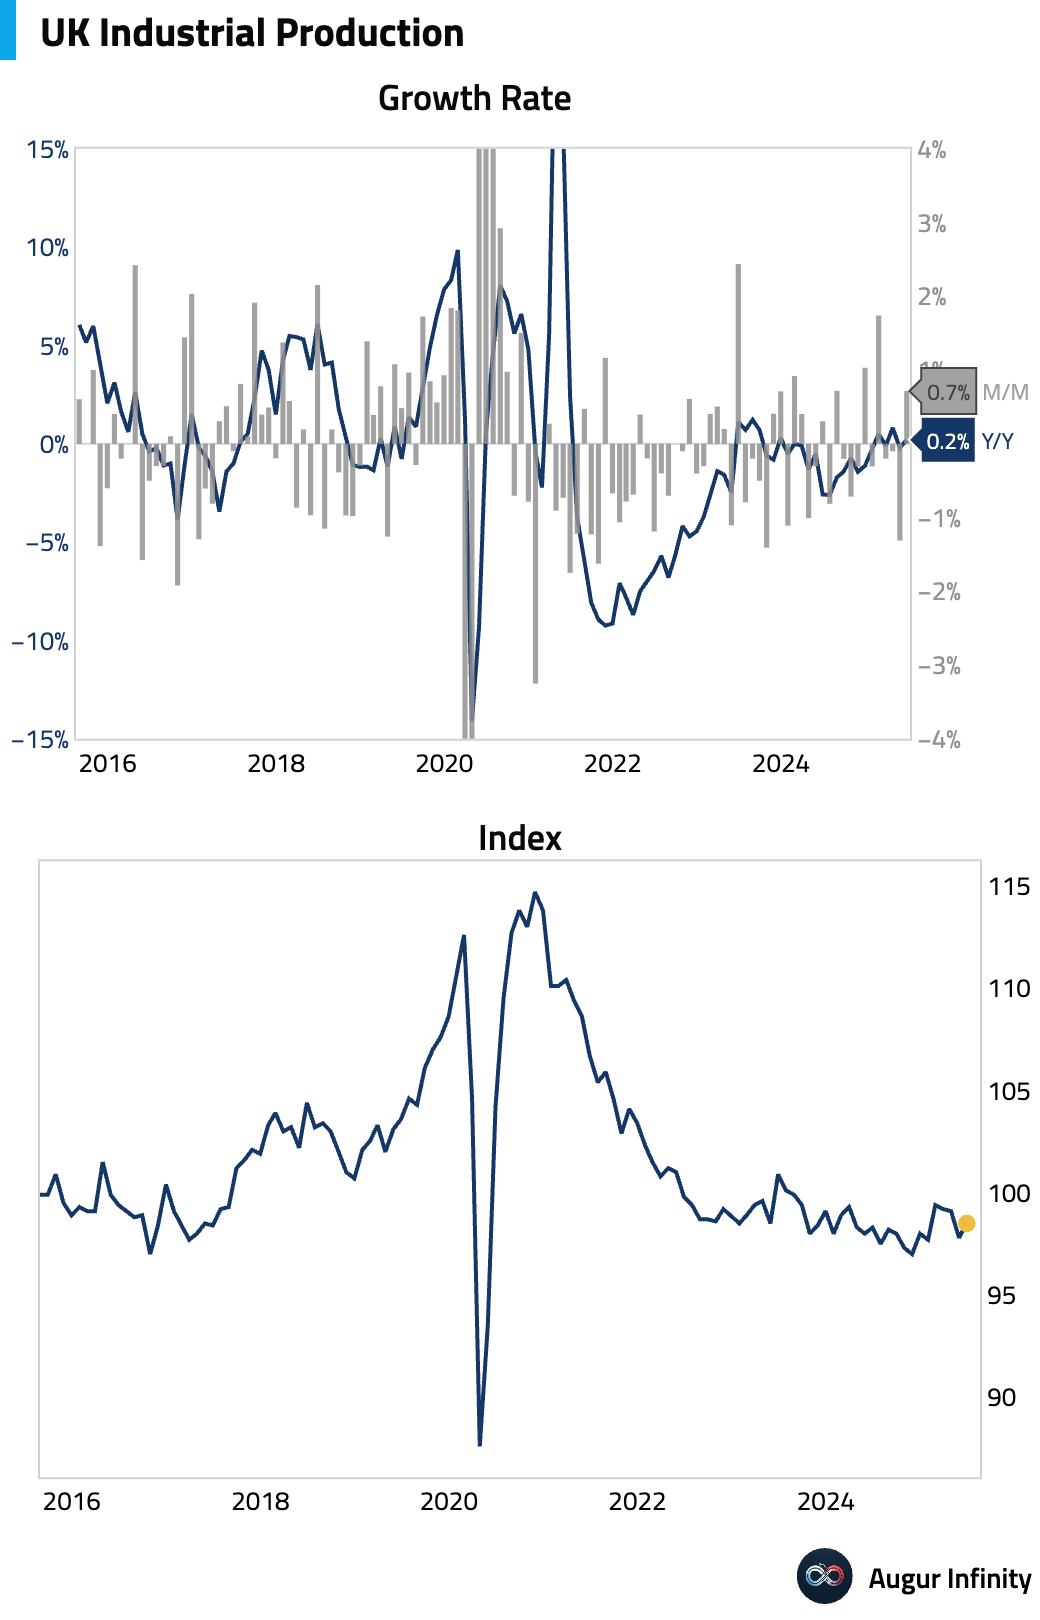
- UK industrial production rebounded by 0.7% M/M in June, beating the +0.2% forecast, while manufacturing production rose 0.5% M/M, meeting expectations. On a yearly basis, industrial output grew 0.2% and manufacturing was flat, both surprising to the upside.
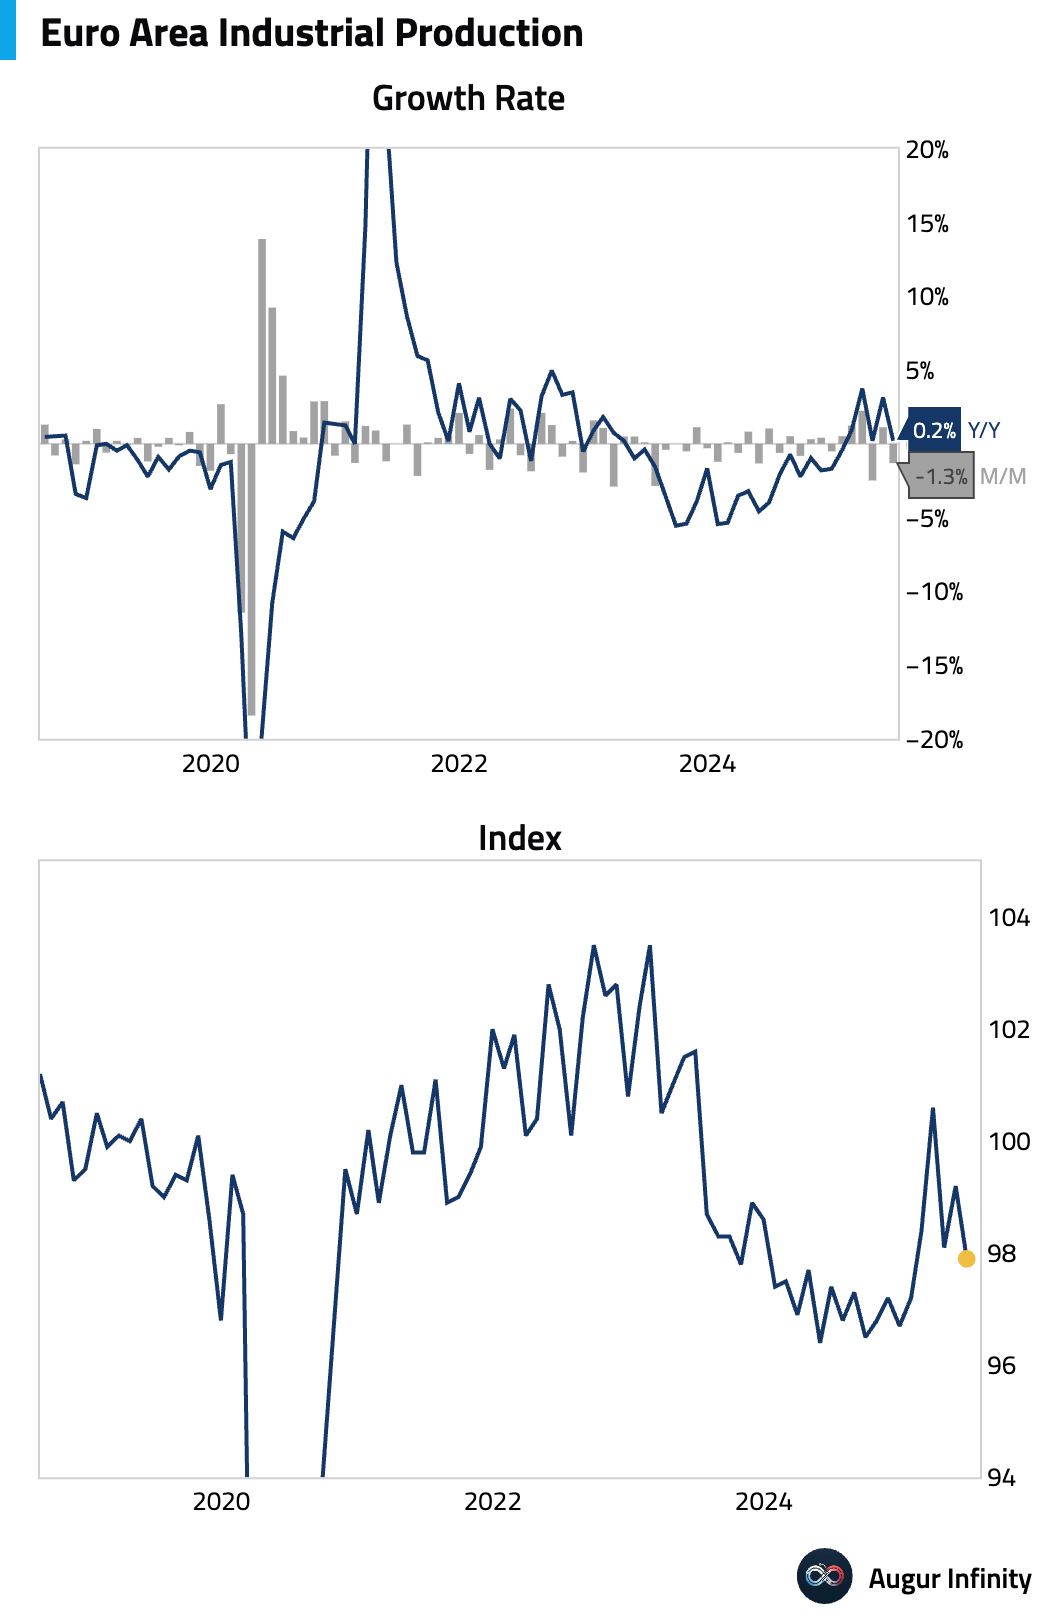
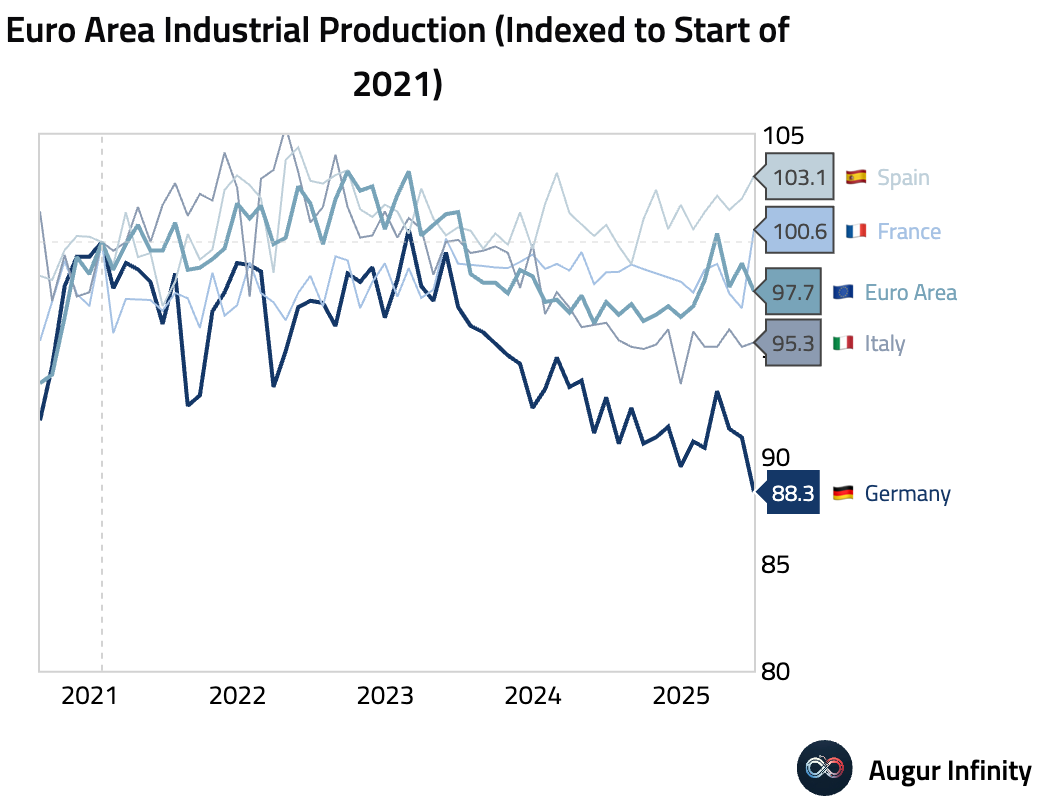
- Eurozone industrial production fell 1.3% M/M in June, a larger drop than the -1.0% consensus, reversing May's 1.1% gain. Year-over-year, production growth slowed sharply to 0.2% from 3.1%, significantly missing the 1.7% forecast.
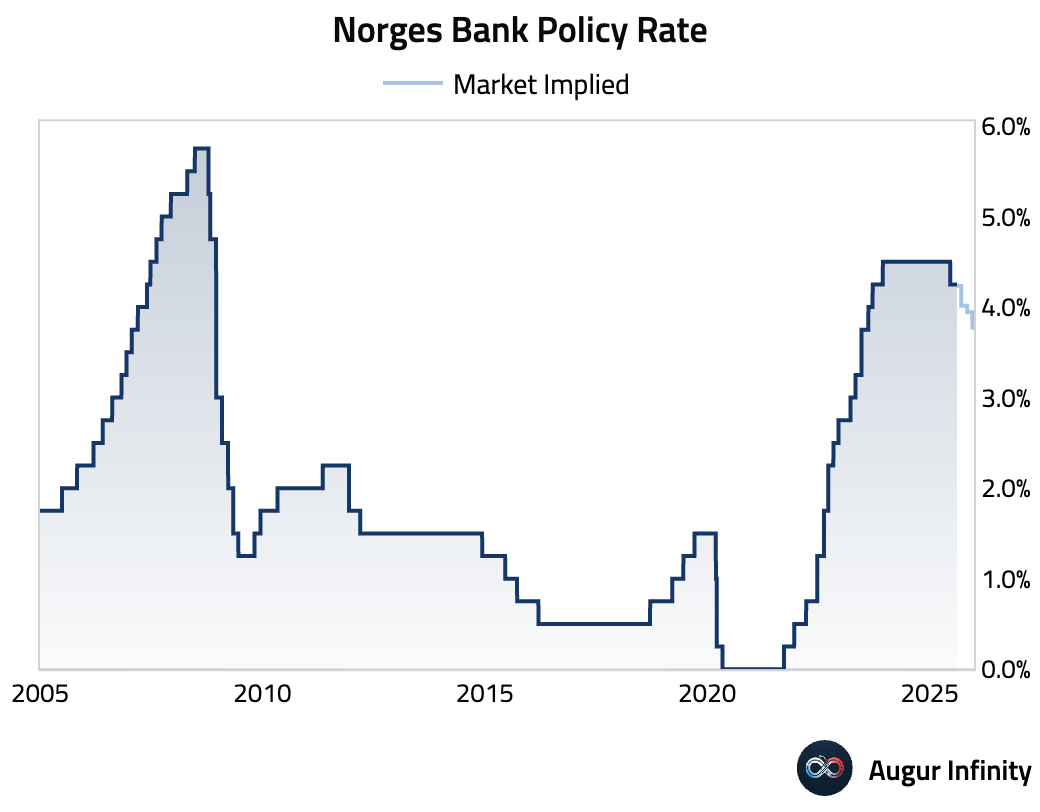
- Norges Bank kept its key policy rate unchanged at 4.25%, in line with expectations. The committee signaled a “cautious normalization” path, leaving the door open for potential rate cuts later this year. While the economic outlook is largely unchanged, a weaker krone provides a hawkish counterpoint.
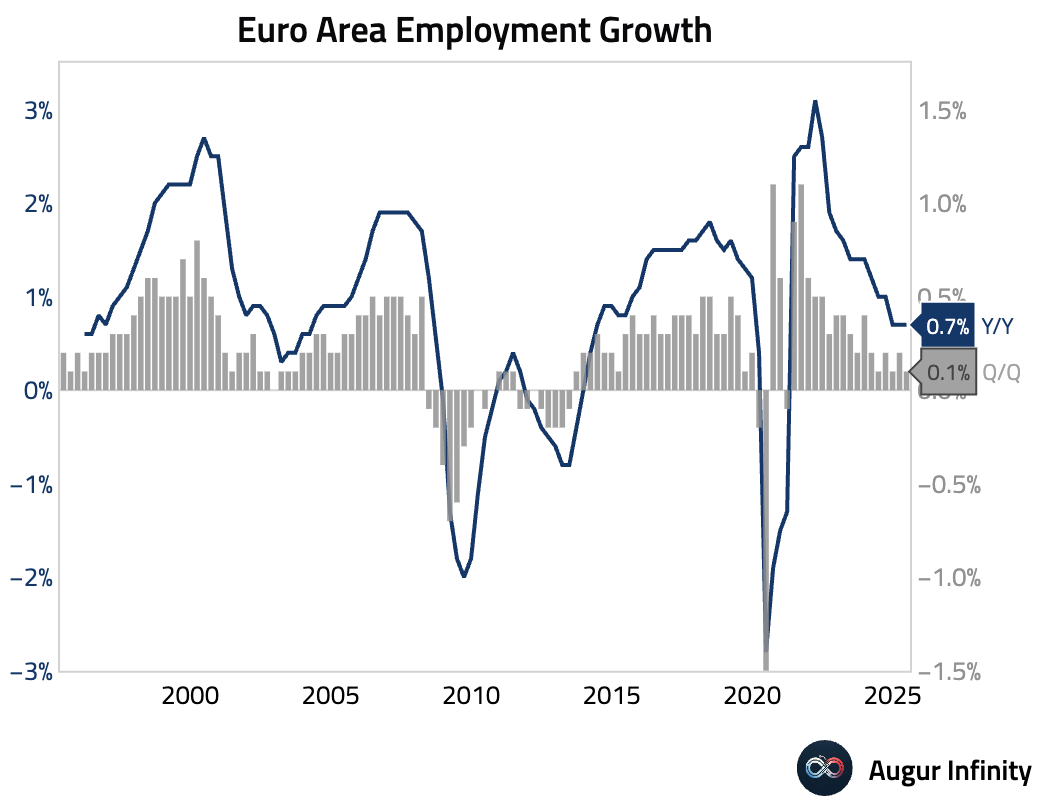
- Eurozone employment growth slowed in Q2, with the preliminary estimate showing a 0.1% Q/Q increase, down from 0.2% in Q1. The year-over-year growth rate was stable at 0.7%, slightly above the 0.6% consensus.
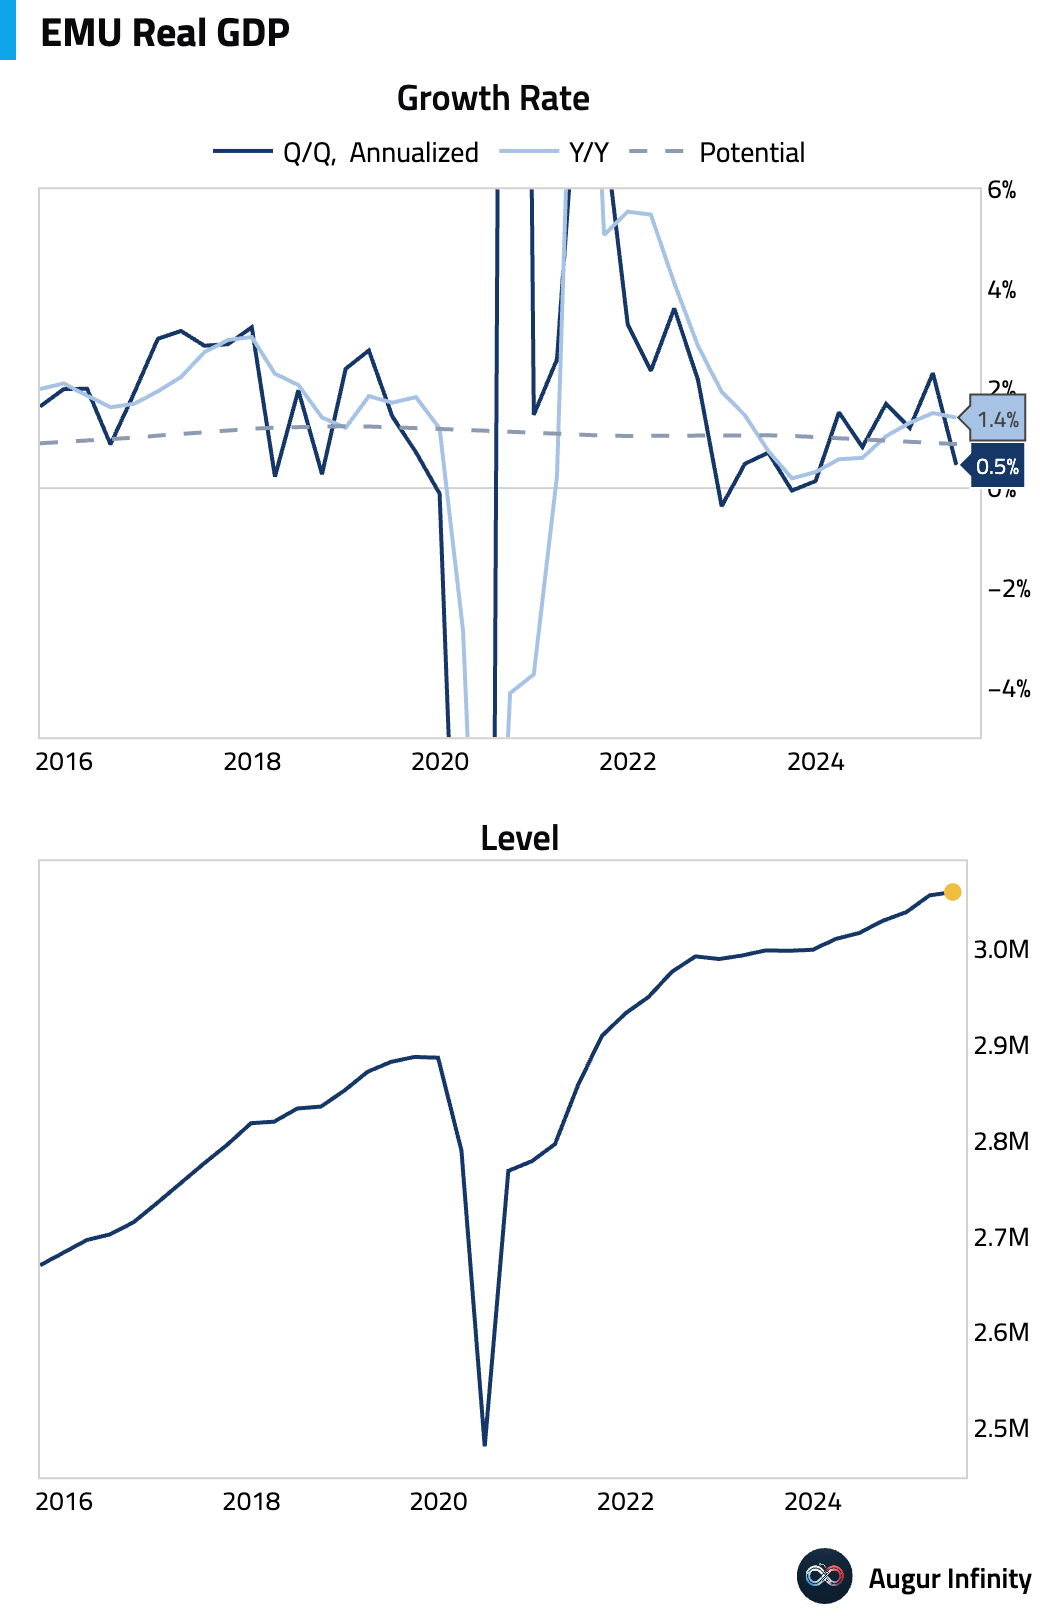
- The second estimate for Eurozone Q2 GDP confirmed growth of 0.1% Q/Q and 1.4% Y/Y, both in line with the initial readings and consensus expectations.
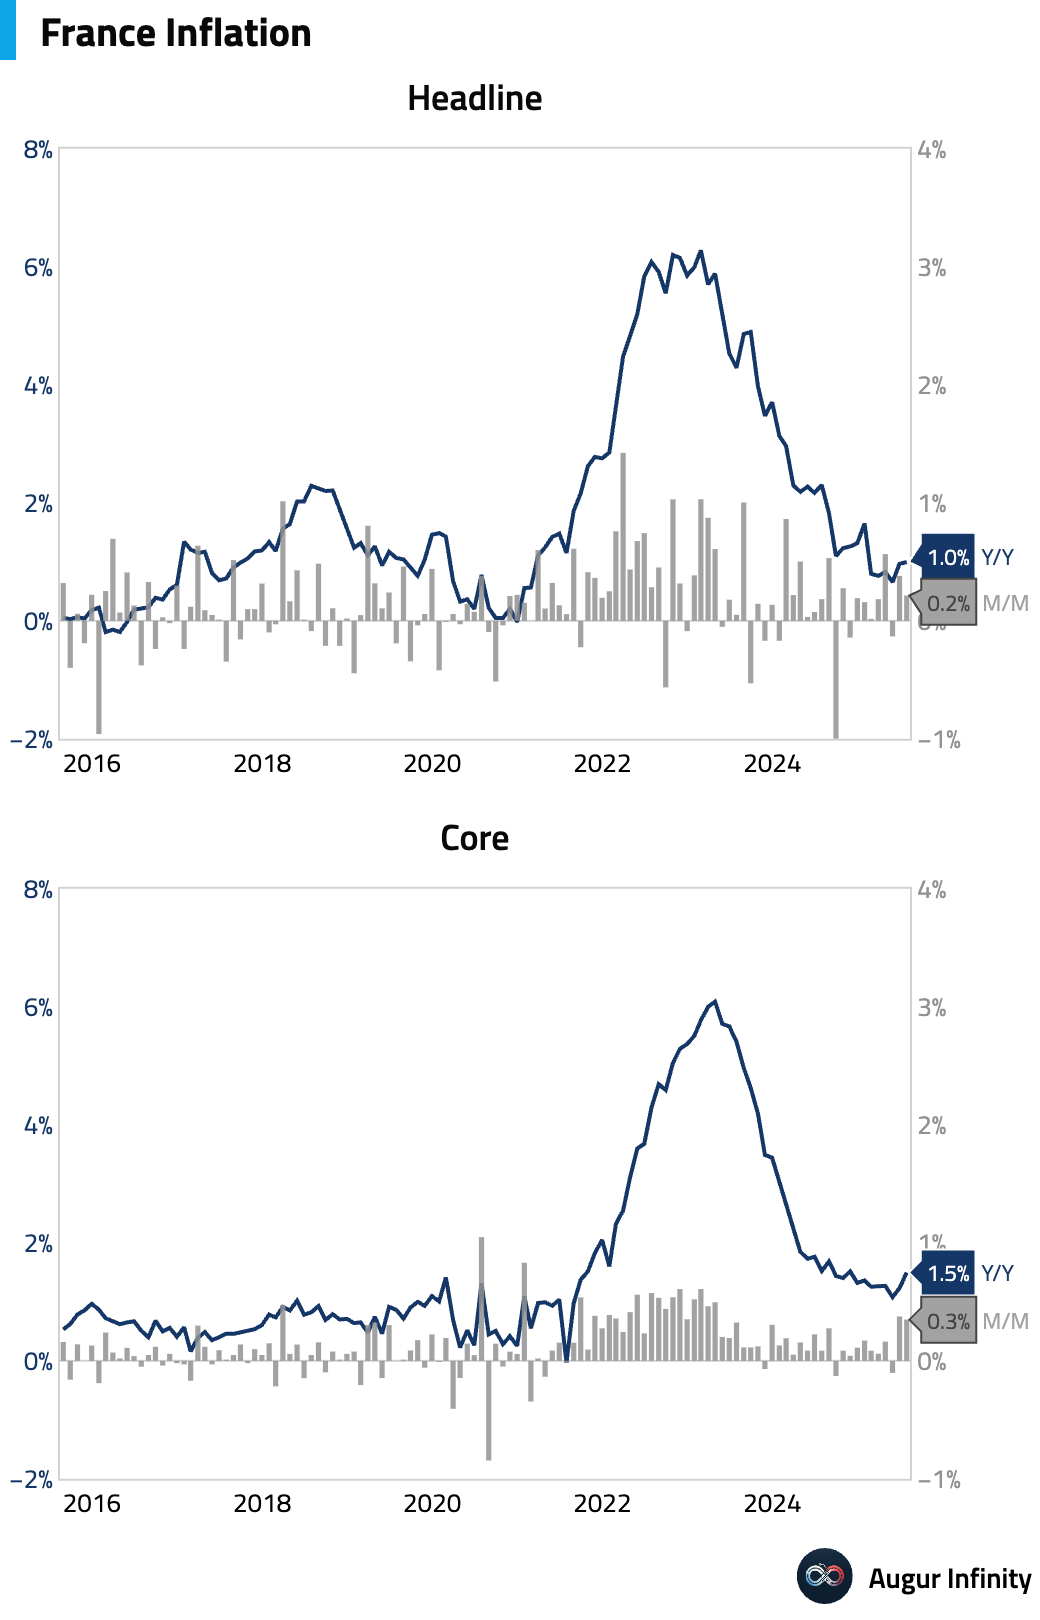
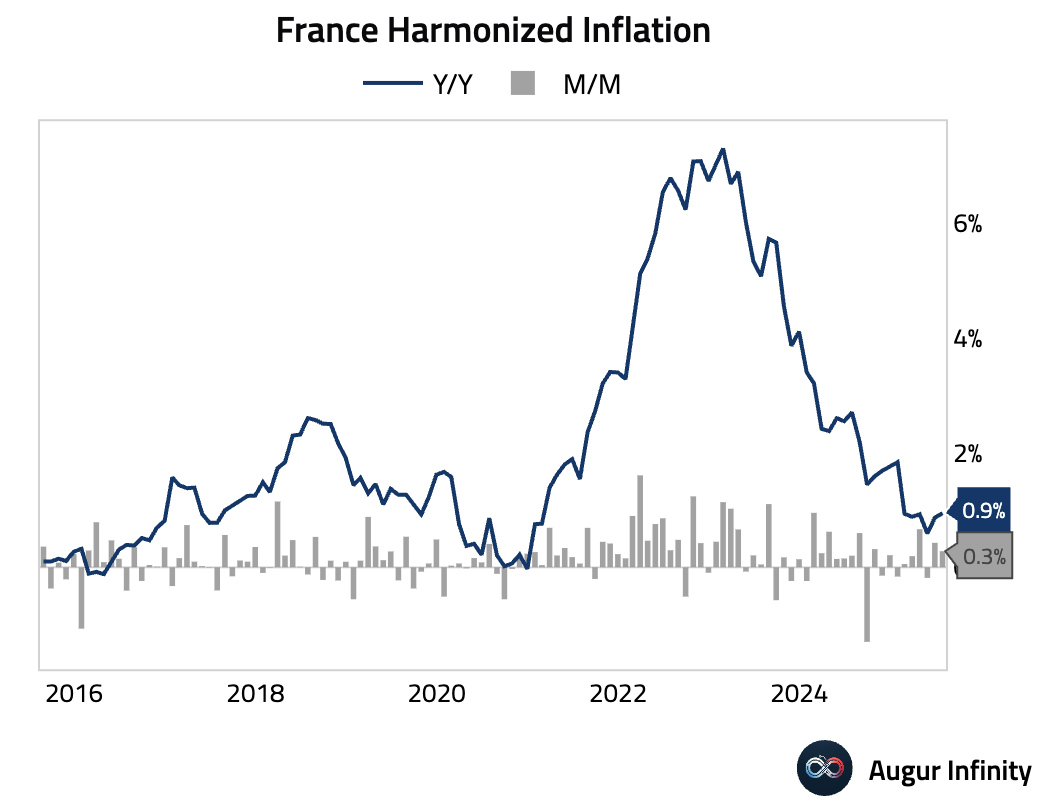
- Final French inflation for July was confirmed at 1.0% Y/Y and 0.2% M/M. The harmonised (HICP) figures were also unchanged from preliminary estimates at 0.9% Y/Y and 0.3% M/M.
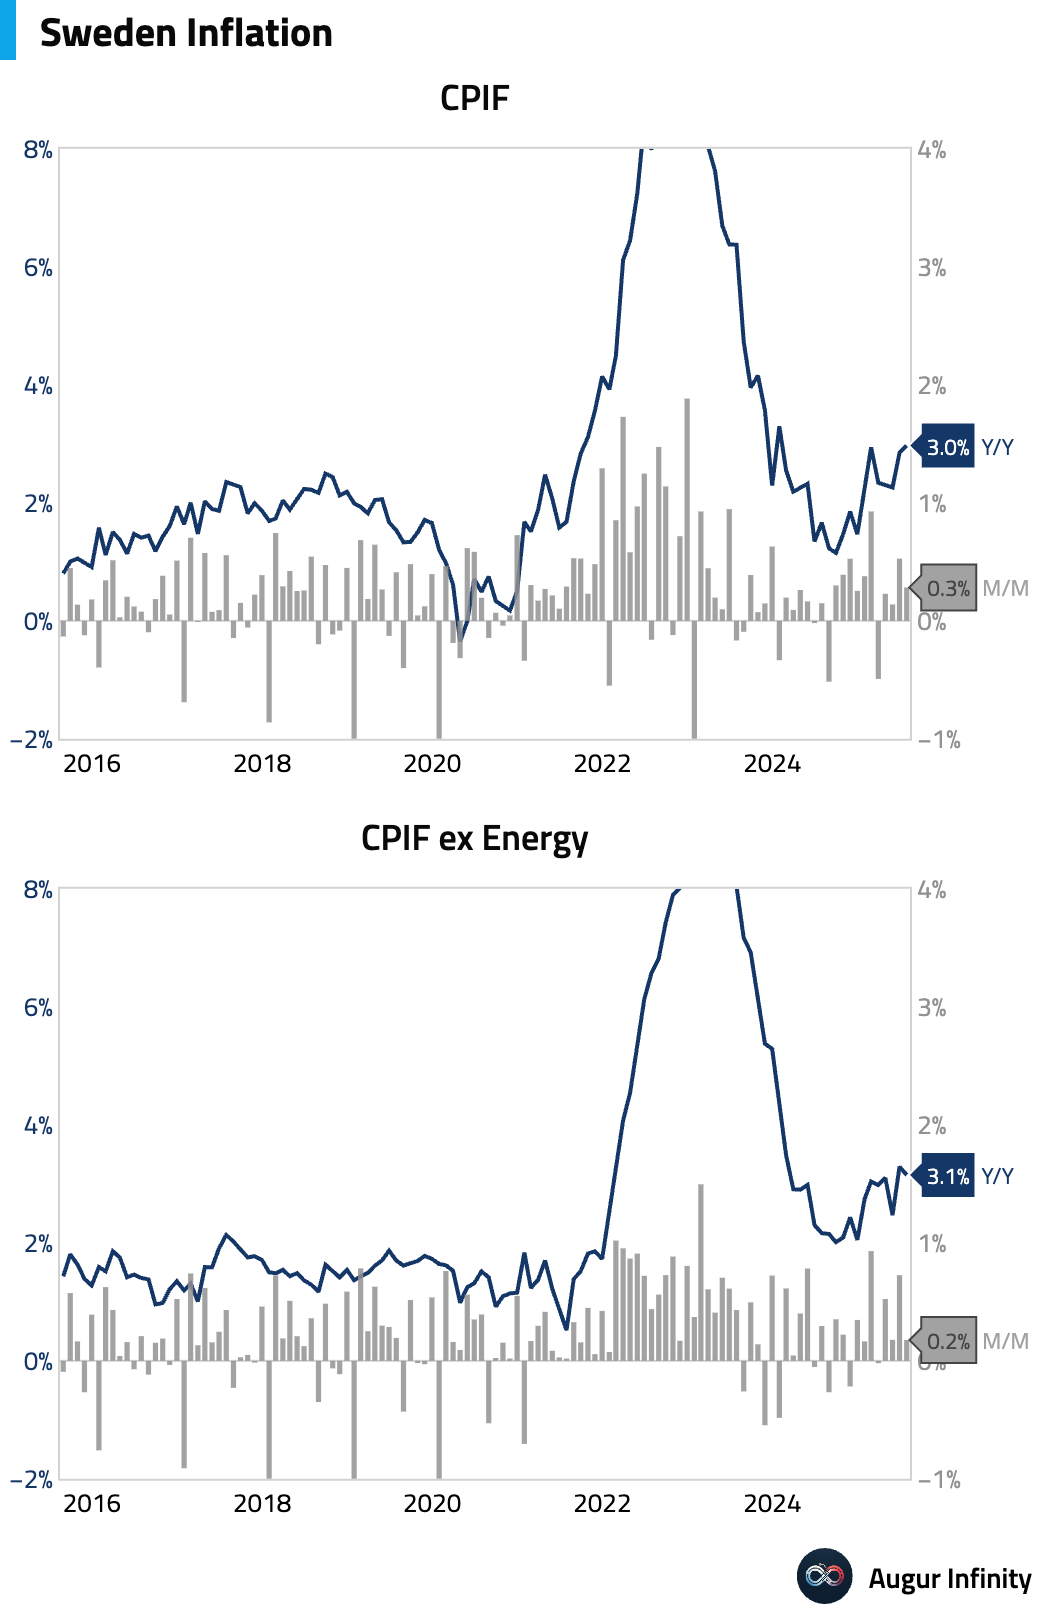
- Final Swedish inflation figures for July were in line with flash estimates. The CPIF rate (CPI at a fixed interest rate) was 3.0% Y/Y and 0.3% M/M. Headline CPI rose 0.8% Y/Y and 0.2% M/M.
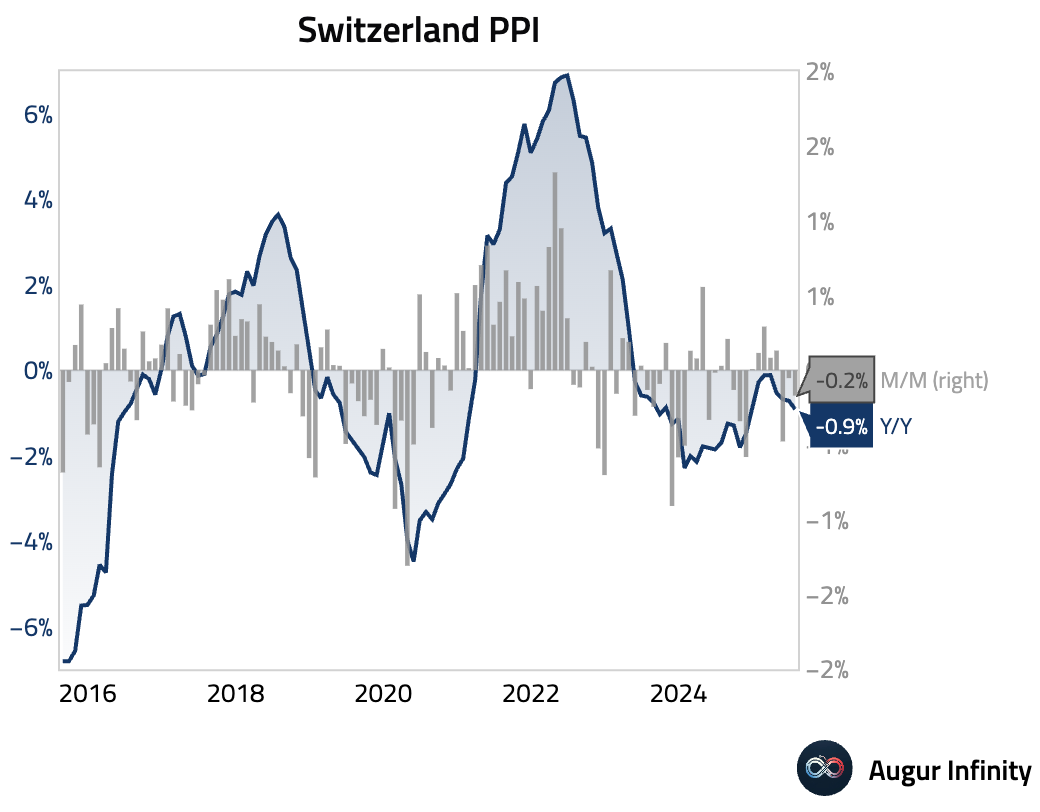
- Swiss producer and import prices fell 0.2% M/M in July, slightly more than the expected 0.0% change. The year-over-year deflation deepened to -0.9% from -0.7%.
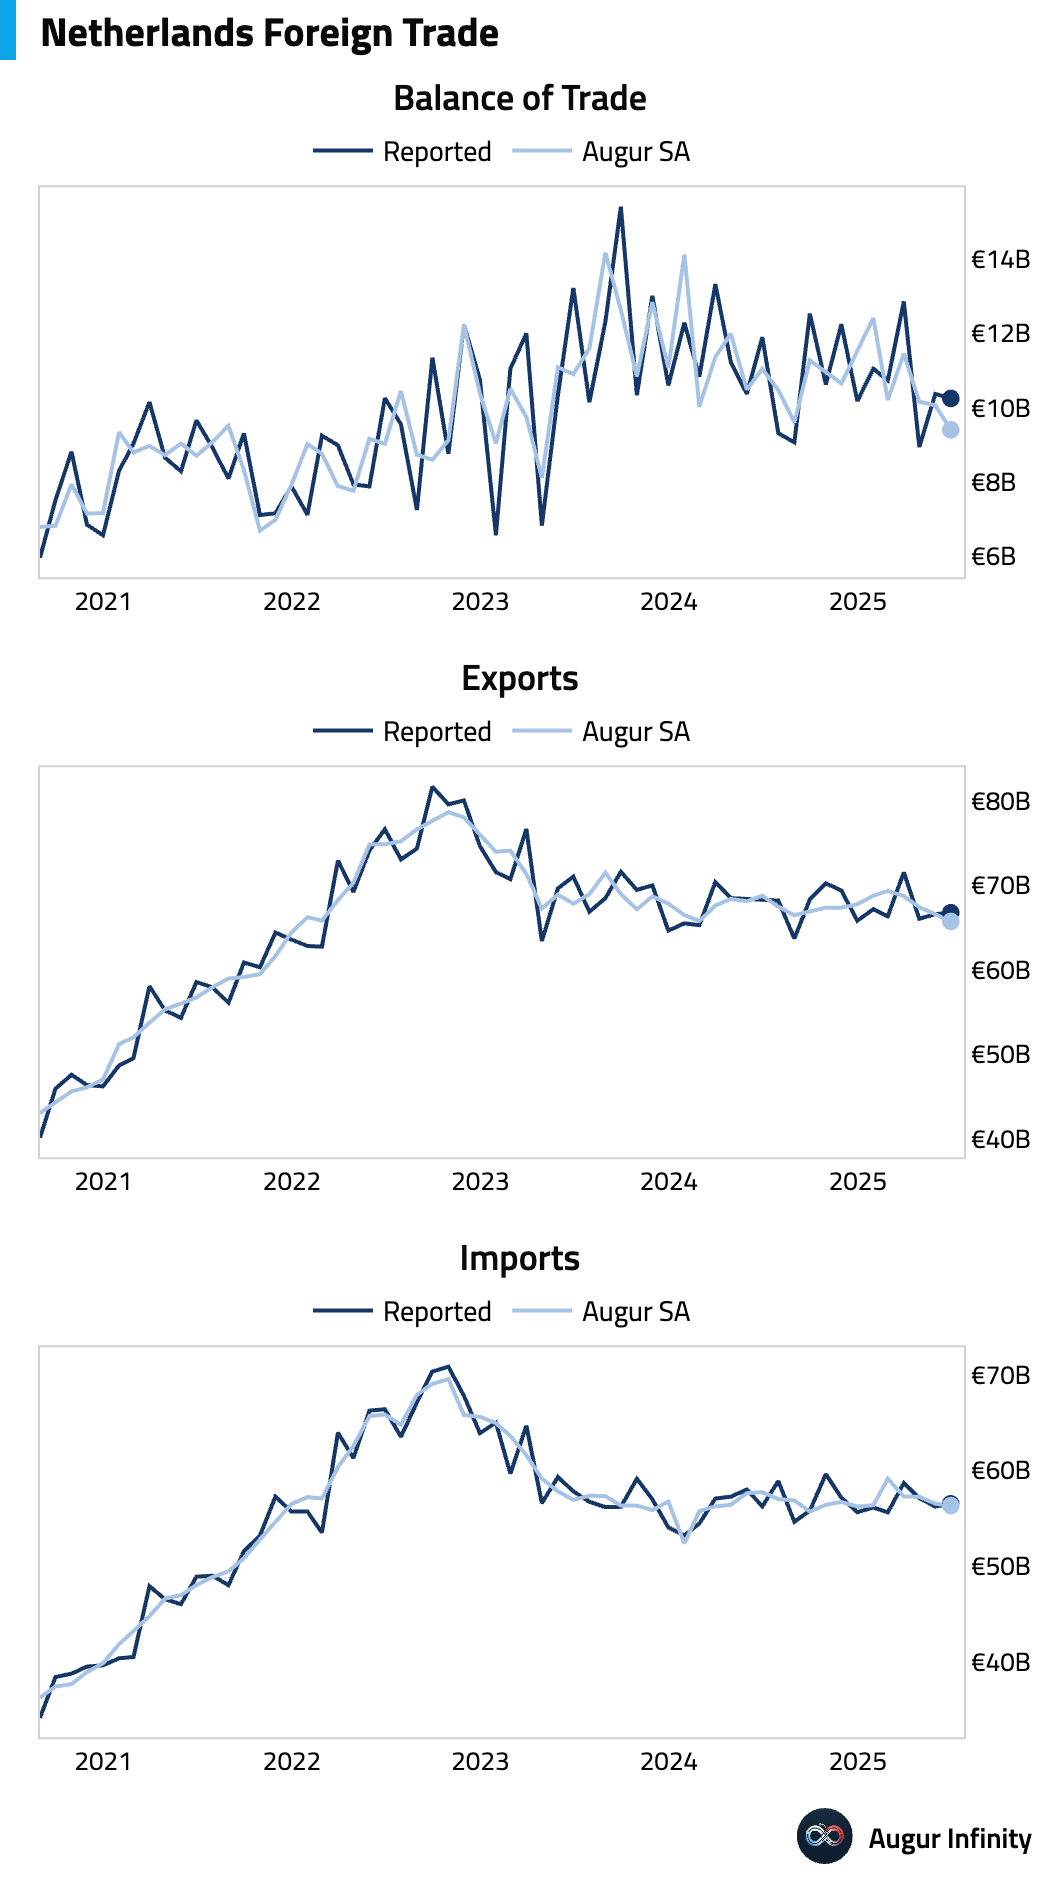
- The Netherlands’ trade surplus narrowed to €10.25 billion in June from €10.37 billion in May.
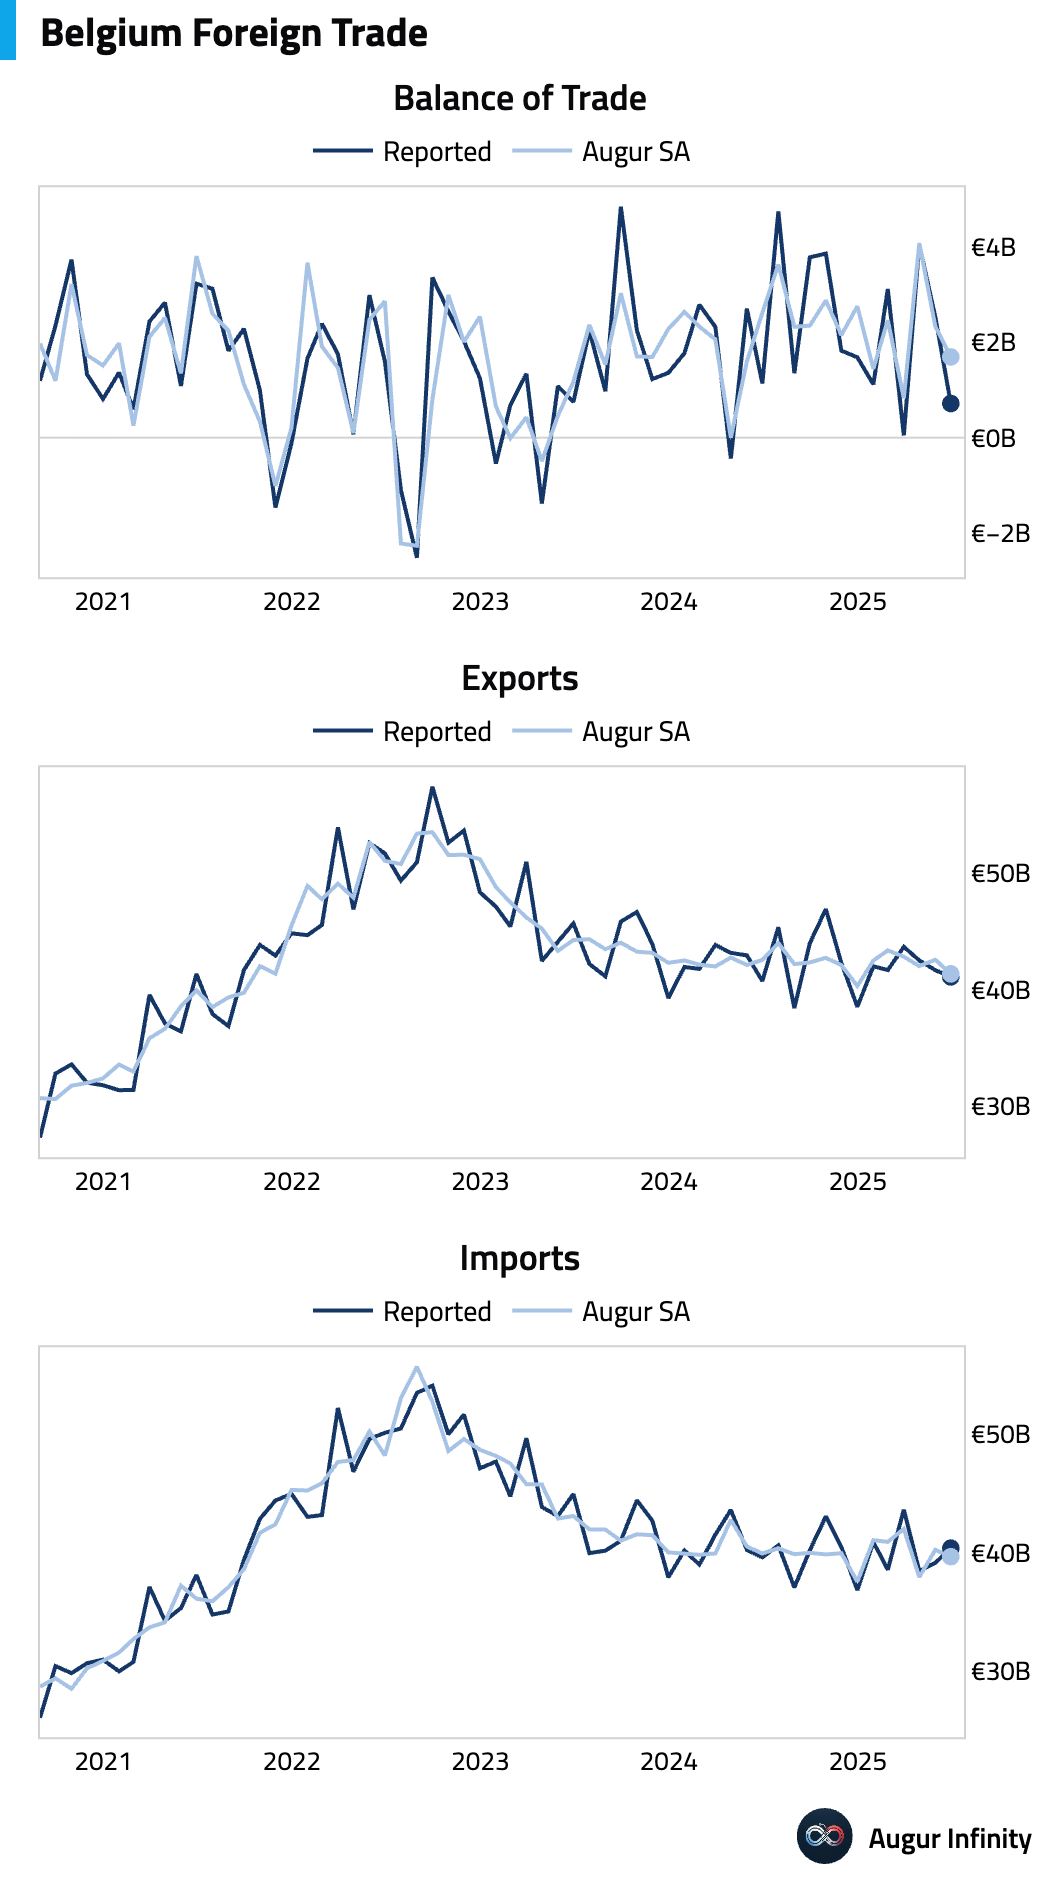
- Belgium's trade surplus shrank significantly to €716.6 million in June from €2.5 billion in May.
Asia-Pacific
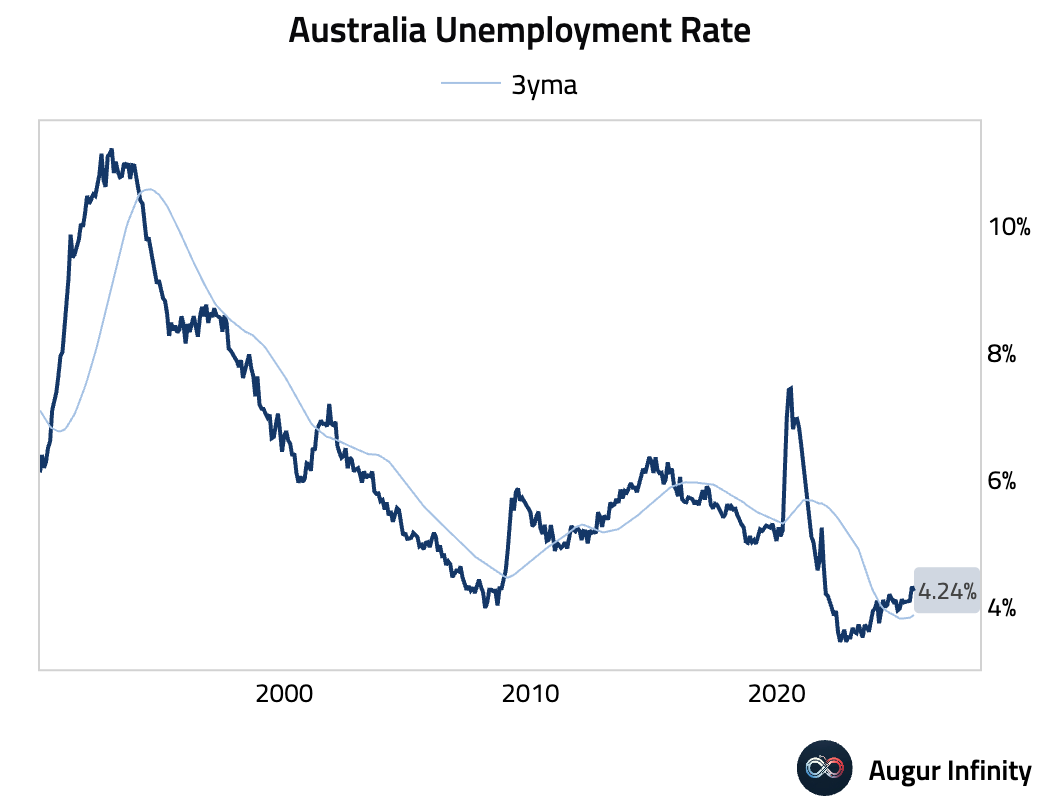
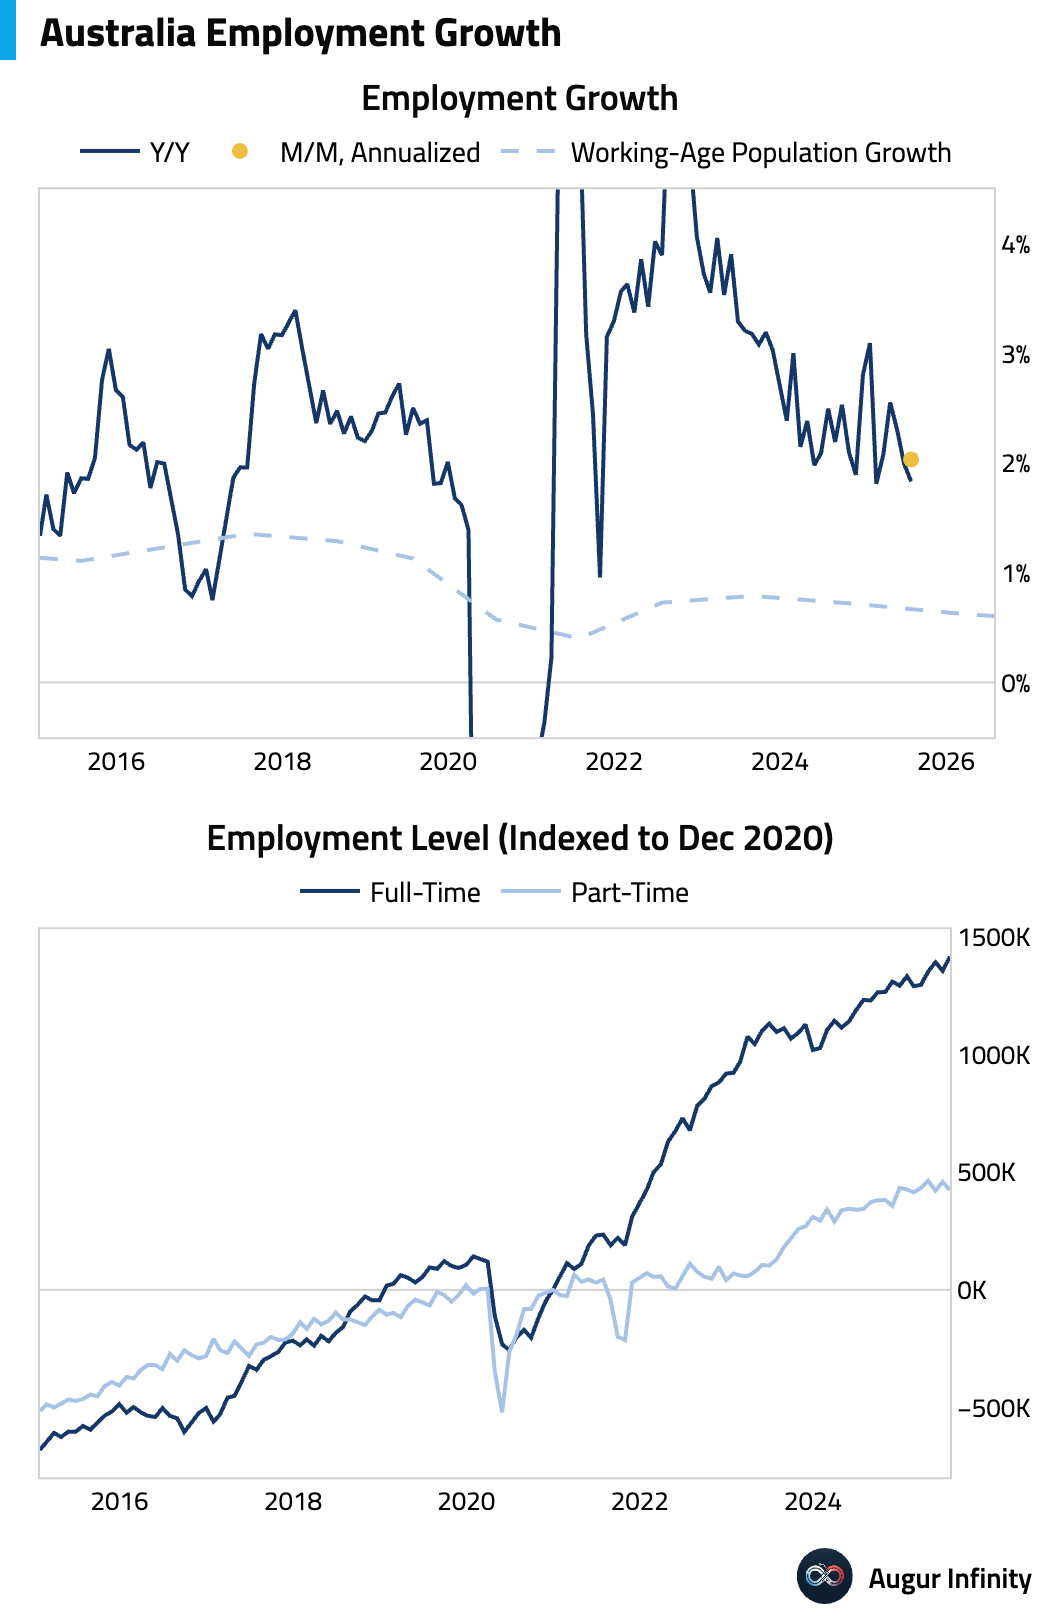
- Australia's labor market showed continued strength in July as the unemployment rate fell to 4.2% from 4.3%, in line with consensus. Employment rose by 24,500, but a key detail was a strong shift in job quality: full-time roles surged by 60,500, masking a sharp drop of 35,900 in part-time jobs. The participation rate held steady at 67.0%.
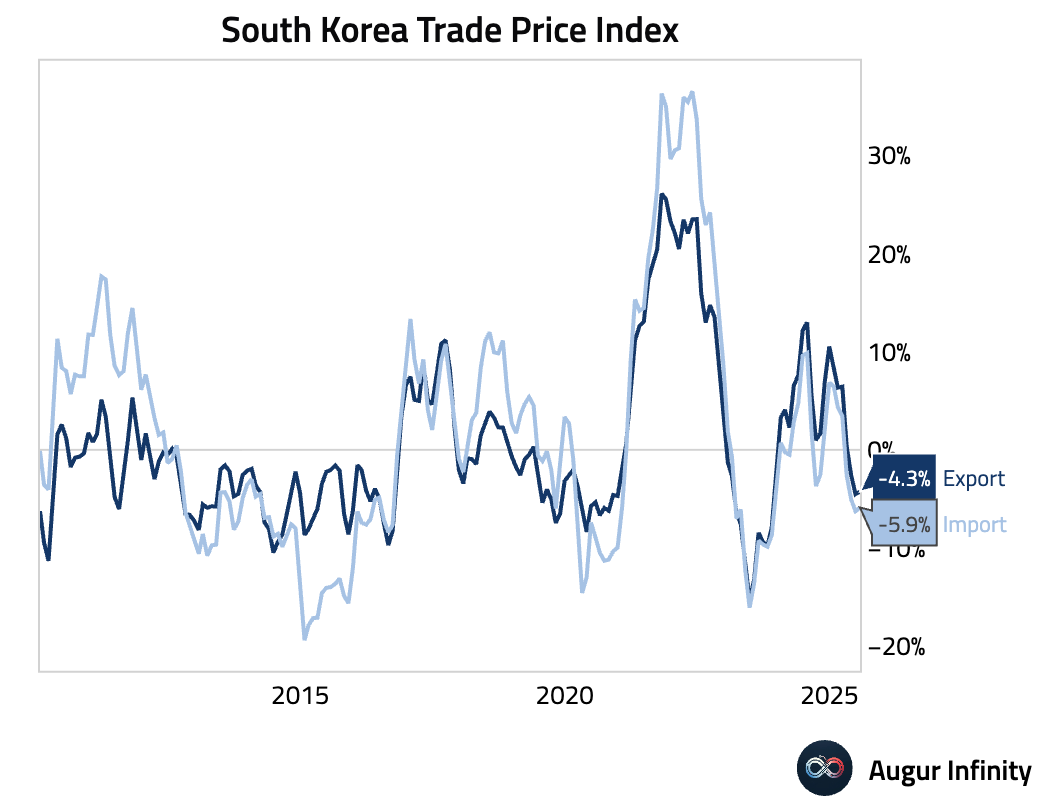
- South Korea's trade price deflation eased in July. Export prices fell 4.3% Y/Y, compared to -4.5% previously, while import prices fell 5.9% Y/Y, up from -6.2%.
Emerging Markets ex China
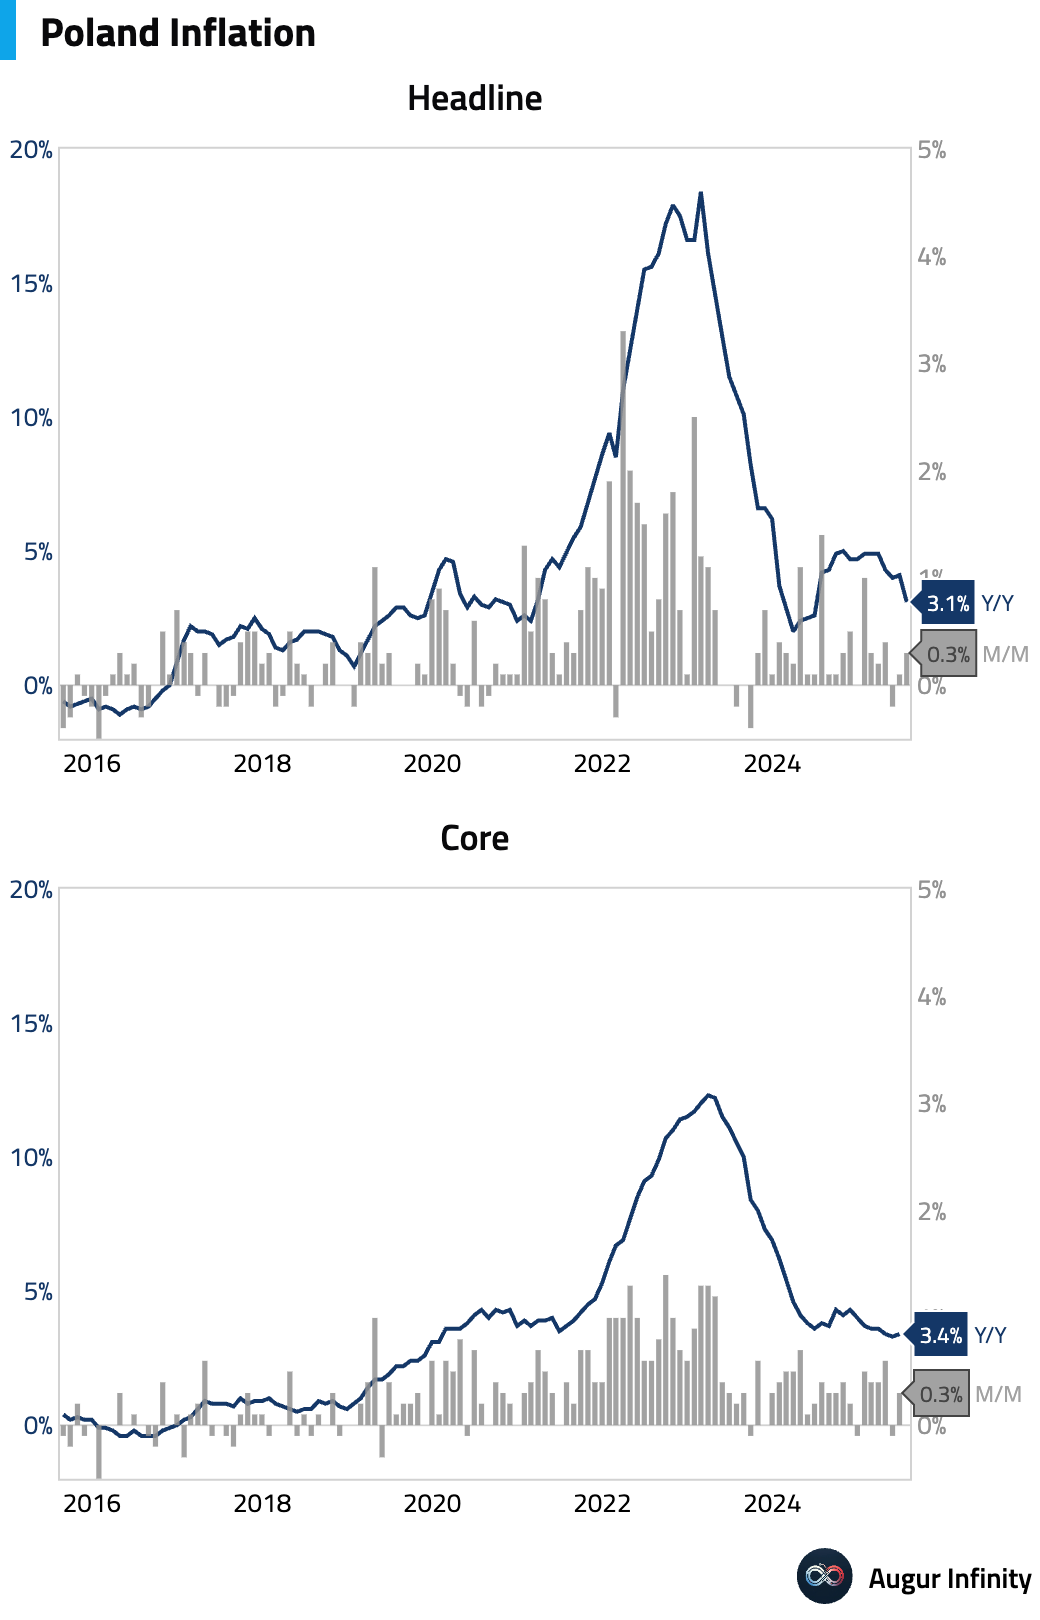
- Poland's final July CPI was confirmed at 3.1% Y/Y, down sharply from 4.1% in June, with the M/M rate at 0.3%. The decline was driven by a significant base effect from the 2024 energy cap removal and a cut in household gas prices. However, core inflation remained sticky, holding at 3.4% Y/Y.
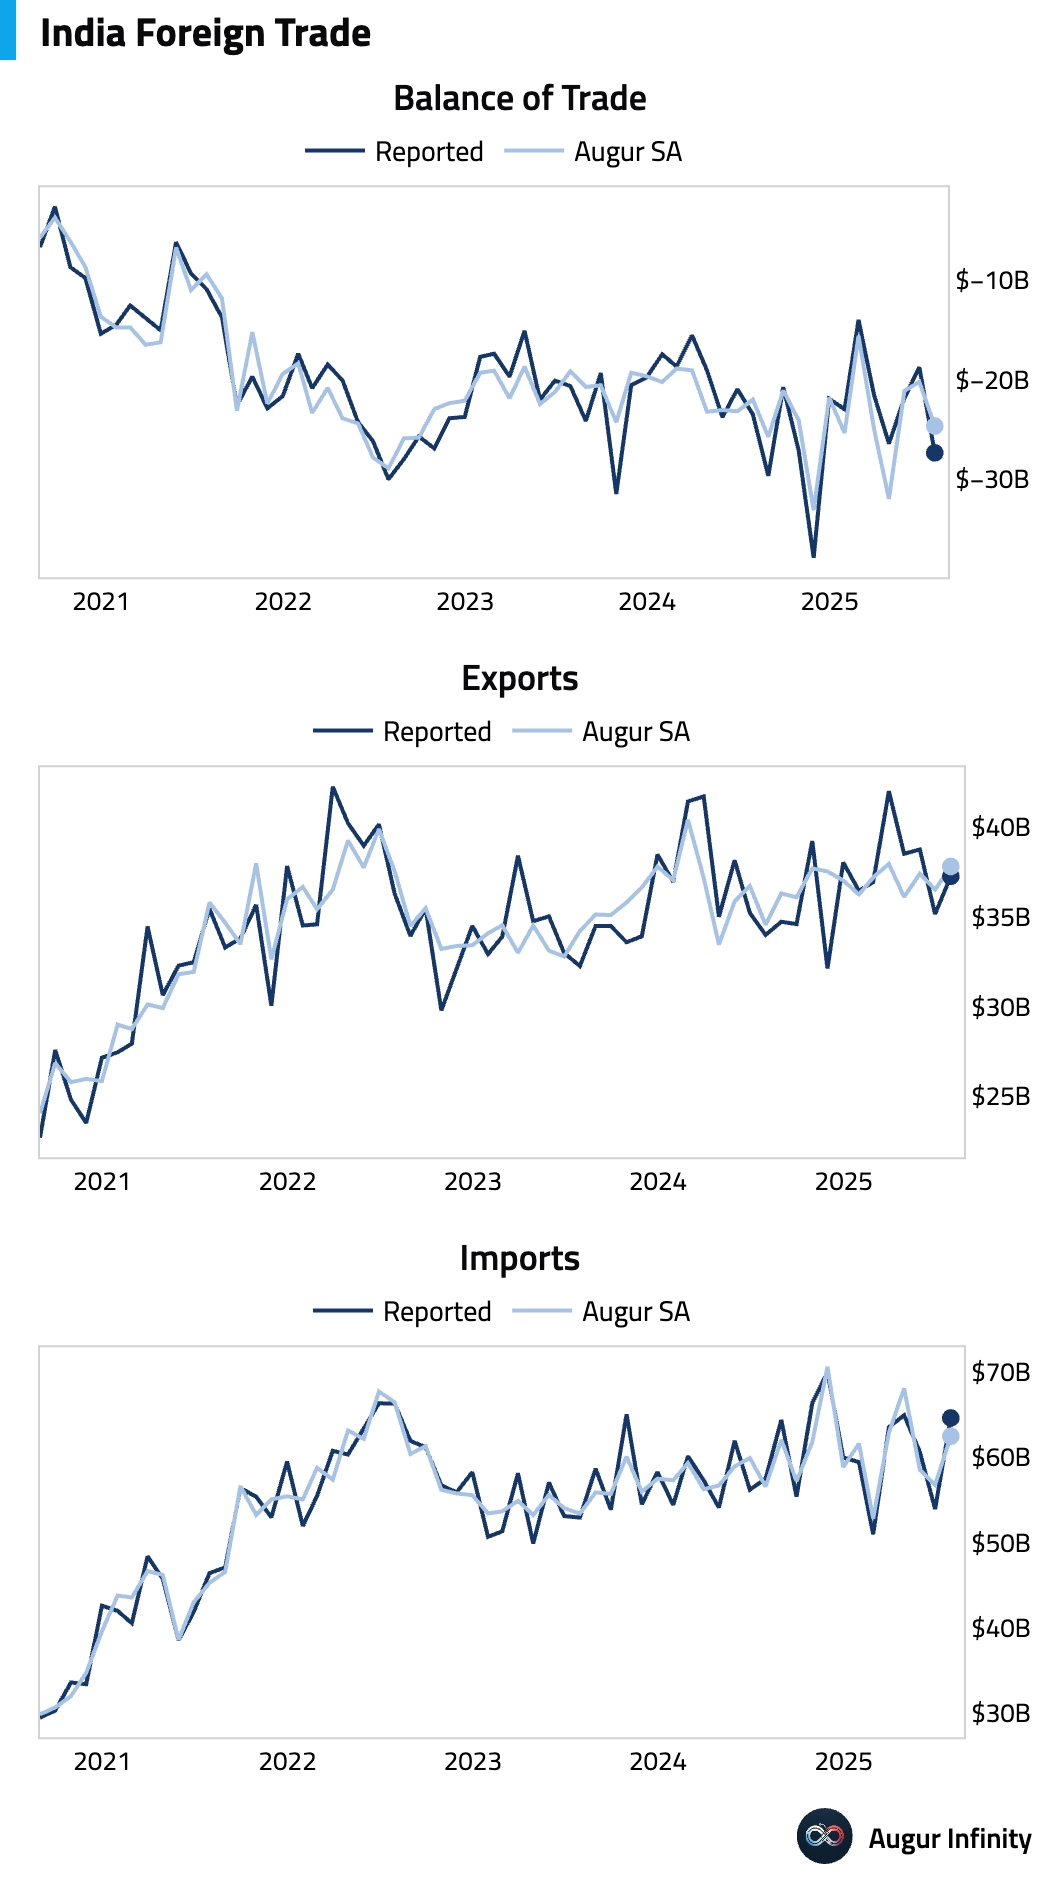
- India's trade deficit widened significantly to $27.35 billion in July from $18.78 billion in June, missing the consensus forecast of a $20.4 billion deficit. Exports rose to $37.24 billion while imports surged to $64.59 billion.
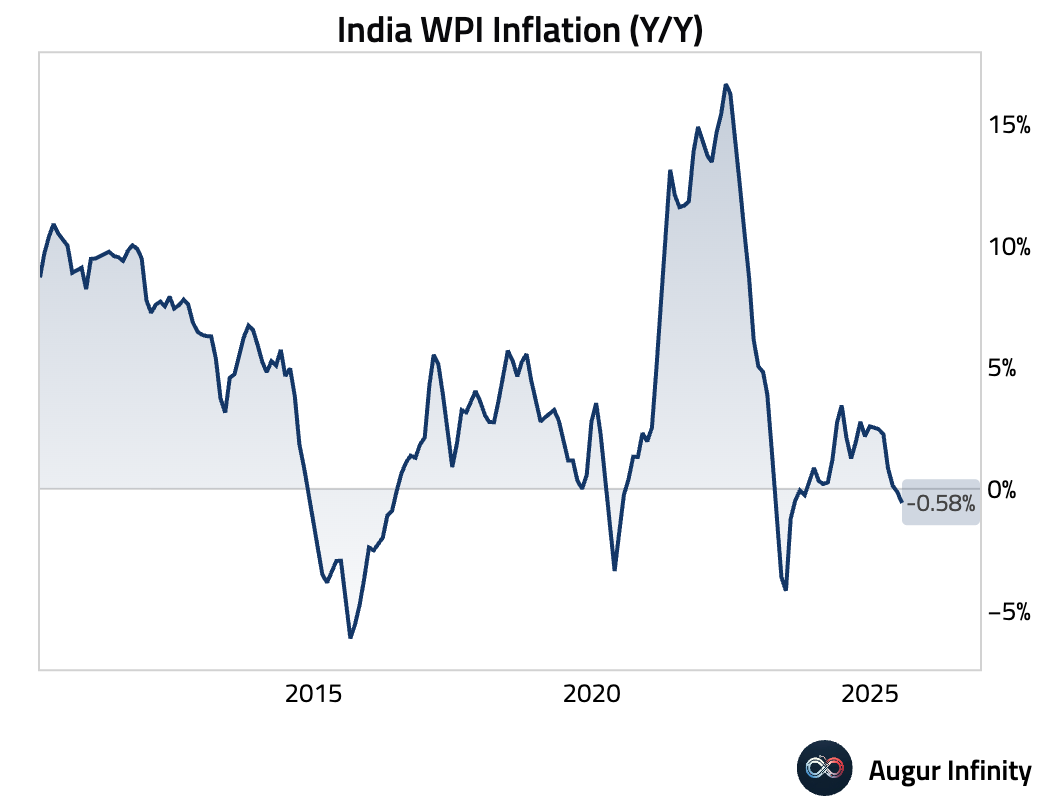
- India's Wholesale Price Index (WPI) inflation fell to -0.58% Y/Y in July from -0.13% in June, below the -0.3% consensus. Deflation was driven by food and fuel prices, while manufacturing price inflation ticked up to 2.05% Y/Y.
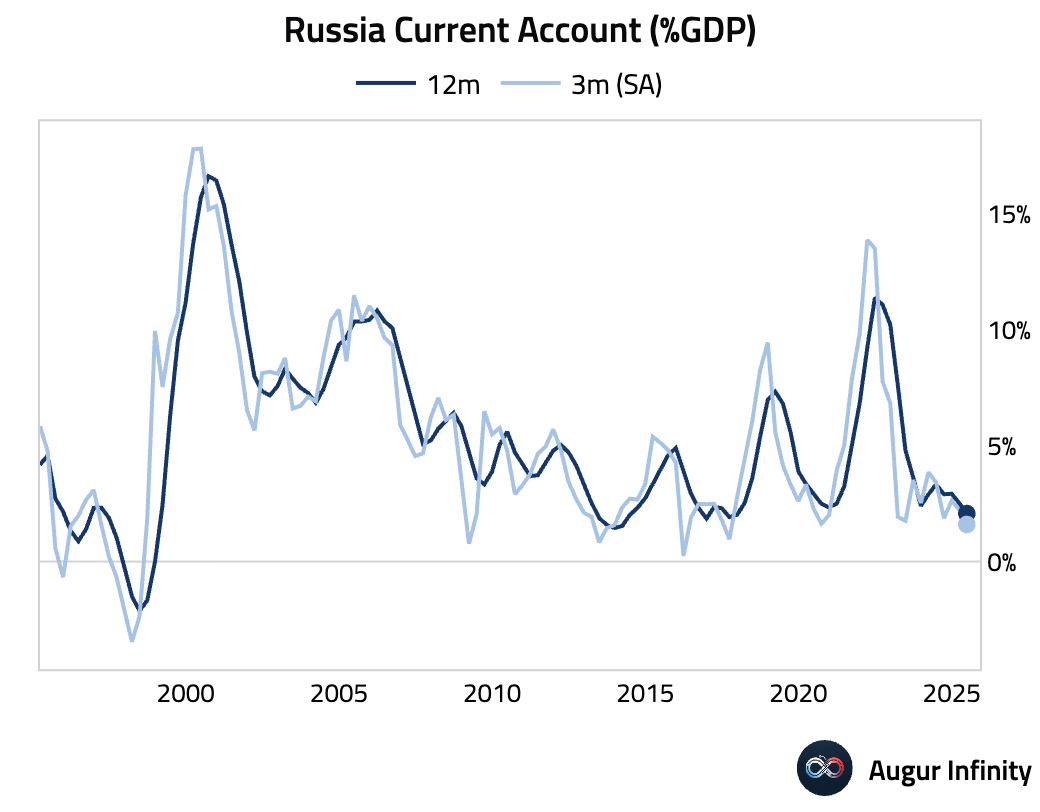
- Russia's current account surplus narrowed to $7.3 billion in Q2 from $17.7 billion in Q1.
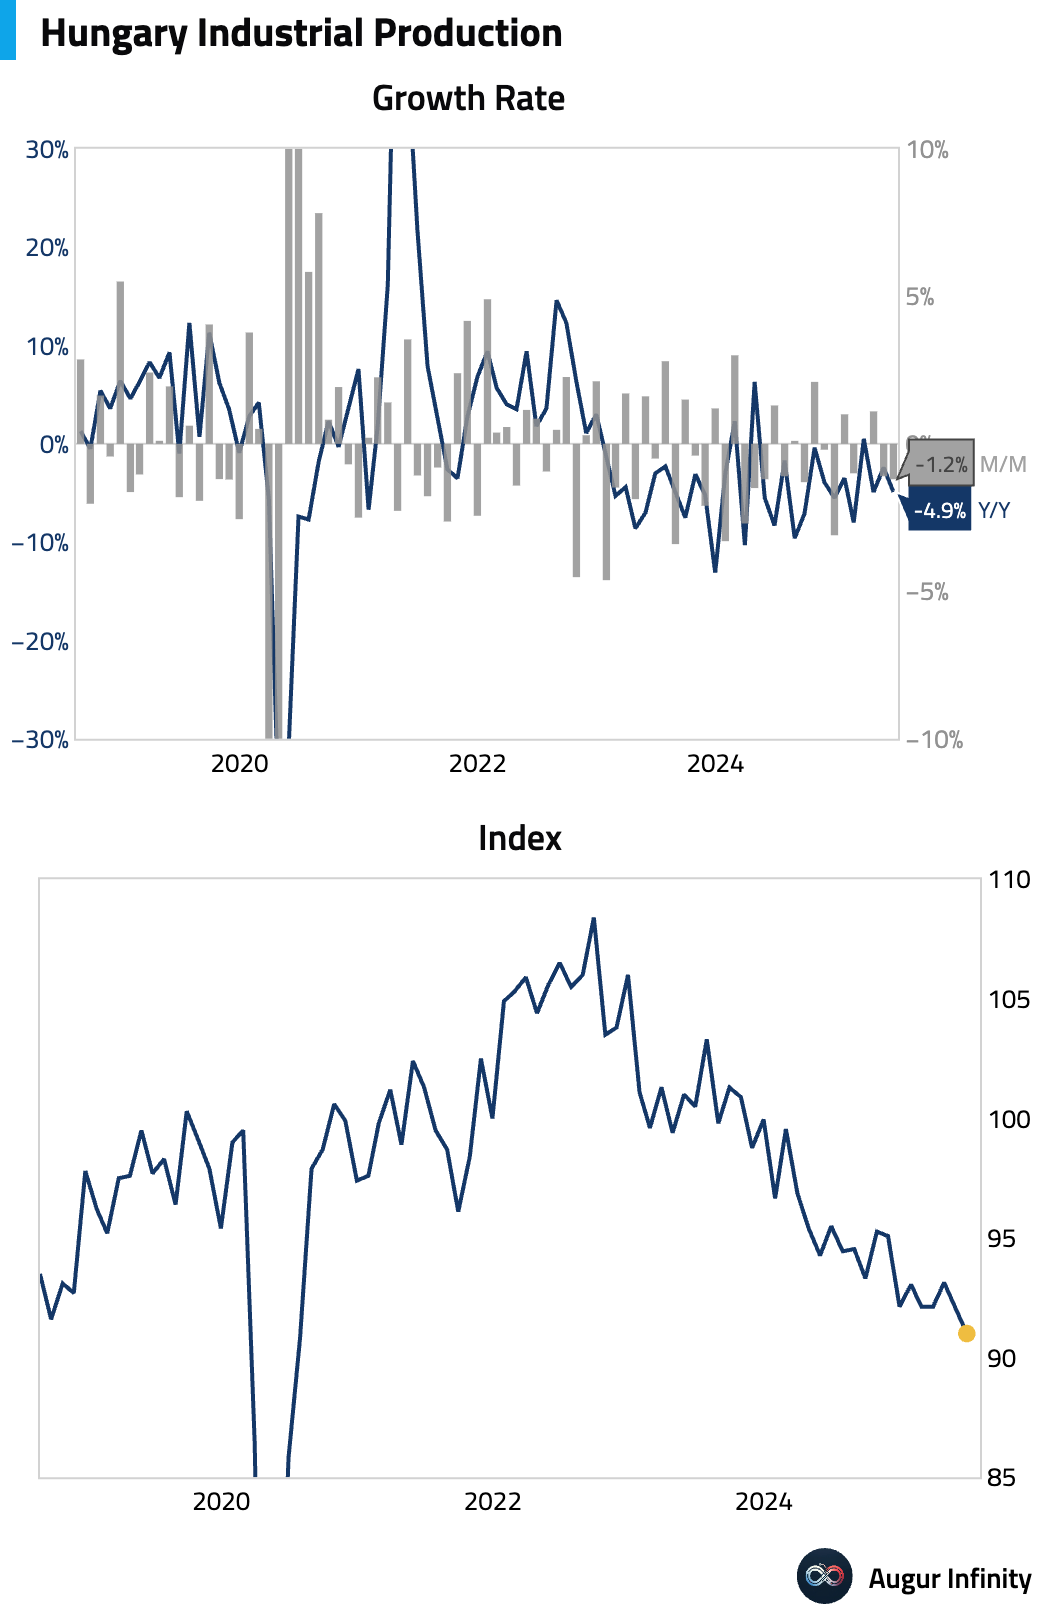
- Final data for Hungarian industrial production confirmed a 4.9% Y/Y contraction in June, matching the preliminary reading.
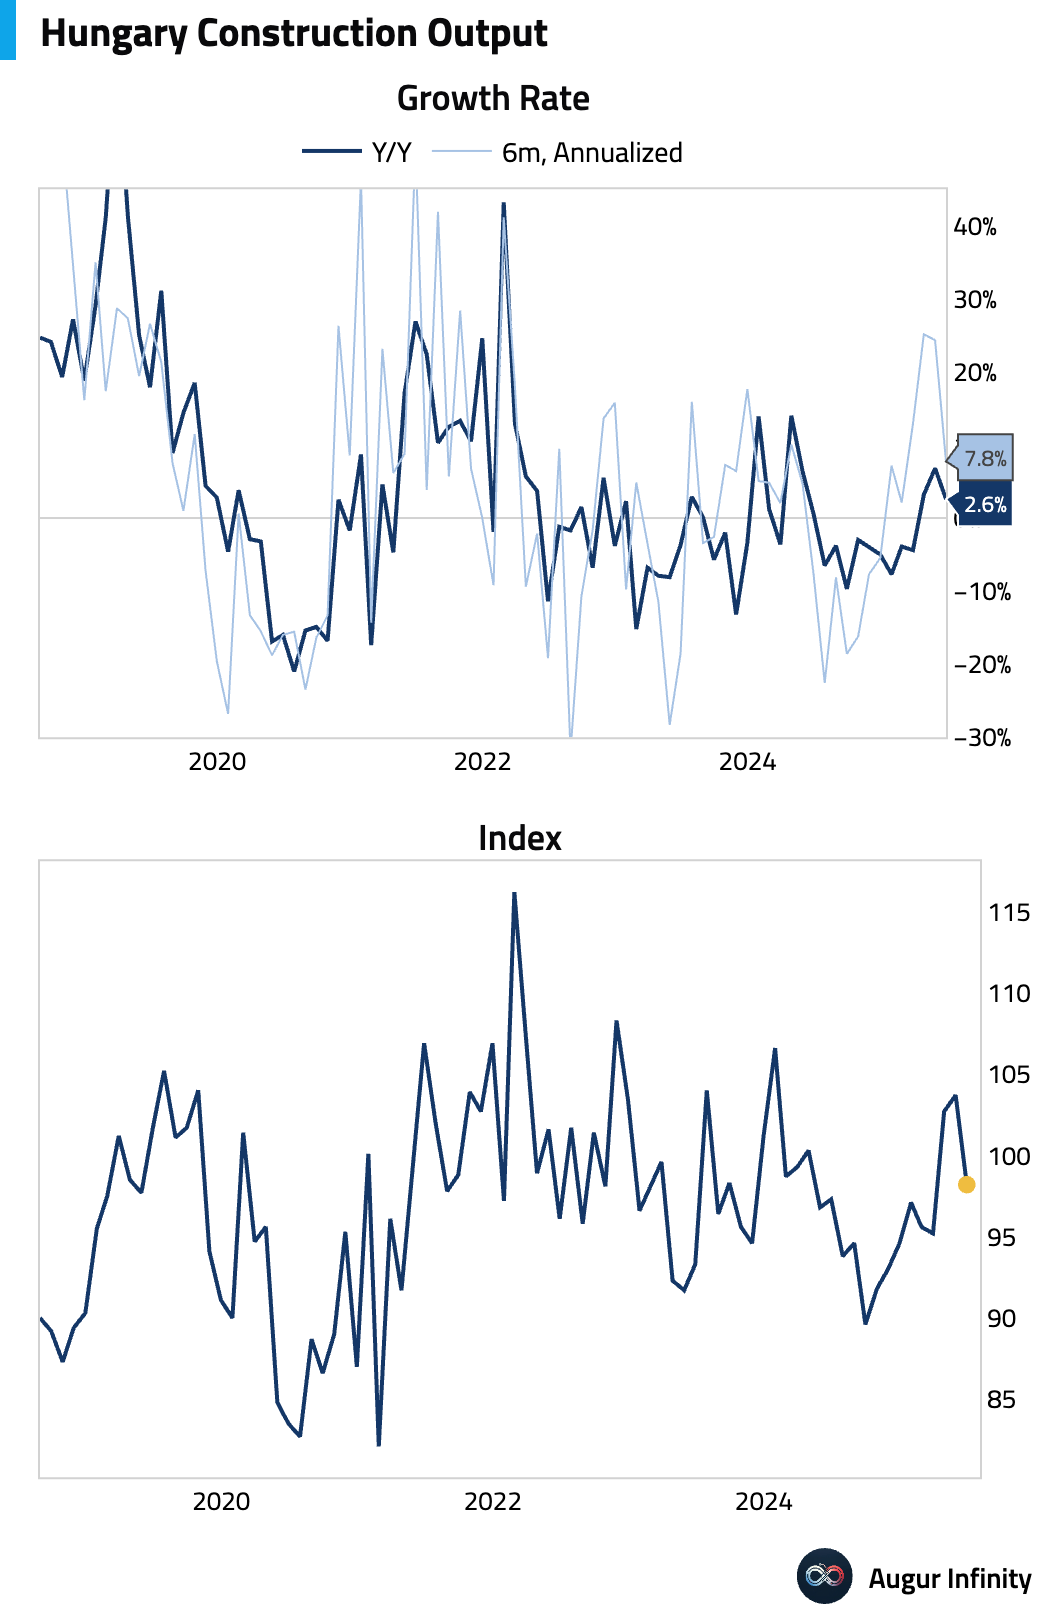
- Hungarian construction output growth slowed to 2.6% Y/Y in June from 6.8% in May.
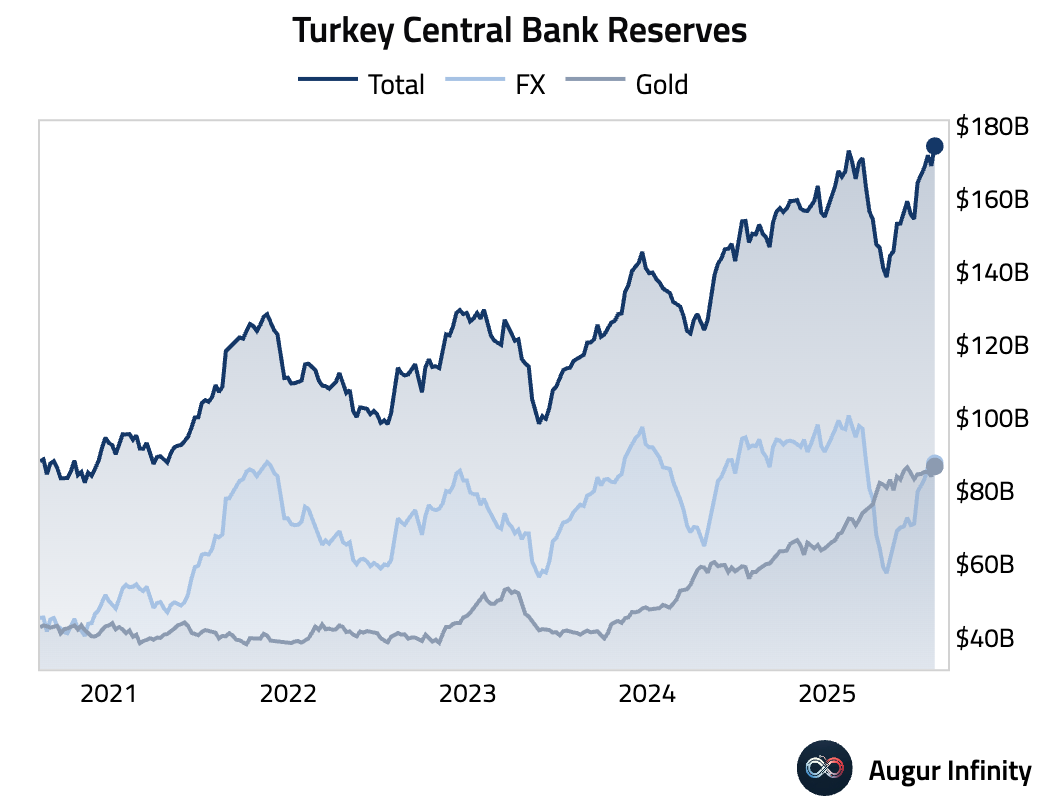
- Turkey's foreign exchange reserves rose to $87.61 billion for the week ending August 8, up from $84.91 billion the prior week.
Disclaimer
Augur Digest is an automatically generated newsletter edited by humans. It may contain inaccuracies and is not investment advice. Augur Labs LLC will not accept liability for any loss or damage as a result of your reliance on the information contained in the newsletter.
Reply