Charts of the Day
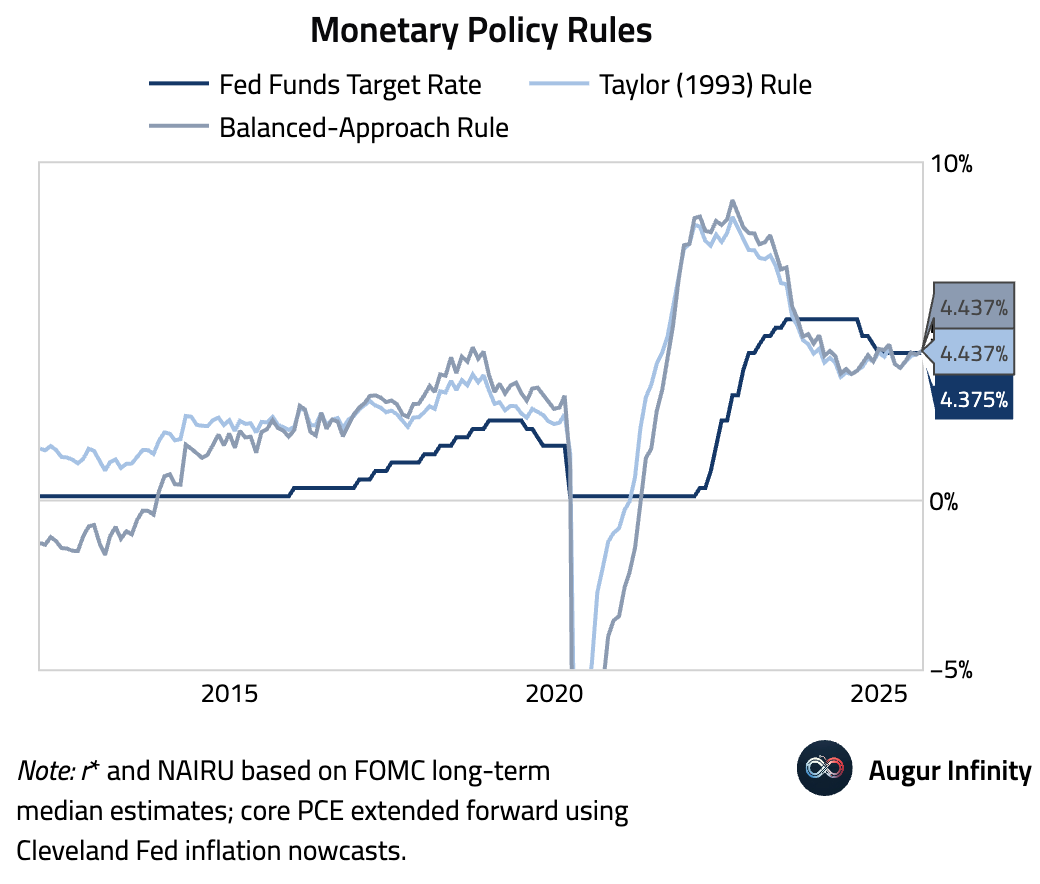
- Monetary policy rules suggest the Fed funds target should be 4.4%—roughly in line with the current level.
Global Economics
United States
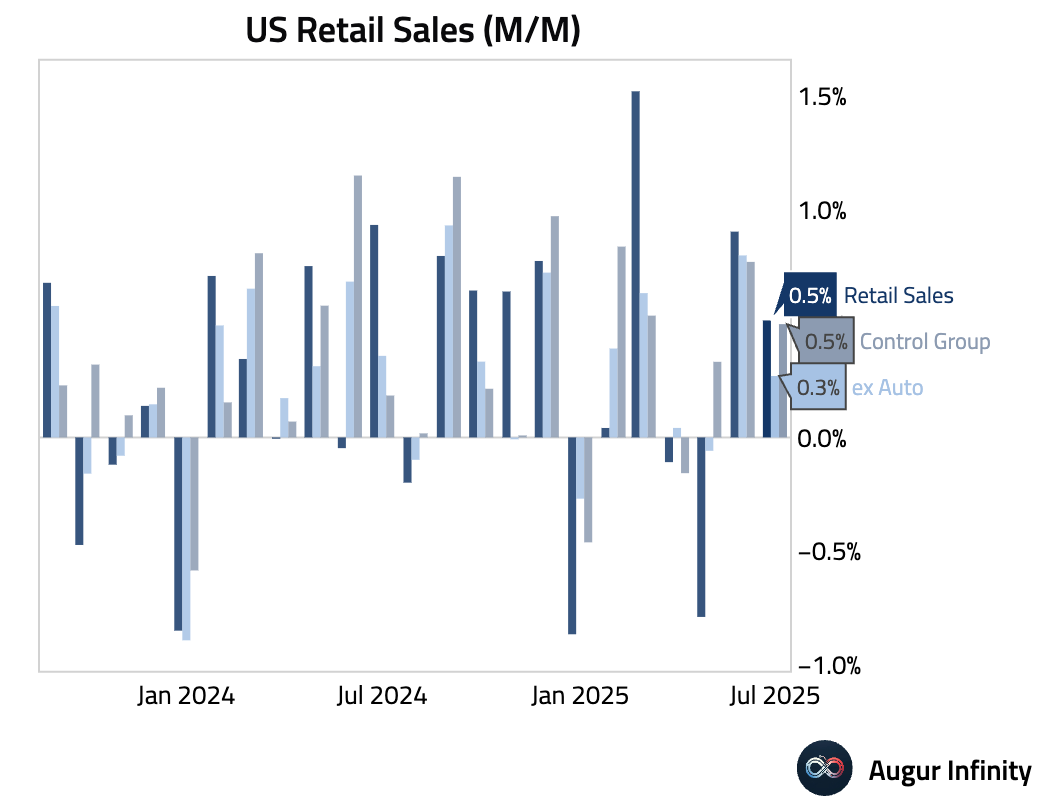
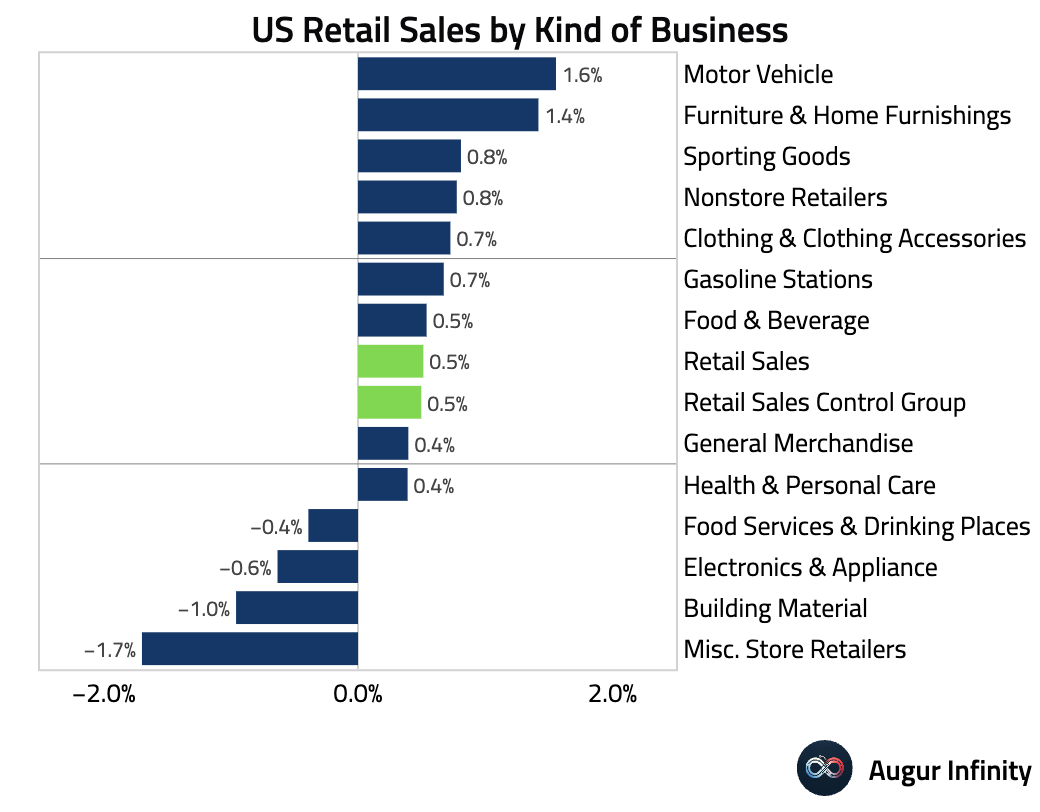
- The July retail sales report indicated consumer spending remained resilient. Headline retail sales rose 0.5% M/M (slightly below consensus of 0.6%) and retail sales ex auto comes in at 0.3% M/M (in line with consensus). The key control group increased by a solid 0.5%, slightly ahead of the 0.4% forecast. The level of core retail sales was also revised up by 0.4% in June, reflecting a 0.3pp upward revision to core retail sales growth in June and a 0.1pp upward revision in May.
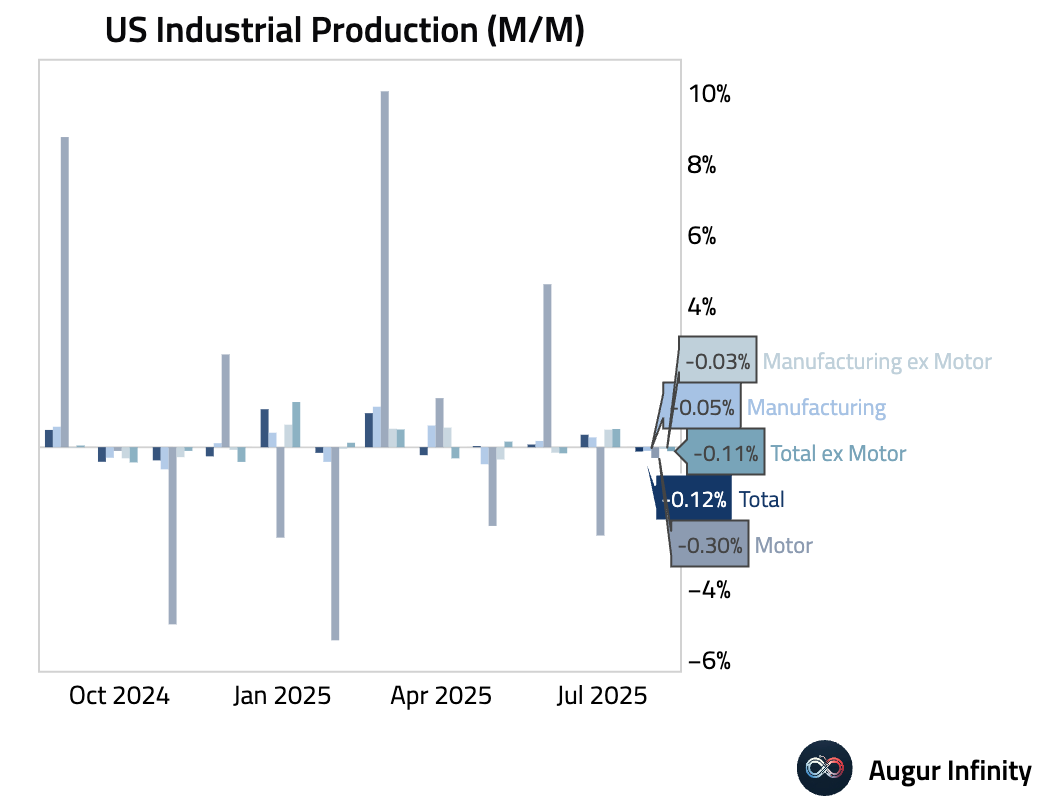
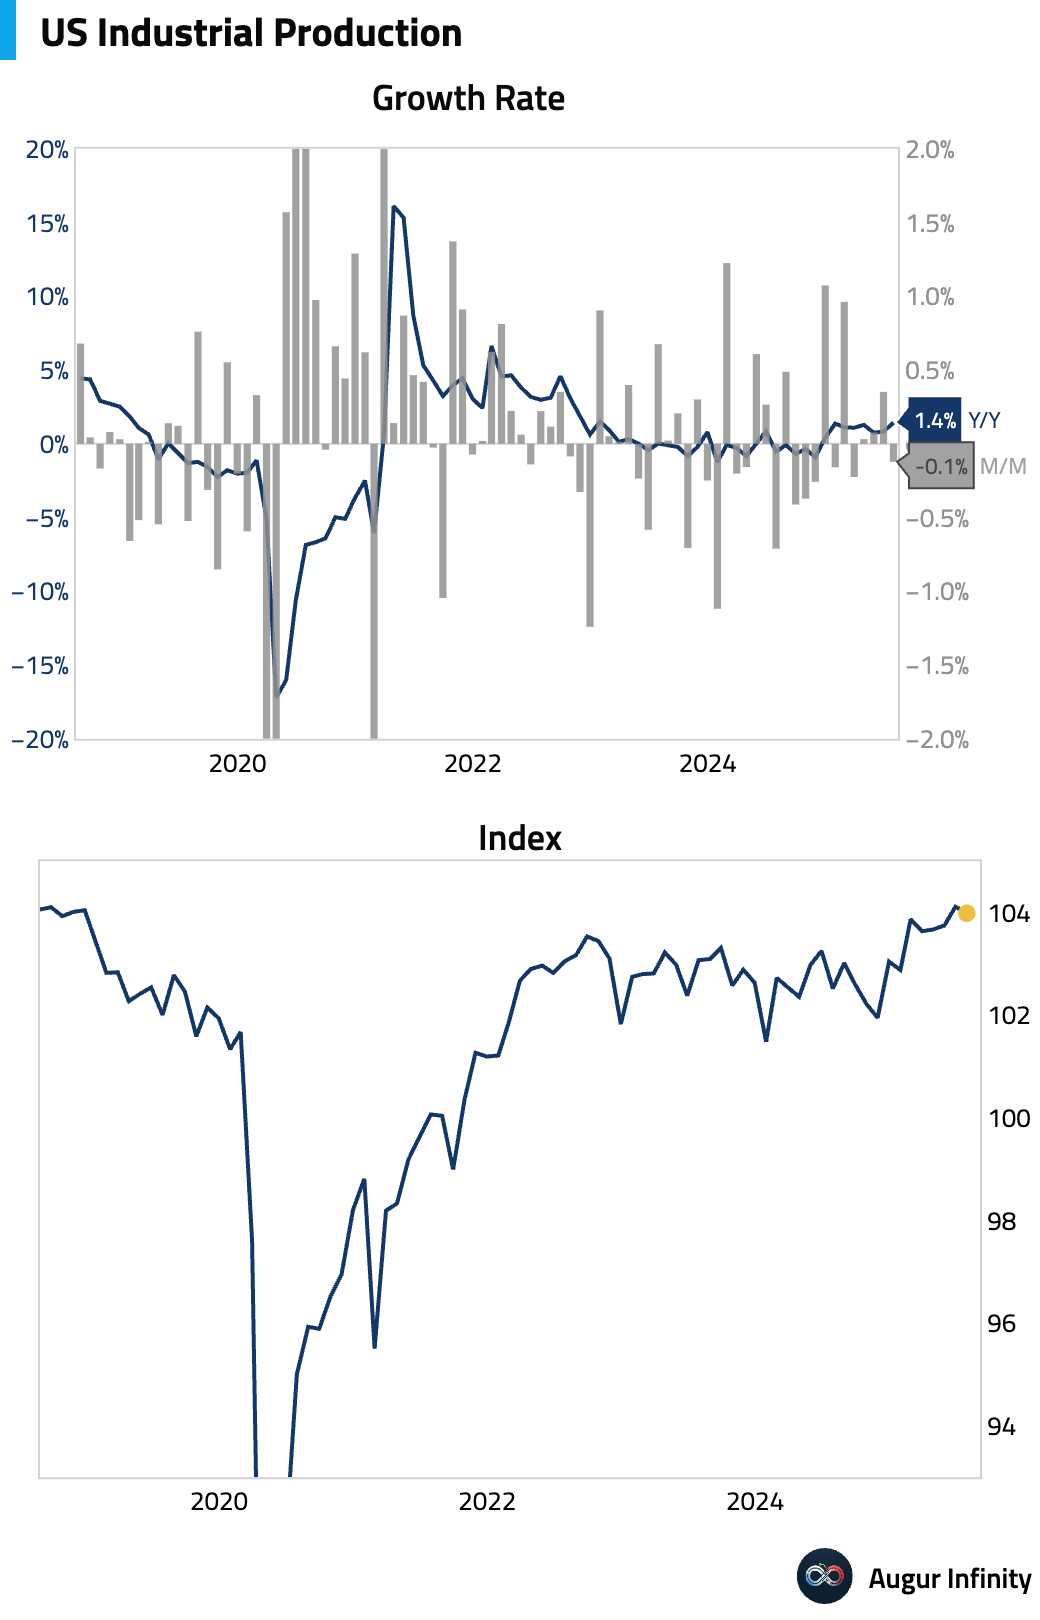
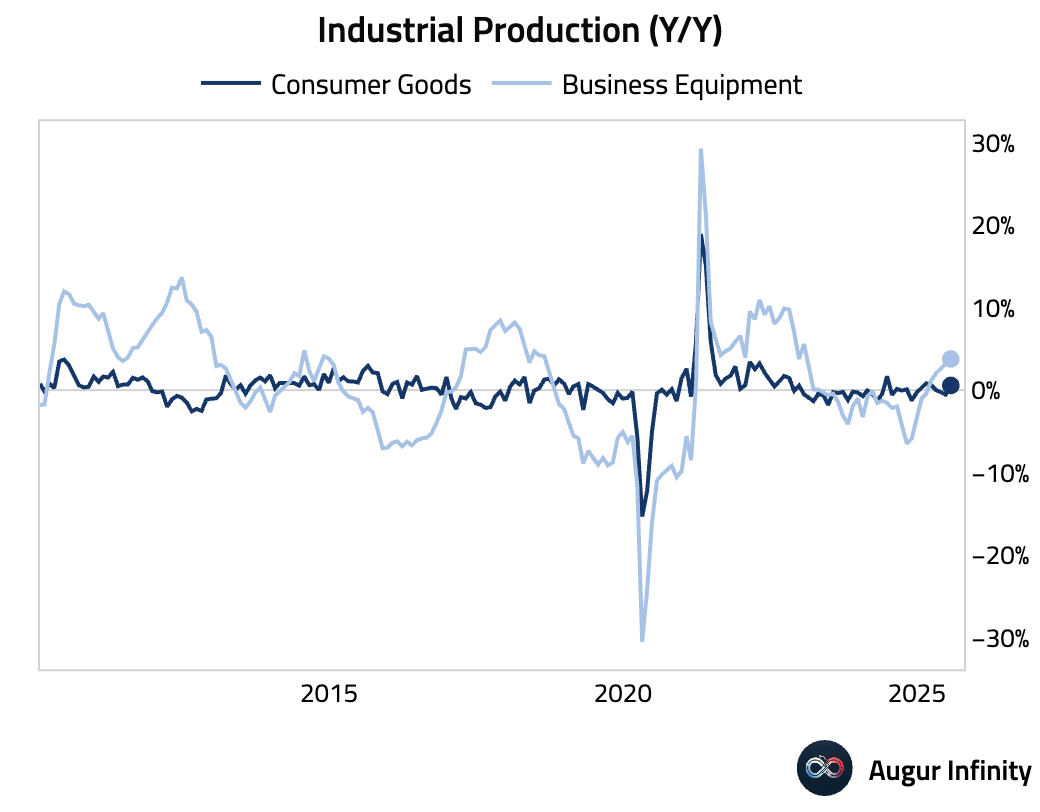
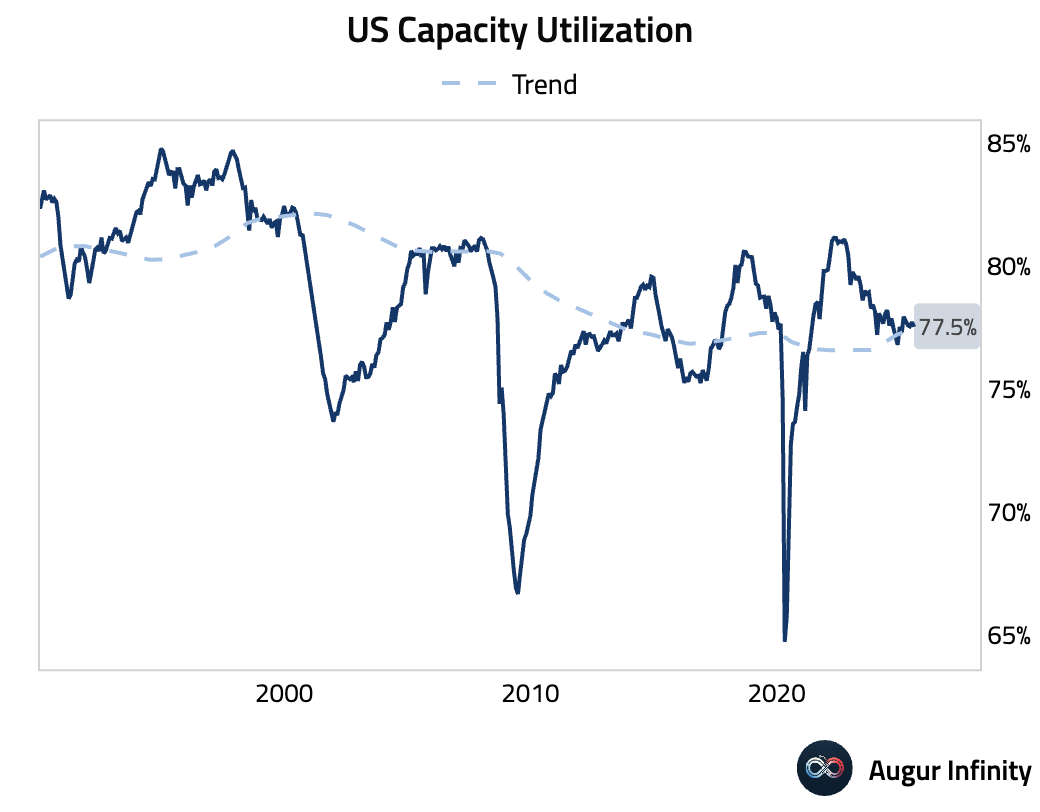
- Industrial production fell 0.1% M/M in July, while manufacturing output was flat, signaling a slowdown after sharp gains earlier in the year. The weakness was broad-based, though bright spots included aerospace-led transmit equipment (+1.8%) and computers (+2.9%). Capacity utilization edged down to 77.5% from an upwardly revised level in June.
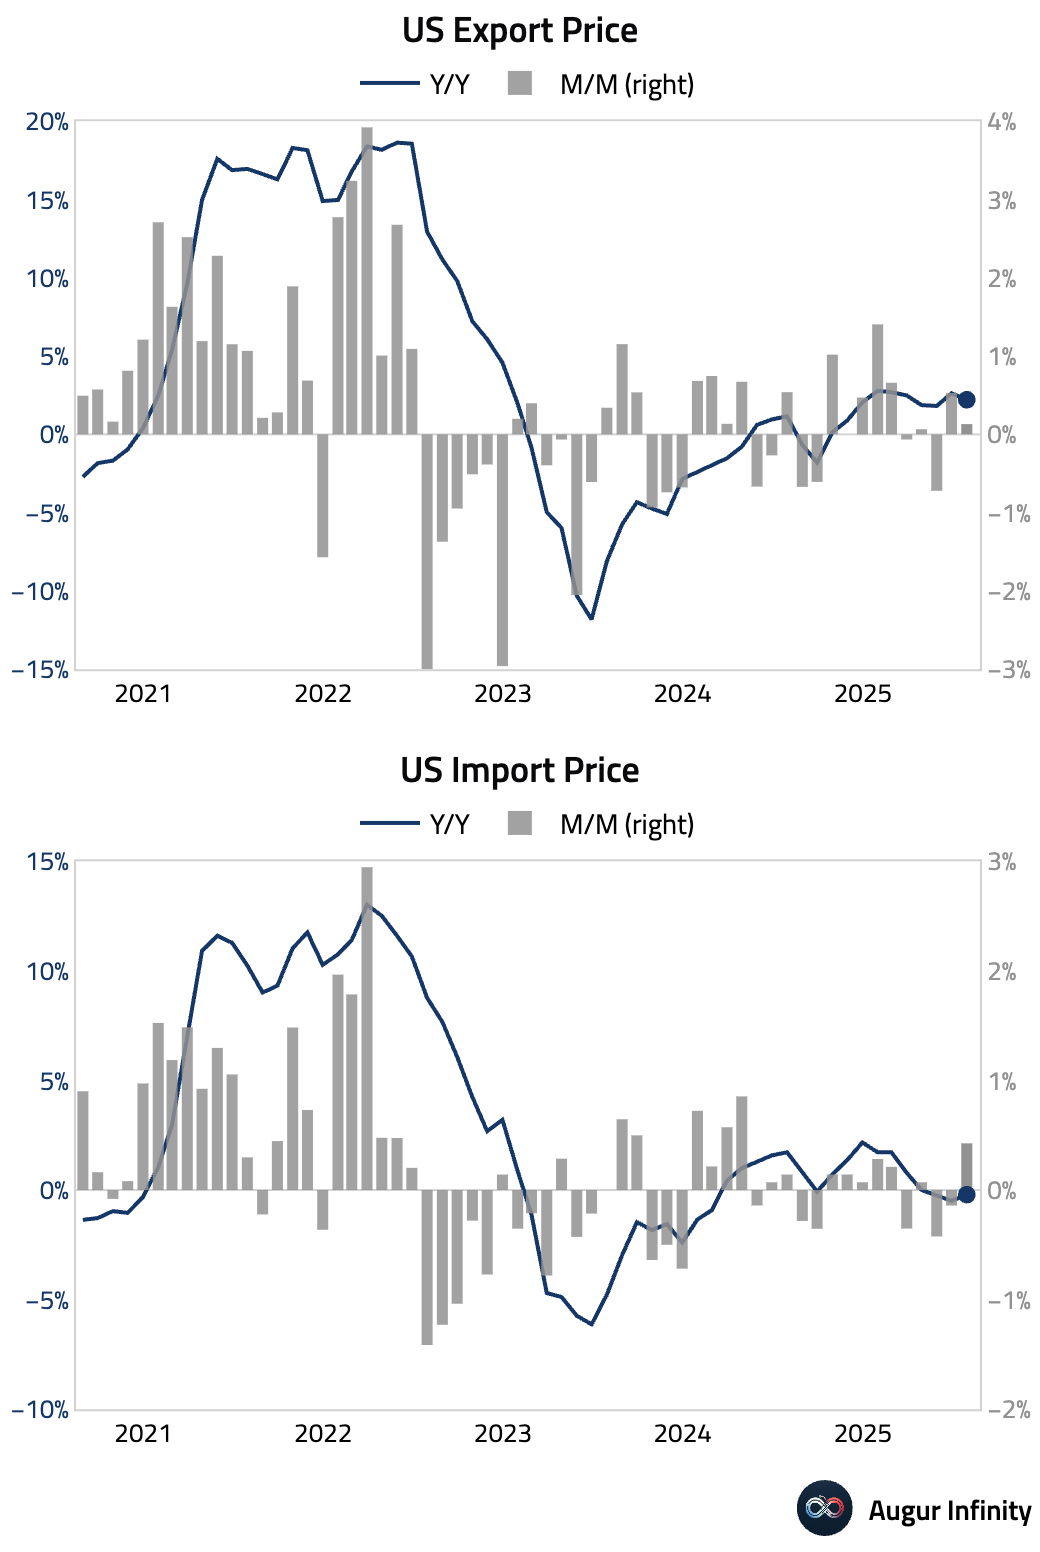
- Import prices rose 0.4% M/M in July, well above the flat consensus estimate, driven by higher fuel costs. Year-over-year, import prices contracted 0.2%. Despite the headline beat, international airfares, the source data for the foreign travel component of core PCE, fell a sharp 4.4% (seasonally adjusted). Export prices rose 0.1% M/M, slowing to a 2.2% Y/Y pace.
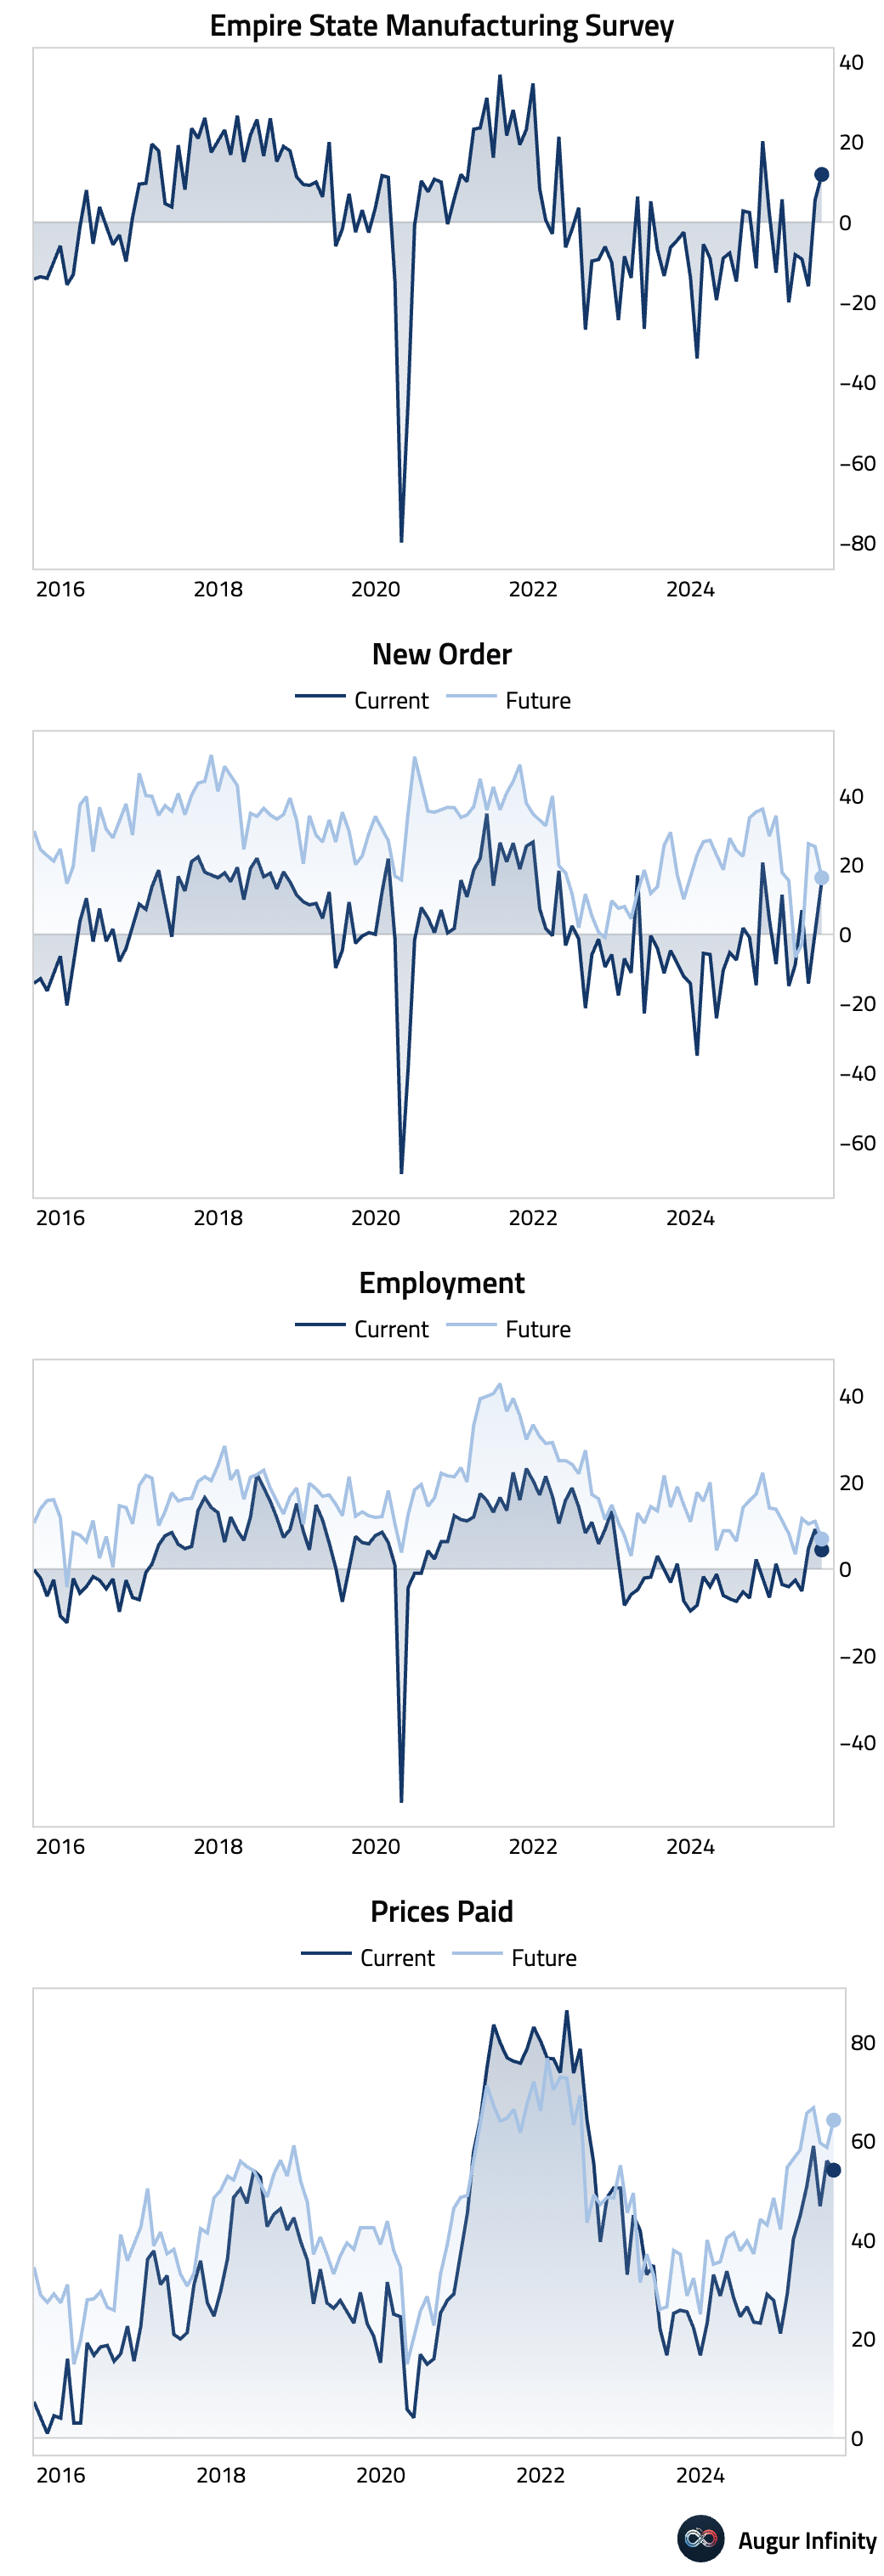
- The August NY Empire State Manufacturing Index unexpectedly surged to 11.9, crushing the flat consensus forecast of 0.0 and rising from 5.5 in July. The jump was driven by improvements in new orders and shipments. However, the internals were mixed, with the employment component declining and the six-month forward-looking index falling for the first time since April, suggesting some caution ahead. Capex expectations also fell back into negative territory.
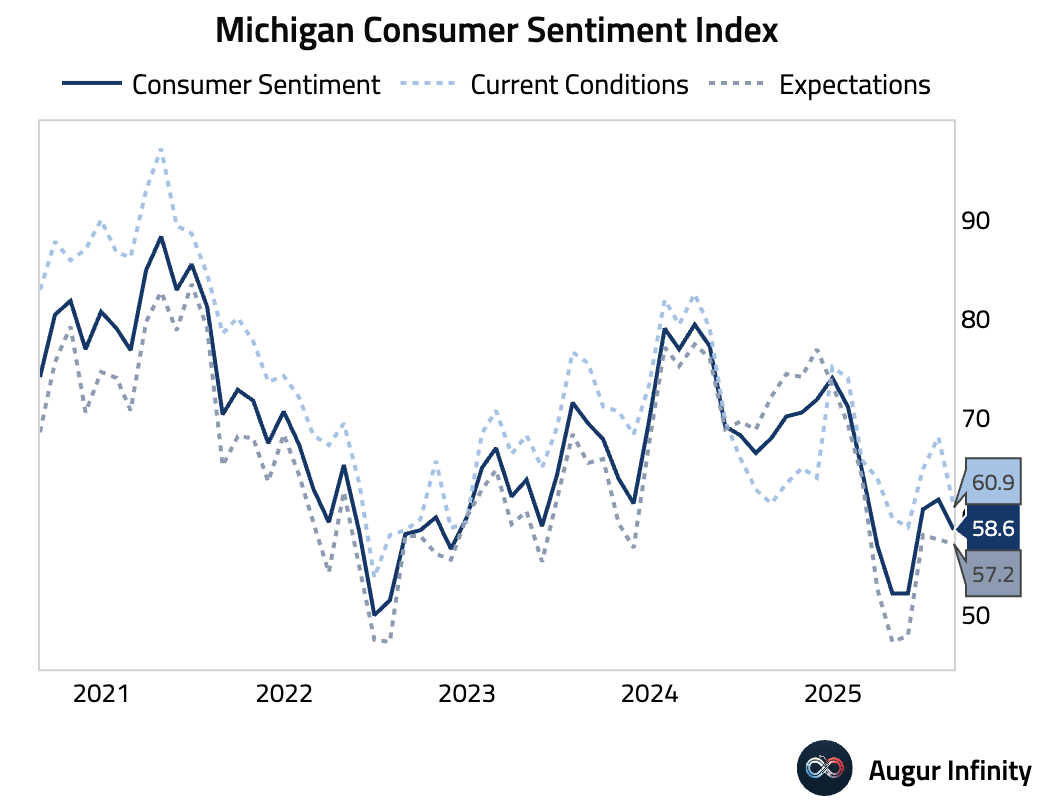
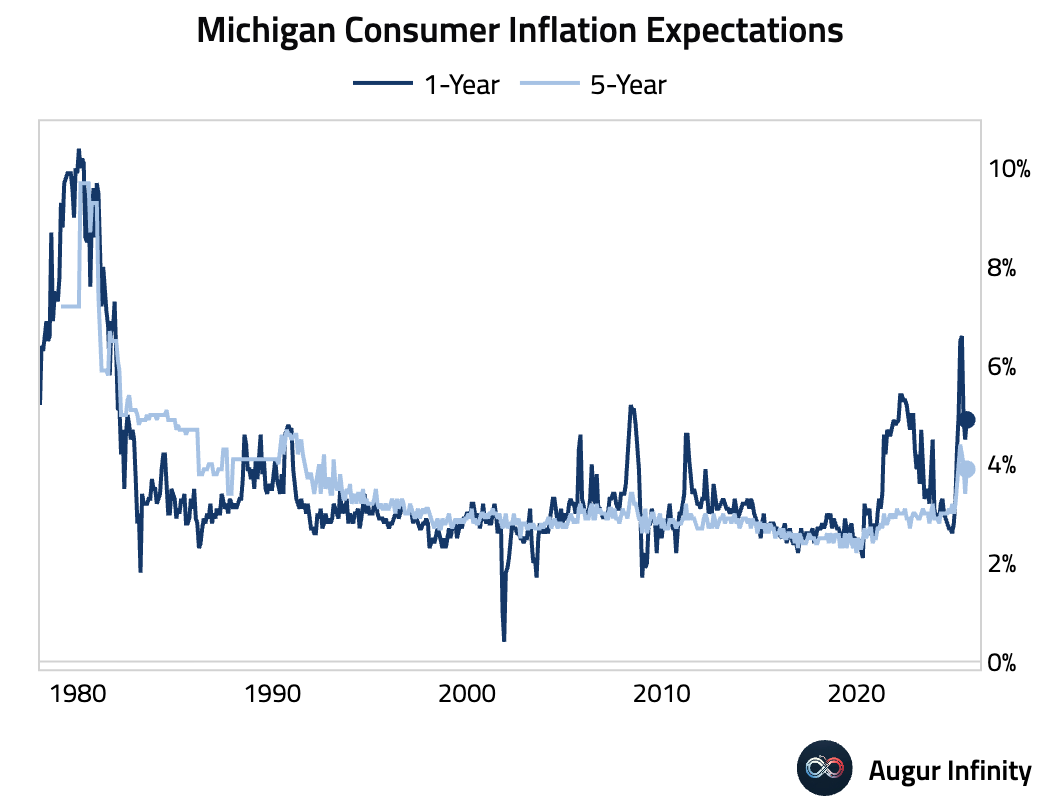
- The preliminary University of Michigan consumer sentiment index for August fell to 58.6, significantly missing the consensus of 62.0 and declining from 61.7 in July. The drop was led by a decrease in the current conditions component, driven by rising inflation worries. Inflation expectations rebounded, with the one-year outlook rising to 4.9% (from 4.5%) and the five-year outlook increasing to 3.9% (from 3.4%).
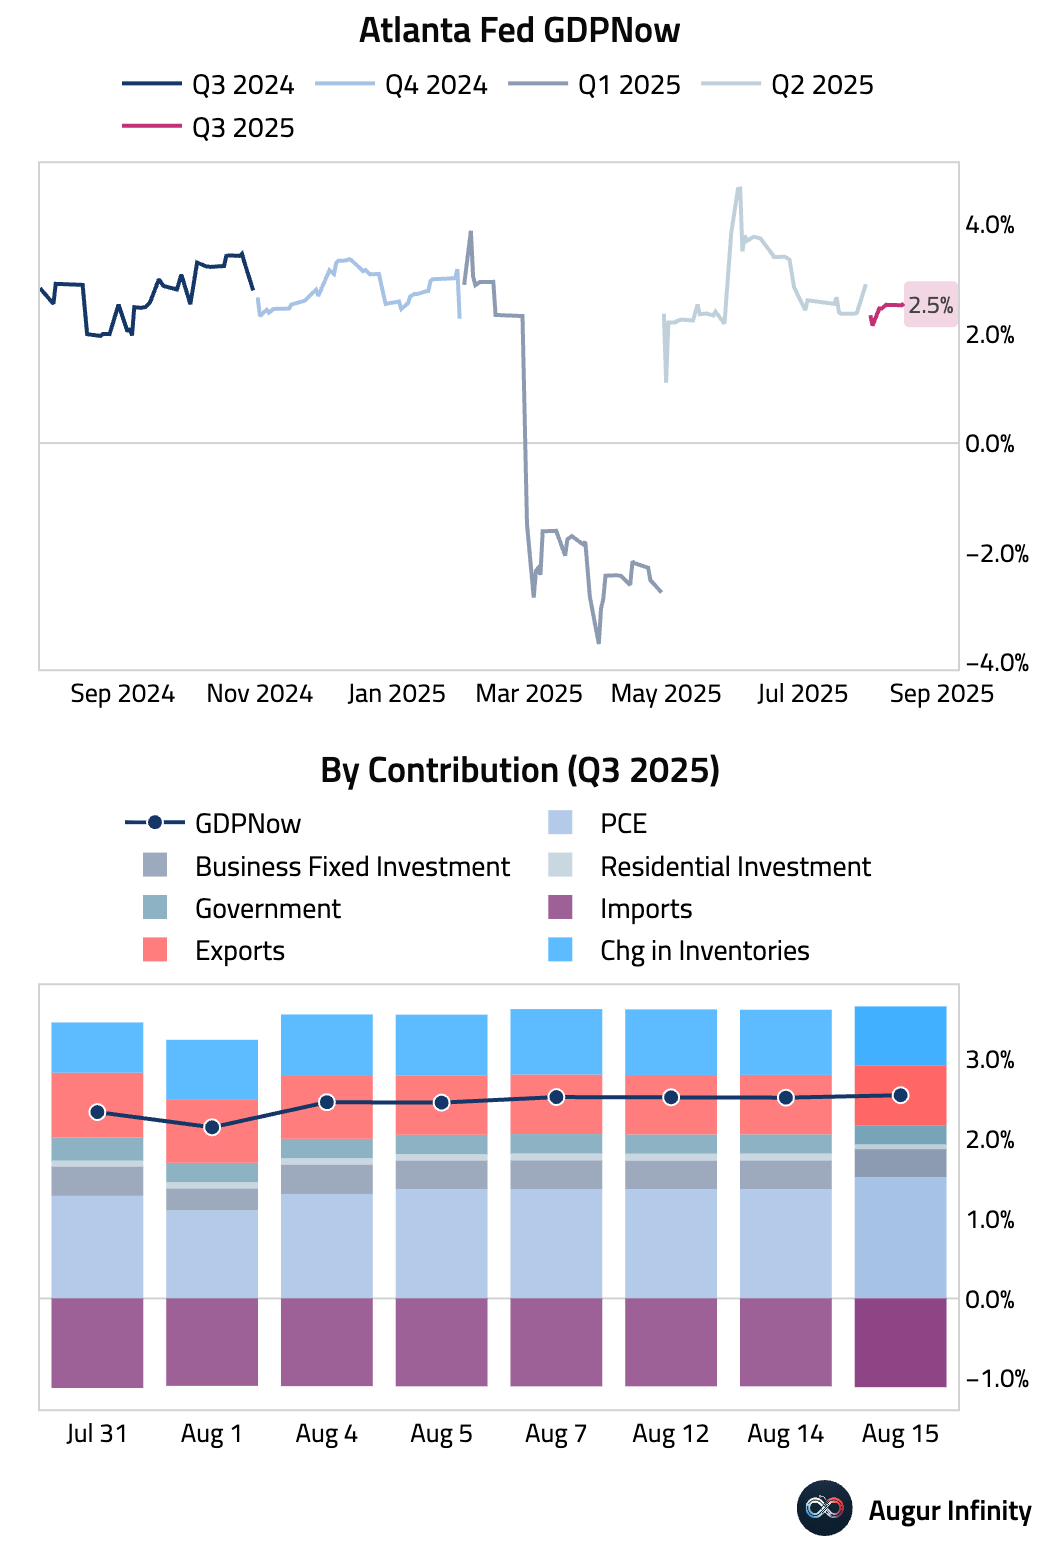
- The Atlanta Fed's GDPNow model continues to track Q3 GDP at 2.5%, unchanged from last week after rounding.
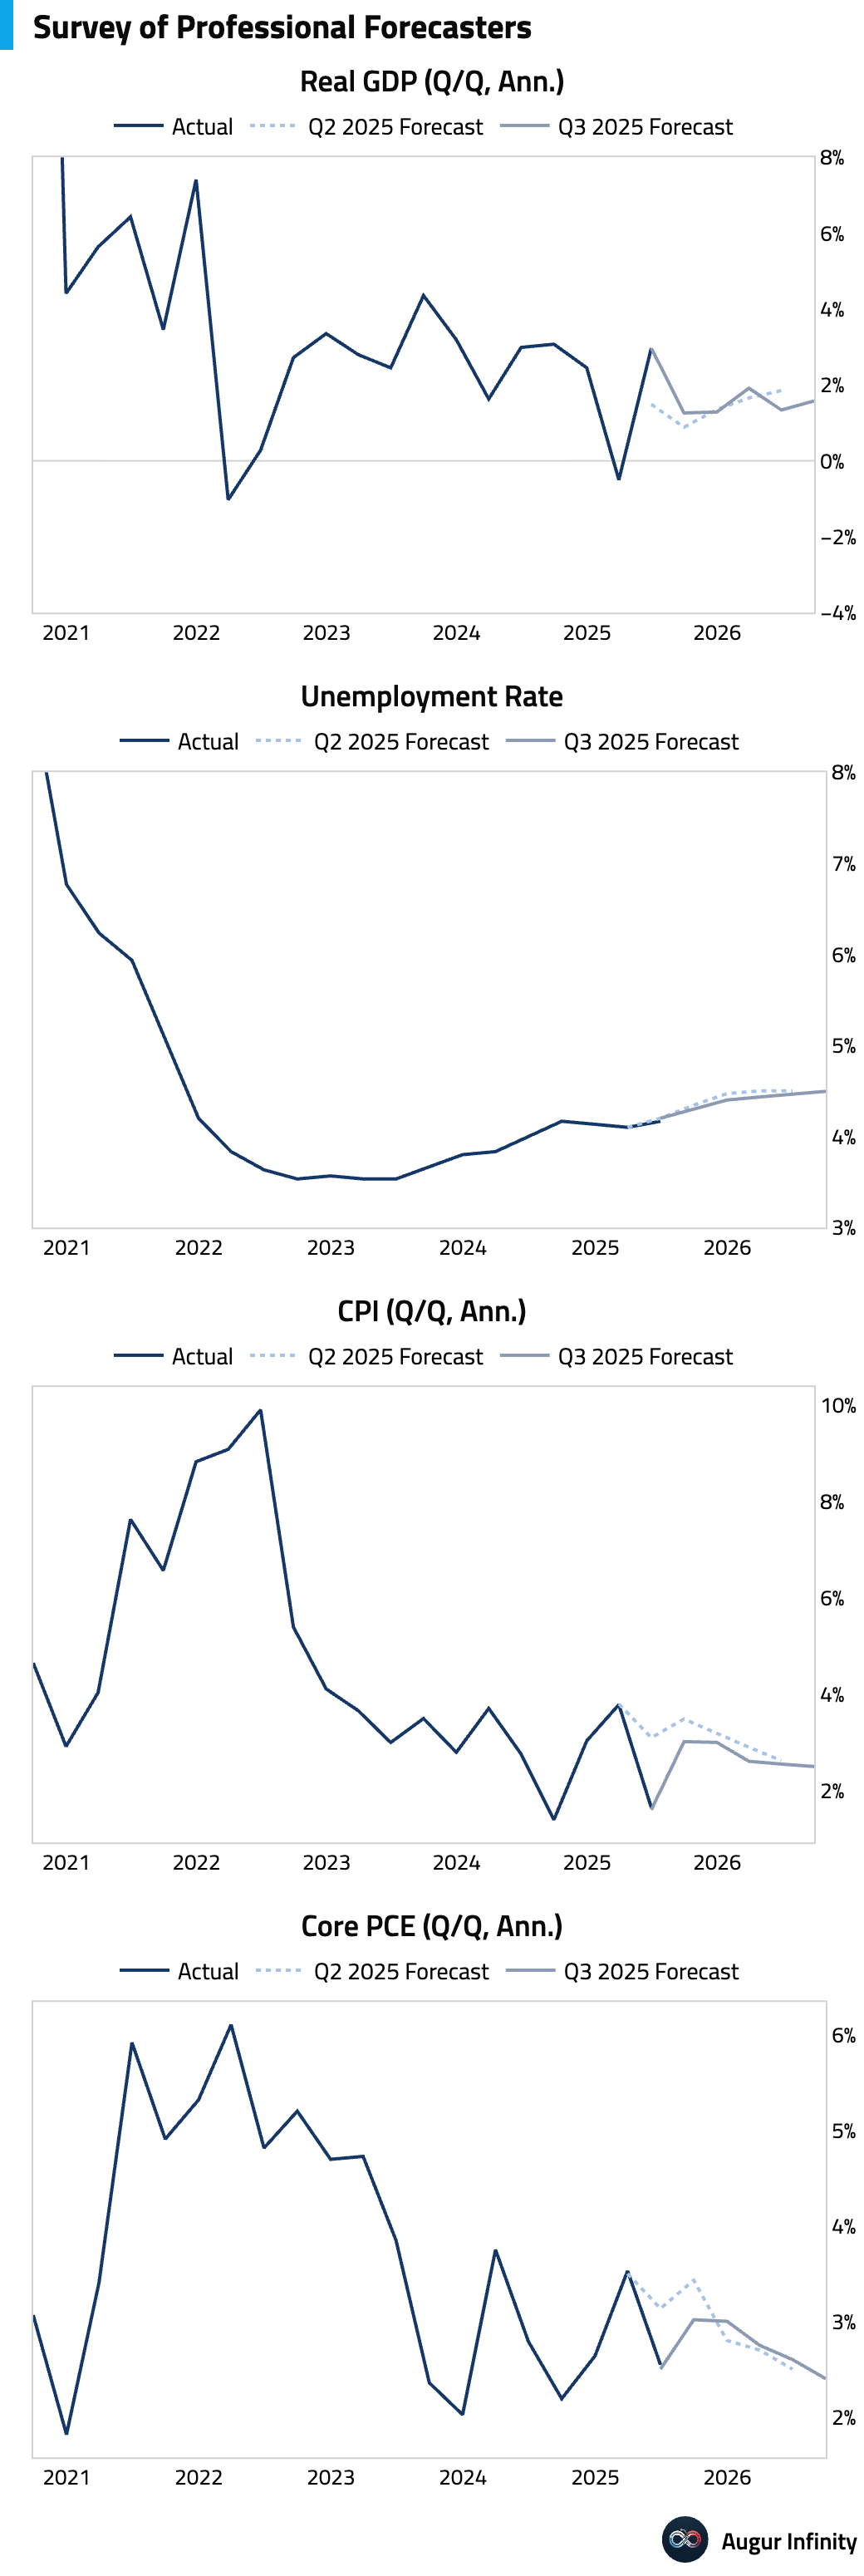
- The Philadelphia Fed’s Q3 2025 Survey of Professional Forecasters shows improved expectations for US growth, with real GDP now projected to rise 1.7% in 2025 (up from 1.4%) and 1.6% in 2026. Unemployment forecasts edged lower, averaging 4.2% in 2025, although job growth estimates for 2025 were revised down to 132,800 per month. CPI inflation forecasts fell across the board, but core PCE inflation for Q4 2025 rose from 2.8% to 3.0%.
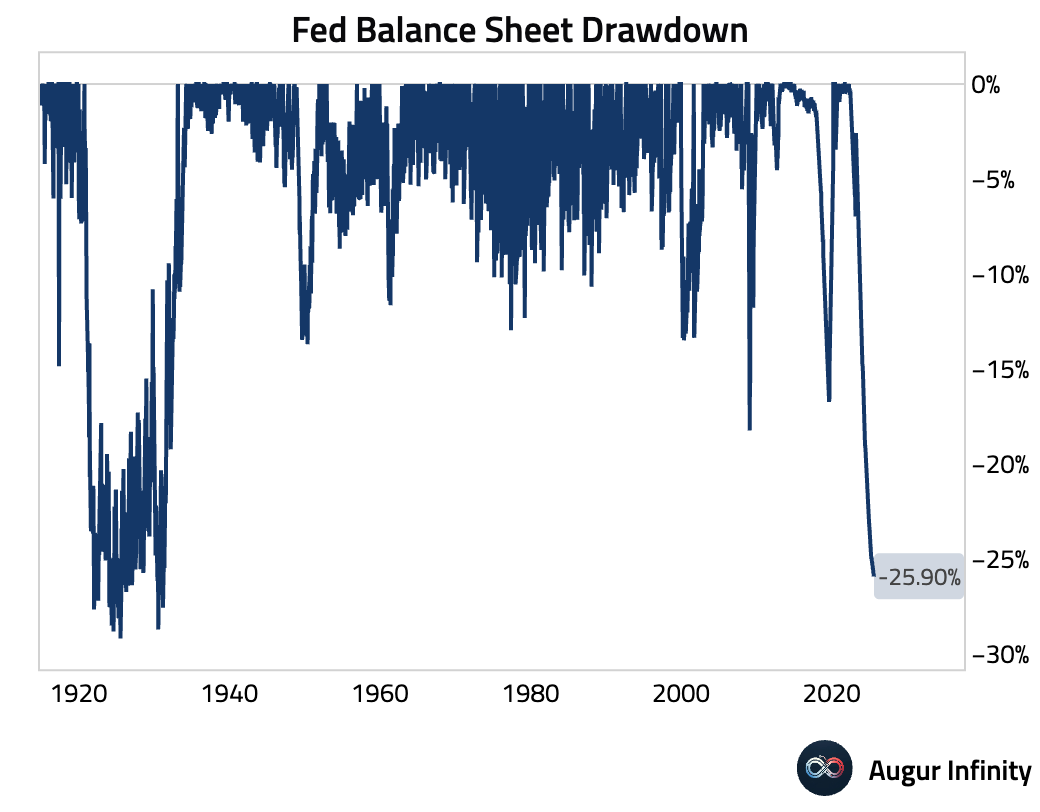
- The Federal Reserve’s balance sheet was unchanged at $6.64 trillion for the week ending August 13.
Canada
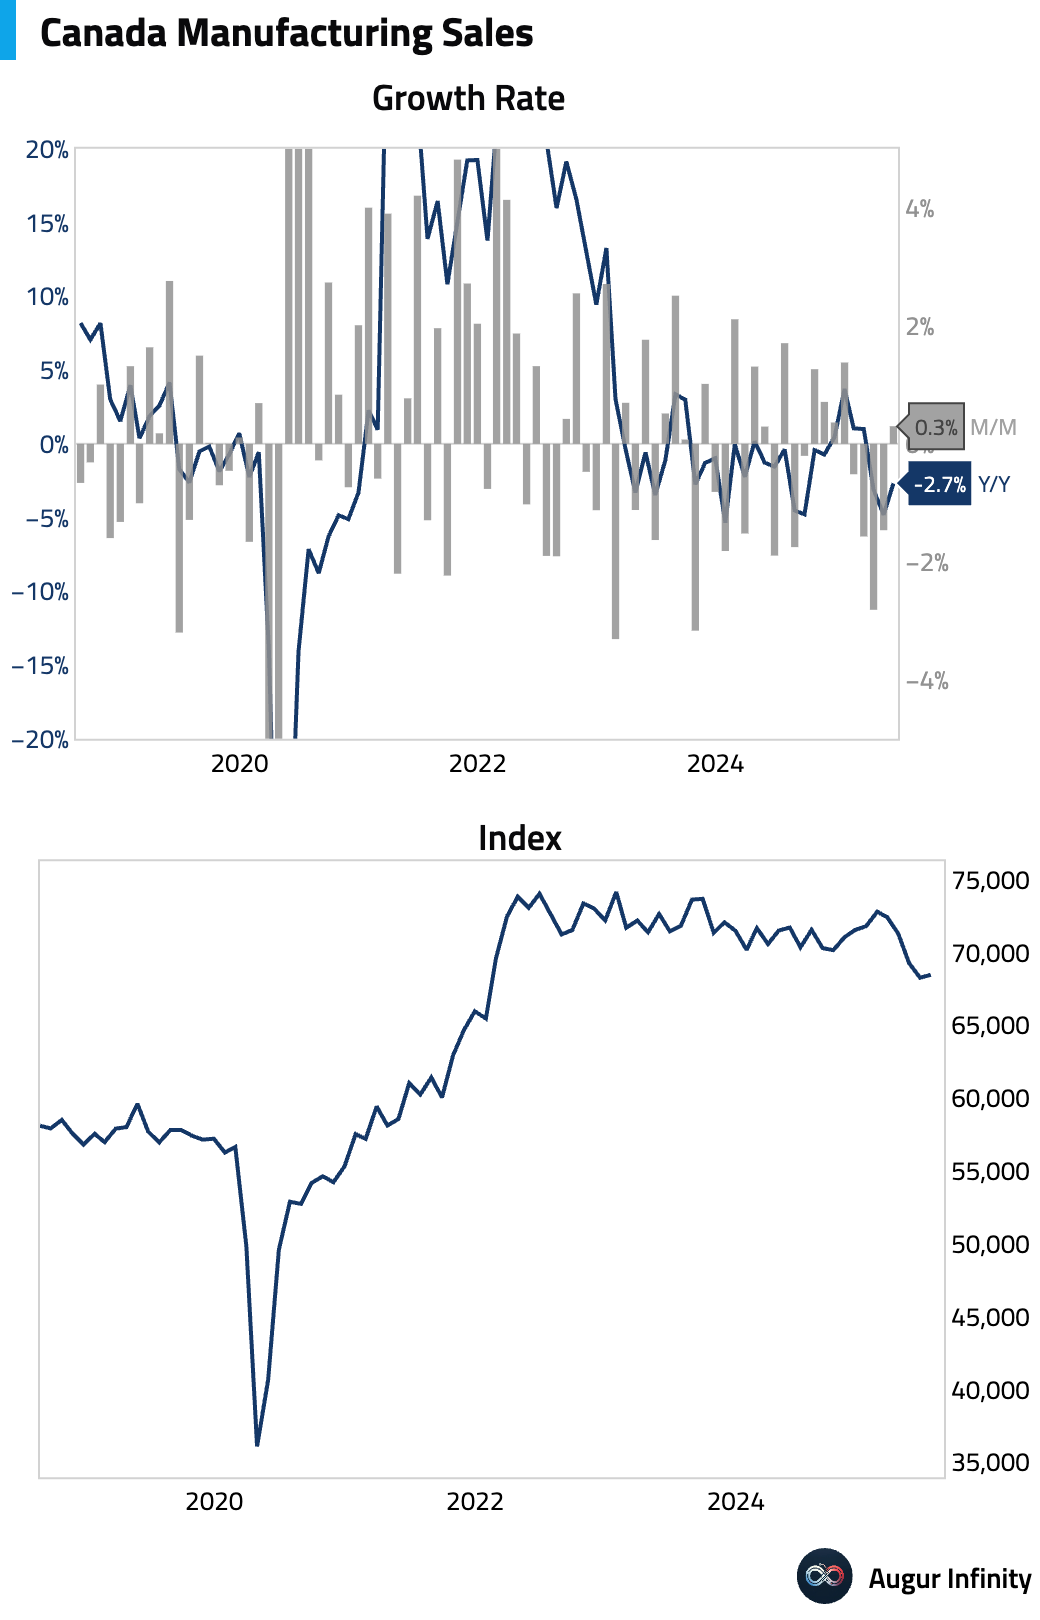
- Final manufacturing sales for June rose 0.3% M/M, rebounding from a revised 1.5% decline in May but slightly below the preliminary estimate of 0.4%.
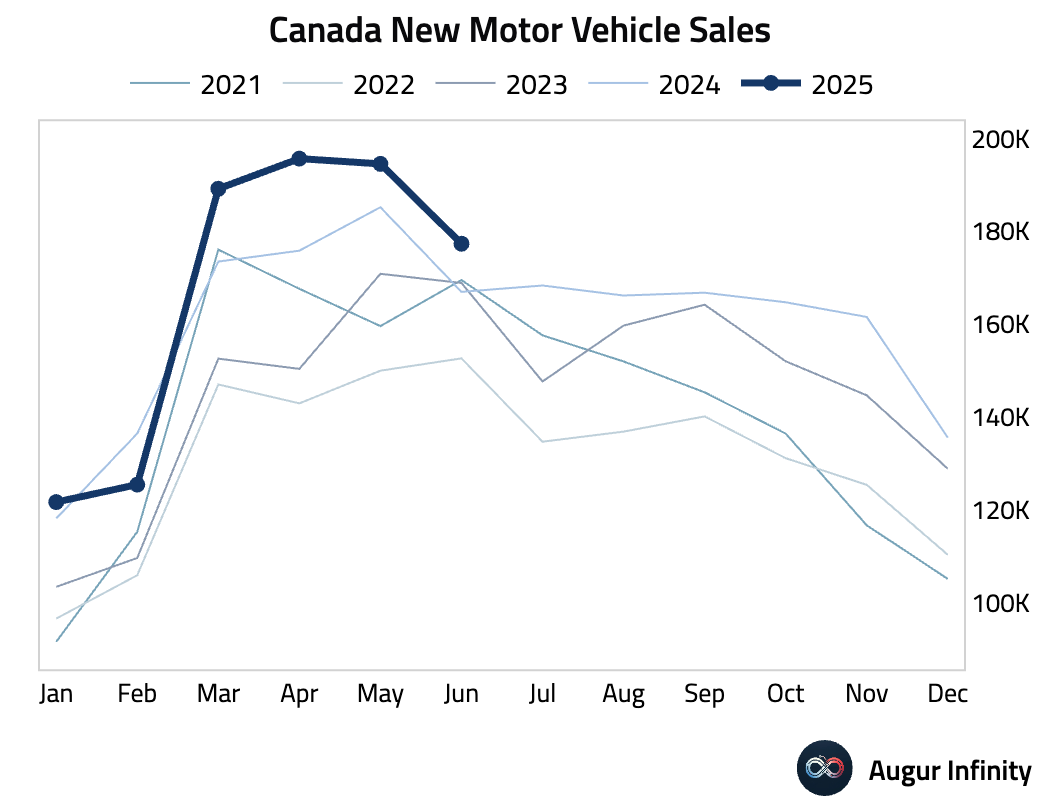
- New motor vehicle sales fell to 177,300 units in June from 194,500 in May, marking a three-month low.
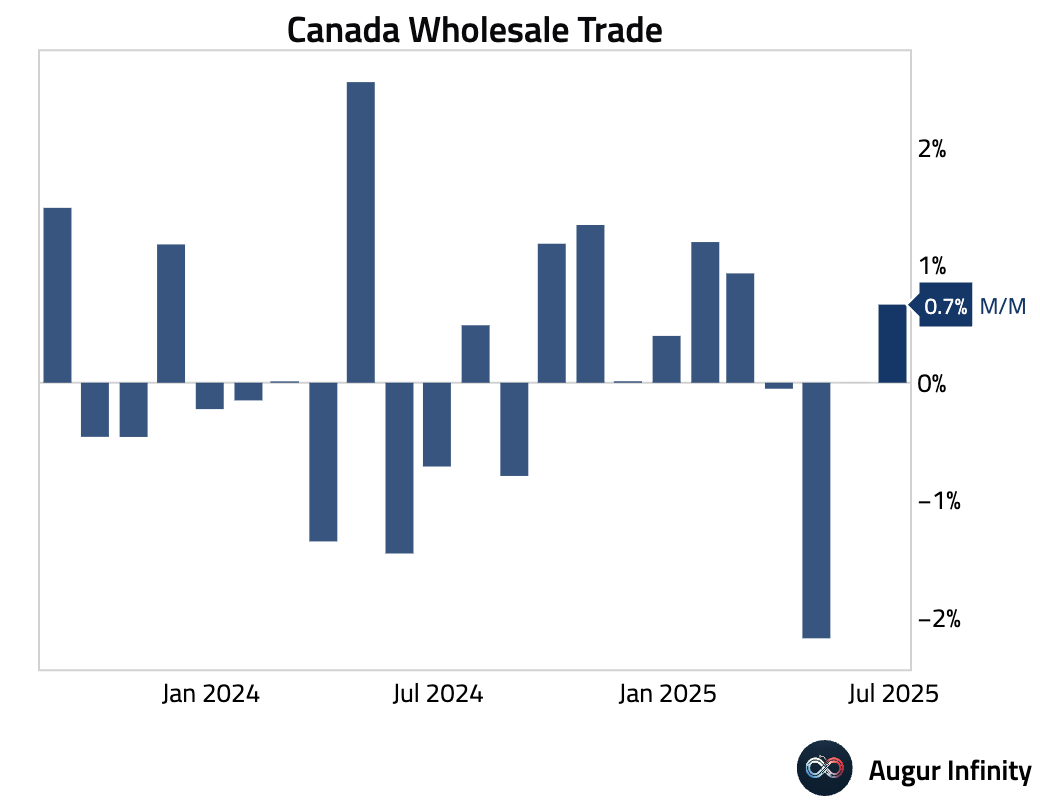
- Final wholesale sales for June rose 0.7% M/M, in line with the preliminary estimate and recovering from a flat reading in May.
Europe
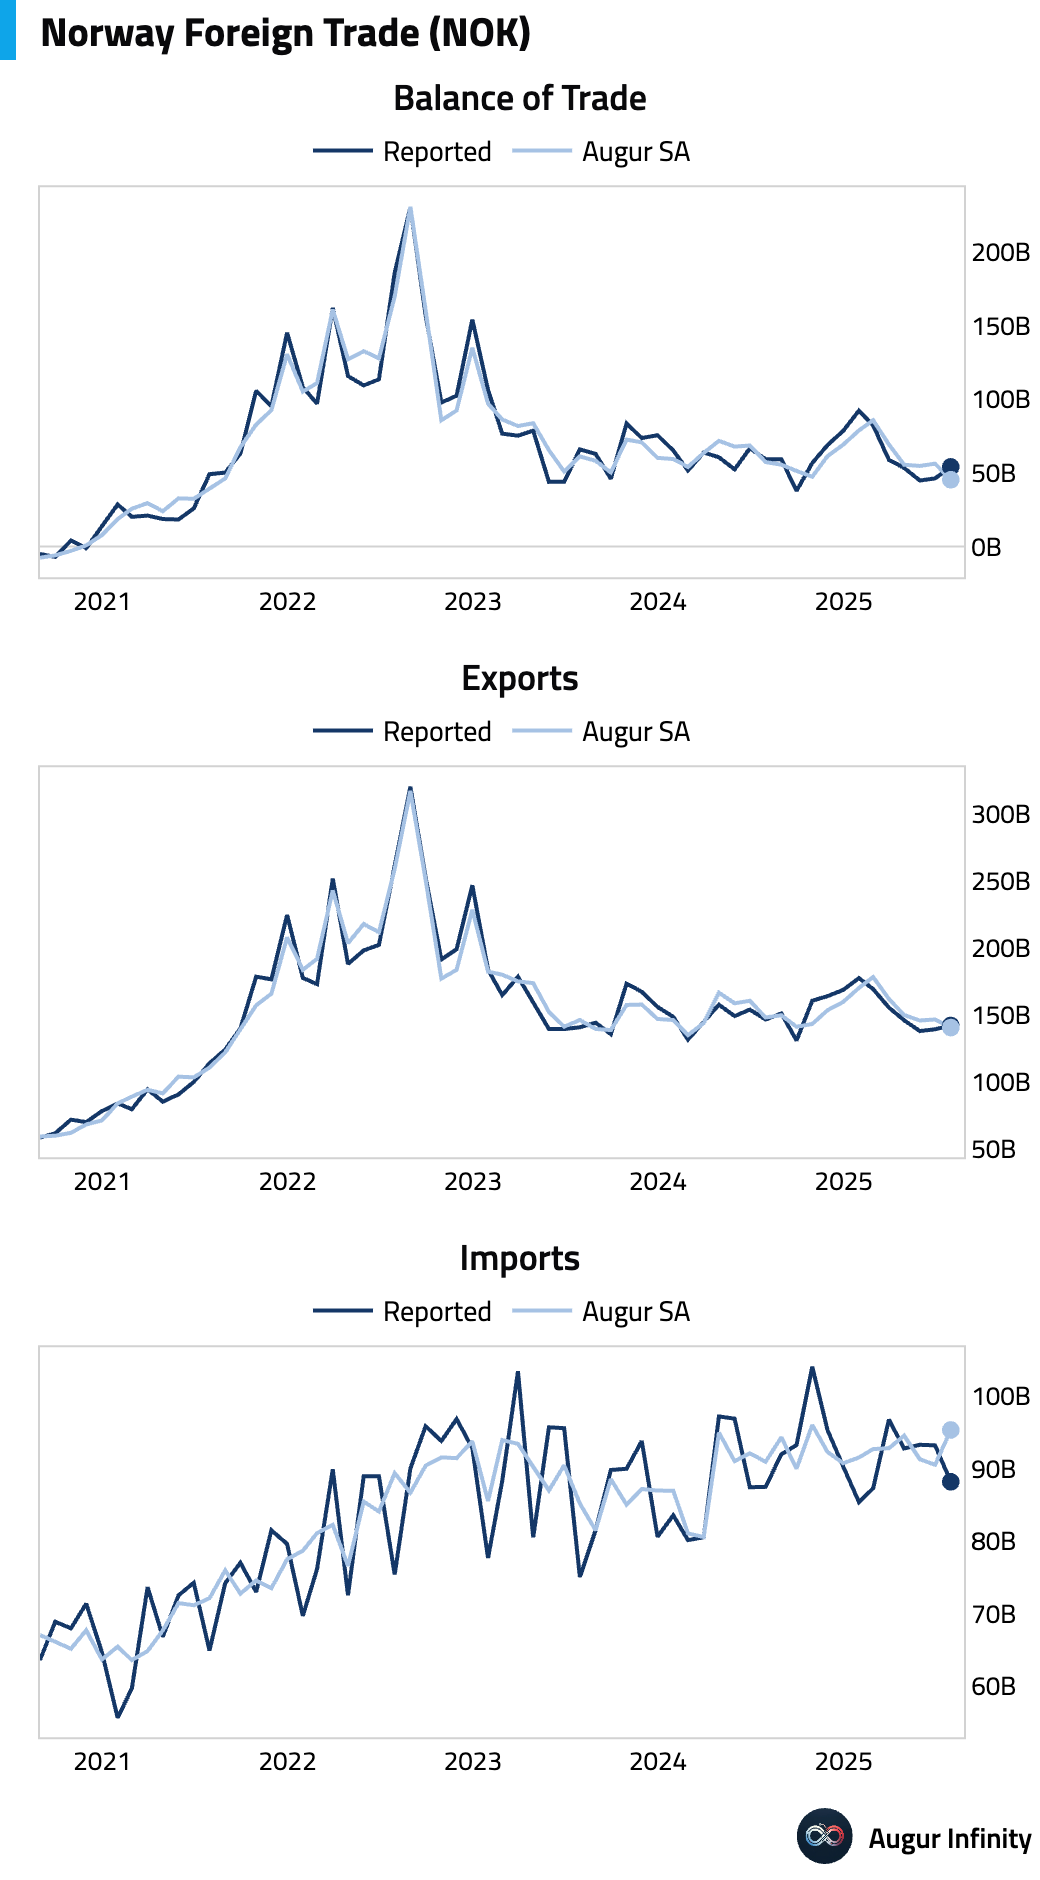
- Norway’s trade surplus widened to 54.0 billion NOK in July from 46.2 billion NOK in the prior month.
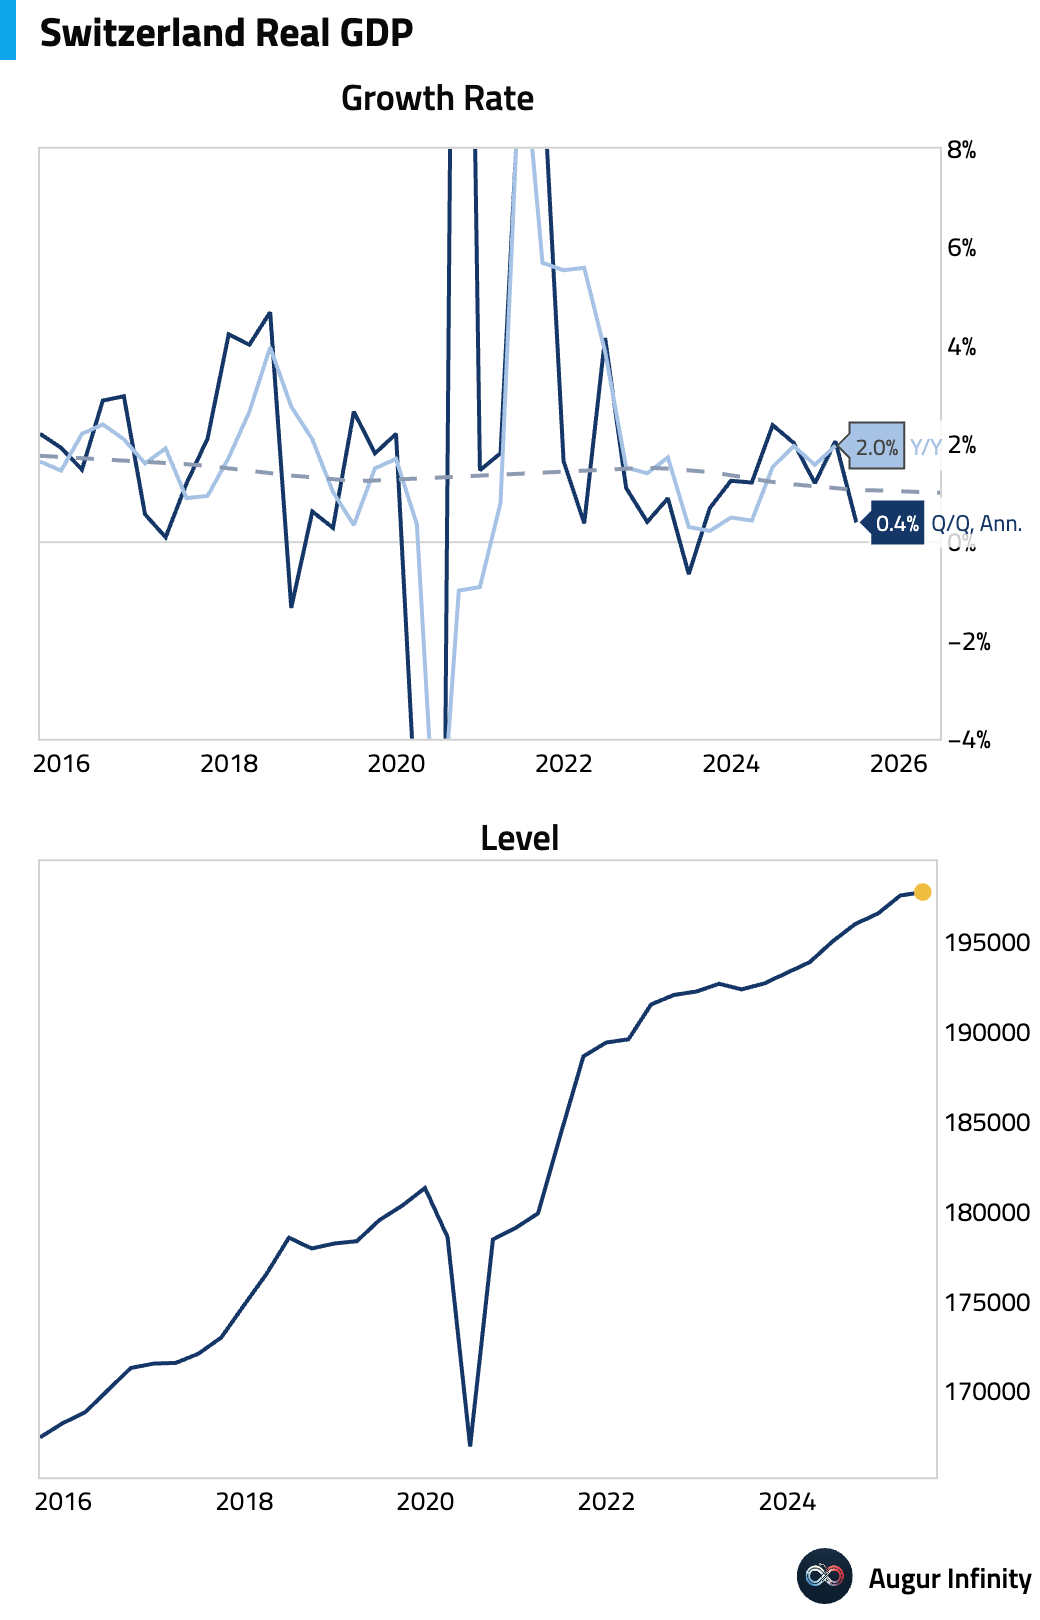
- Switzerland’s economy slowed in the second quarter, with flash GDP expanding just 0.1% Q/Q, a sharp deceleration from the 0.8% growth seen in the first quarter.
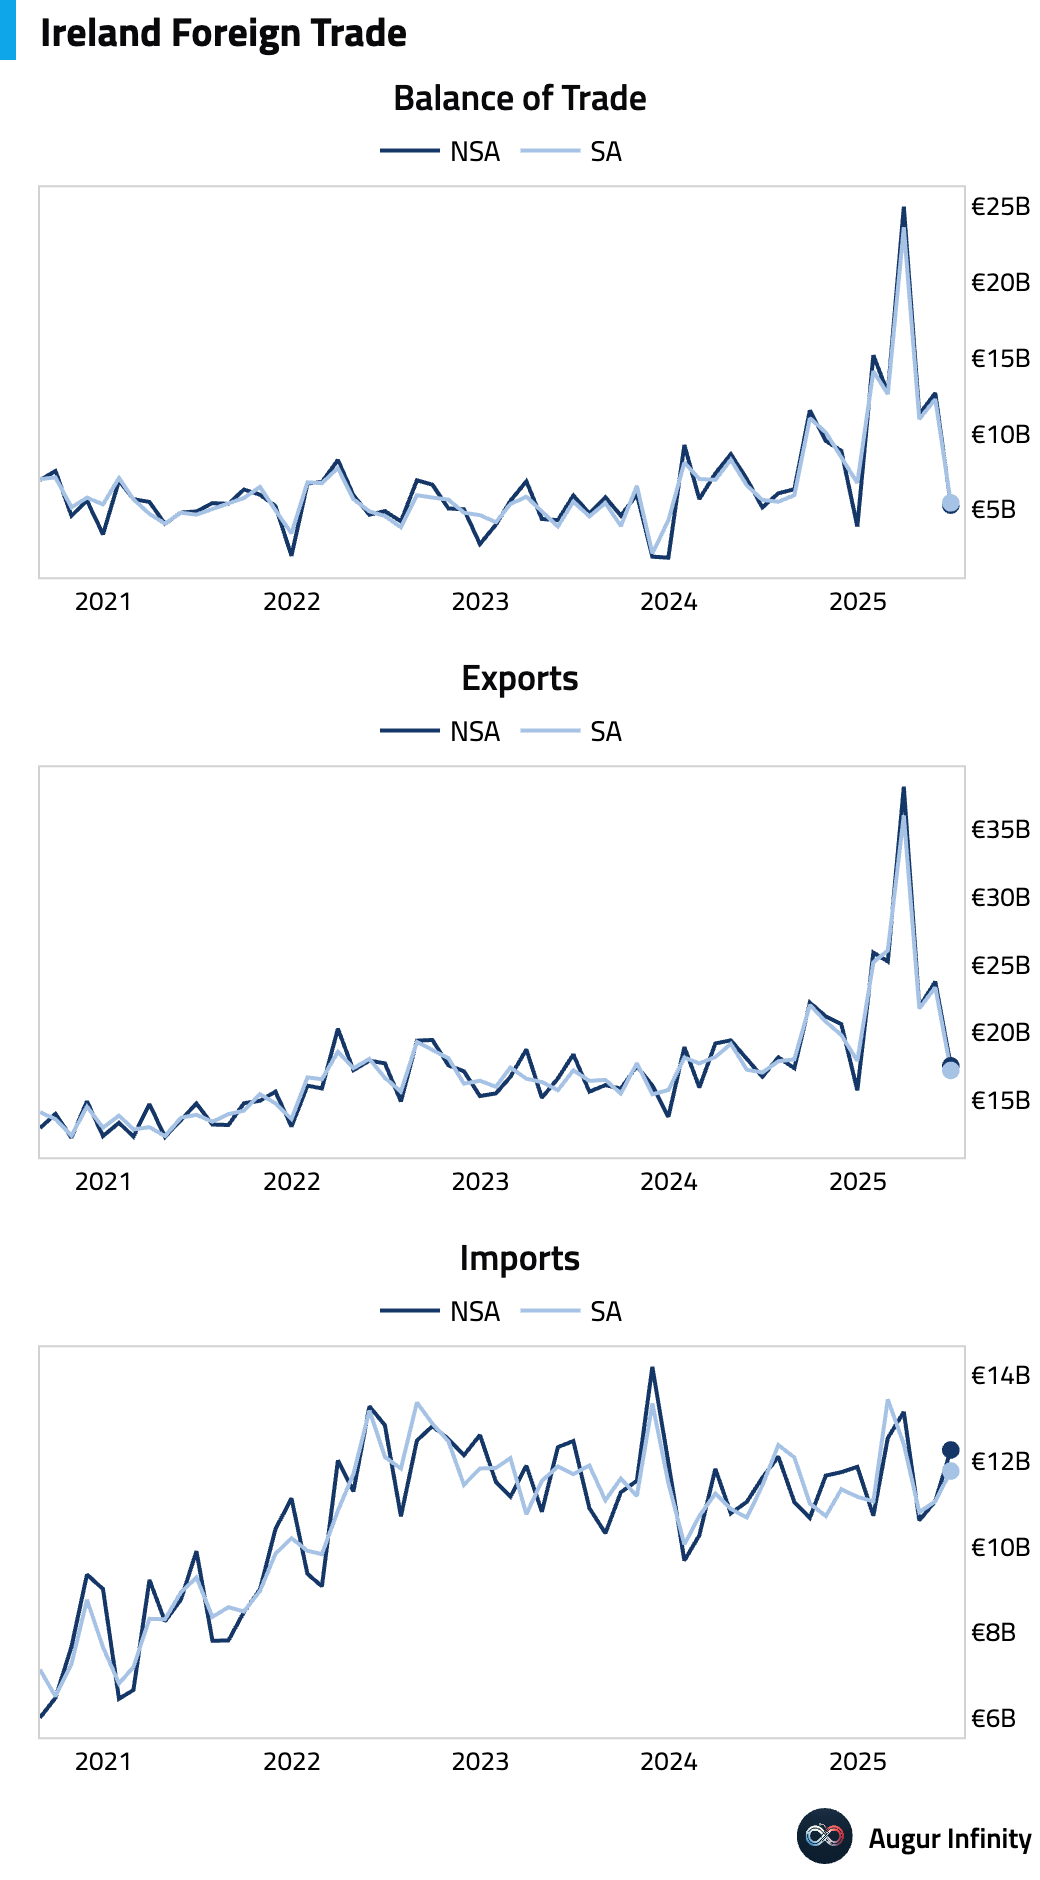
- Ireland’s trade surplus narrowed significantly to €5.3 billion in June from €12.7 billion in May.
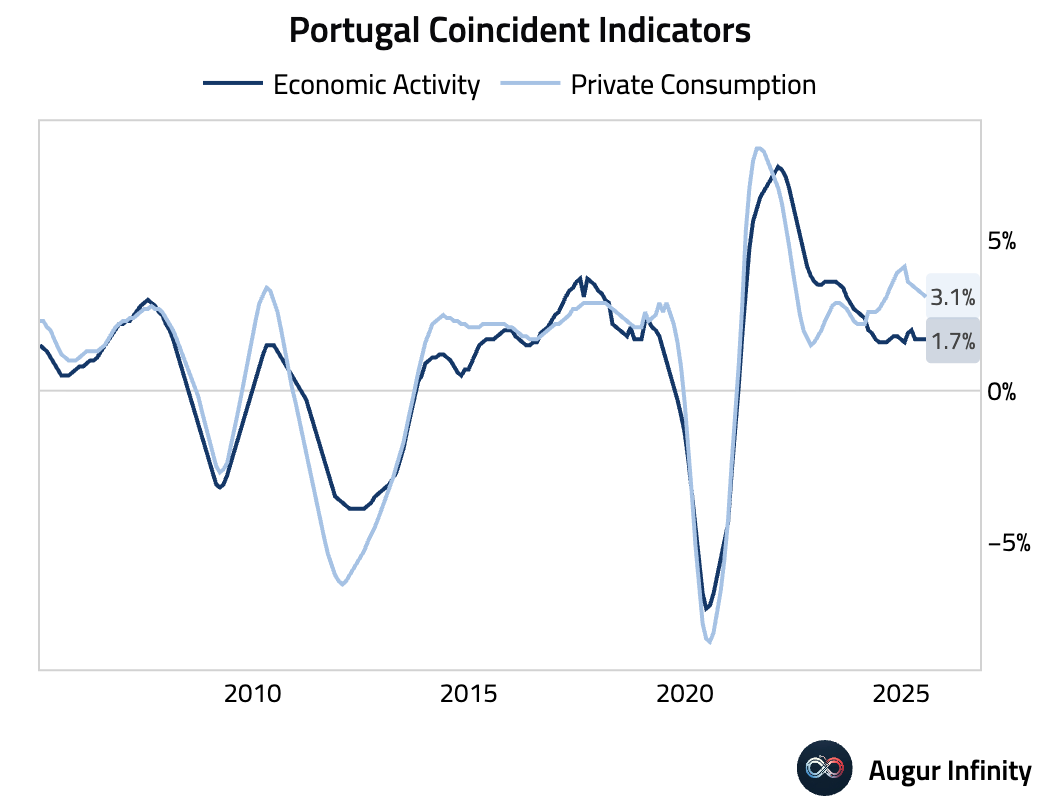
- Portugal’s economic activity and private consumption indicators held steady in July. The economic activity coincident indicator was stable at 1.7% Y/Y, while the private consumption indicator edged down slightly to 3.1% Y/Y from 3.2%.
Asia-Pacific
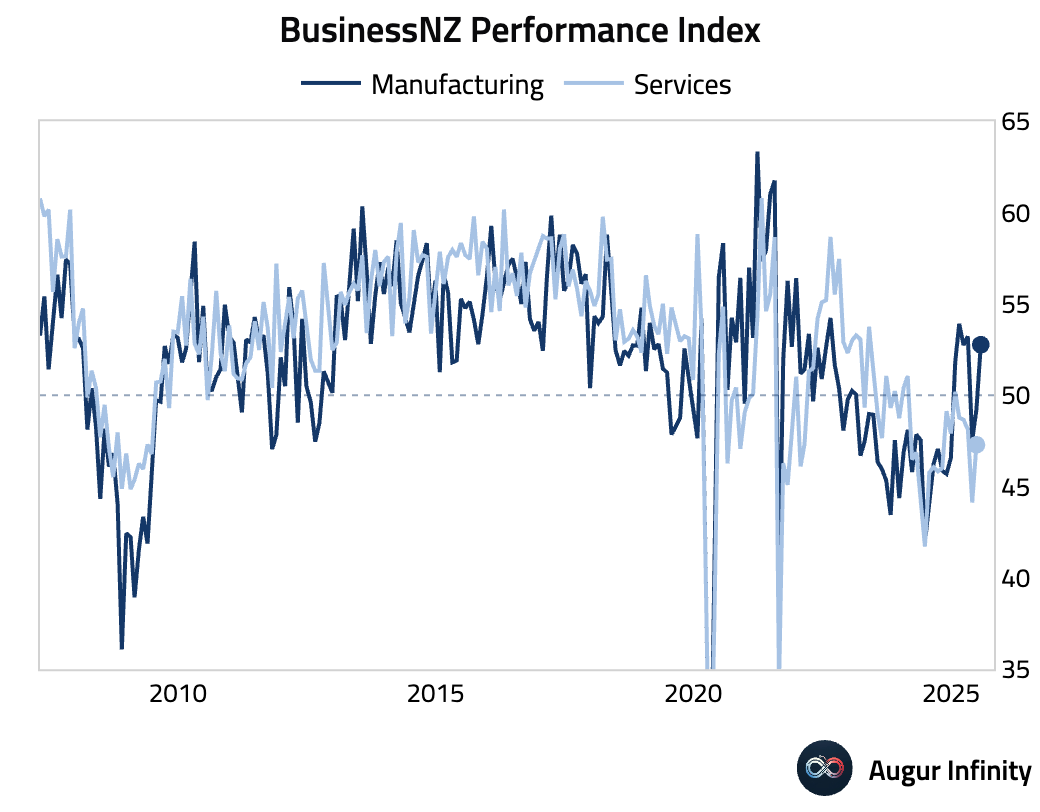
- New Zealand’s Business NZ PMI for July jumped to 52.8 from 48.8, moving back into expansionary territory and reaching its highest level since April.
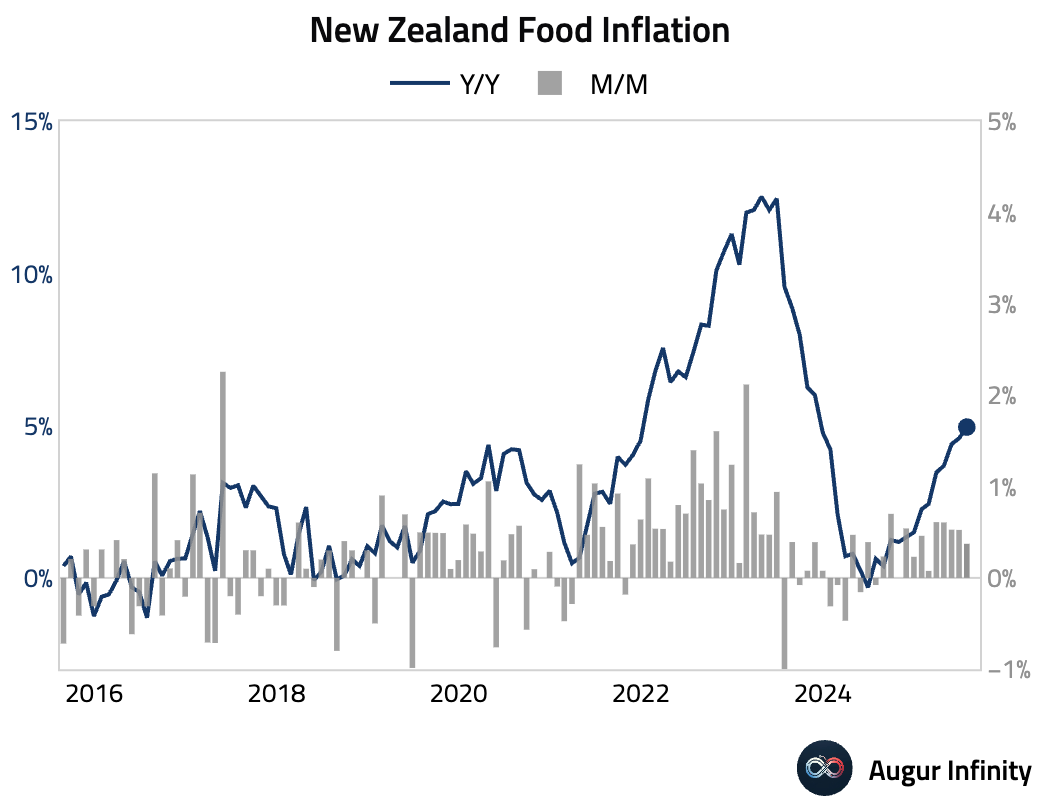
- New Zealand’s food inflation accelerated to 5.0% Y/Y in July from 4.6% in June, reaching its highest level since November 2023.
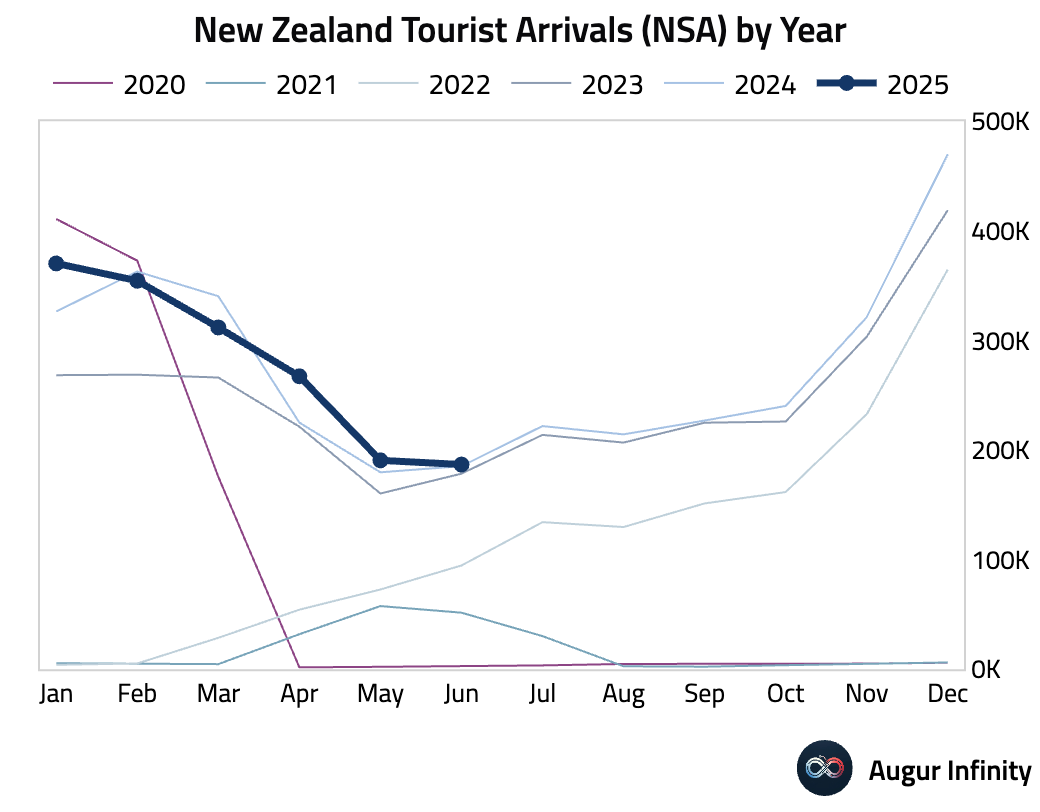
- The growth in New Zealand’s visitor arrivals slowed sharply to 0.8% Y/Y in June from 6.1% in May.
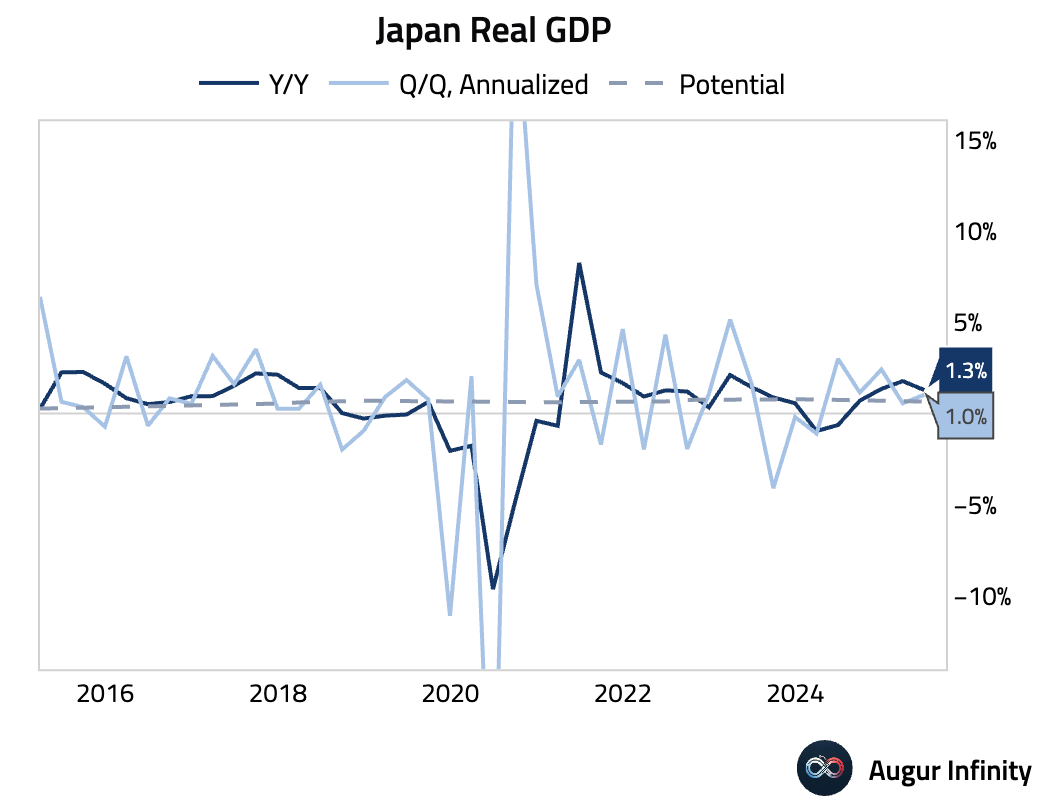
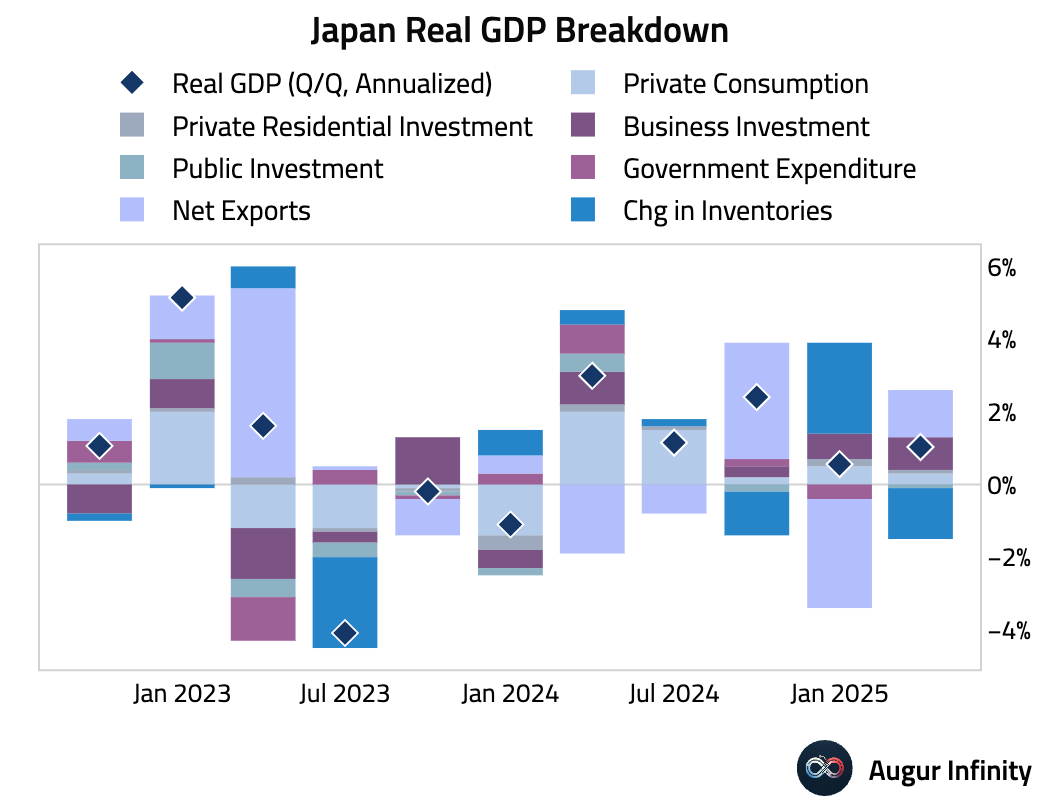
- Japan’s preliminary Q2 GDP growth crushed expectations, expanding 1.0% annualized versus a consensus of 0.4%. The quarter-over-quarter rate was 0.3% against a 0.1% forecast. The beat was driven by accelerating capital expenditure (+5.5% annualized) and a surge in exports (+8.4%), primarily from IT goods. This underlying strength was masked by a large inventory drawdown, which subtracted 1.4 percentage points from growth. Private consumption grew at a modest 0.2% Q/Q.
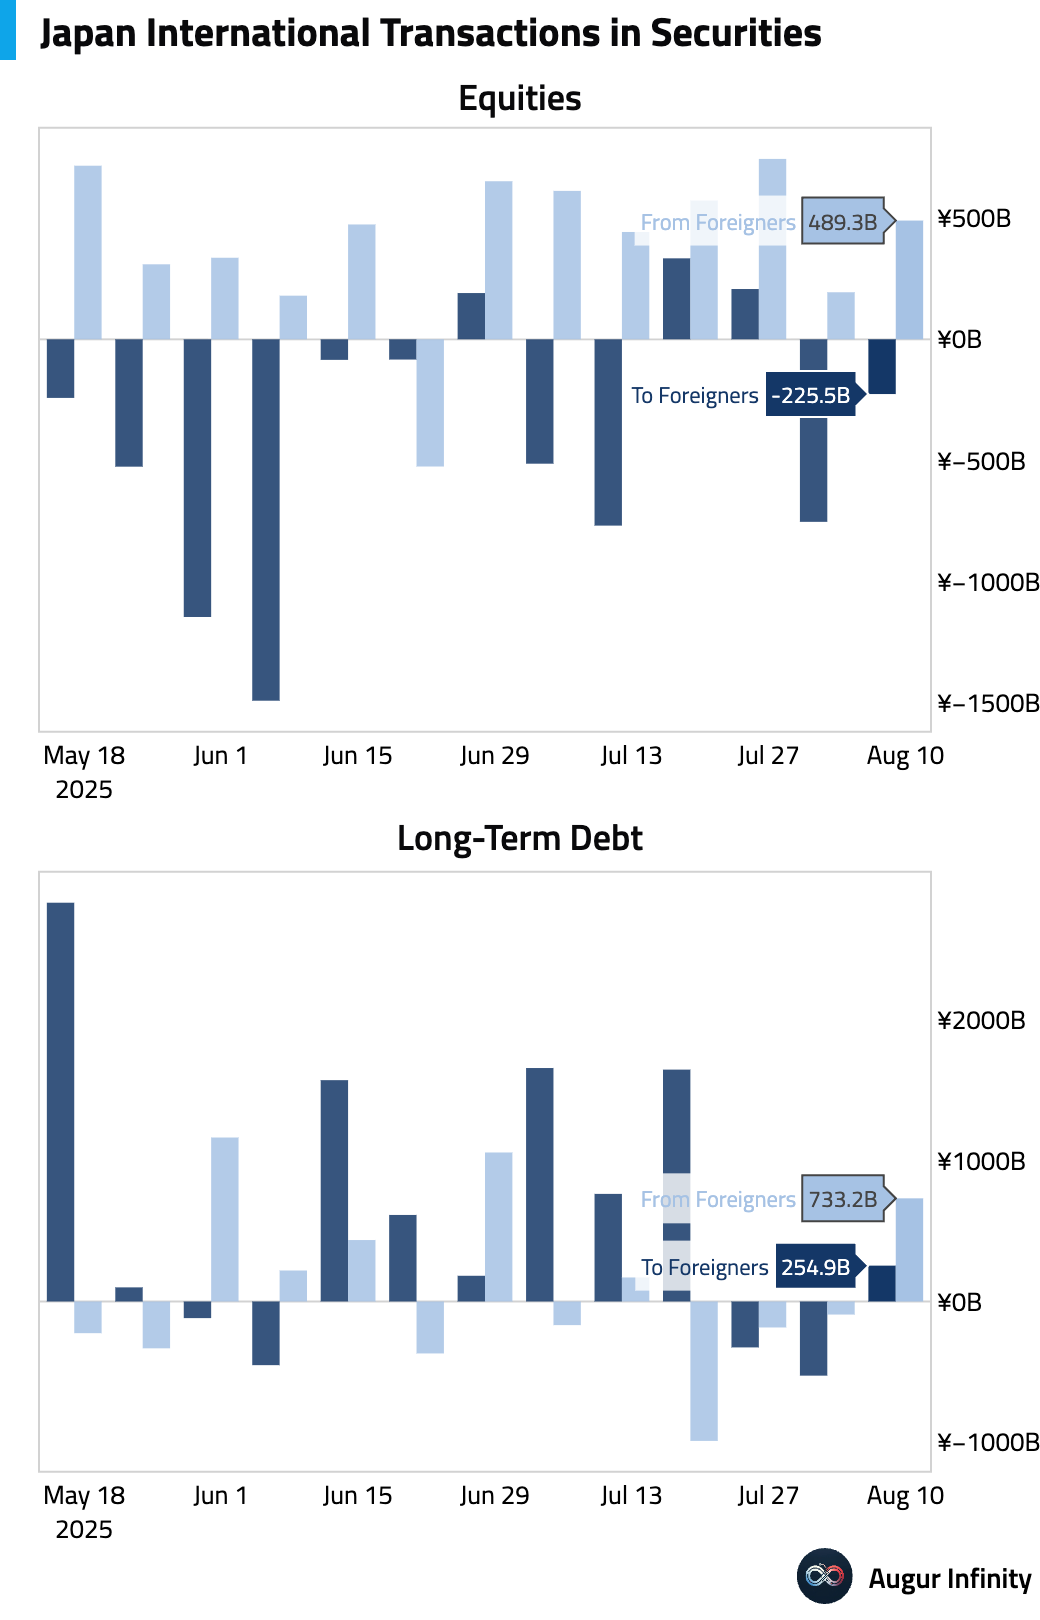
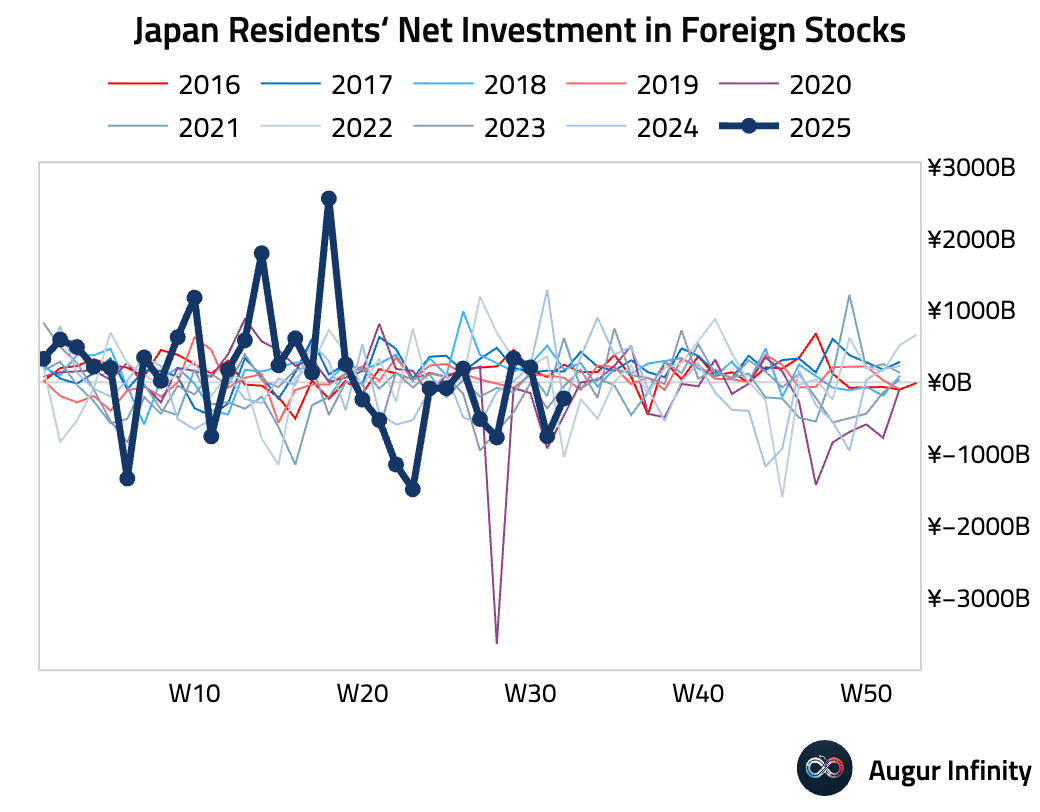
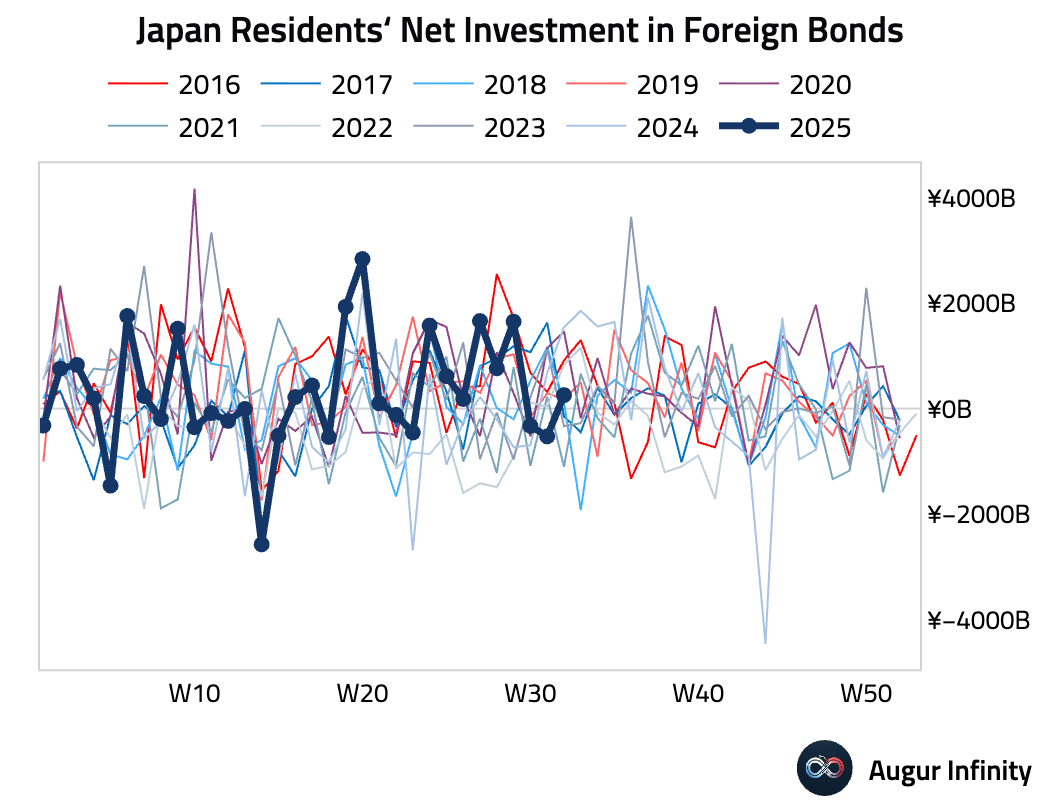
- For the week ending August 9, foreign investors were net buyers of Japanese stocks (¥489.3 billion), while Japanese investors became net buyers of foreign bonds (¥254.9 billion).
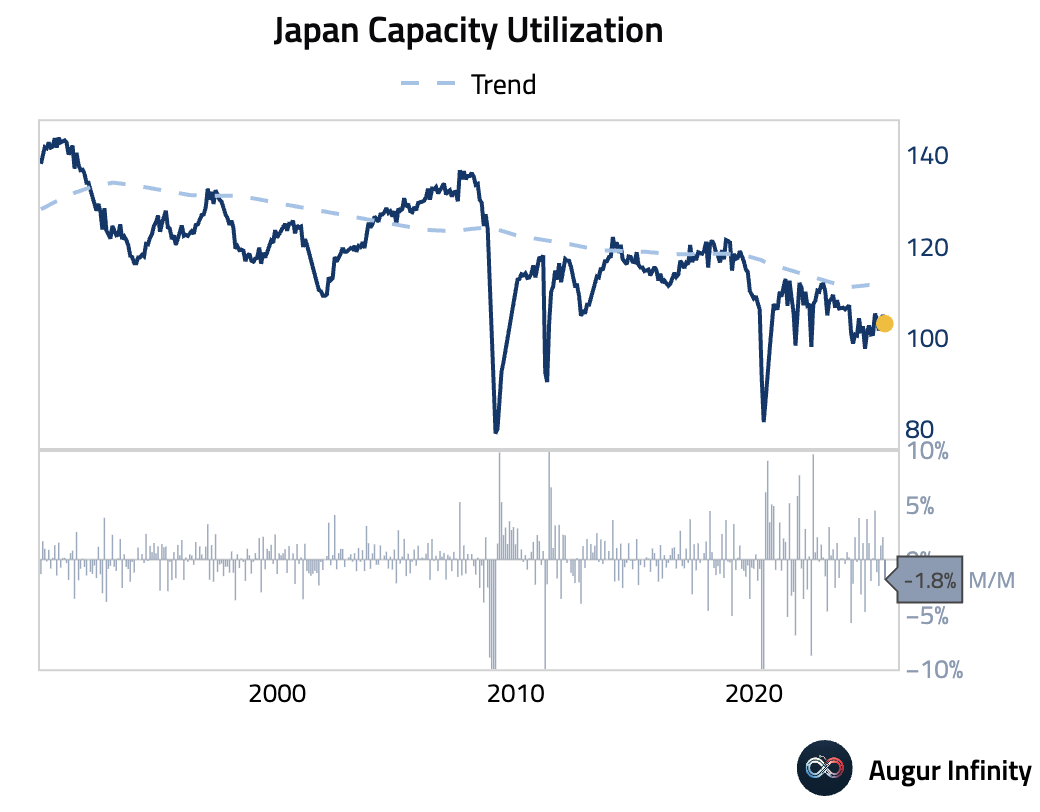
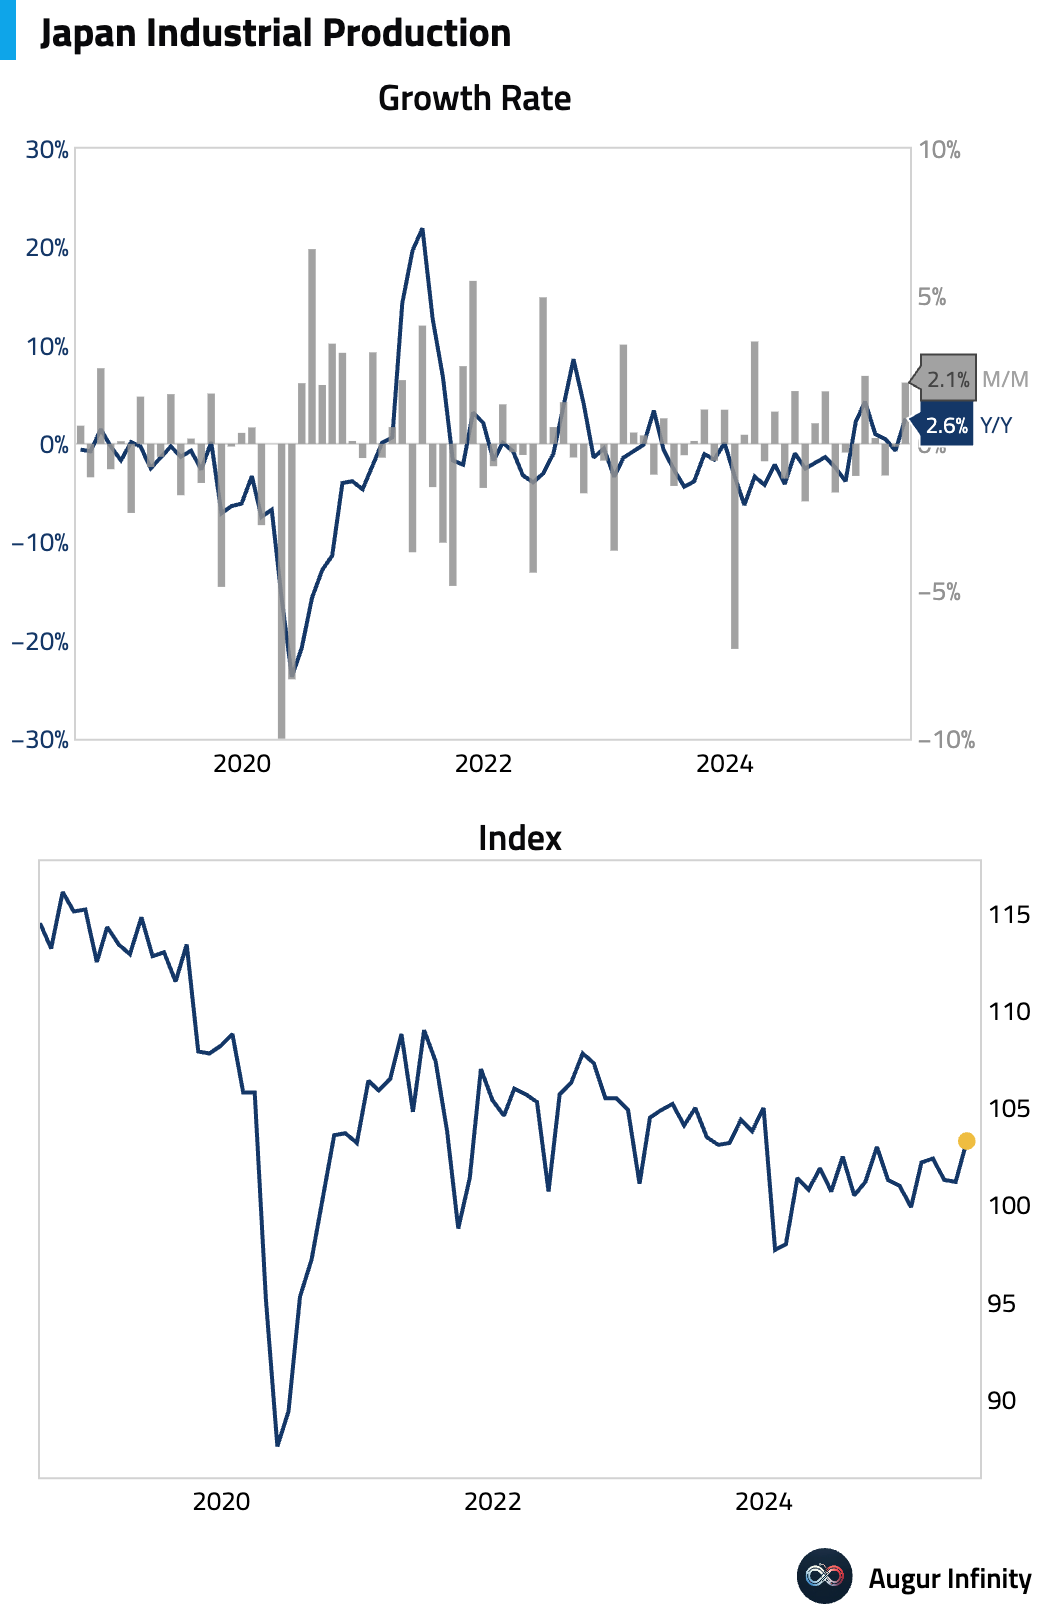
- Japan’s final industrial production for June was revised higher to 2.1% M/M from a preliminary 1.9%, while the year-over-year figure was 2.6%. Capacity utilization fell 1.8% M/M.
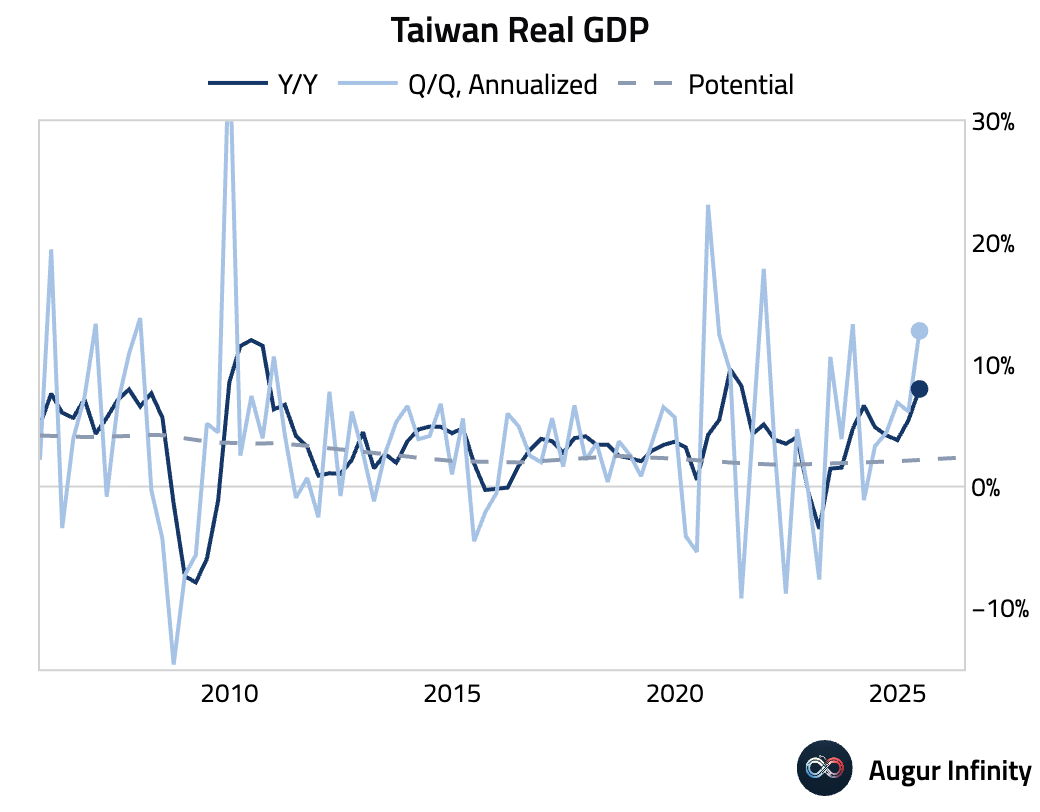
- Taiwan’s final Q2 GDP growth was revised slightly lower to 8.01% Y/Y from a preliminary 8.03%, but remains at its highest level since Q2 2021.
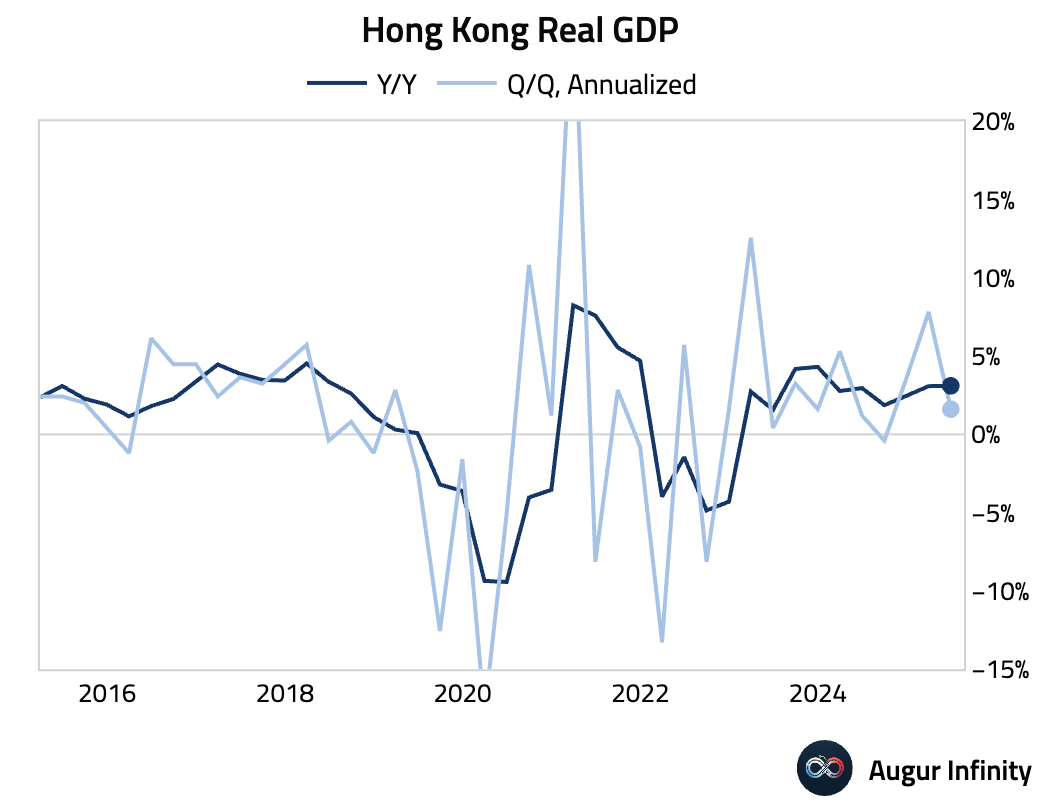
- Hong Kong’s final Q2 GDP was confirmed at 0.4% Q/Q and 3.1% Y/Y, matching preliminary estimates.
China
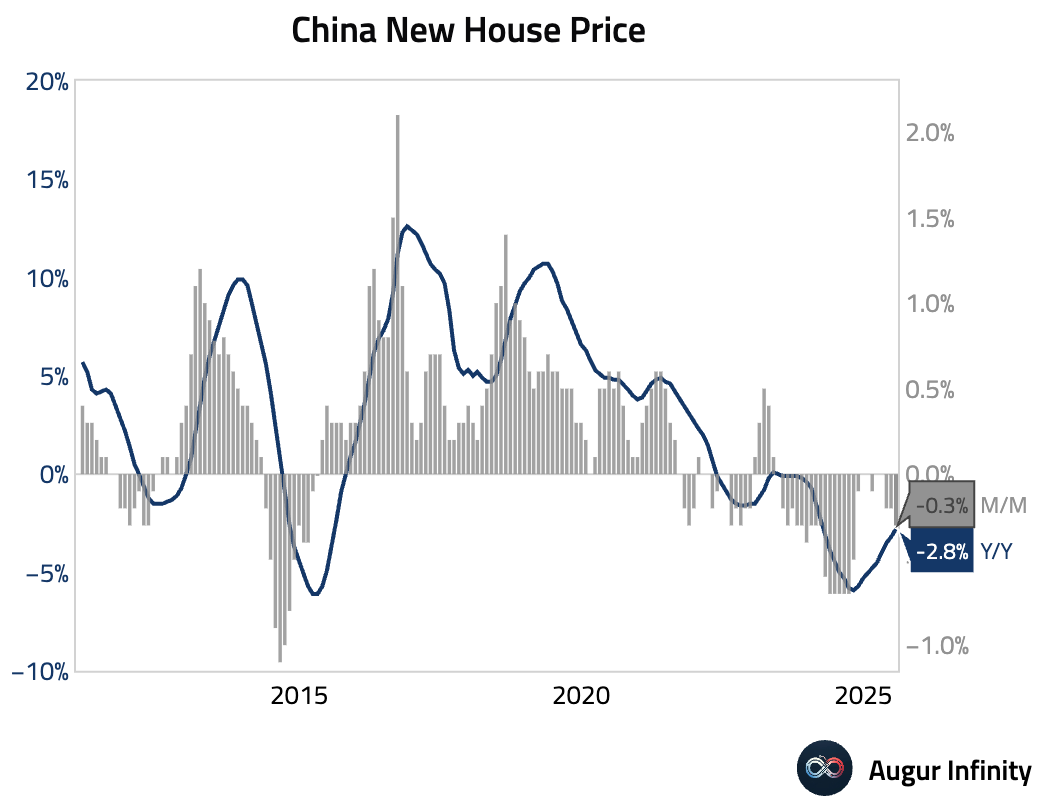
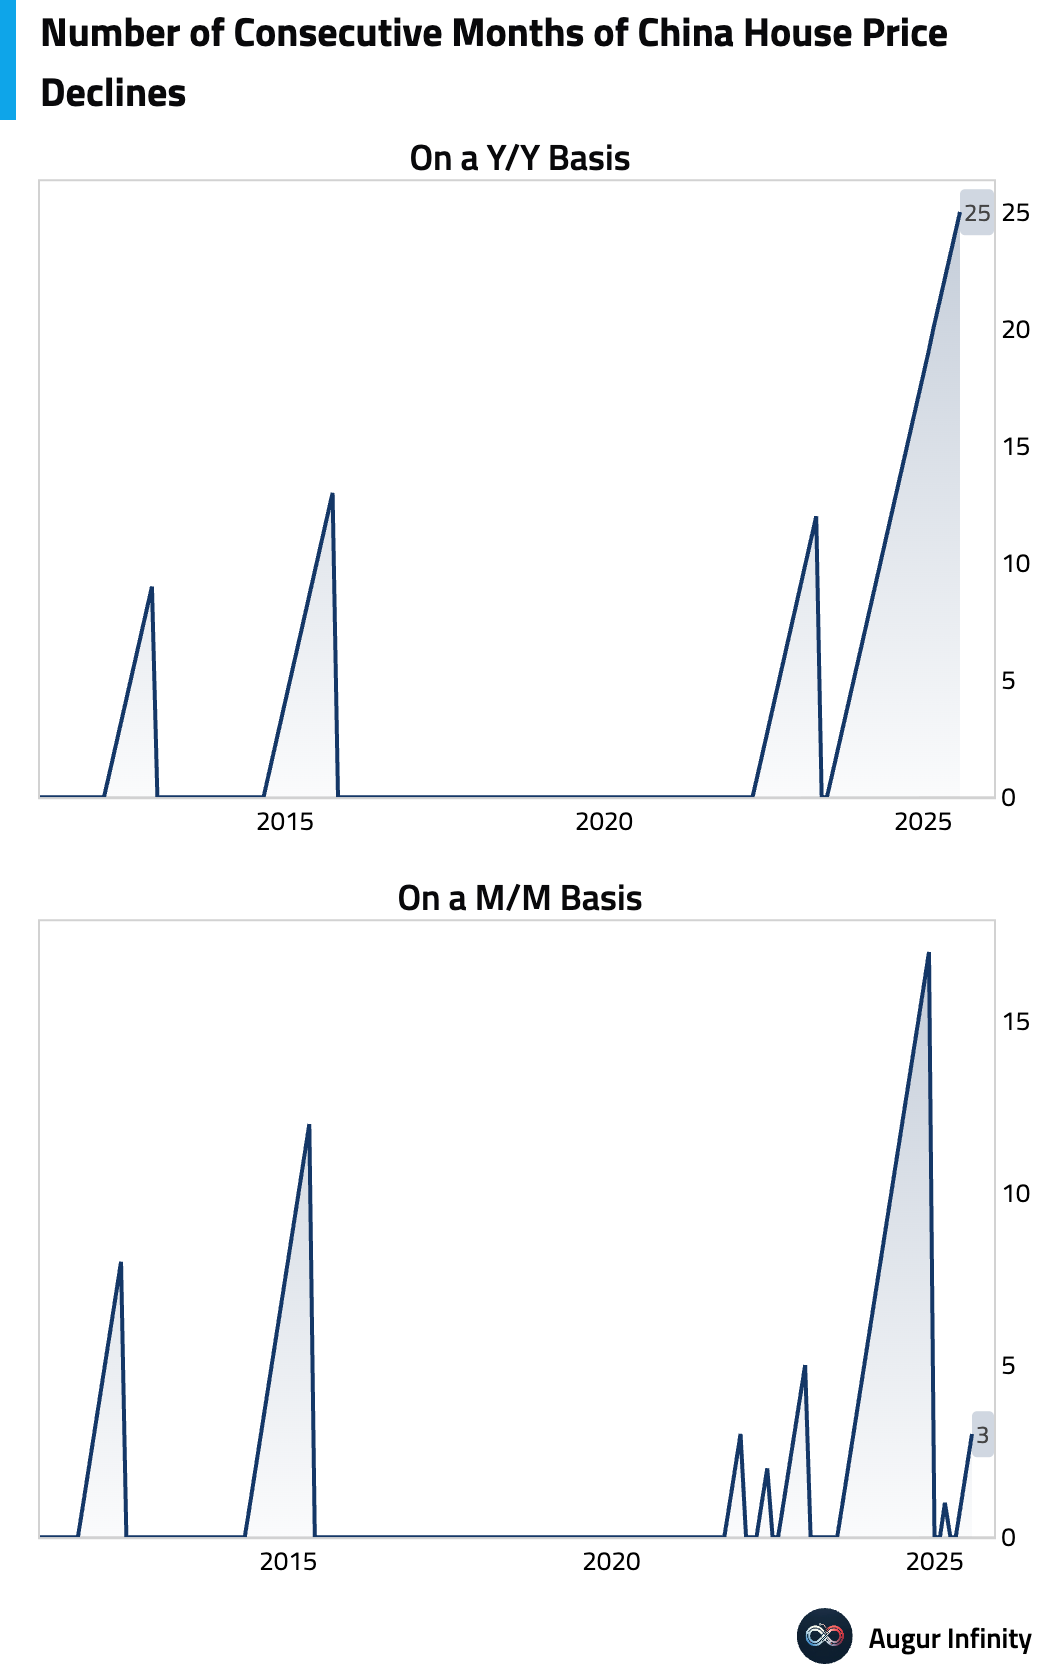
- The decline in China's new home prices moderated slightly in July, falling 2.8% Y/Y compared to -3.2% in June. A stark divergence continues, with Tier-1 city prices rising while Tier-2 and Tier-3 cities kept falling due to weaker fundamentals and oversupply. Secondary market data from other sources points to much steeper year-over-year price declines of 5–20%.
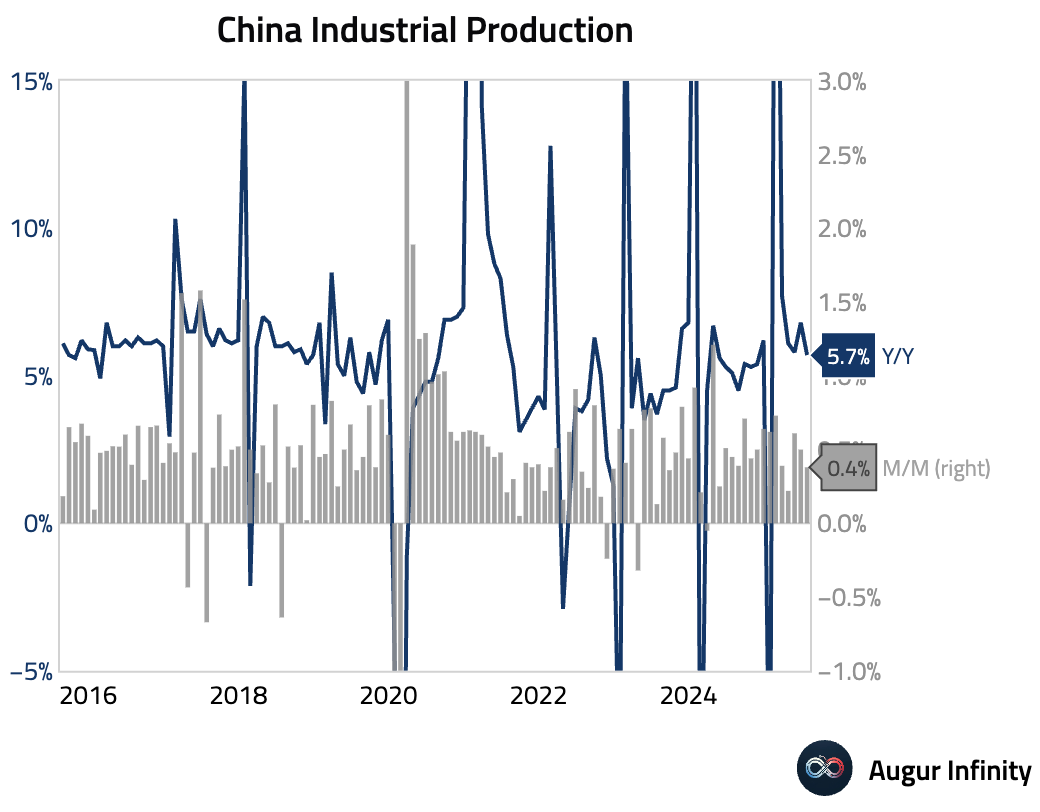
- July’s activity data broadly weakened and missed expectations. Industrial production grew 5.7% Y/Y, below the 5.9% consensus. The slowdown occurred despite strong exports and was driven by weakness in autos, computers, and non-ferrous metals. Sequentially, estimates show a 0.4% M/M growth, weaker than the previous two months.
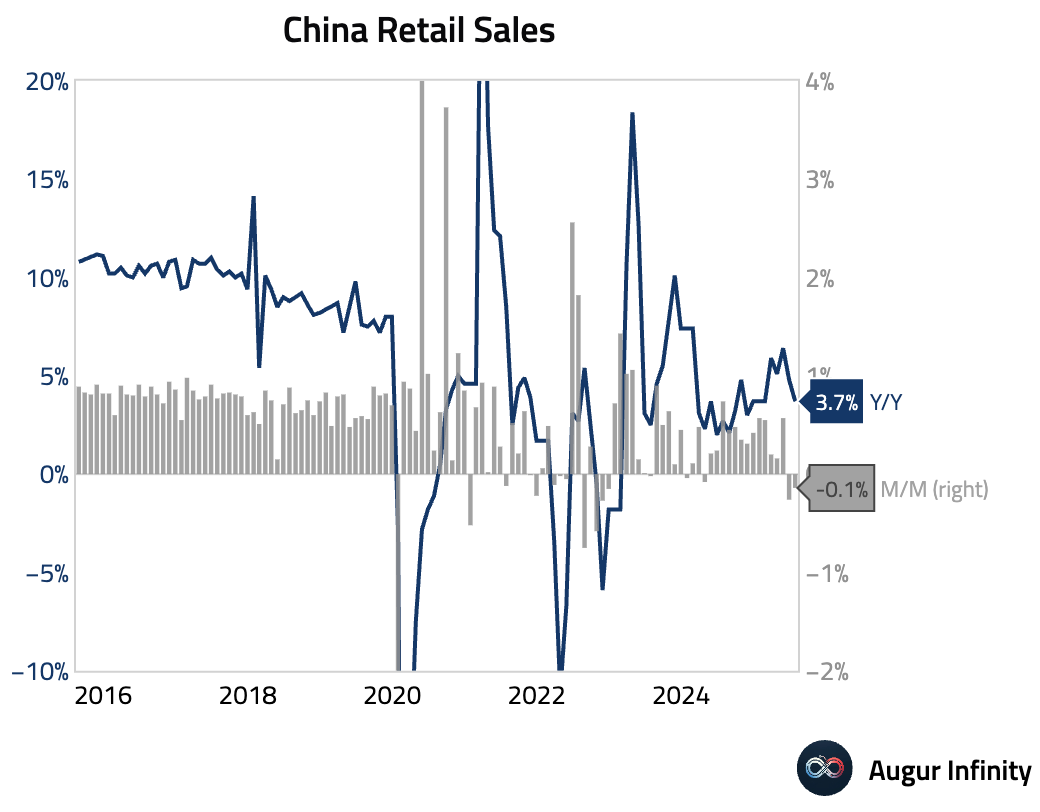
- Retail sales growth slowed to 3.7% Y/Y in July, significantly missing the 4.6% consensus and down from 4.8% in June. The weakness was led by falling offline goods and a 1.5% Y/Y drop in automobile sales, partly due to smaller dealer discounts. Sequentially, retail sales declined by a second month by 0.1% M/M. The print signals subdued private demand.
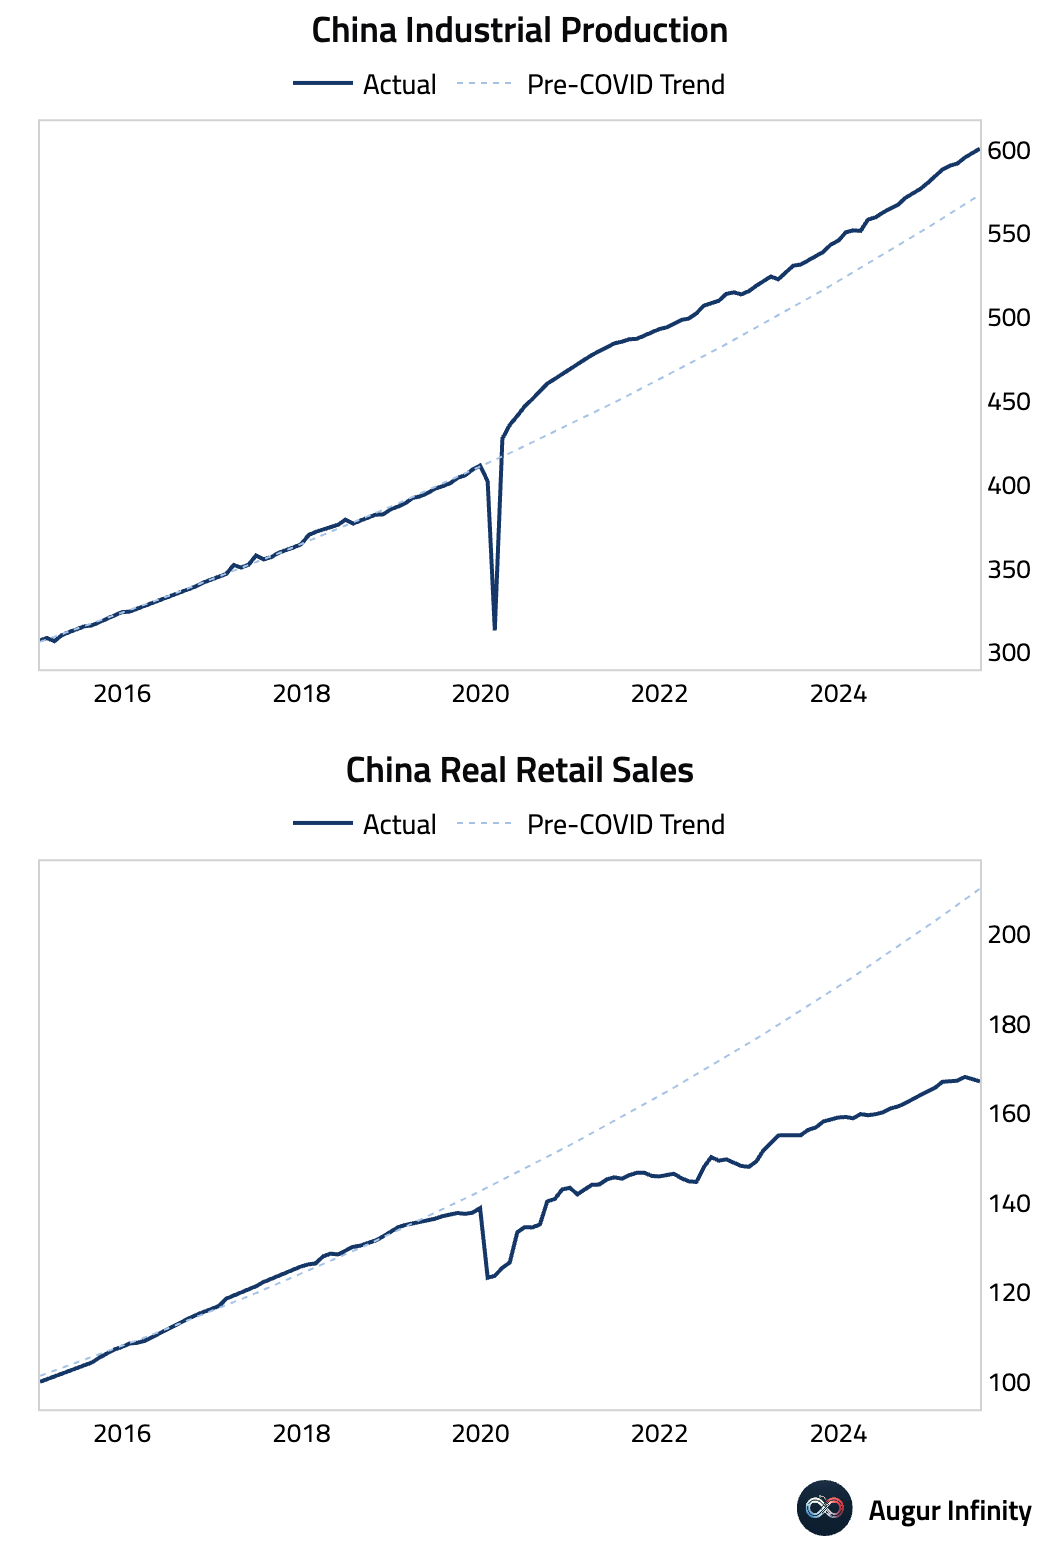
- While China's industrial production continues to run well above the pre-COVID trend, real retail sales have diverged further away from the pre-COVID trend.
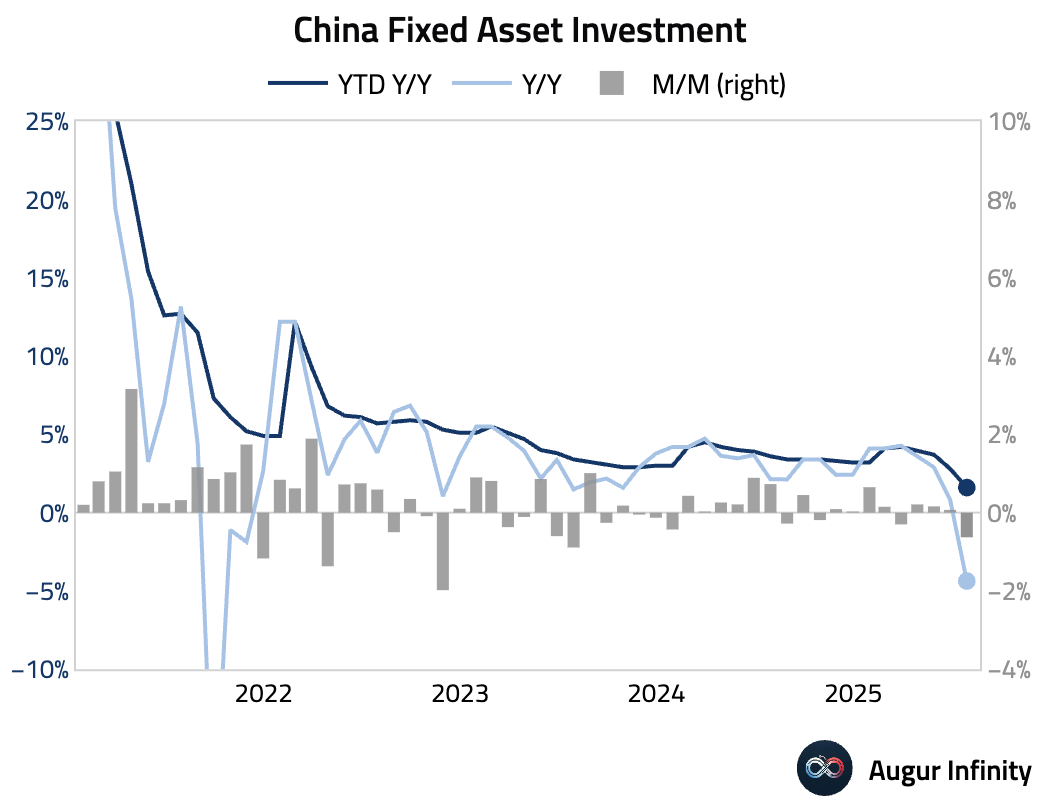
- Fixed asset investment (year-to-date) slowed to 1.6% Y/Y, missing the 2.7% consensus and falling to its slowest pace since September 2020. Estimates for single-month growth suggest a startling -4.4% Y/Y decline, the worst since COVID lockdown. The broad-based weakness was driven by adverse weather hitting construction, the ongoing property crisis, and reduced infrastructure spending.
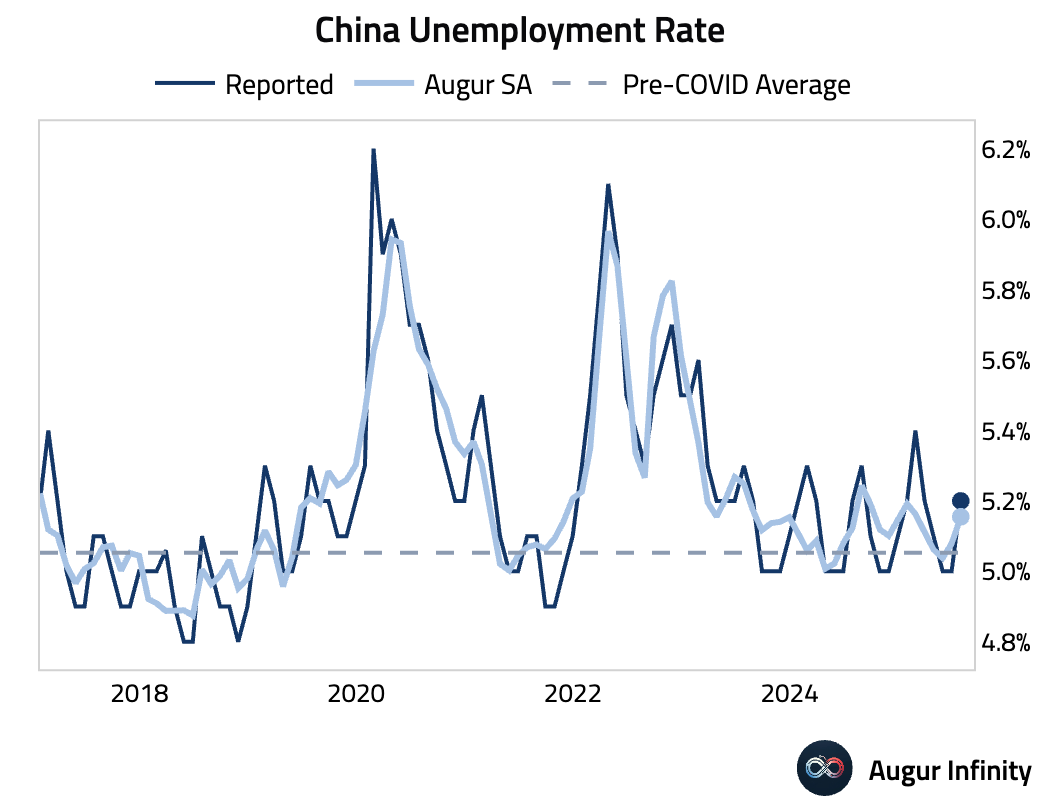
- The nationwide unemployment rate rose to 5.2% in July from 5.0%. The release of the youth unemployment rate has been delayed.
Emerging Markets ex China
- India’s passenger vehicle sales returned to growth in July, rising 1.5% Y/Y after a 6.3% decline in June.

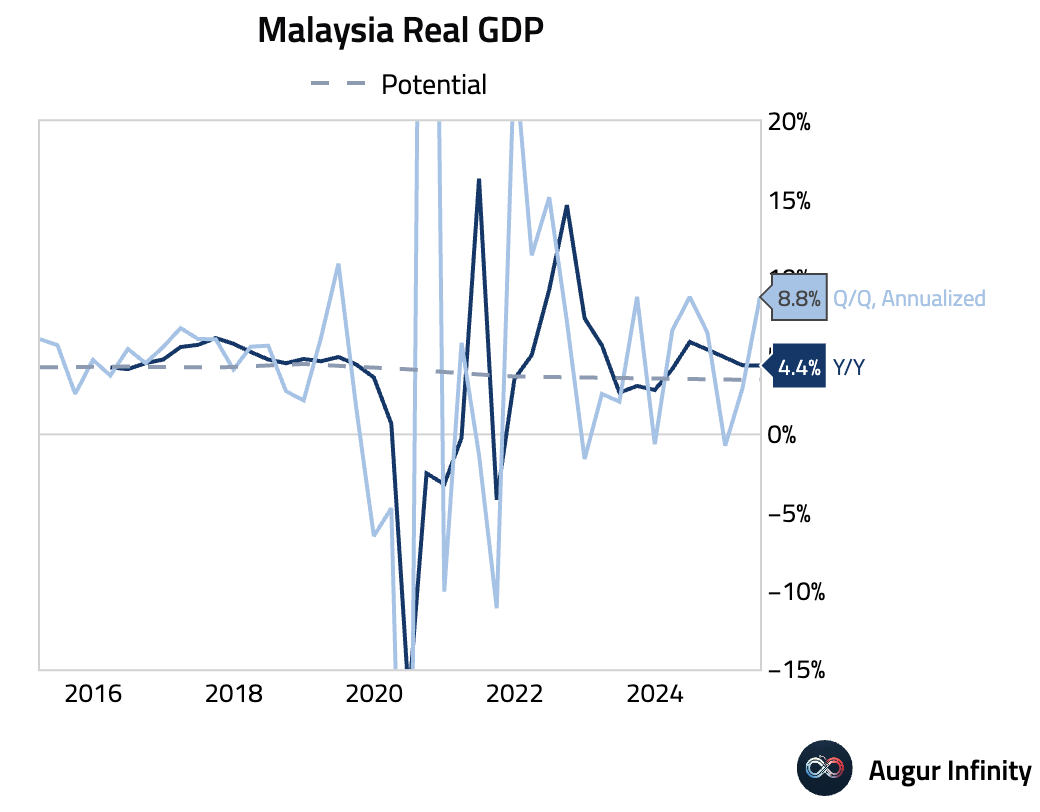
- Malaysia's economy expanded 2.1% Q/Q in the second quarter, accelerating from 0.7% growth in Q1. The year-over-year rate held steady at 4.4%.
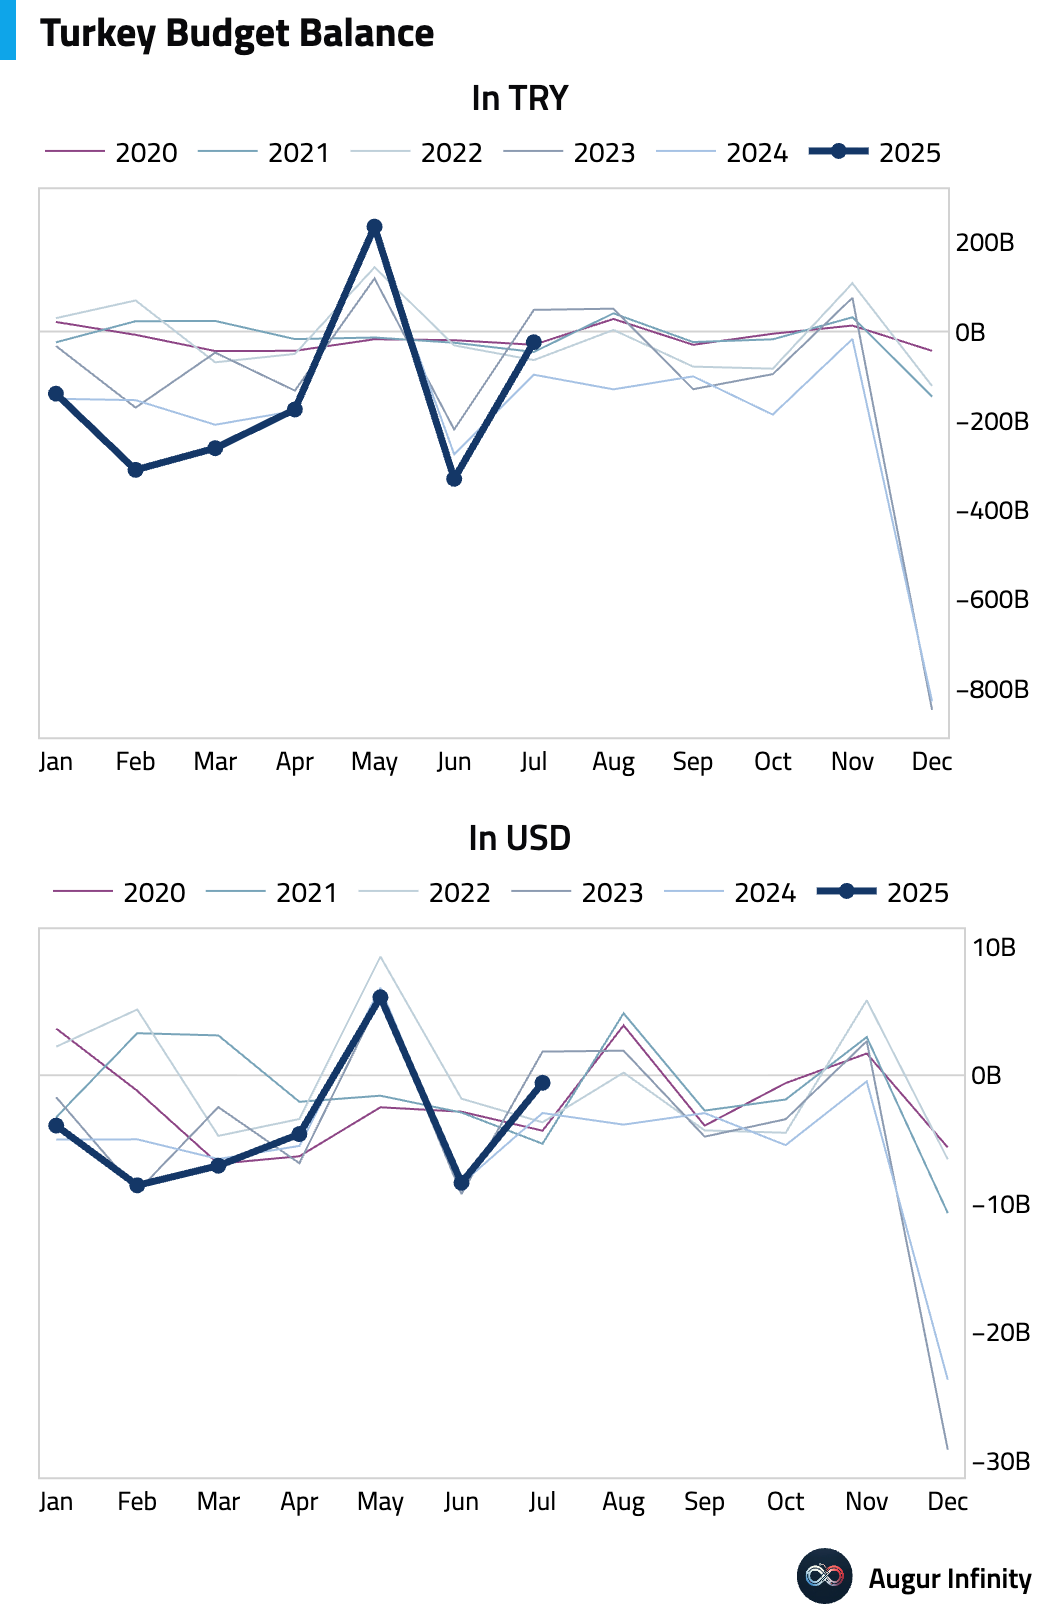
- Turkey's government budget balance recorded a deficit of 23.9 billion TRY in July.
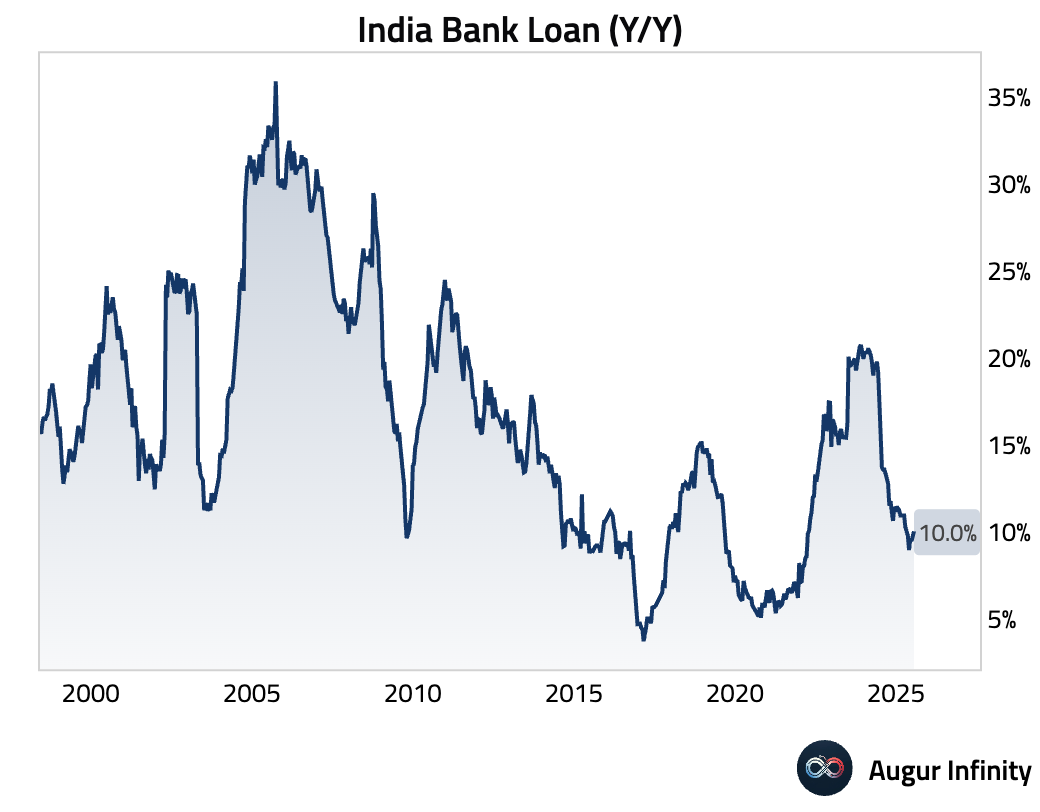
- Indian bank loan growth ticked up to 10.0% Y/Y in the last week of July from 9.8% previously.
- India's foreign exchange reserves rose to $693.62 billion in the week ending August 8 from $688.87 billion in the prior week.
Global Markets
Equities
- US equity markets finished lower, with the major indices declining 0.29% and the Nasdaq falling 0.4%. European markets showed strength, as France (+0.9%) and Germany (+0.2%) both posted their fourth consecutive day of gains. Among emerging markets, Brazil was a notable outperformer, rising 1.0%.
Fixed Income
- US Treasury yields rose across the curve in a bear-steepening move. The 30-year yield saw the largest increase, climbing 3.9 bps, while the 10-year yield rose 3.4 bps. On the front end, the 2-year yield was higher by 2.1 bps.
FX
- The US dollar was mixed against its G10 counterparts. The Euro and the Swedish Krona were the strongest performers, both gaining 0.3% against the greenback. The Japanese Yen also advanced, rising 0.2%. The Canadian and New Zealand dollars were among the laggards, both weakening by 0.1%.
Disclaimer
Augur Digest is an automatically generated newsletter edited by humans. It may contain inaccuracies and is not investment advice. Augur Labs LLC will not accept liability for any loss or damage as a result of your reliance on the information contained in the newsletter.