Note: This is the August Digest Flash—an early look at today’s economic developments. The full edition will be released at 4 p.m.
Global Economics
United States
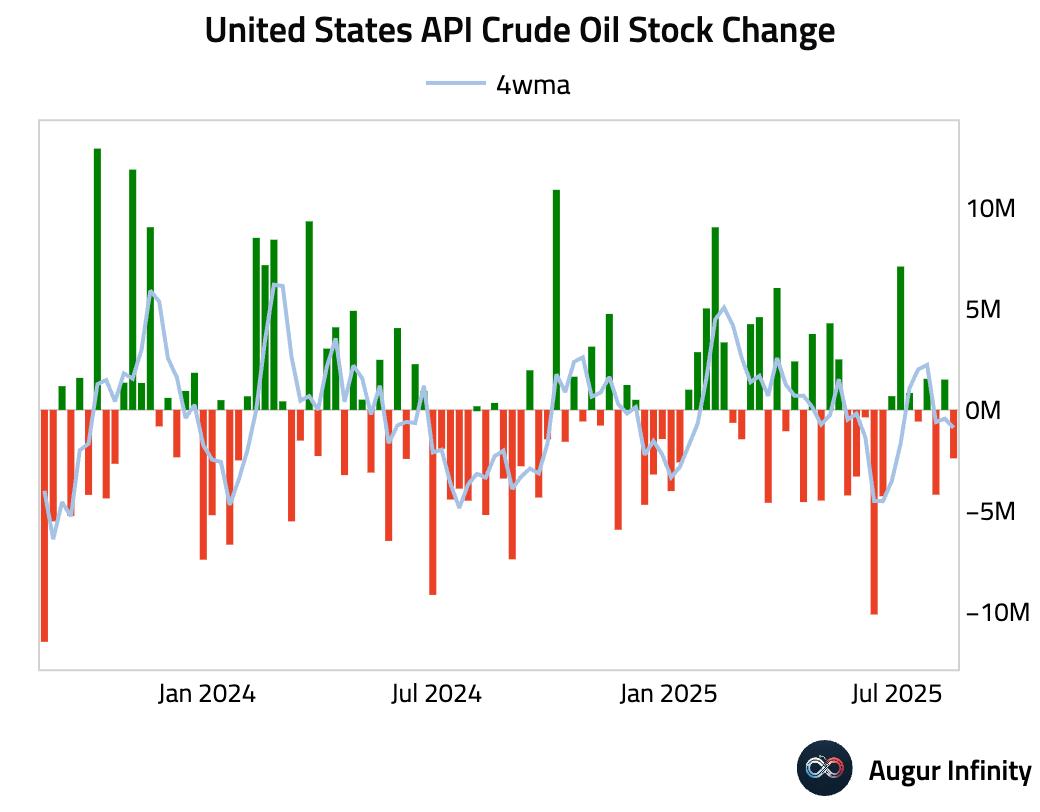
- API data showed a crude oil stock drawdown of 2.4 million barrels for the week, a larger draw than the 1.2 million consensus estimate and a reversal from the prior week’s 1.5 million barrel build.
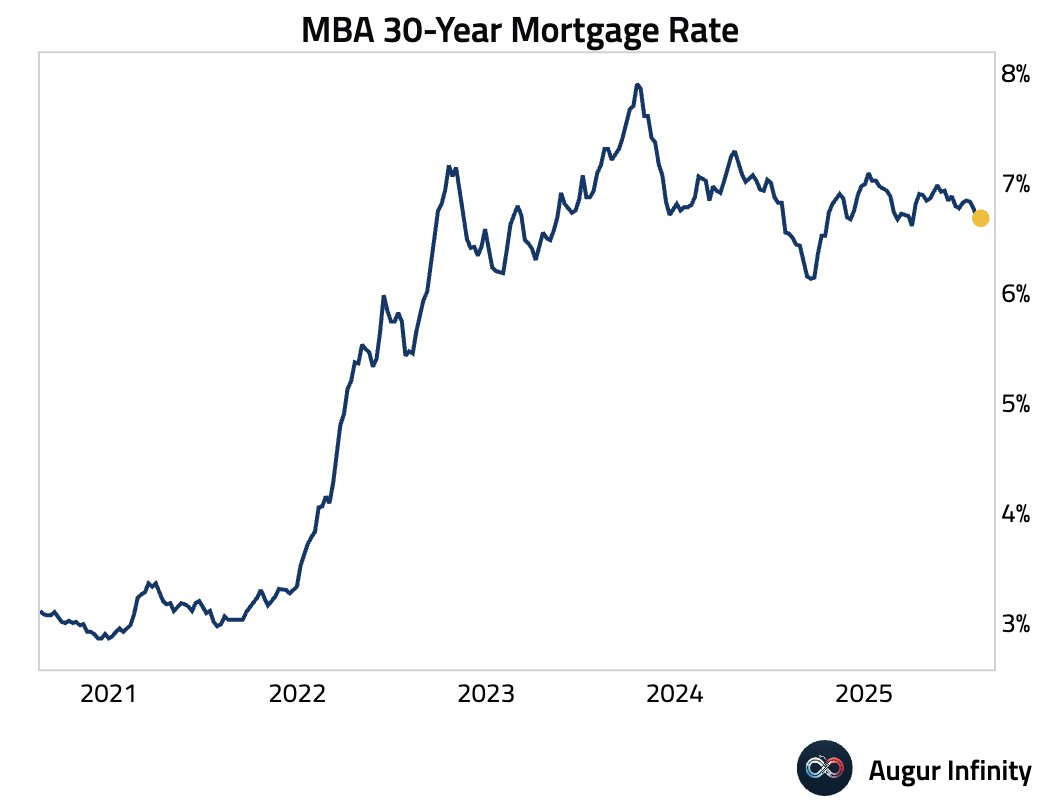
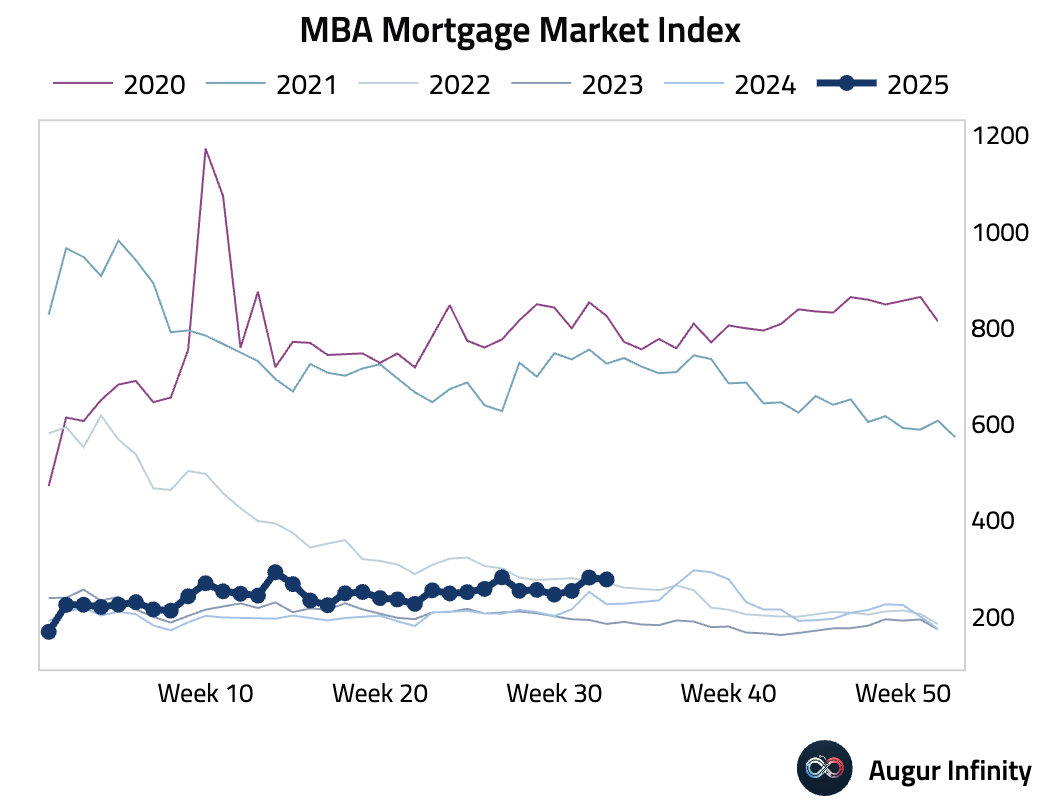
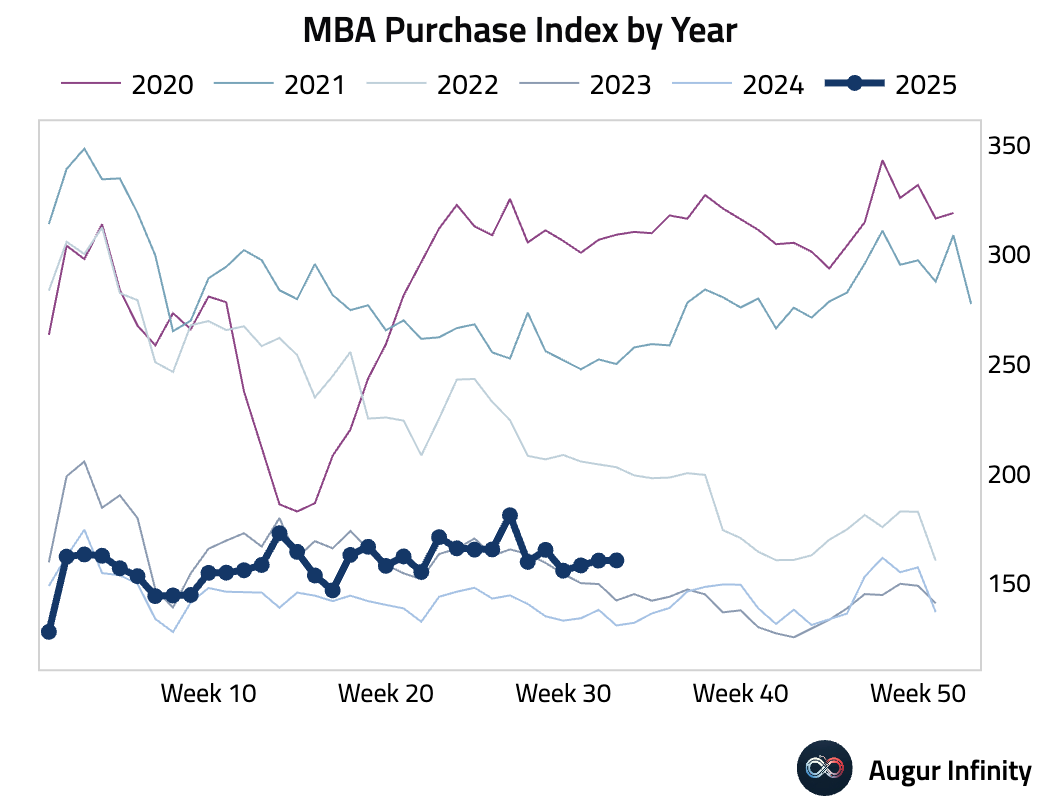
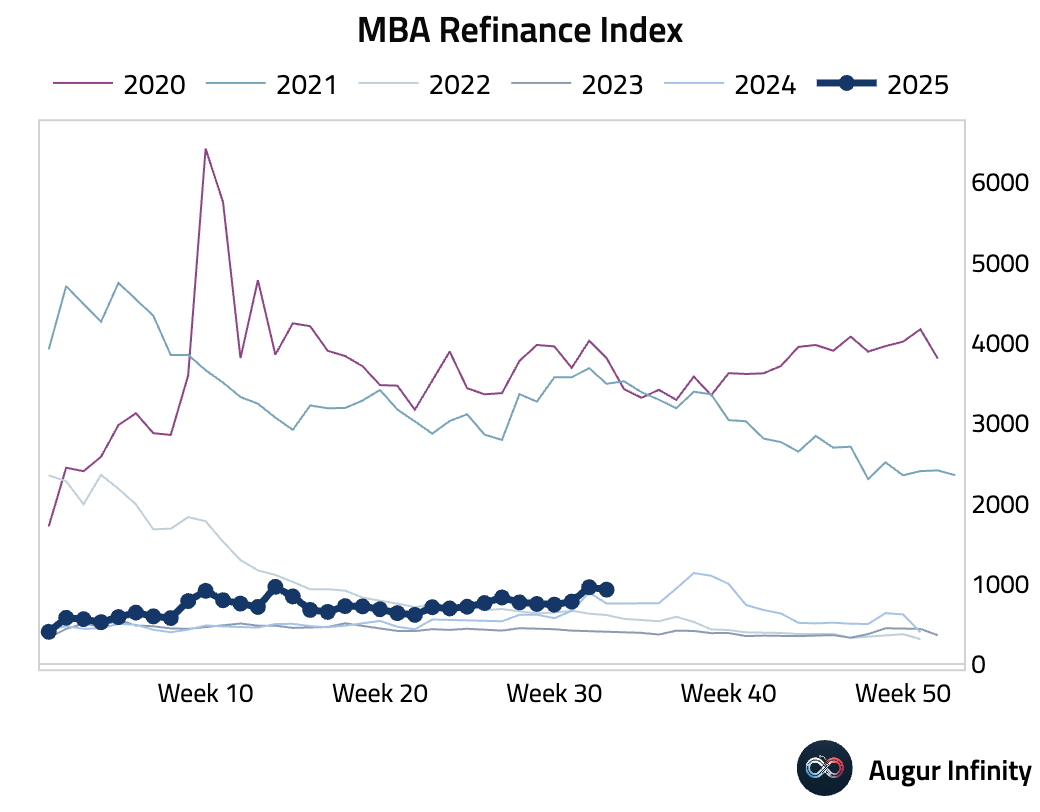
- The MBA 30-year mortgage rate ticked up slightly to 6.68% for the week ending August 15. Mortgage applications fell 1.4% week-over-week, a partial reversal of the prior week’s 10.9% jump. The decline was driven by a 3.1% drop in the Refinance Index, while the Purchase Index edged up by 0.1%.
Canada
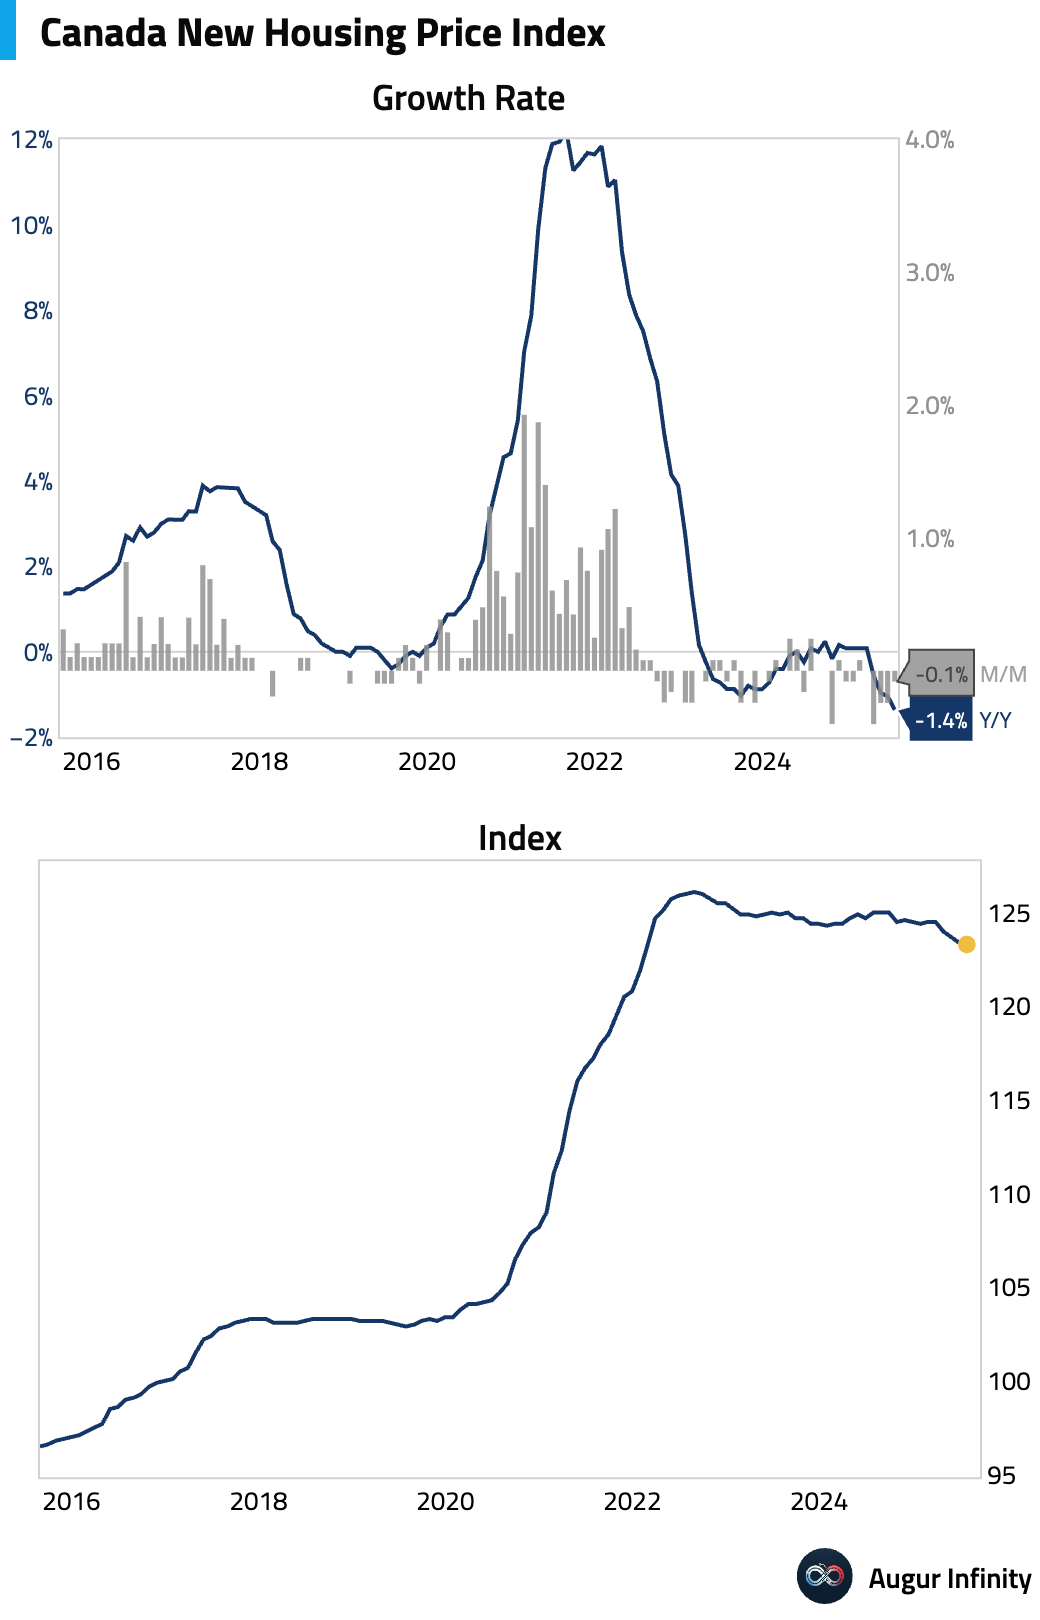
- The New Housing Price Index unexpectedly declined by 0.1% M/M in July, missing the consensus forecast of a 0.1% increase and following a 0.2% drop in June.
Europe
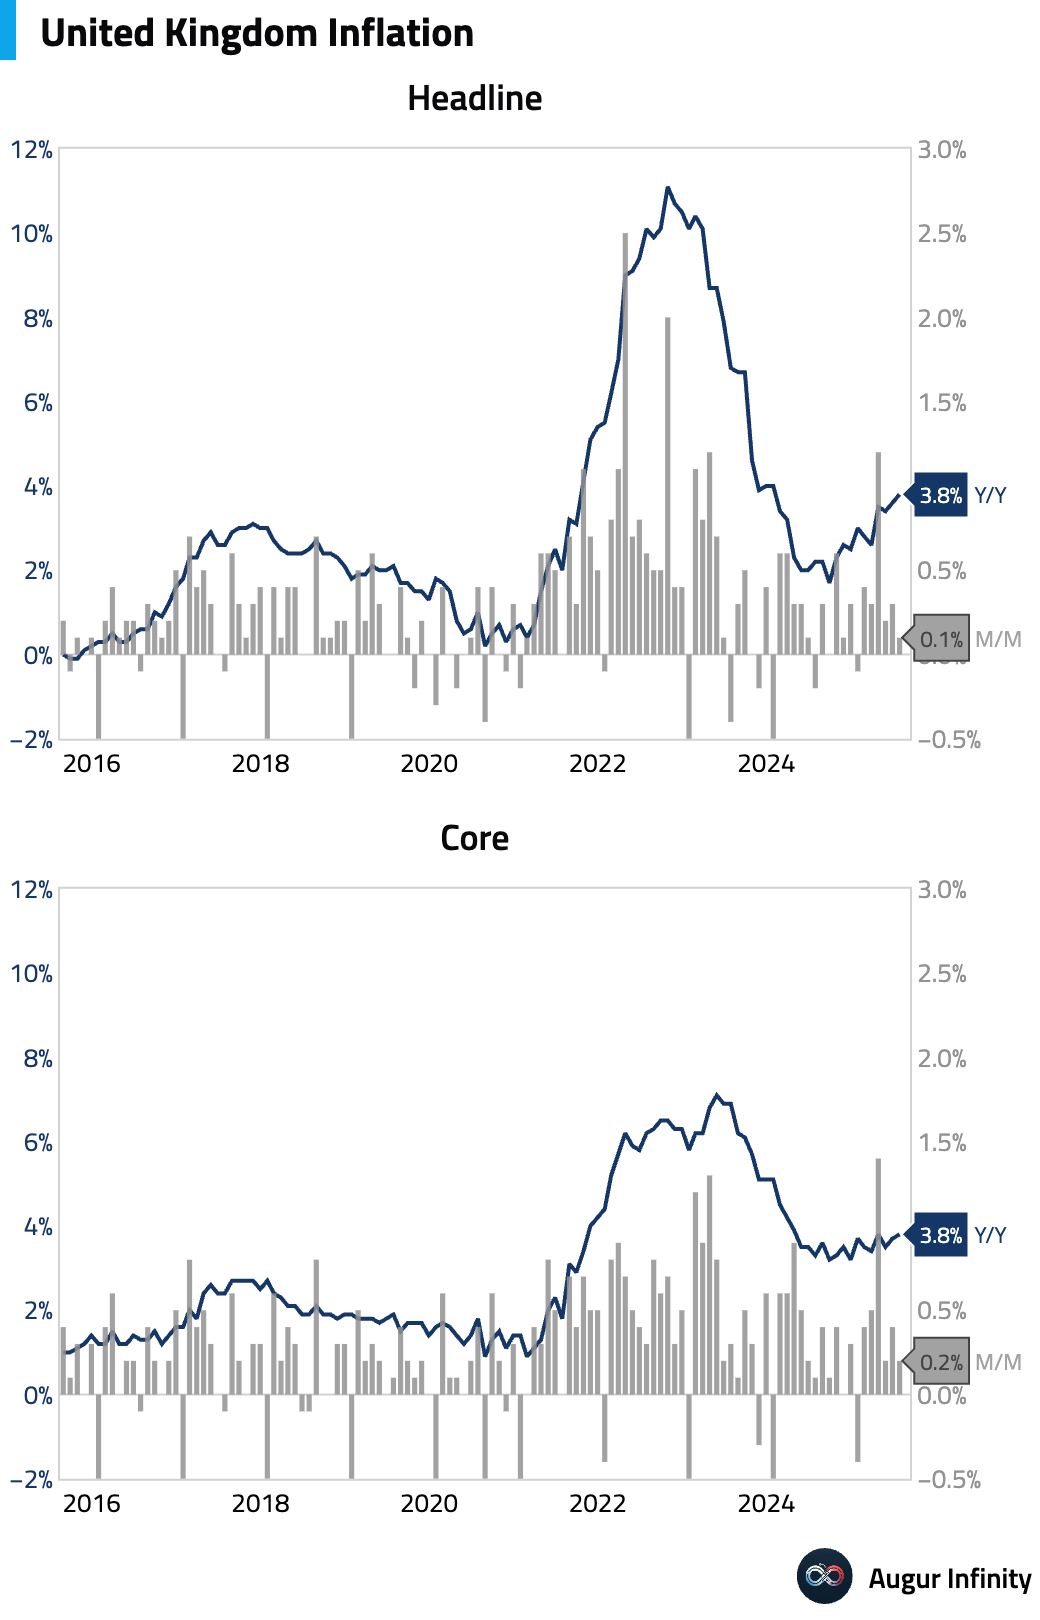
- The UK’s July inflation data came in hotter than expected. Headline CPI rose to 3.8% Y/Y from 3.6%, above the 3.7% consensus. Core CPI also accelerated to 3.8% Y/Y, beating expectations. The upside surprise was driven by services inflation, which climbed to 5.0% Y/Y, largely due to a significant surge in airfares. However, the Bank of England’s preferred measure of underlying services inflation, which excludes volatile items, is estimated to have edged down slightly, tempering the otherwise hawkish print.
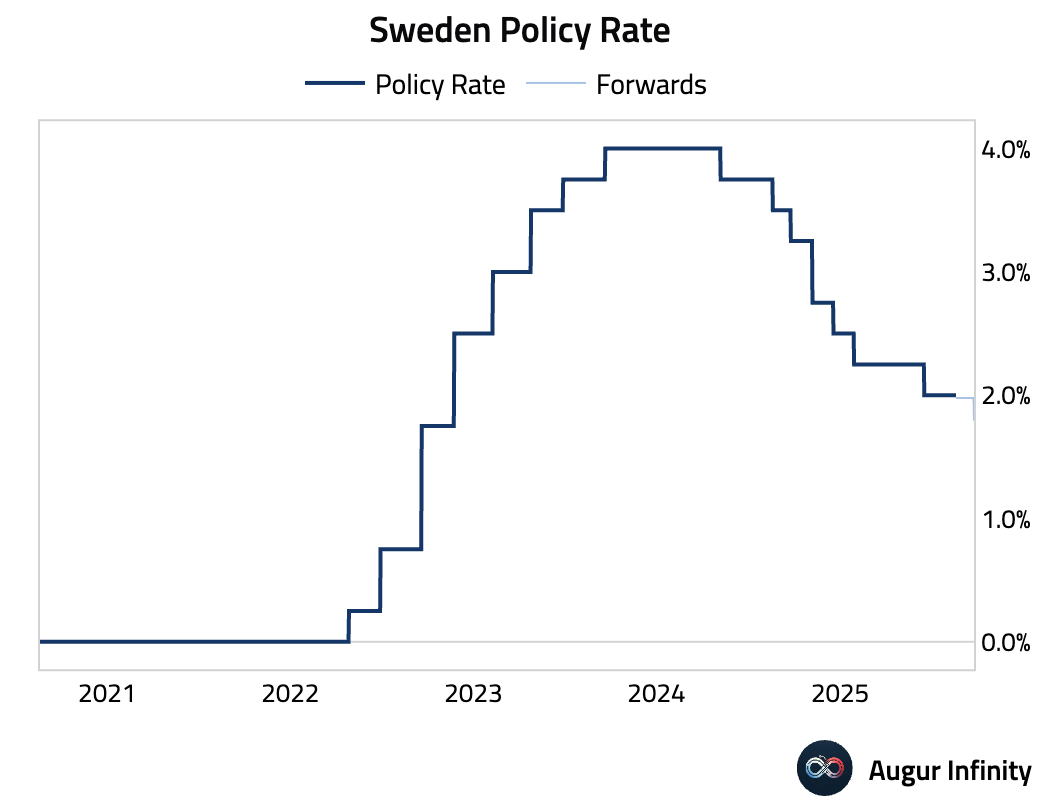
- The Riksbank held its policy rate at 2.00%, in line with market expectations. The board indicated that it views the recent spike in inflation as transitory and described the broader economic recovery as “sluggish.” The central bank remains open to further easing, with a potential cut in September still on the table, though risks are skewed toward later action.
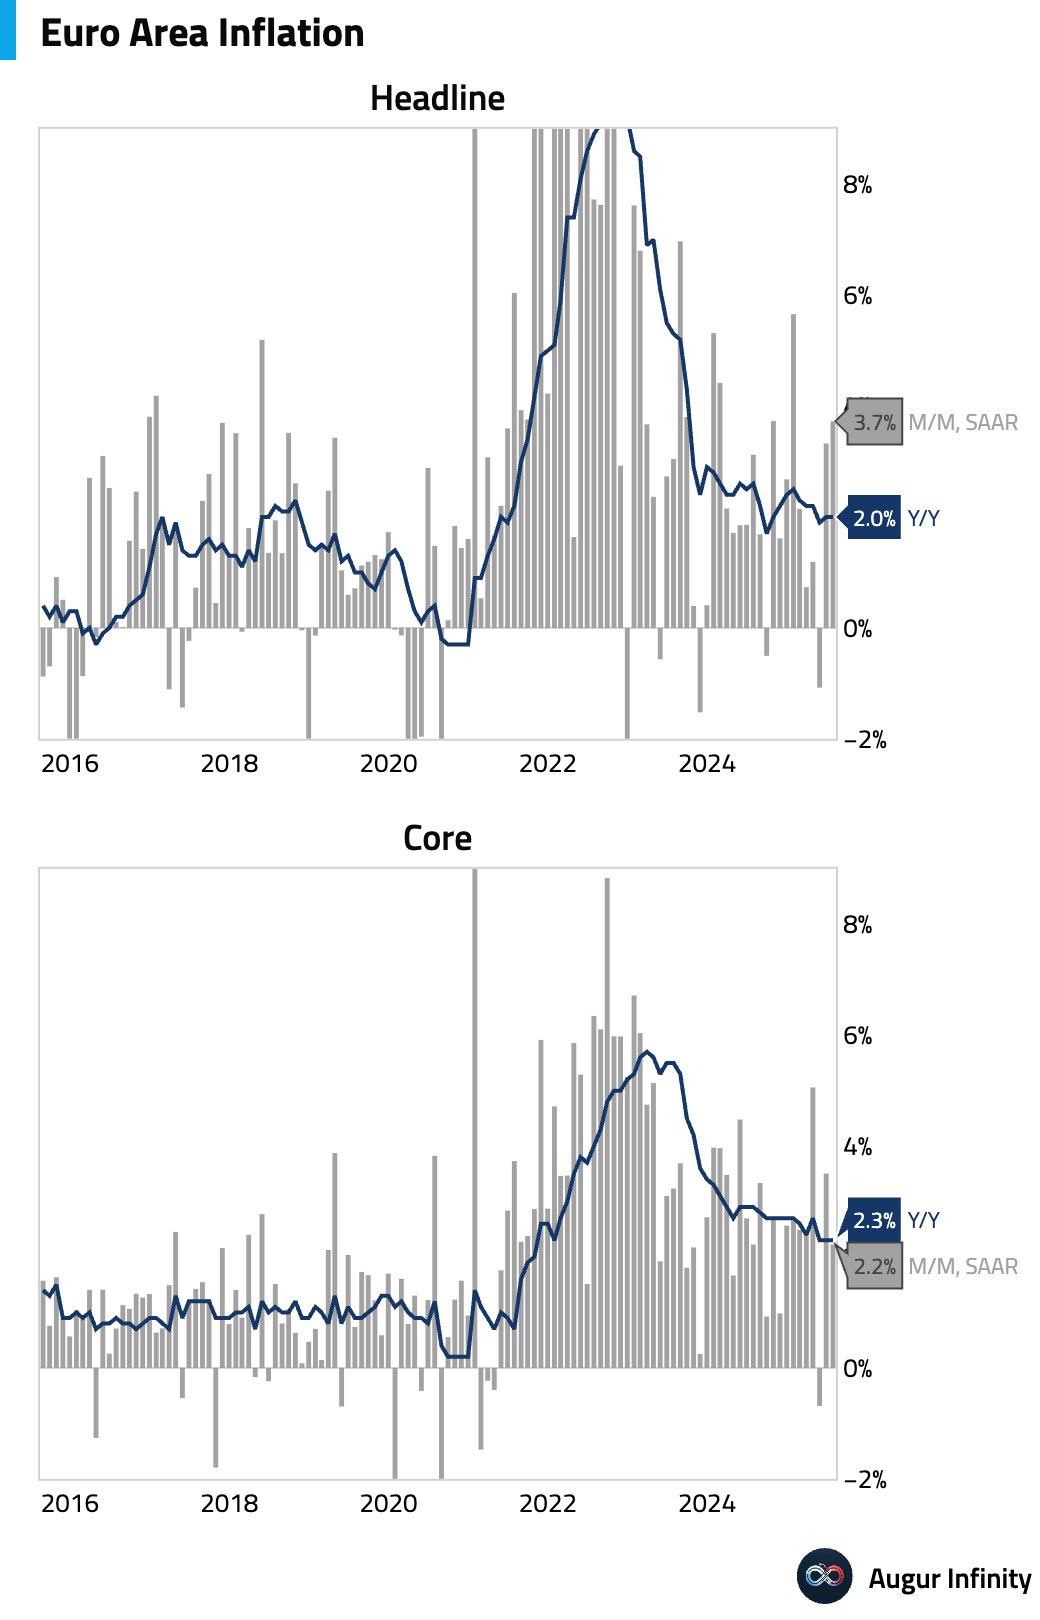
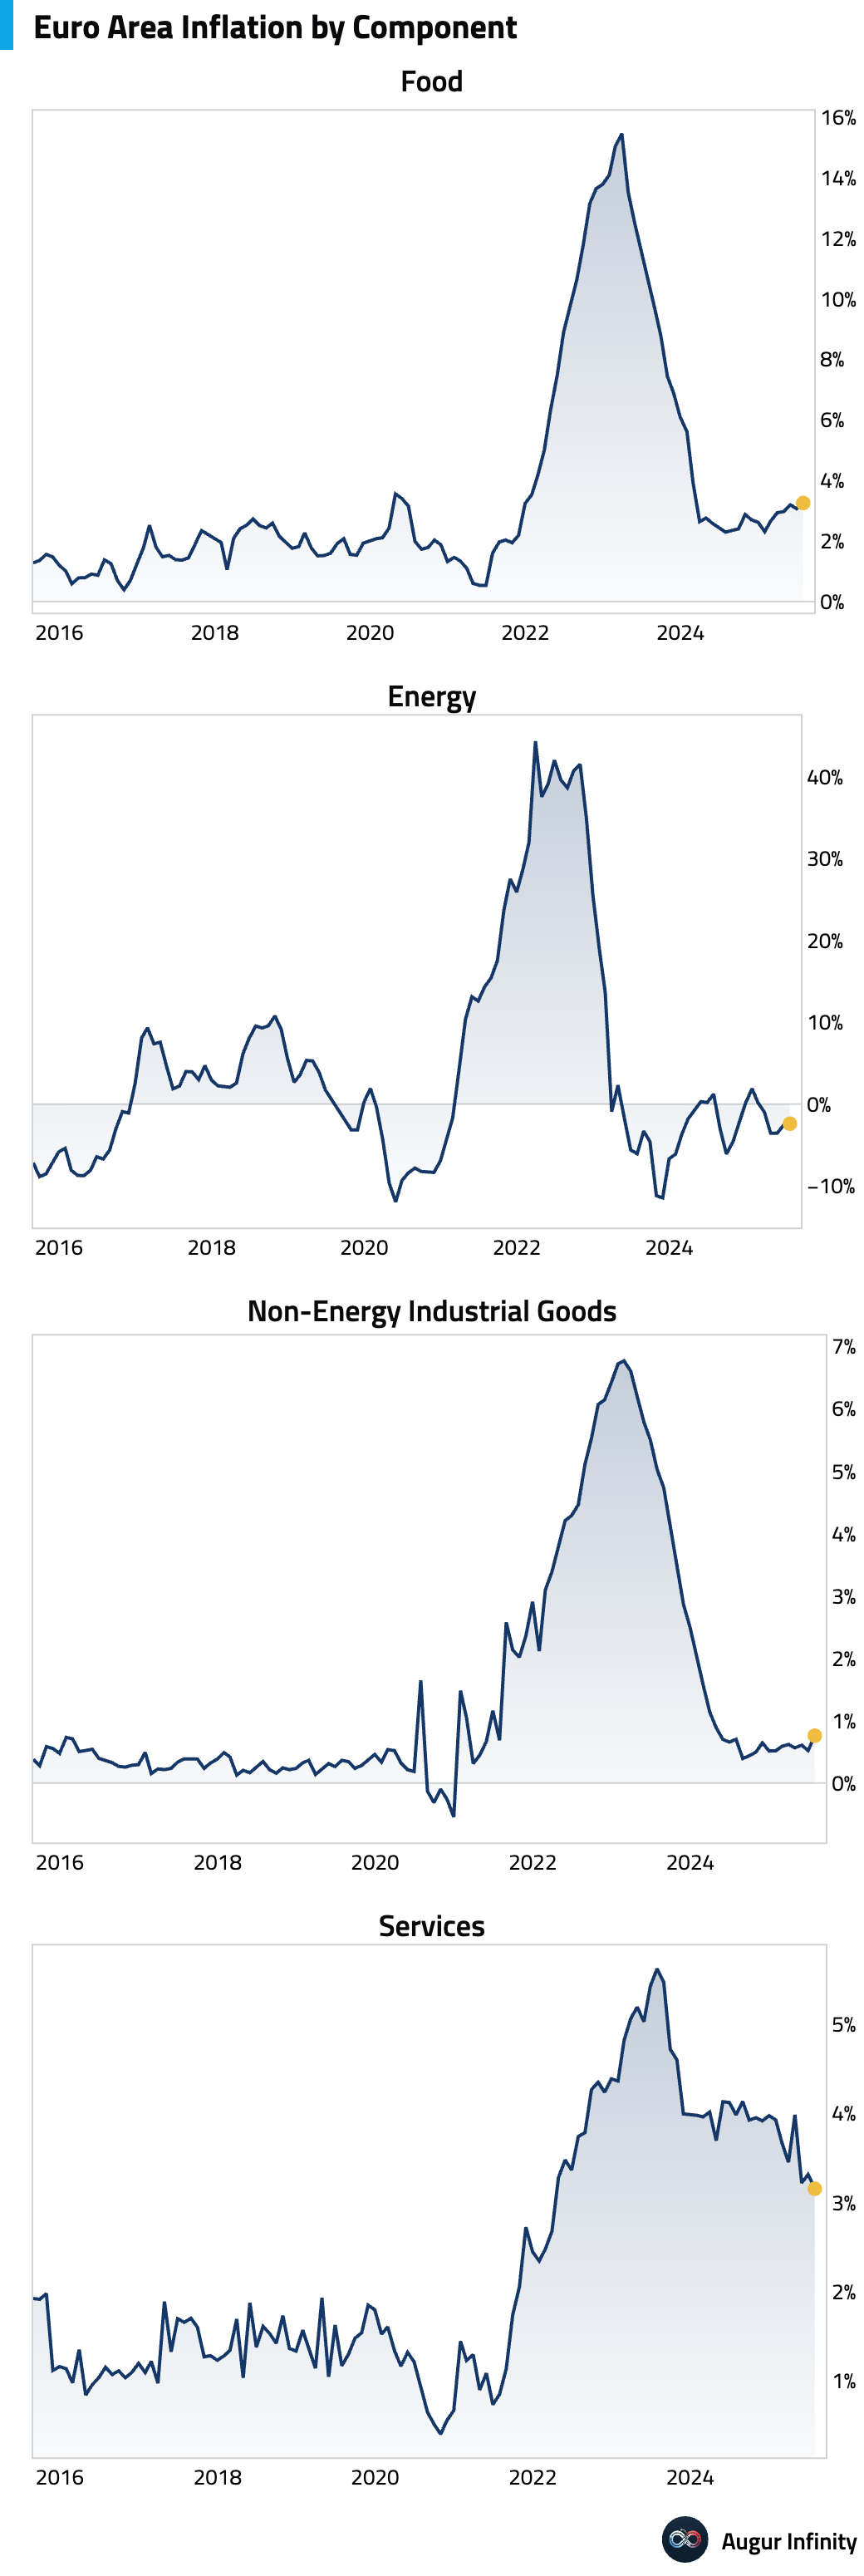
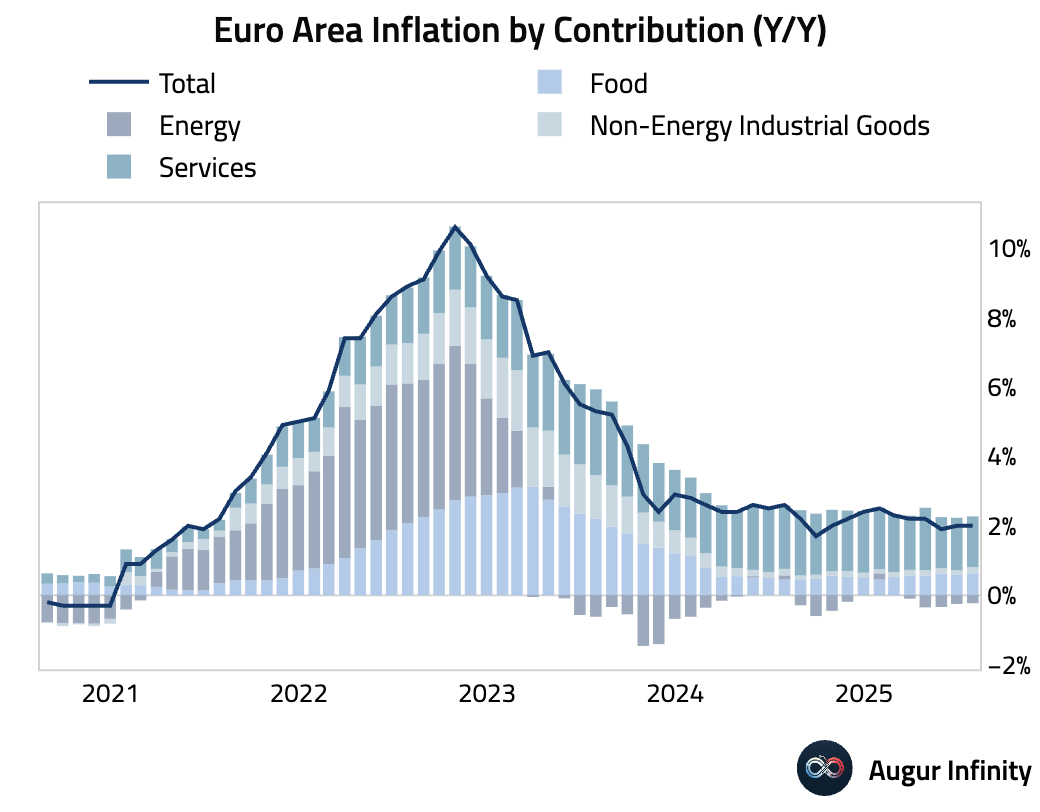
- Final July inflation figures for the Euro Area were revised slightly higher, with the headline rate confirmed at 2.0% Y/Y and the core rate at 2.3% Y/Y. The upward headline revision was driven by food, alcohol, and tobacco prices, whose contribution reached a one-year high. While services inflation remains the main driver, its contribution eased. Despite the higher year-over-year print, underlying momentum softened, with sequential core inflation ticking down.
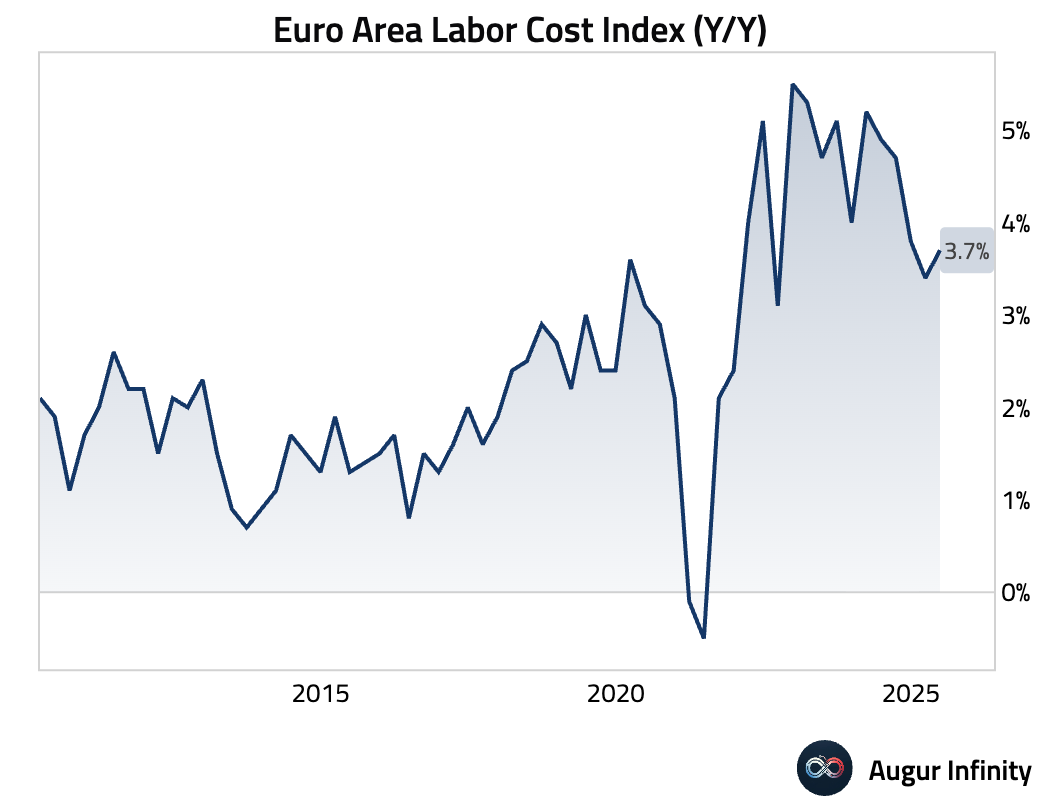
- The Euro Area Labour Cost Index accelerated to 3.7% Y/Y in the second quarter, up from 3.4% in the first quarter, indicating rising wage pressures.
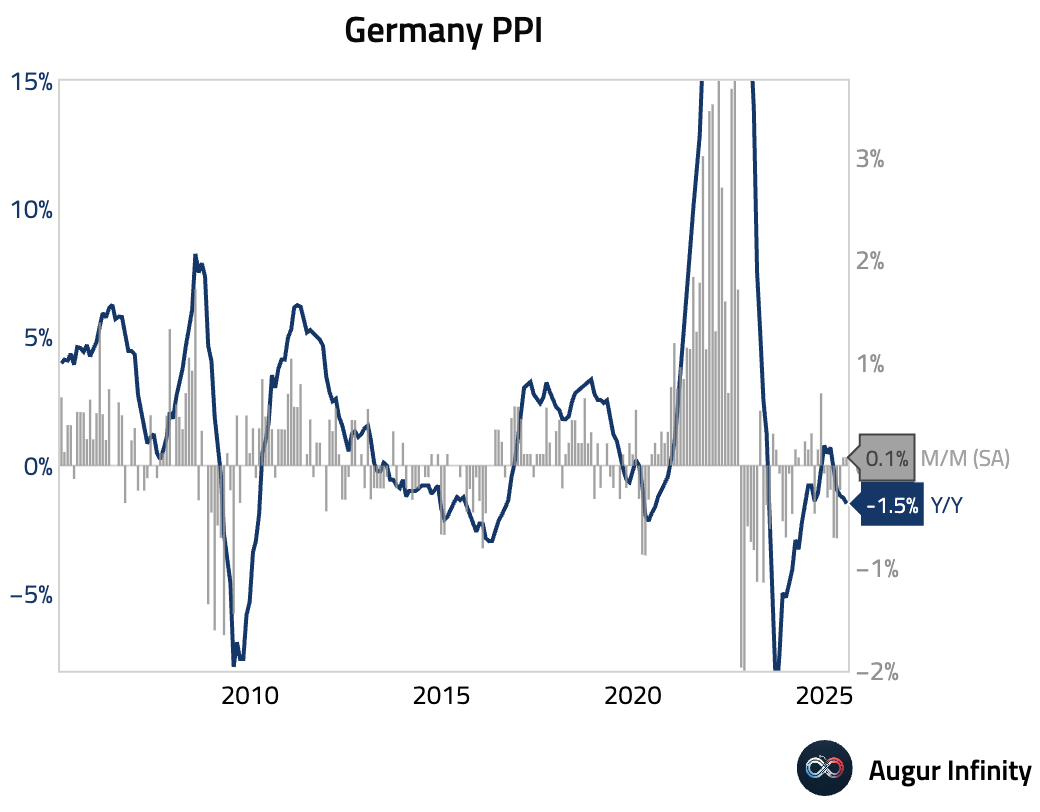
- German Producer Price Index (PPI) fell 1.5% Y/Y in July, a slightly faster pace of decline than the -1.3% consensus and the prior month's reading.
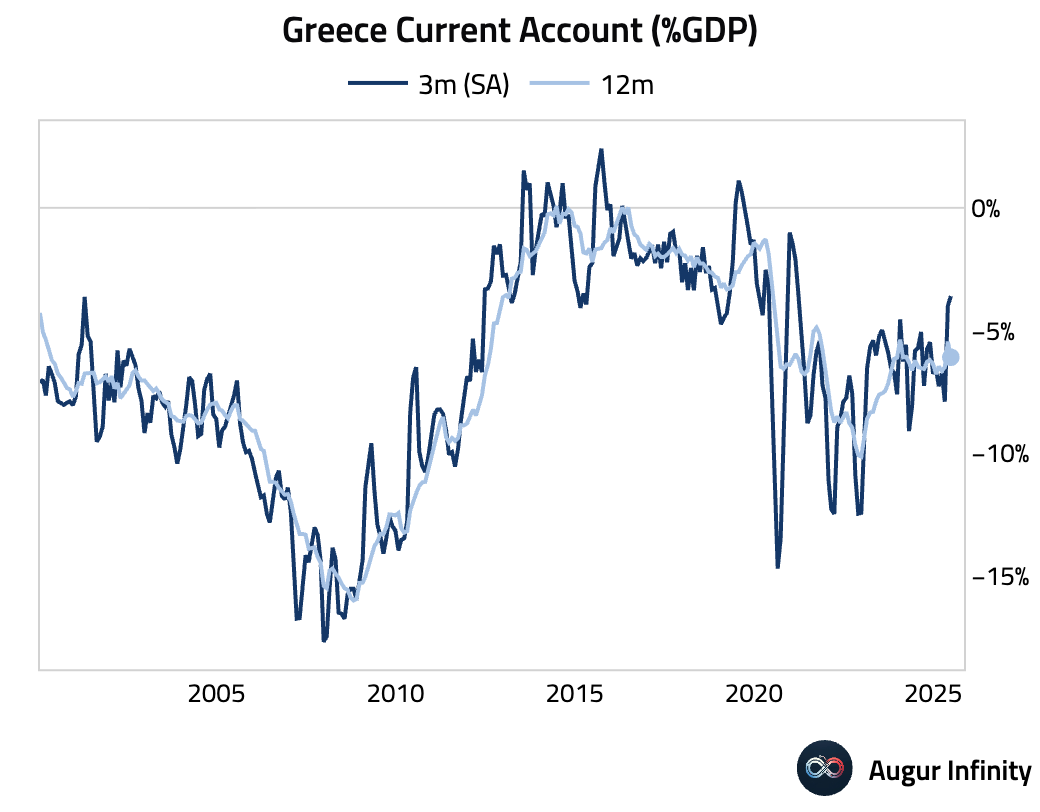
- Greece’s current account balance recorded a deficit of €1.18 billion in June, widening from a €196 million surplus in the prior month.
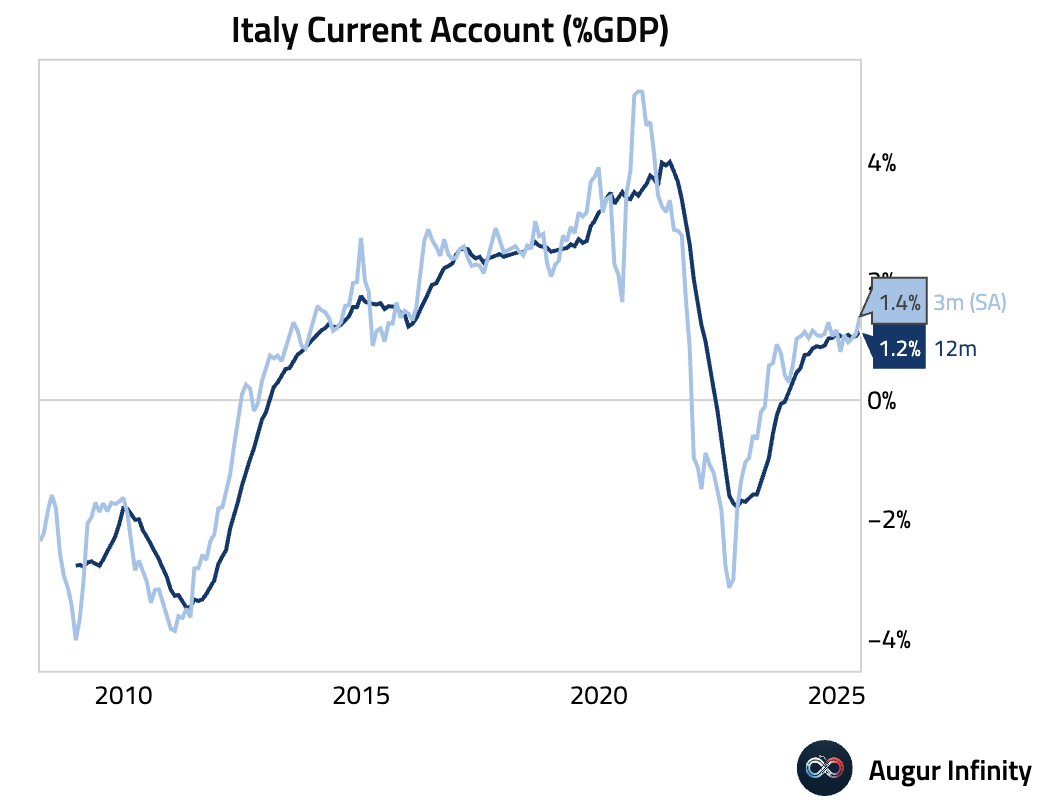
- Italy's current account surplus widened significantly to €5.74 billion in June from €1.72 billion in May.
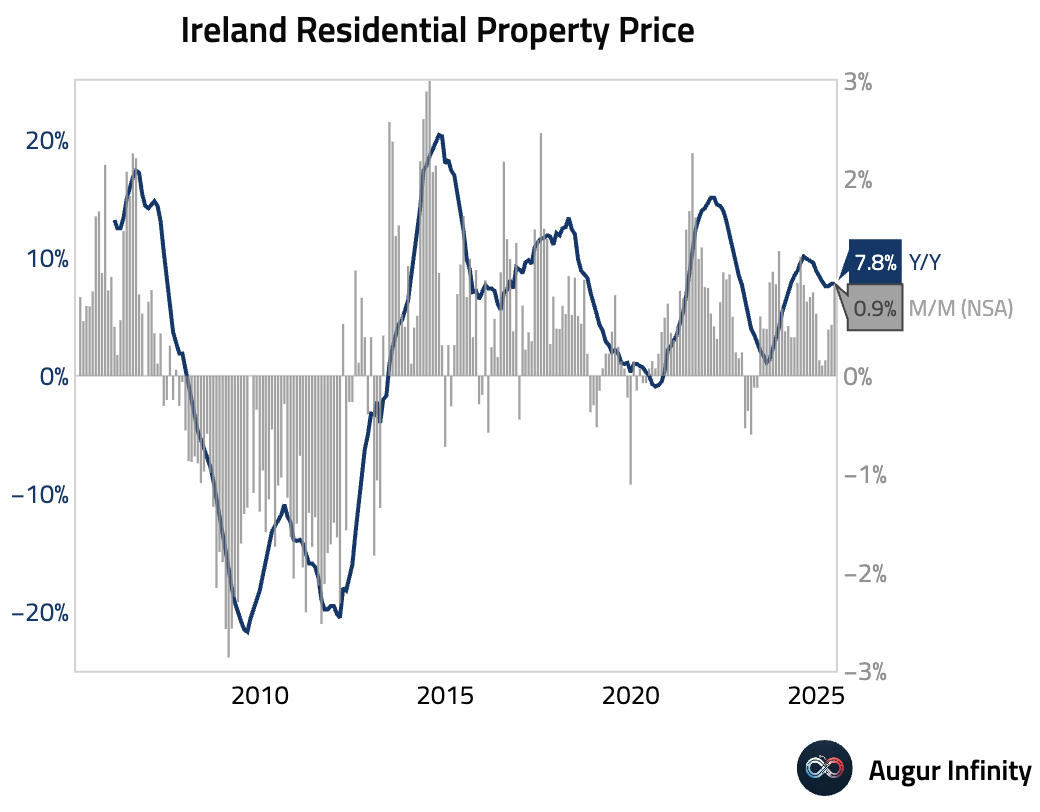
- Irish residential property prices rose 0.9% M/M in July, accelerating from June’s 0.6% pace. The annual rate of price growth held steady at 7.8%.
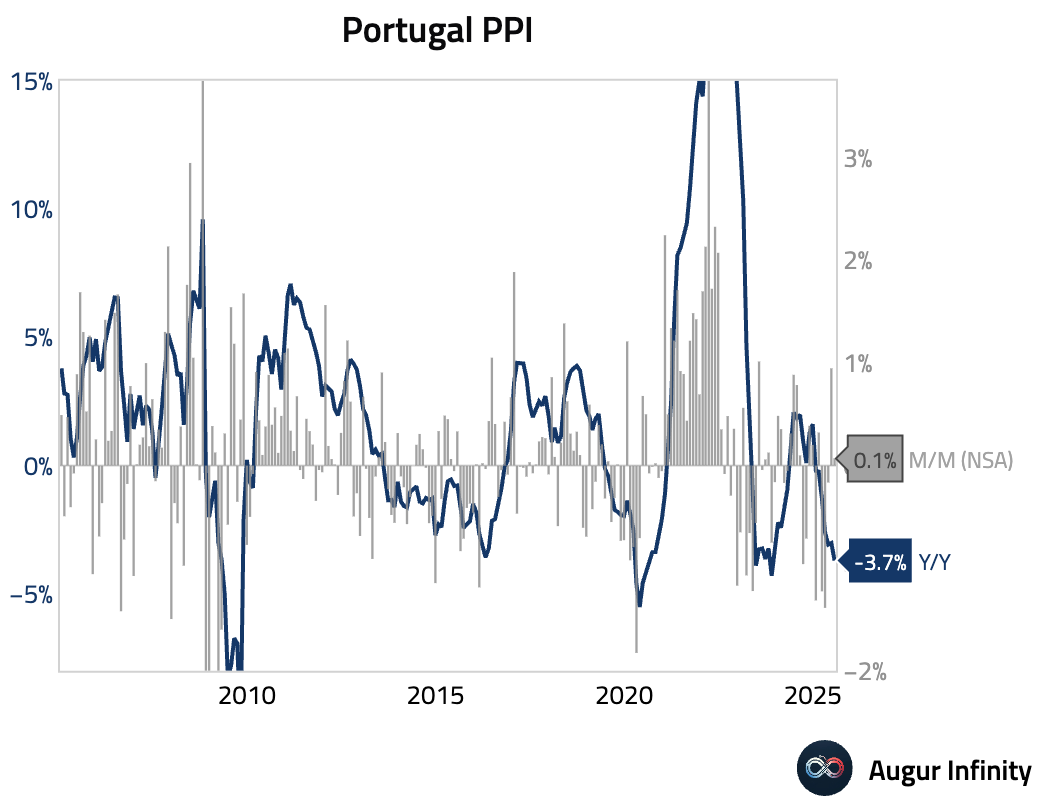
- Portugal’s Producer Price Index (PPI) fell 3.7% Y/Y in July, extending the deflationary trend from the 3.0% decline in June. Prices rose 0.1% M/M.
Asia-Pacific
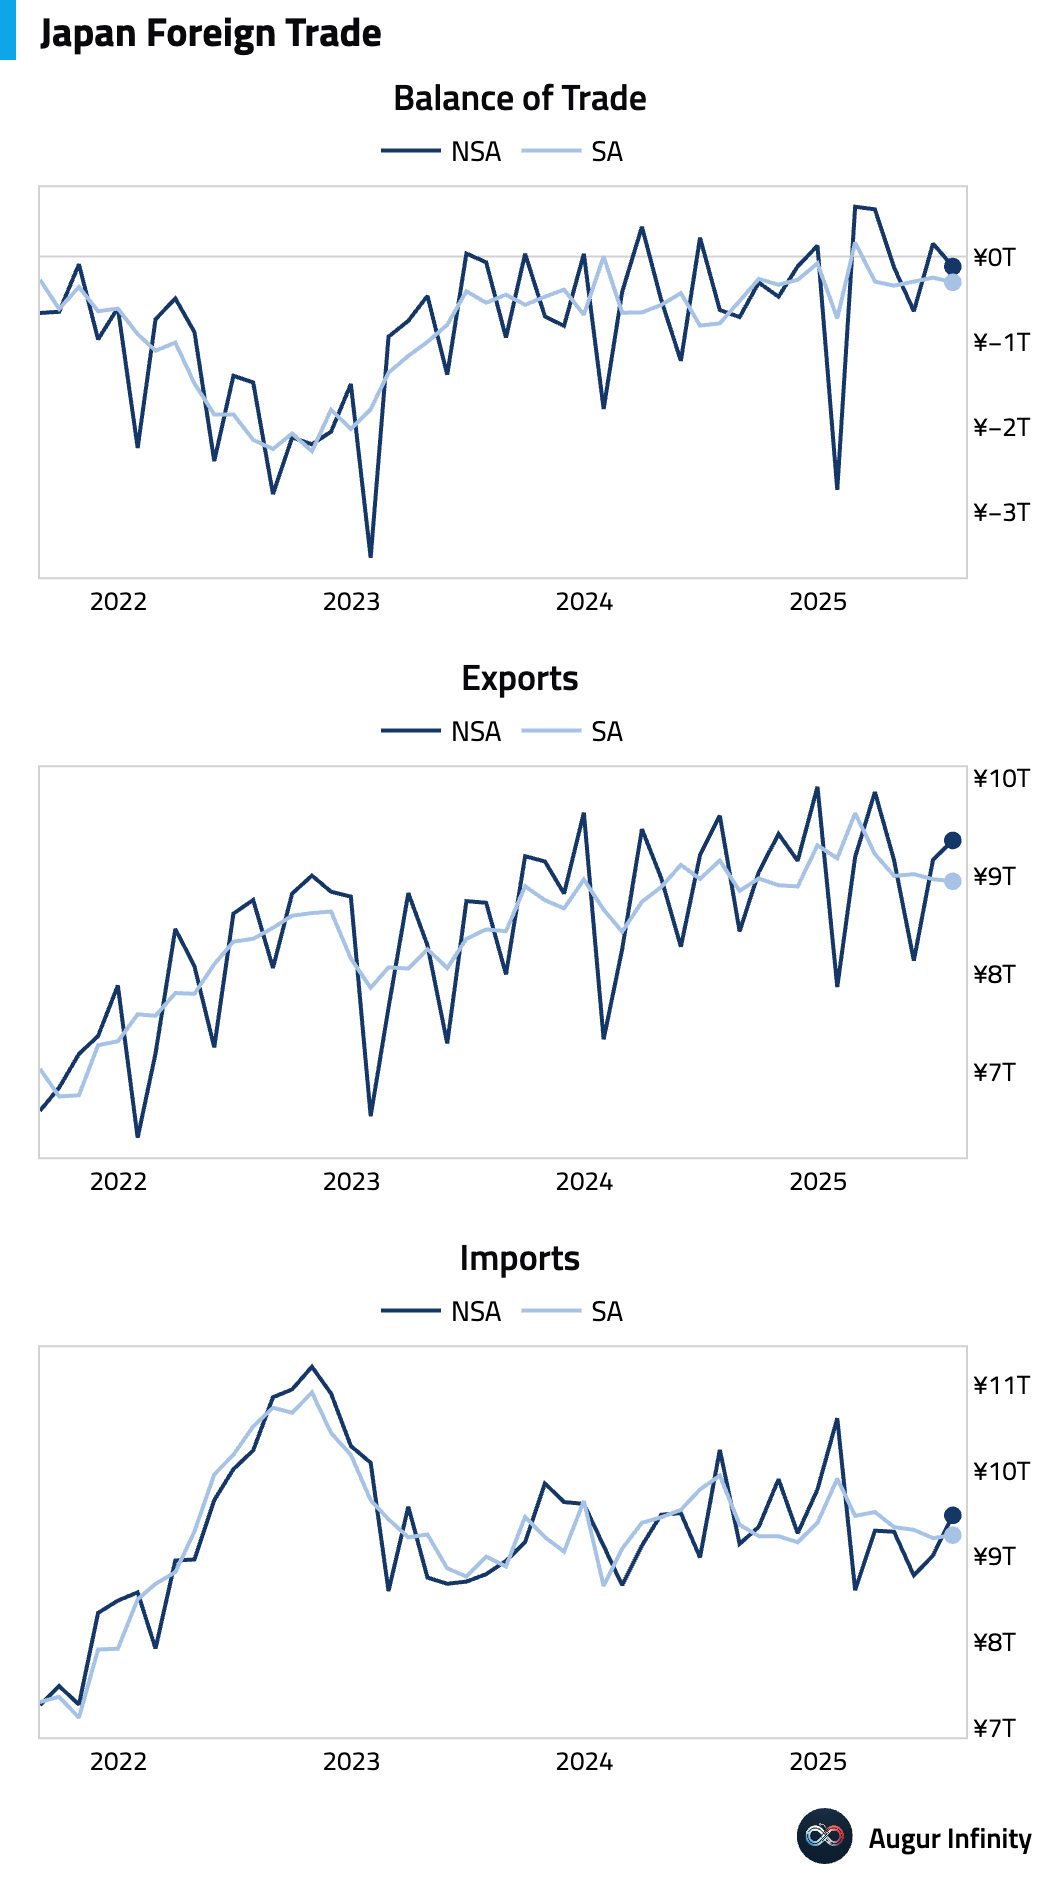
- Japan’s trade balance unexpectedly swung to a deficit of ¥117.5 billion in July, significantly missing the consensus forecast for a ¥196.2 billion surplus. The shift was driven by a 2.6% Y/Y drop in exports, which was worse than the -2.1% consensus. A sharp fall in passenger car export volumes to the United States was a key contributor, signaling that external demand may be peaking and could become a drag on third-quarter GDP.
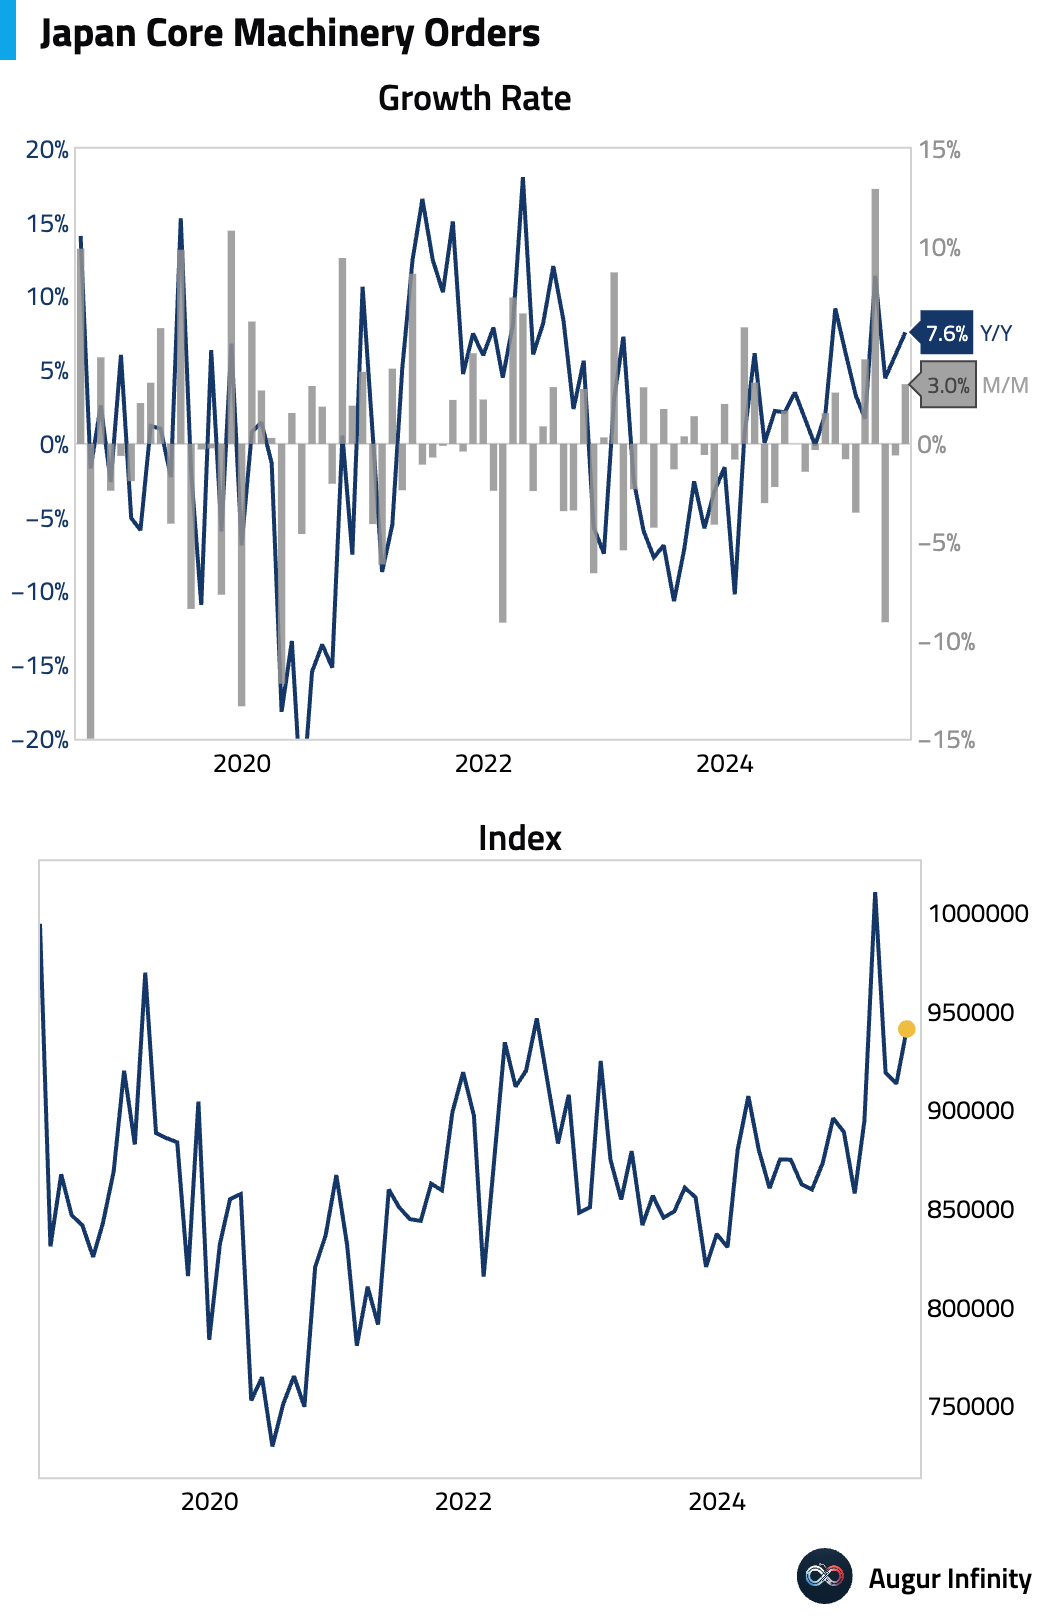
- Japan's core machinery orders surprisingly rose 3.0% M/M in June, beating the -1.0% consensus and marking a third consecutive quarterly gain. The increase was driven by a surge in non-manufacturing orders, which masked a third straight monthly decline in the manufacturing sector. The official outlook for the third quarter is negative, projecting a 4.0% Q/Q decline.
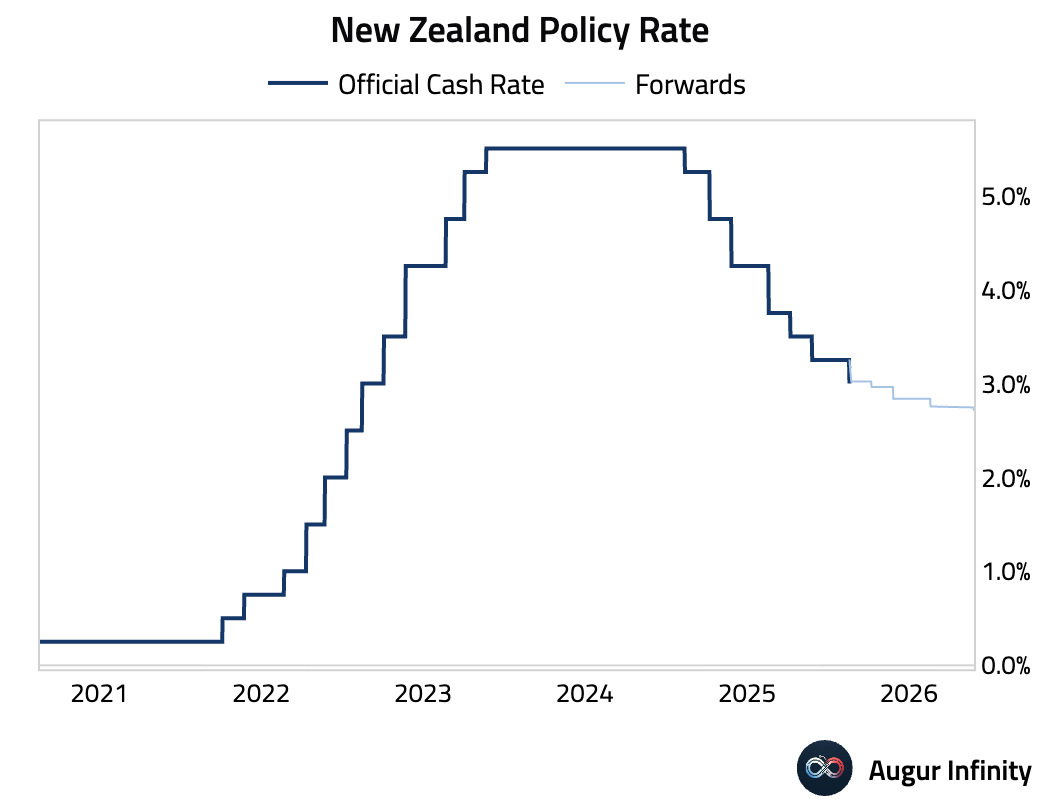
- The Reserve Bank of New Zealand (RBNZ) cut its Official Cash Rate by 25 bps to 3.00%. While the cut was expected, the decision was distinctly dovish. Two members of the monetary policy committee dissented, favoring a larger 50 bps cut. The RBNZ’s forward guidance was also revised materially lower, signaling a strong bias toward further easing due to a weaker economic outlook, despite near-term inflation forecasts being revised higher.
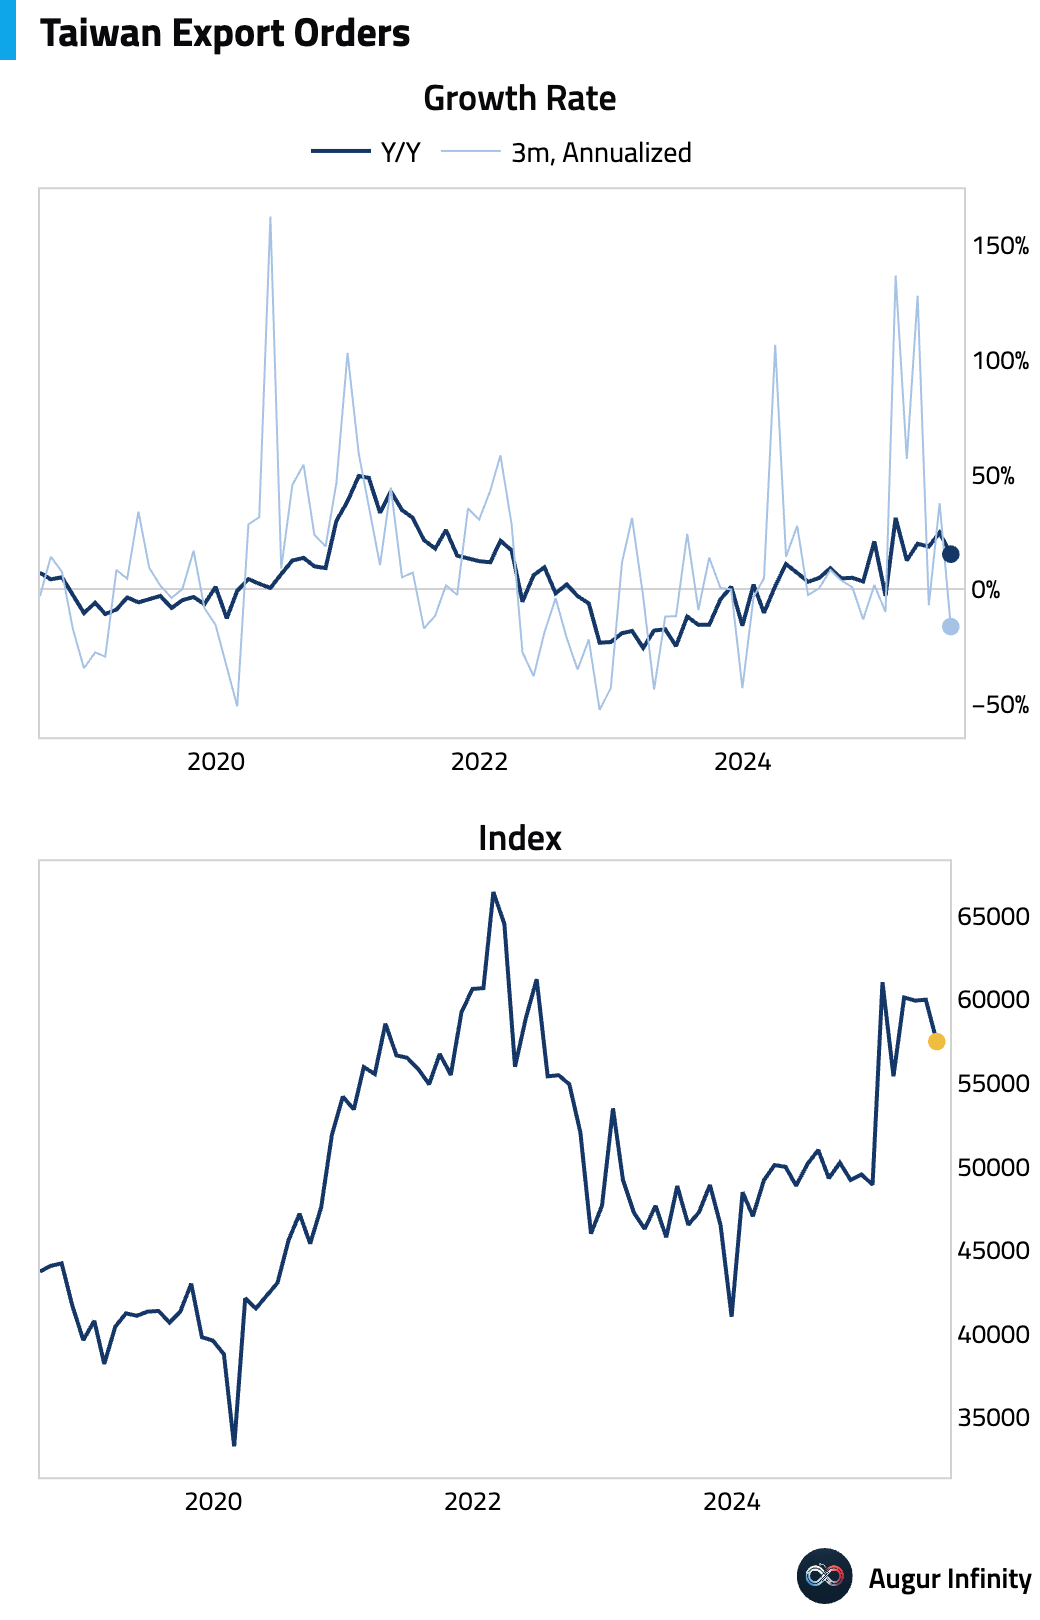
- Taiwan's export orders grew 15.2% Y/Y in July, slightly ahead of the 15.0% consensus but moderating from the 24.6% pace in June.
China
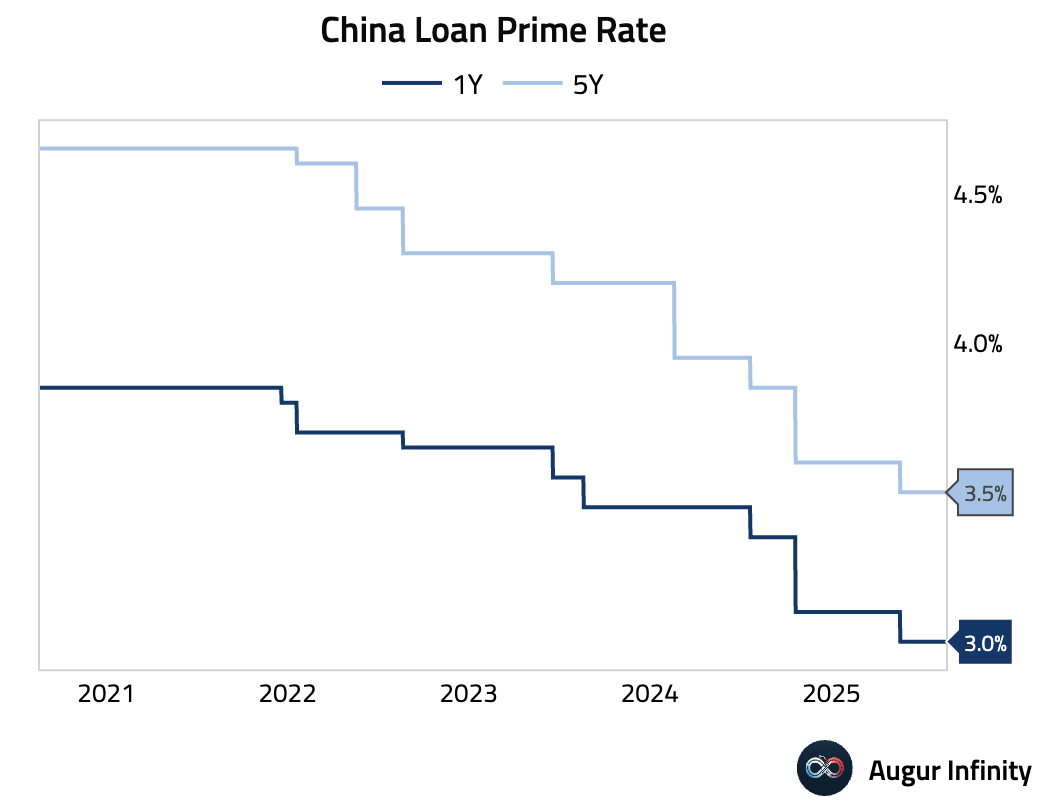
- The People's Bank of China left its key lending rates unchanged, as expected. The 1-year Loan Prime Rate (LPR) was held at 3.00% and the 5-year LPR, a reference for mortgages, was kept at 3.50%. Both rates remain at all-time lows.
Emerging Markets ex China
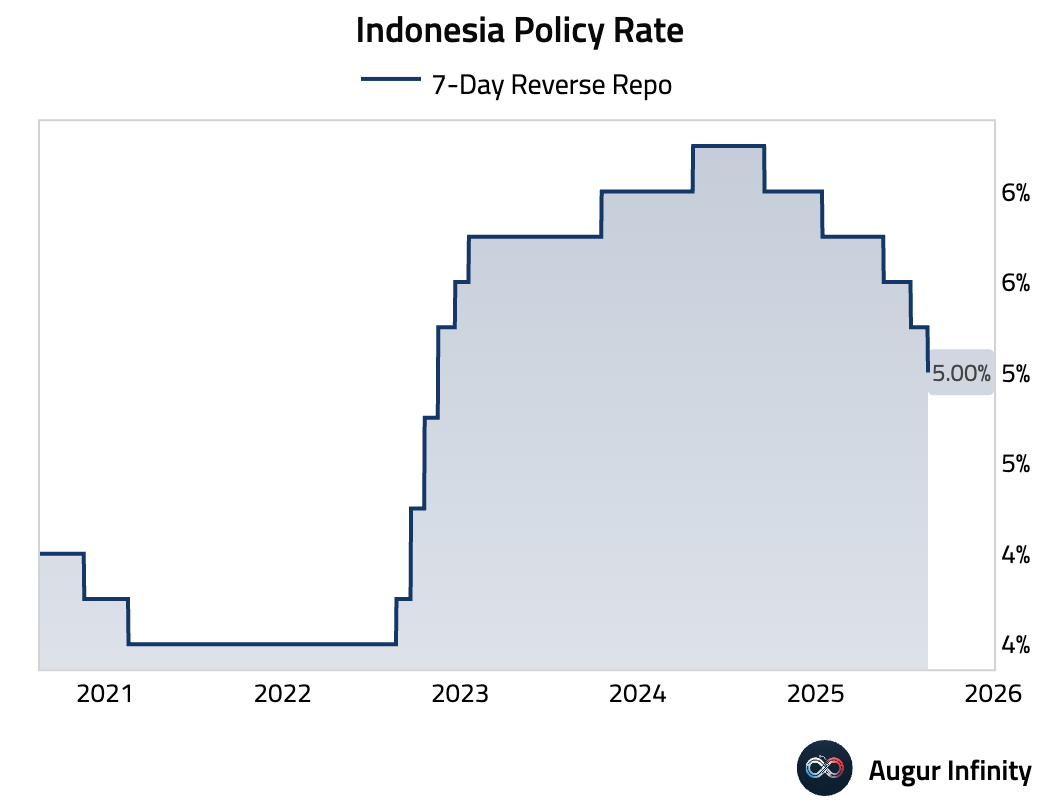
- Bank Indonesia delivered a surprise 25 bps rate cut, lowering its benchmark 7-day reverse repo rate to 5.00%. The consensus was for rates to remain on hold. The central bank cited lower future inflation forecasts, a stable rupiah, and the need to support economic growth as primary reasons for the cut.
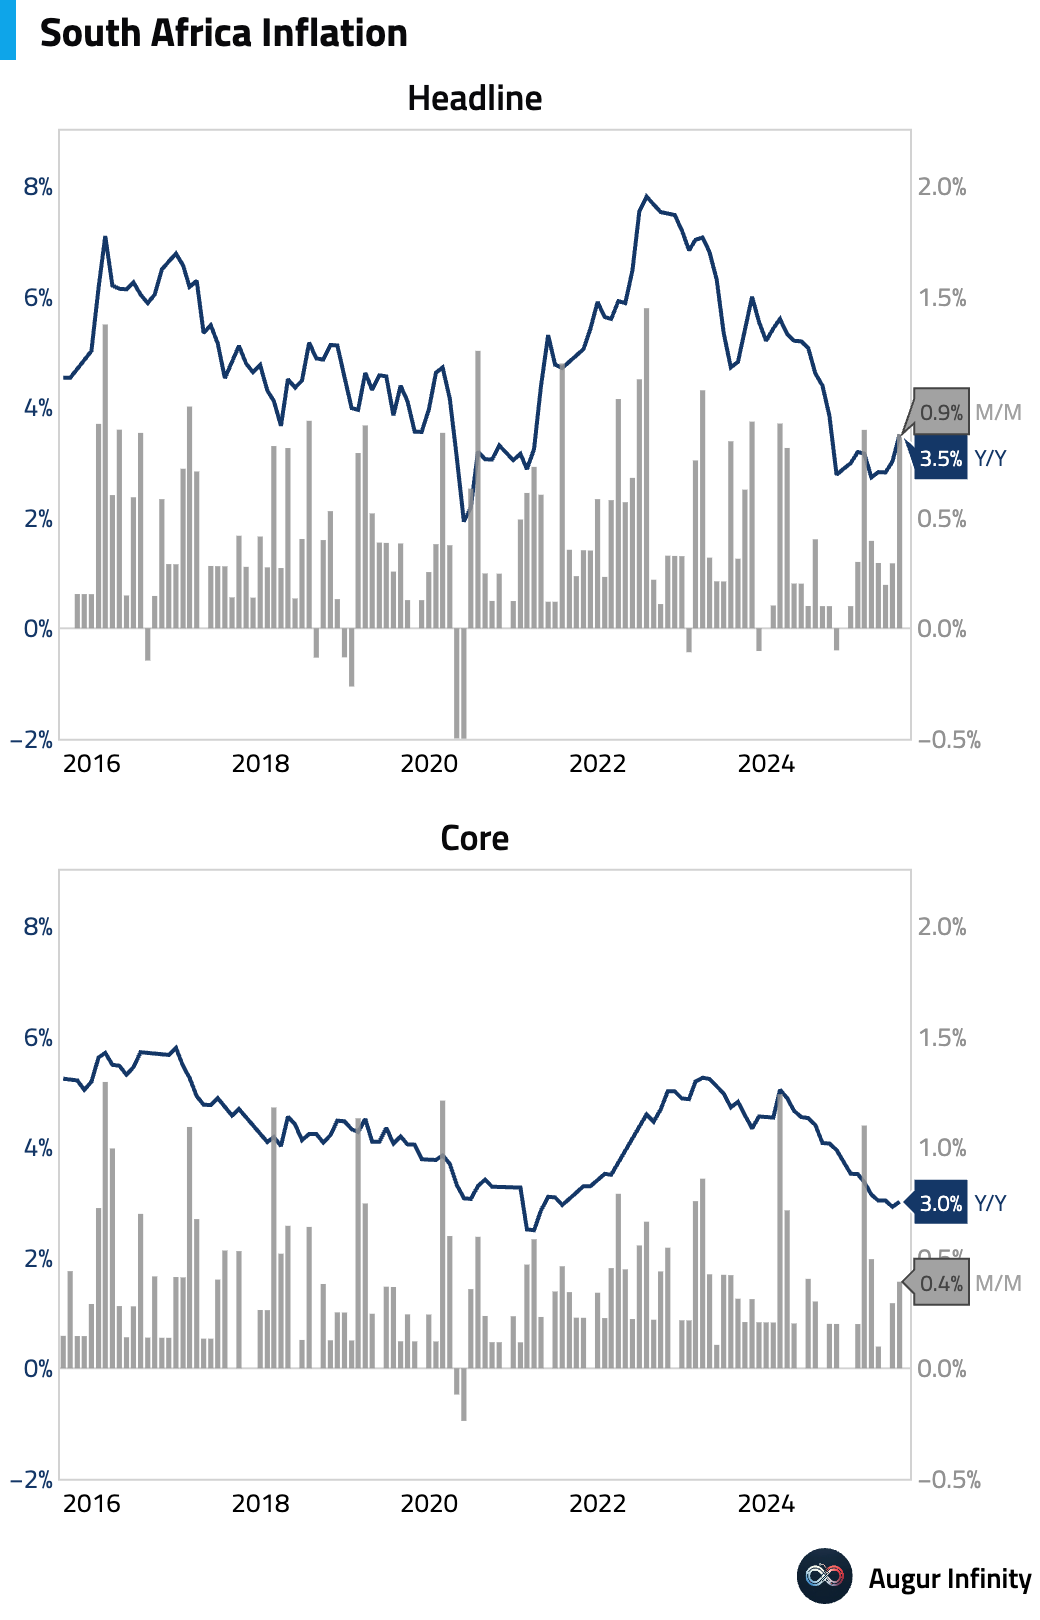
- South Africa's headline inflation accelerated to 3.5% Y/Y in July, in line with consensus, up from 3.0% in June. The rise was driven by accelerating food inflation and easing fuel deflation. Core CPI edged up to 3.0% Y/Y, slightly missing the 3.1% consensus, as a larger-than-expected hike in water tariffs masked continued weakness in other core components.
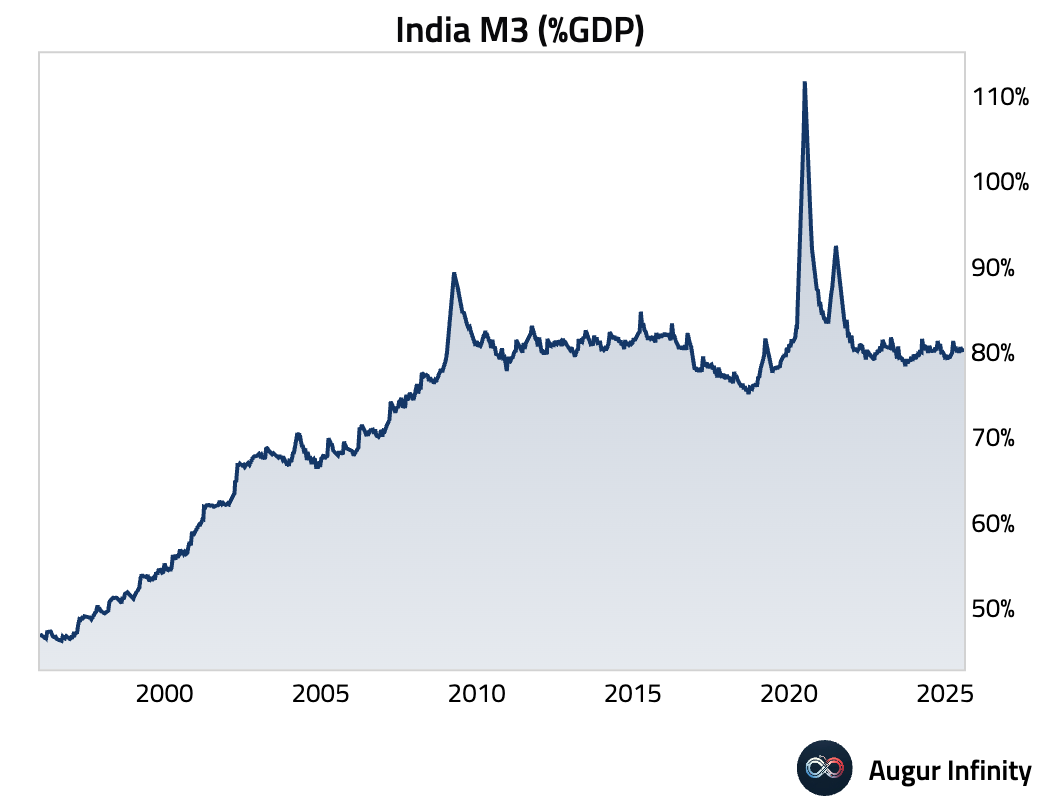
- India’s M3 money supply growth was stable at 9.6% Y/Y for the week ending August 1.
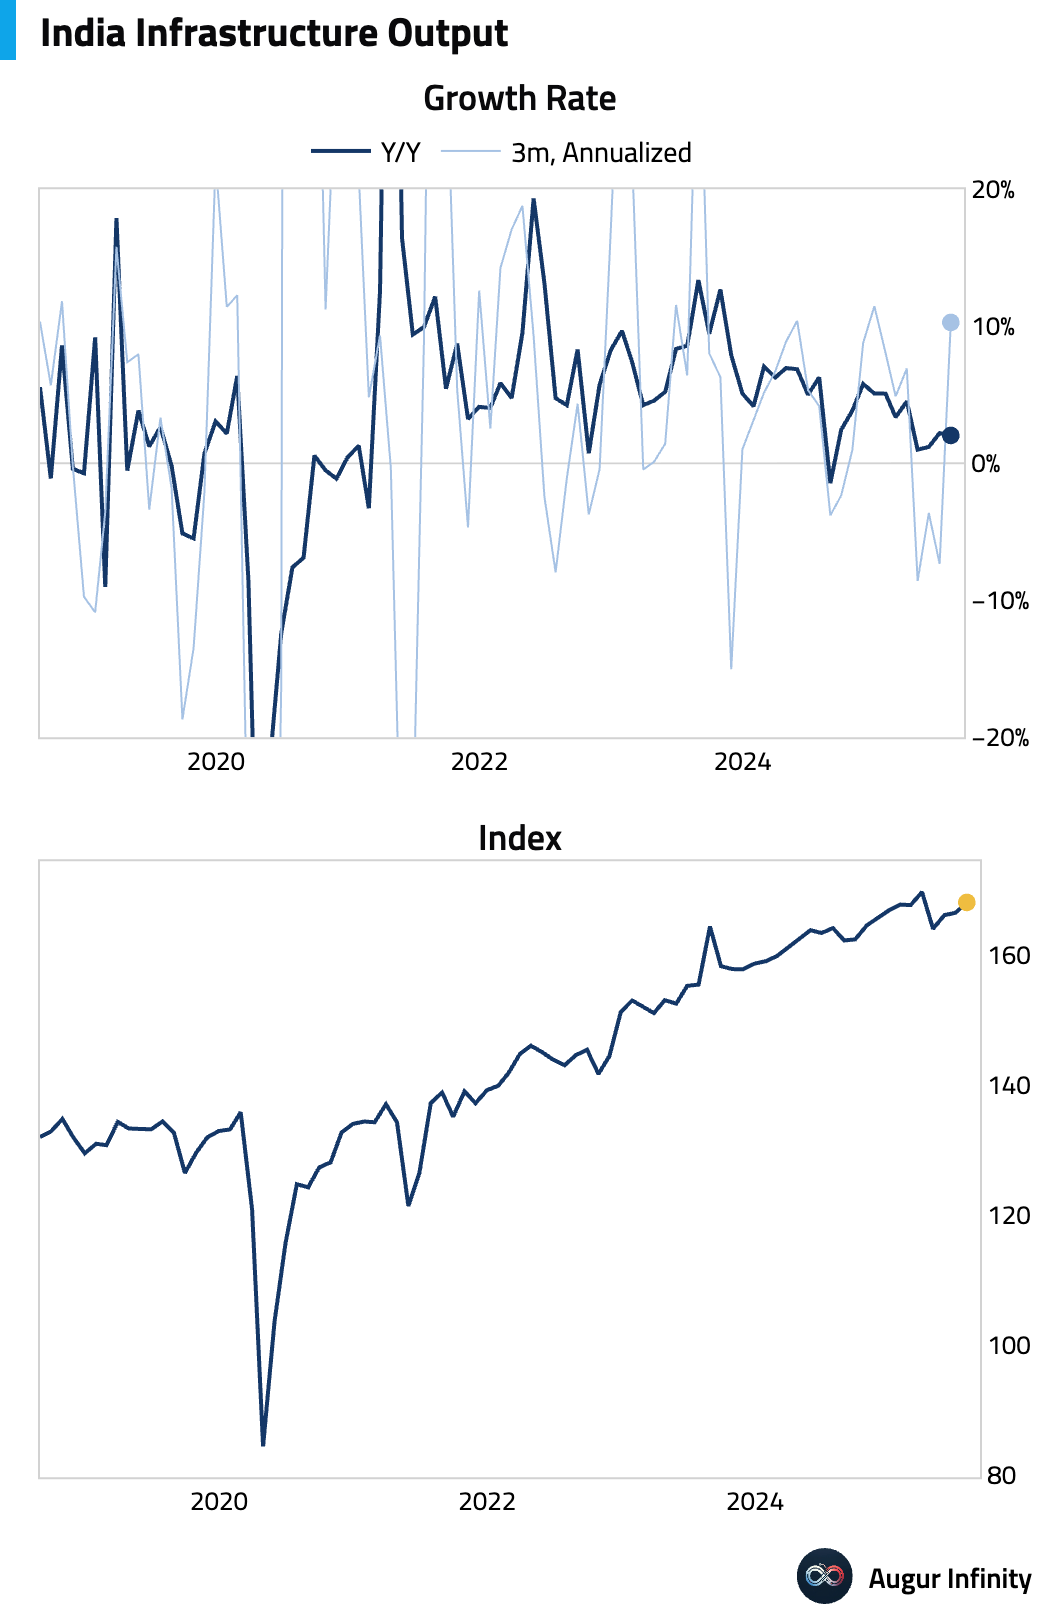
- India's infrastructure output growth slowed to 2.0% Y/Y in July from 2.2% in June.
Disclaimer
Augur Digest is an automatically generated newsletter edited by humans. It may contain inaccuracies and is not investment advice. Augur Labs LLC will not accept liability for any loss or damage as a result of your reliance on the information contained in the newsletter.

