Note: This is the August Digest Flash—an early look at today’s economic developments. The full edition will be released at 4 p.m.
Global Economics
United States
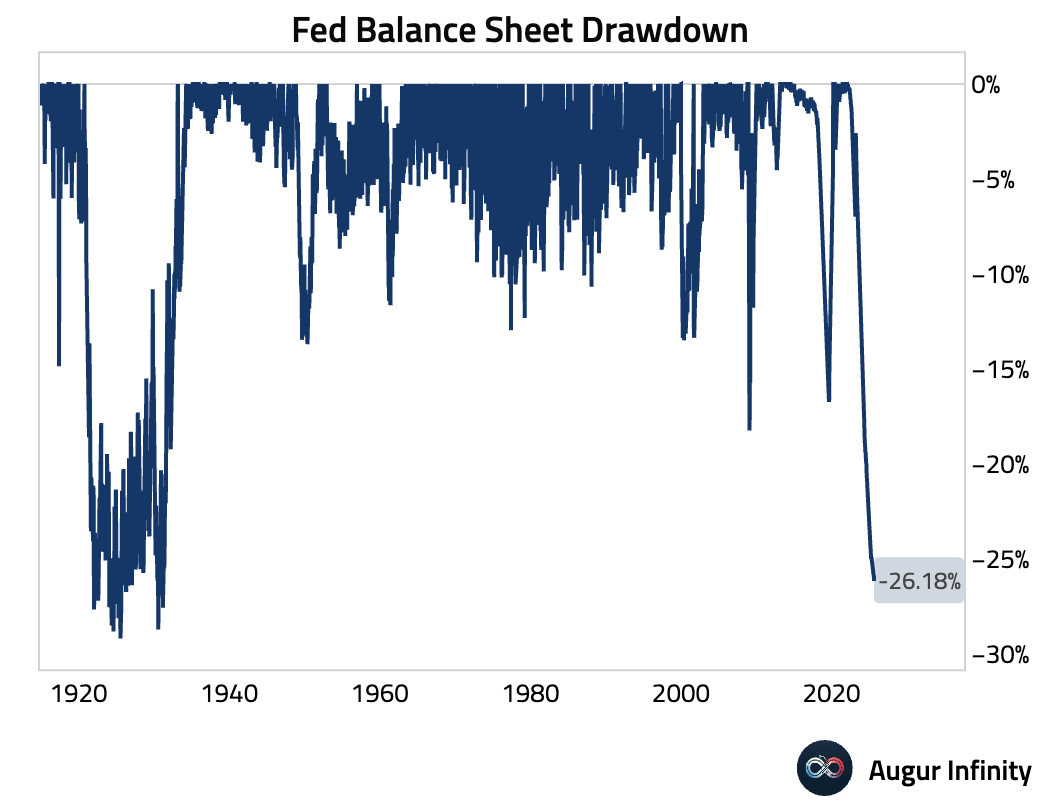
- The Federal Reserve’s balance sheet contracted to $6.62 trillion from $6.64 trillion in the prior week, reaching its lowest level since April 2020.
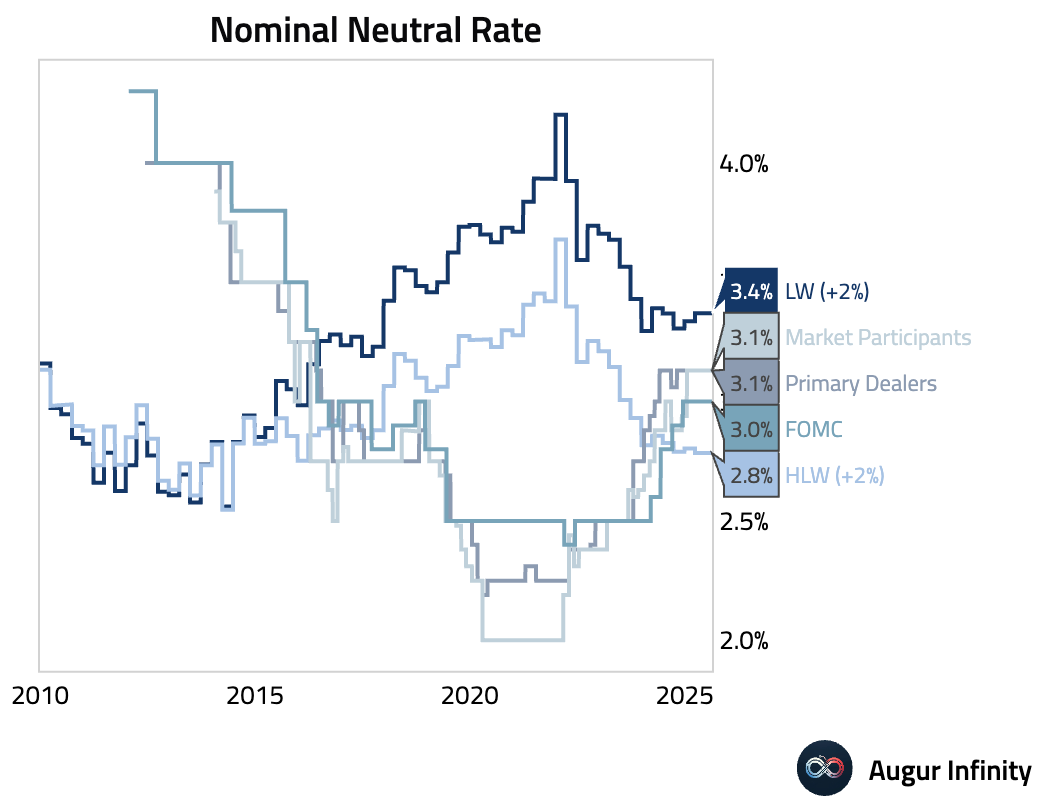
- The latest New York Fed Survey of Market Expectations puts the longer-run Fed funds rate at 3.1%, a touch higher than FOMC’s estimate.
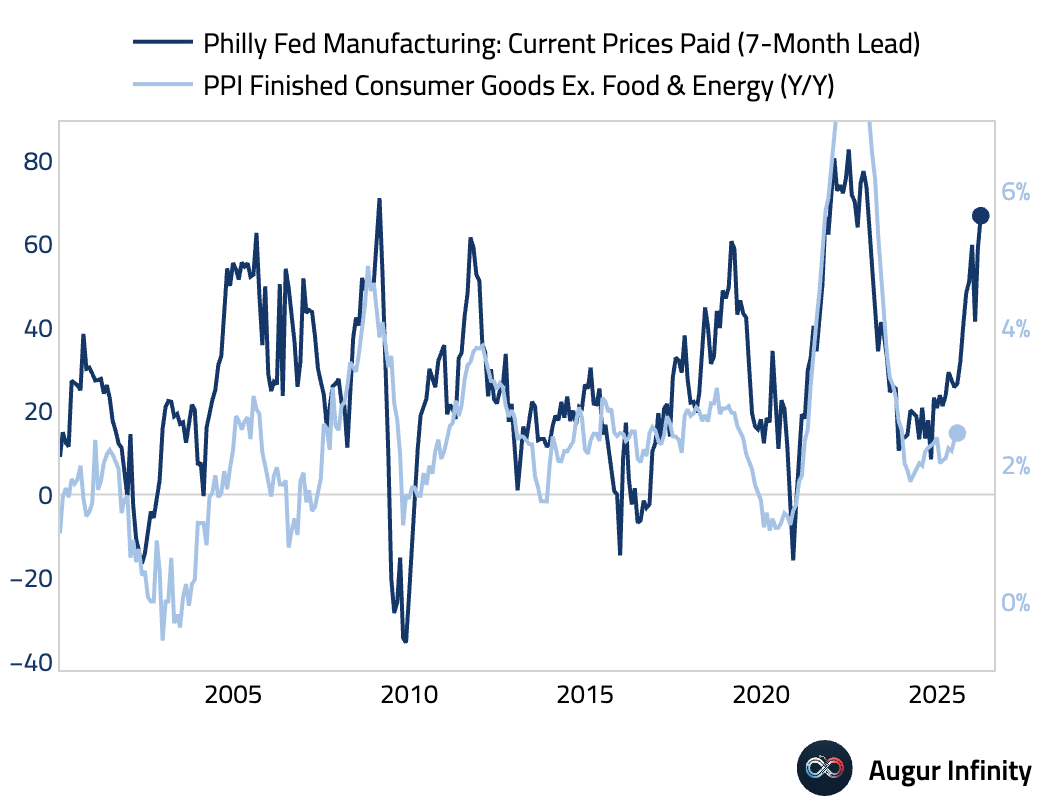
- The prices paid component of the Philadelphia Fed Manufacturing Survey surged to the highest level since May 2022, signaling persistent inflationary pressures.
Canada
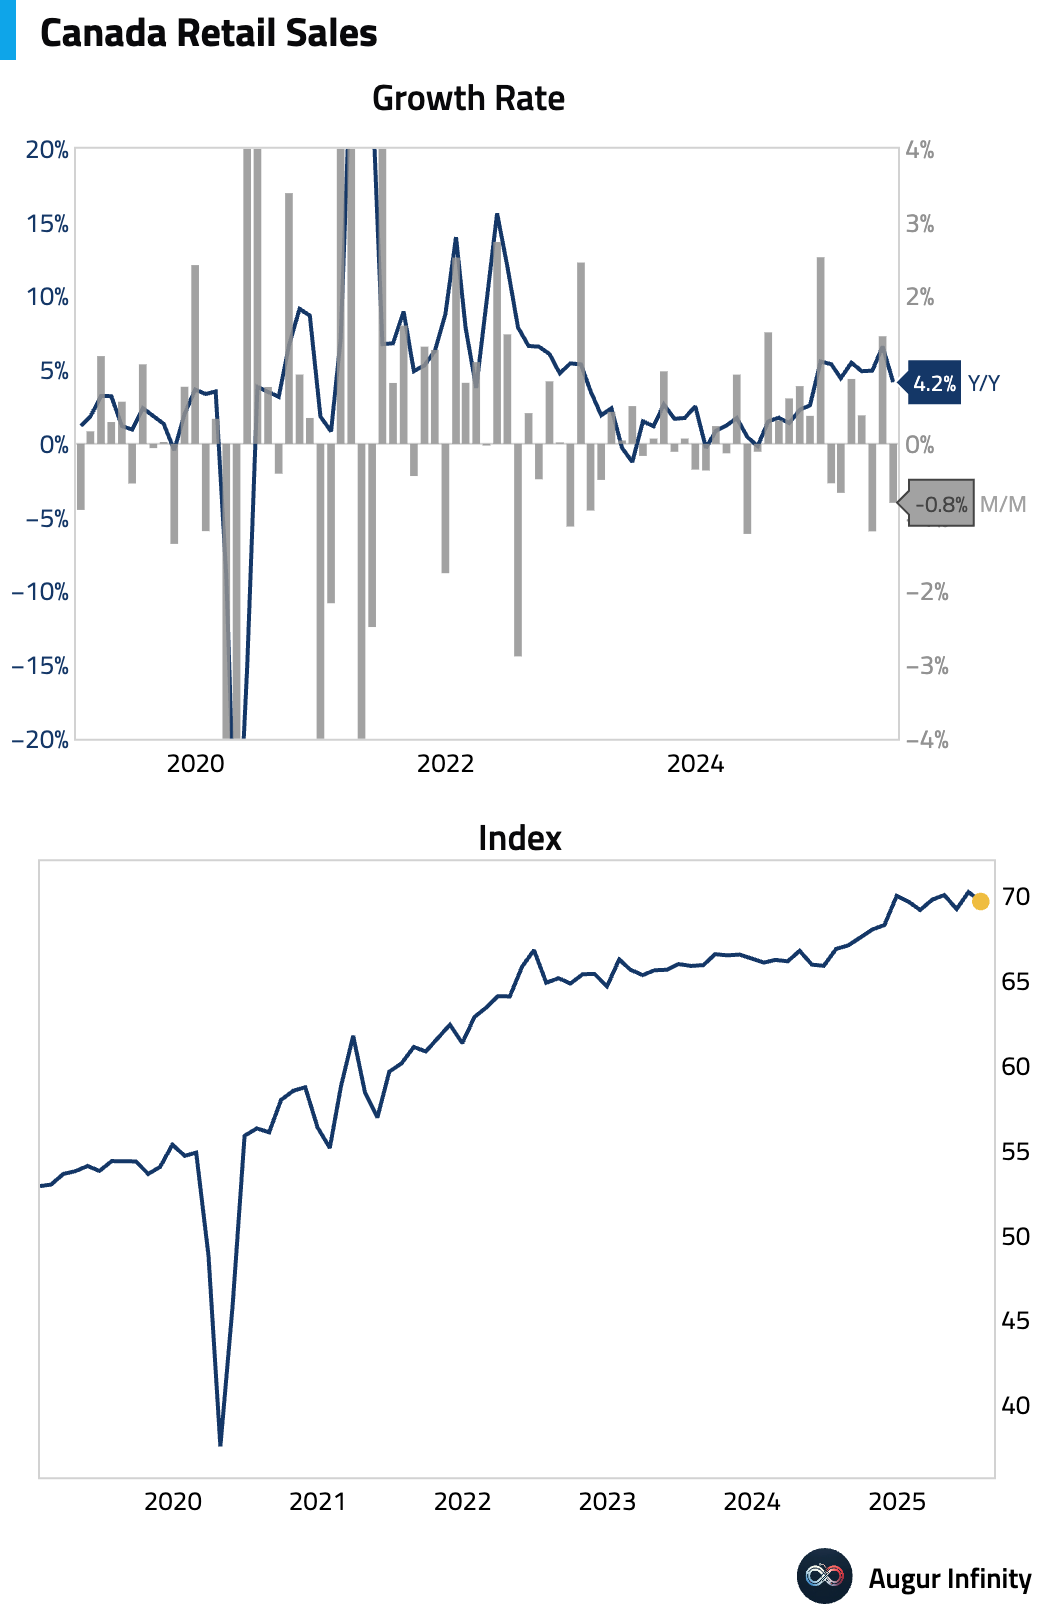
- Canadian retail sales for June rebounded, rising 1.5% M/M (from -1.2%) and accelerating to 6.6% Y/Y (from 4.9%). The ex-autos figure showed even stronger growth at 1.9% M/M, well above the 1.1% consensus and a significant turnaround from the prior -0.3%. However, the preliminary estimate for July suggests a reversal, with sales projected to fall by 0.8%.
Europe
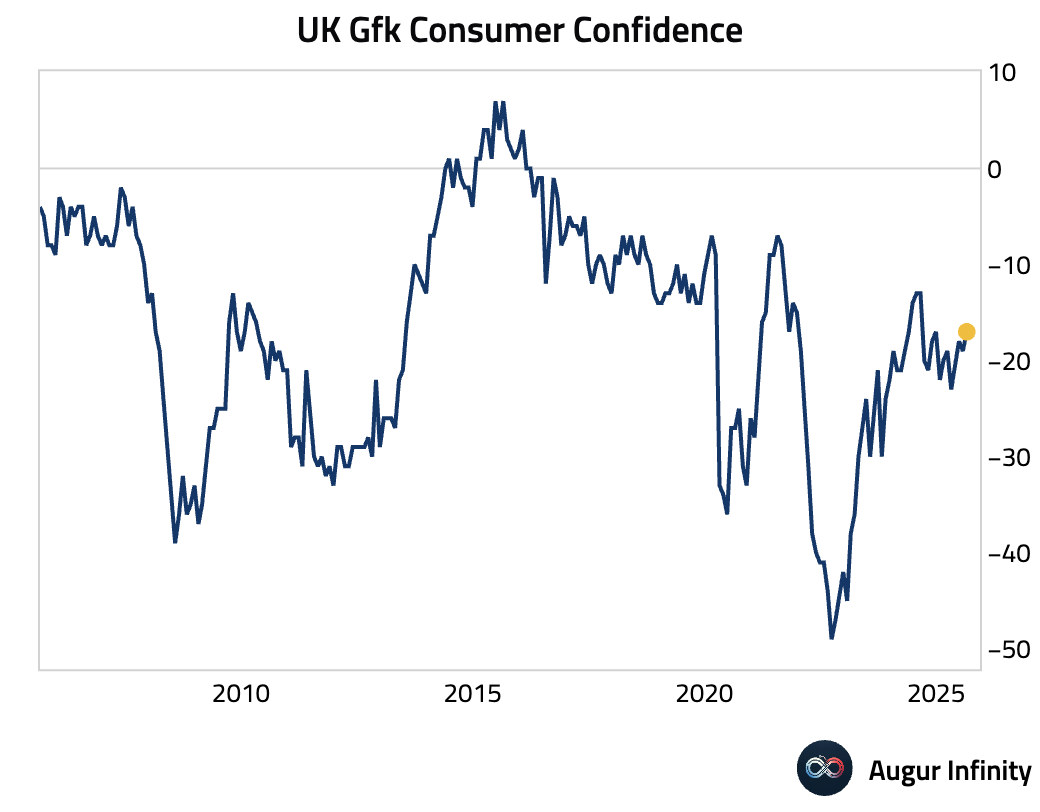
- GfK consumer confidence in the UK improved to -17 in August from -19 in July, beating the consensus estimate of -20.
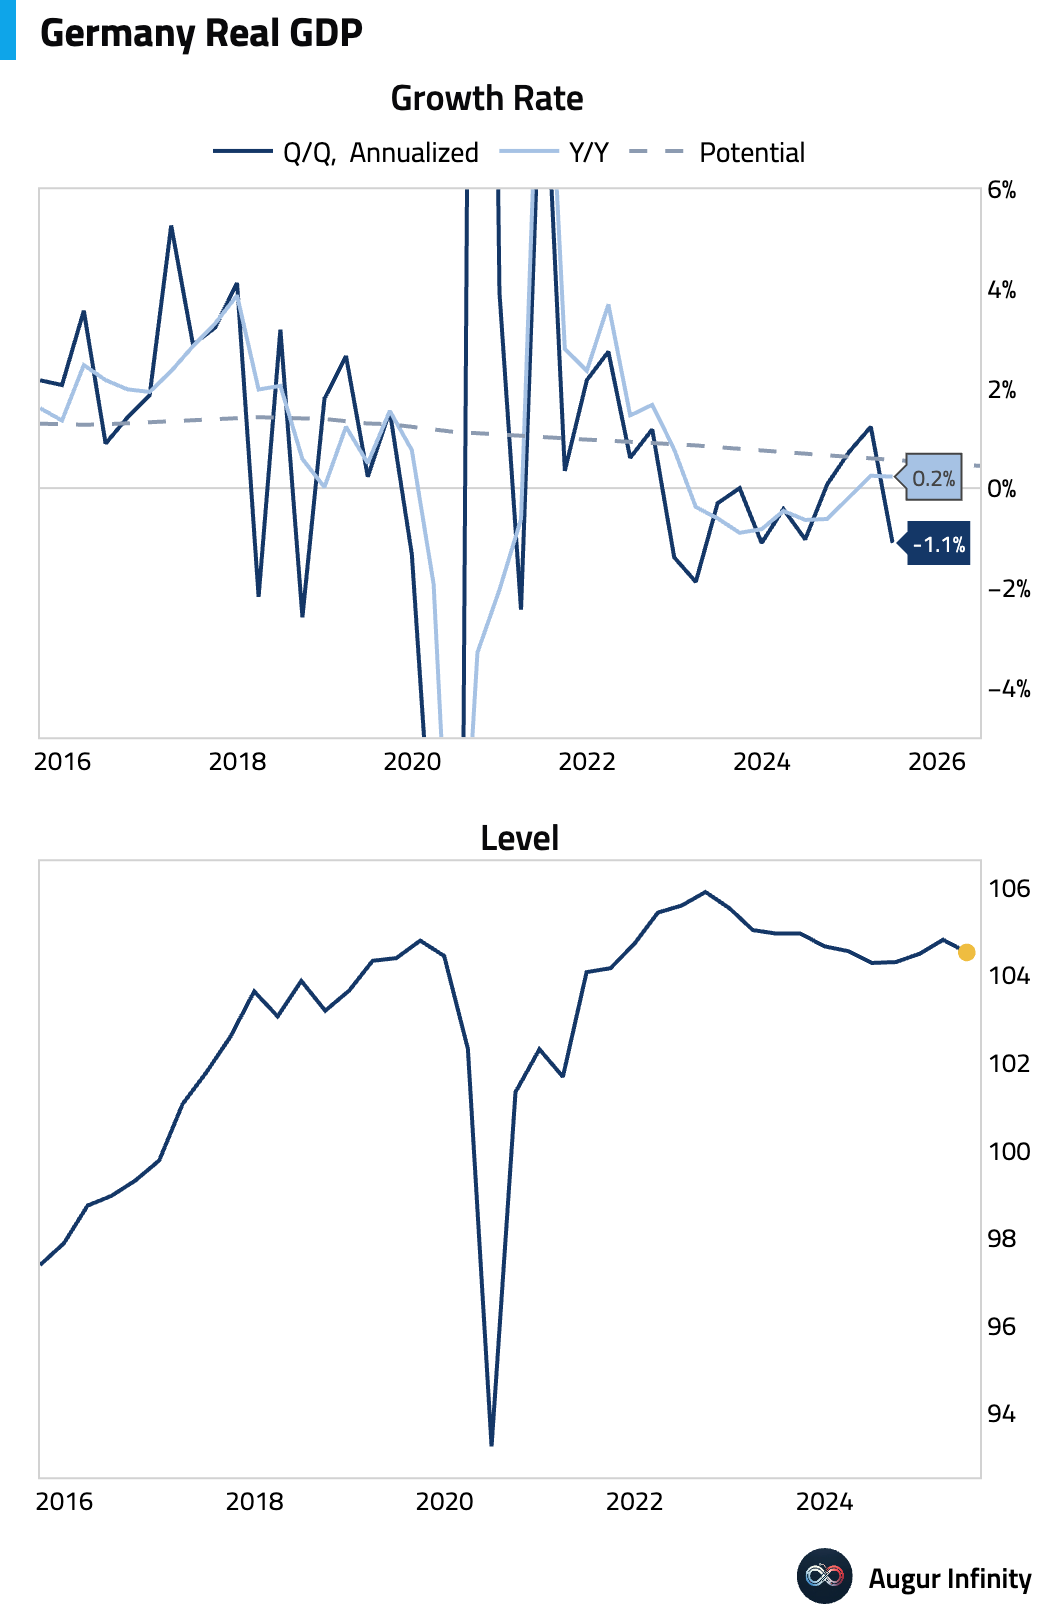
- The final estimate for Germany’s Q2 GDP confirmed a contraction, with the economy shrinking 0.3% Q/Q after 0.3% growth in Q1. The reading missed the consensus of -0.1%. Year-over-year, growth slowed to 0.2% from 0.3%, also missing the 0.4% forecast.
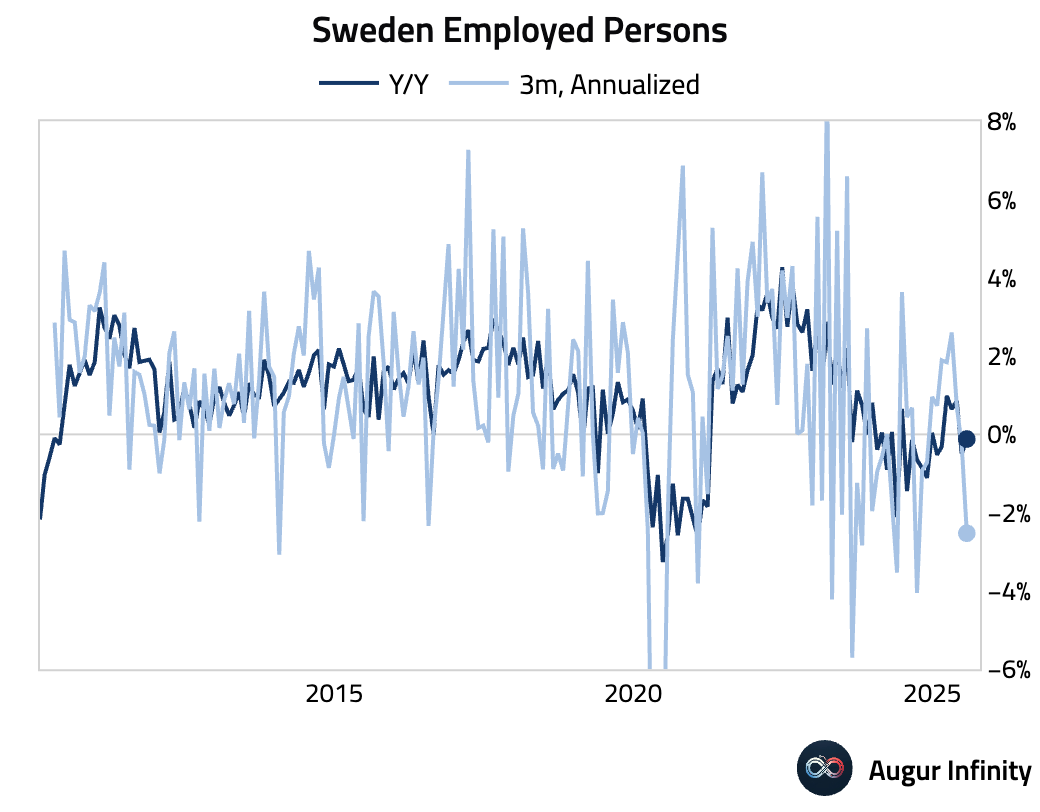
- Sweden’s employed persons rose to 5.438 million in July from 5.402 million in June.
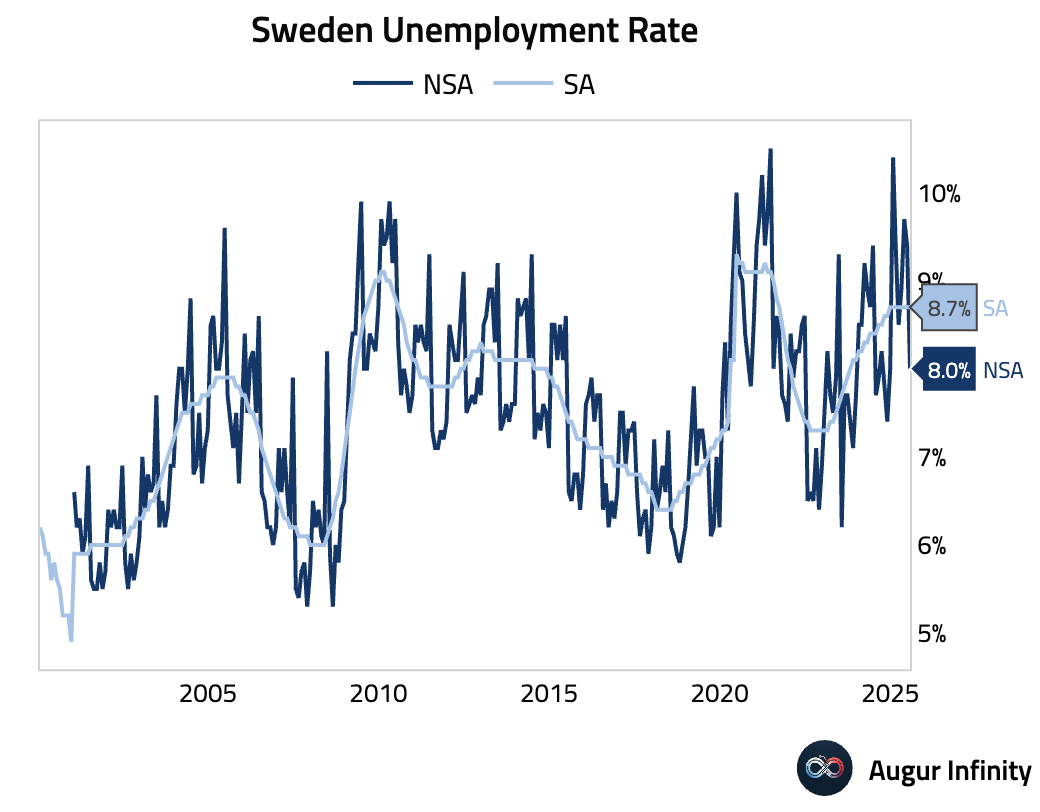
- Sweden’s unemployment rate fell sharply to 8.0% in July from 9.4% in June, its lowest level since November 2024.
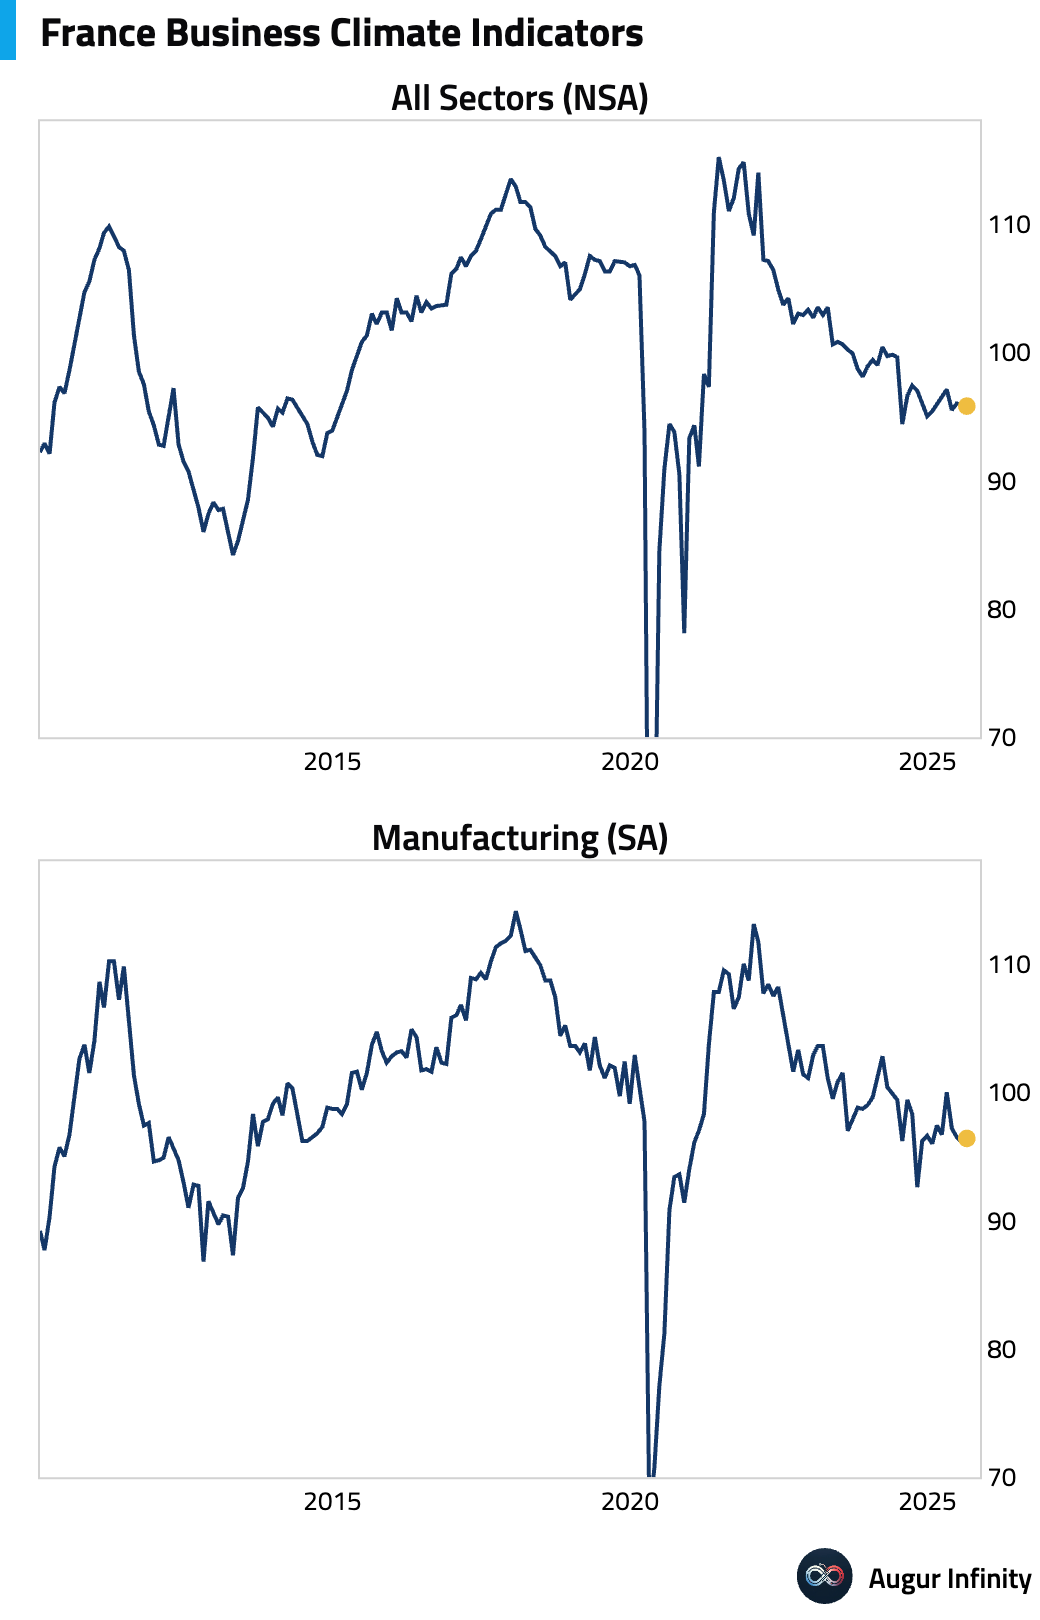
- France’s business confidence and business climate indicators were both unchanged at 96 in August, matching consensus for the confidence reading.
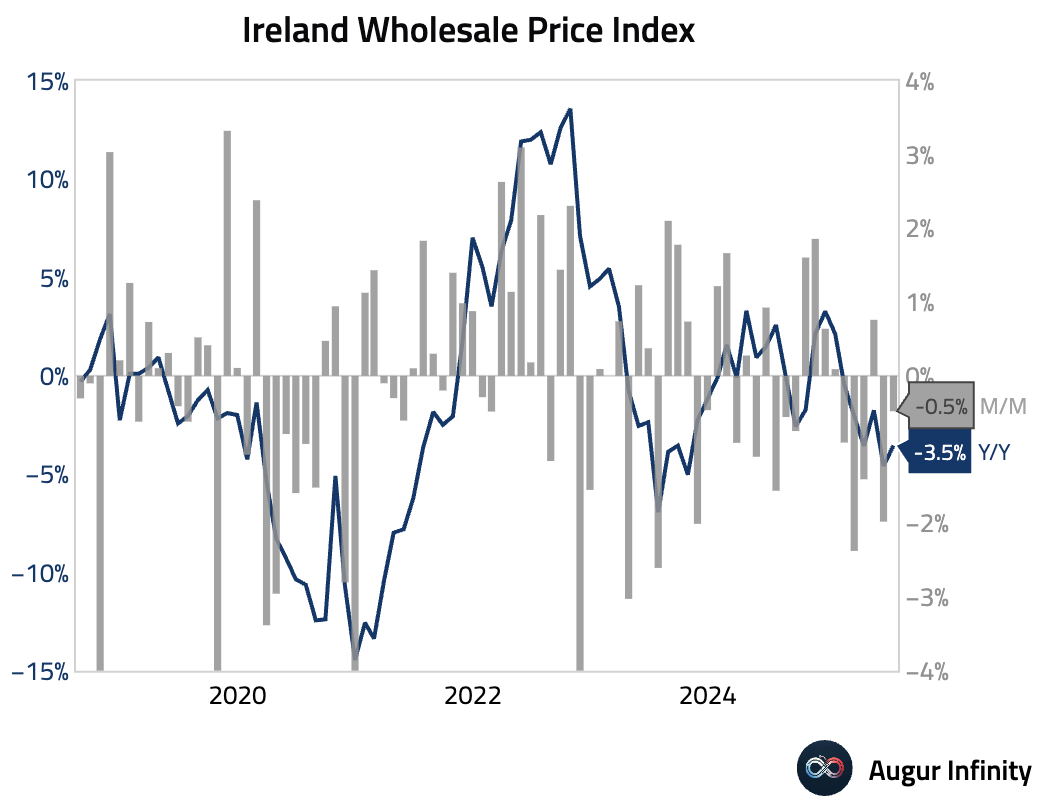
- Irish wholesale prices fell 3.5% Y/Y in July, a slight improvement from the 4.6% decline in June. On a monthly basis, prices were down 0.5% after a 2.0% drop previously.
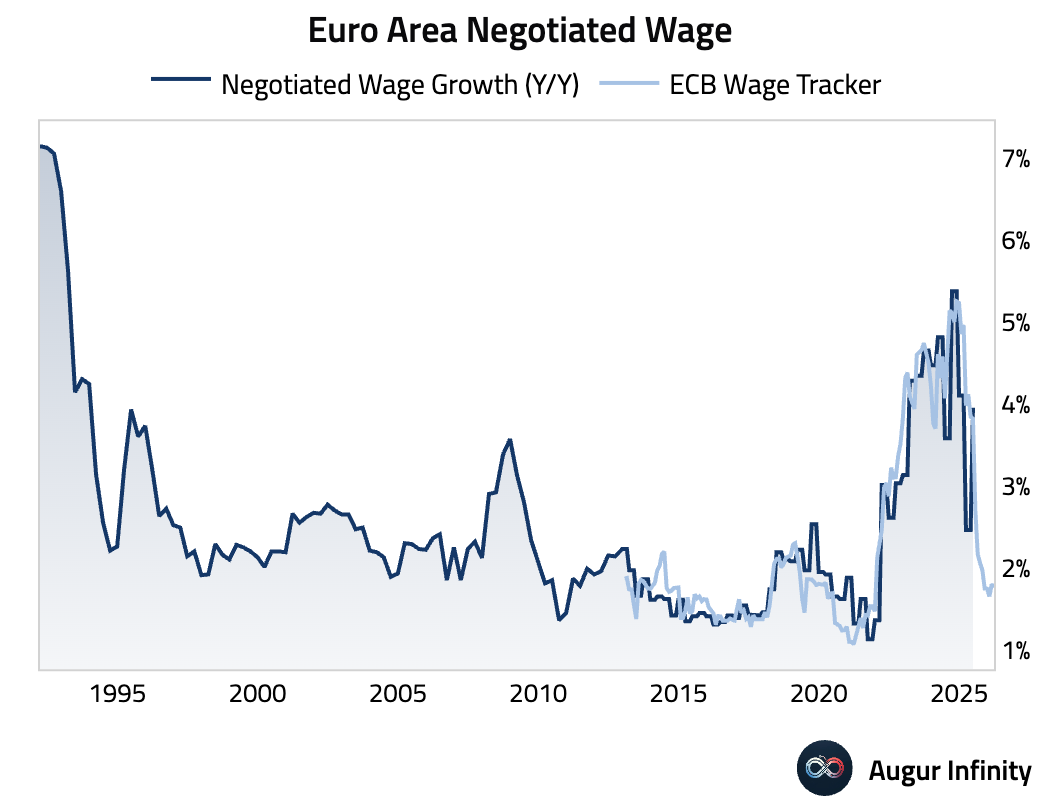
- Eurozone negotiated wage growth accelerated to 3.95% in Q2 from a revised 2.46% in Q1.
Asia-Pacific
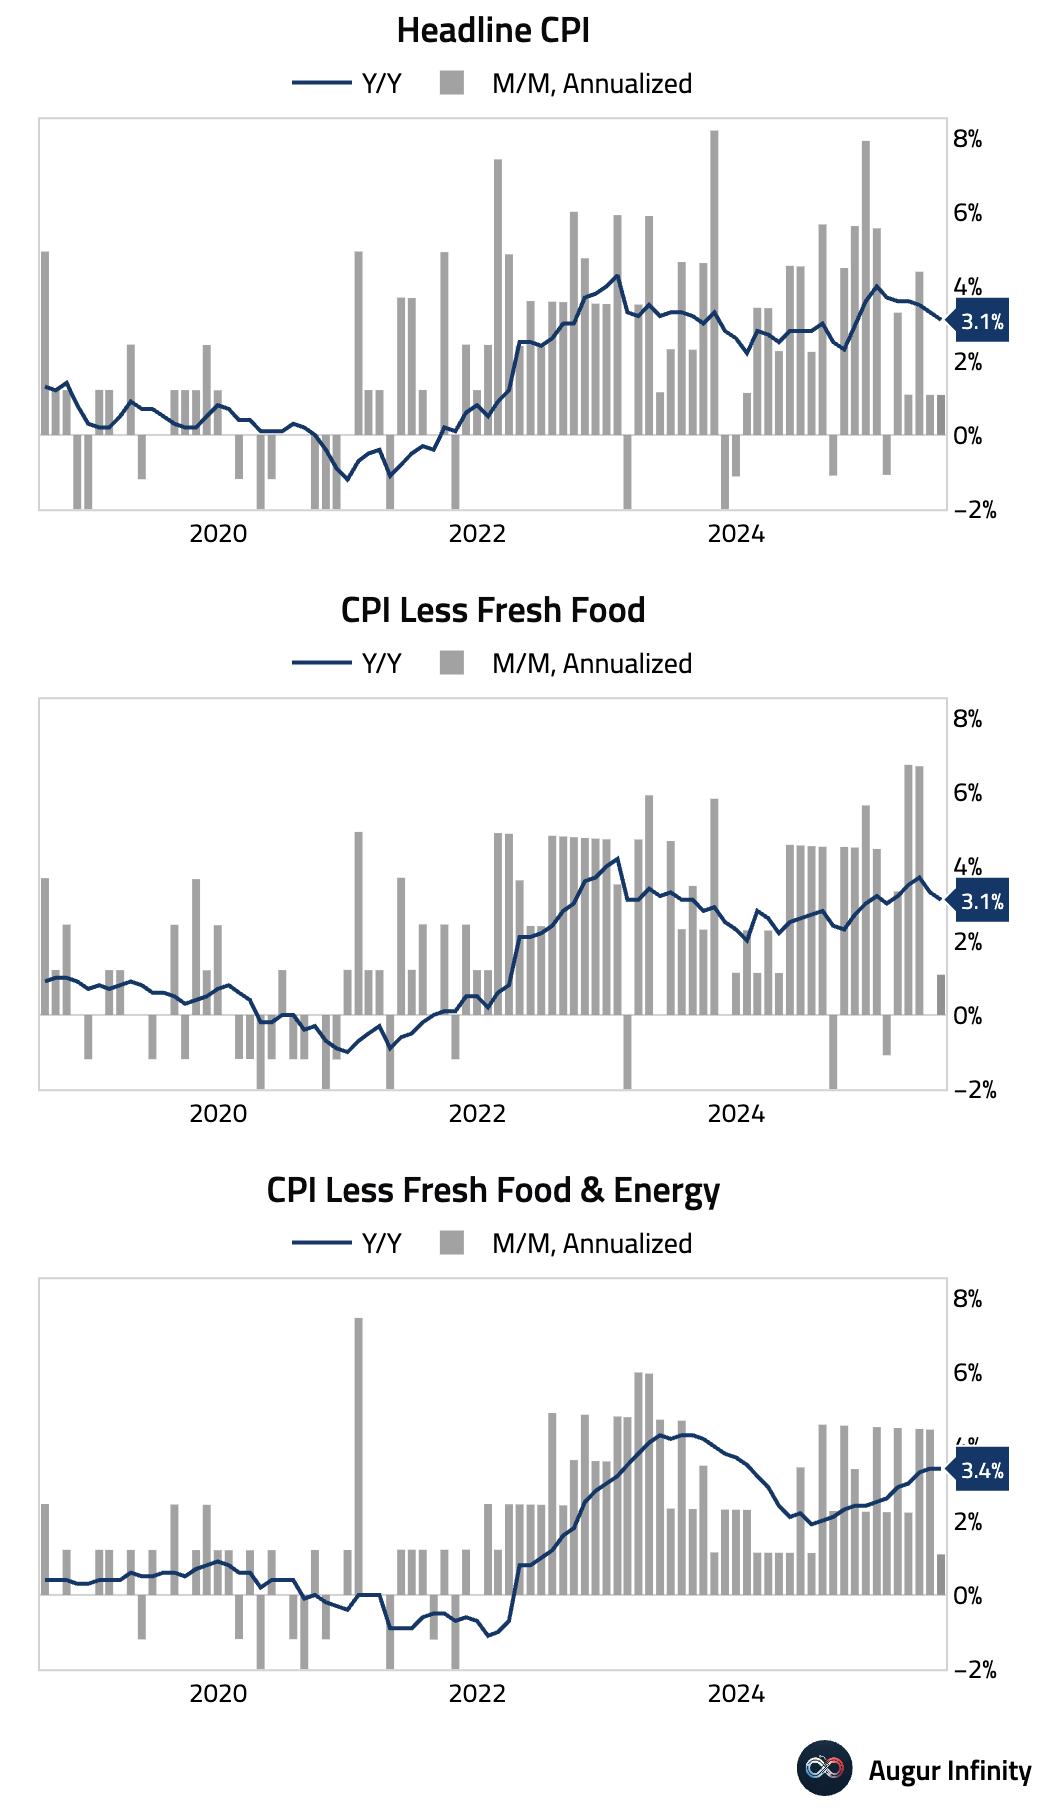
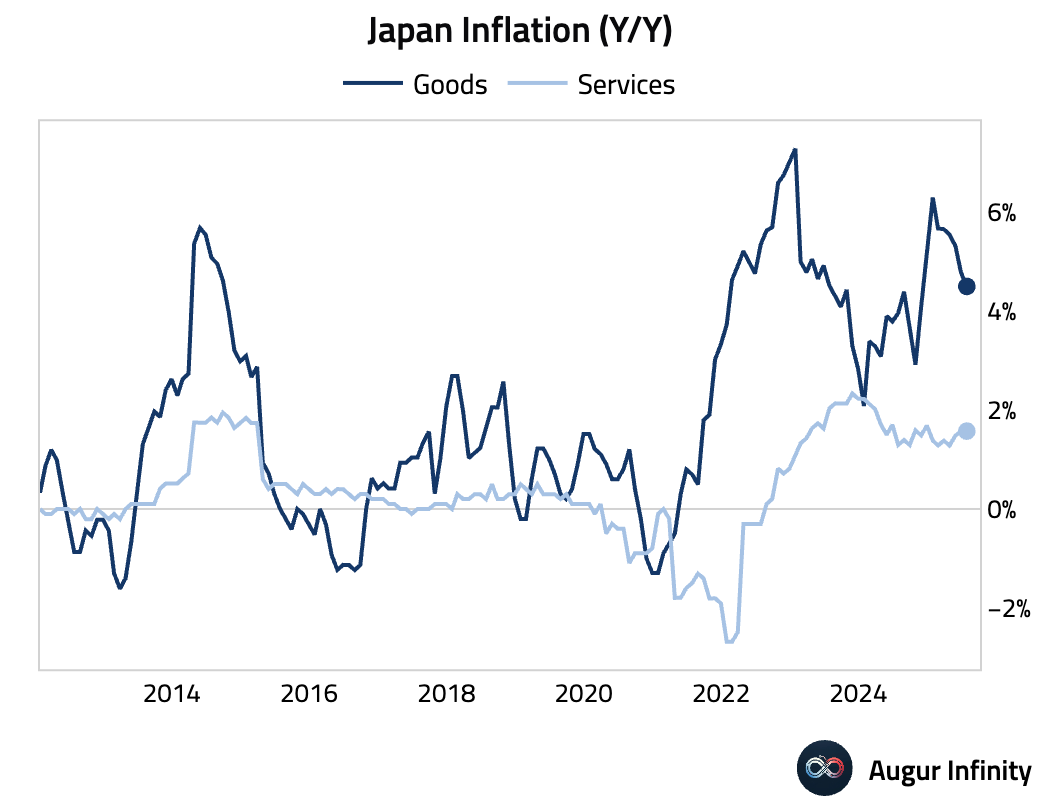
- Japan’s headline inflation for July slowed to 3.1% Y/Y from 3.3% in June, while the core rate (ex-fresh food) also eased to 3.1% from 3.3%, though this was slightly above the 3.0% consensus. The core-core rate (ex-fresh food and energy) held steady at 3.4%. The slowdown in core CPI was driven entirely by energy prices turning negative year-over-year due to lower fuel import costs, which masked stickier inflation elsewhere. Private services inflation, a key indicator for the Bank of Japan, decelerated slightly.
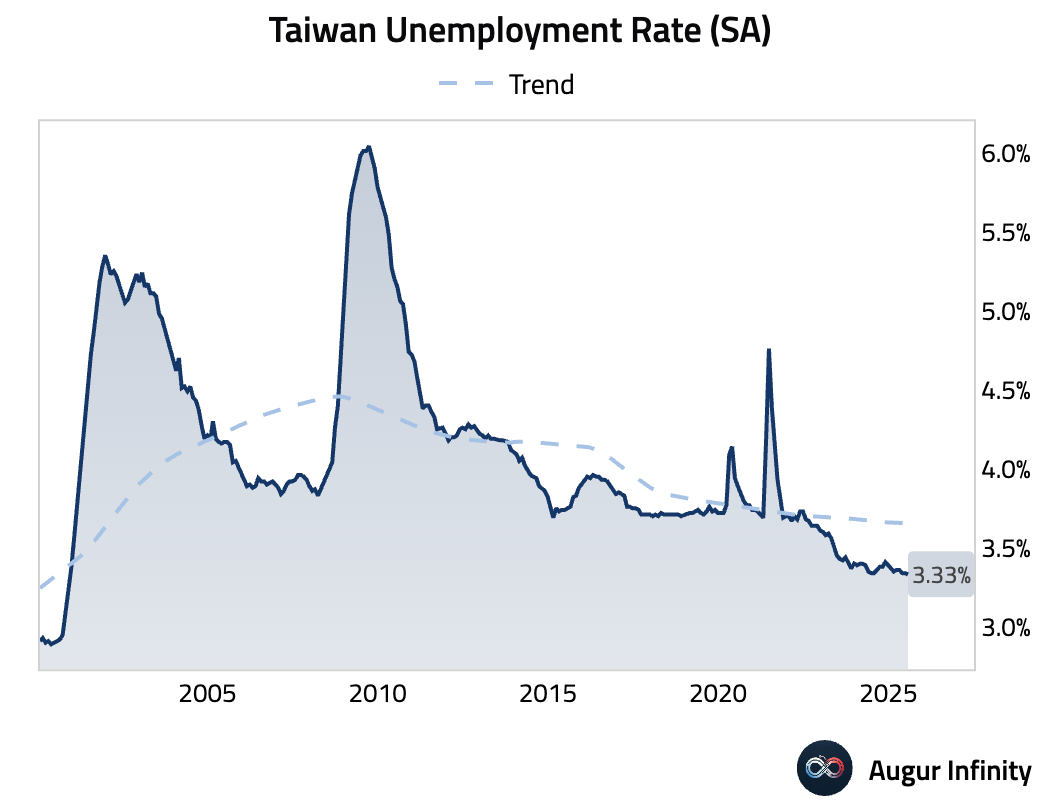
- Taiwan’s unemployment rate edged down to 3.33% in July from 3.34% in June, marking its lowest level since November 2000.
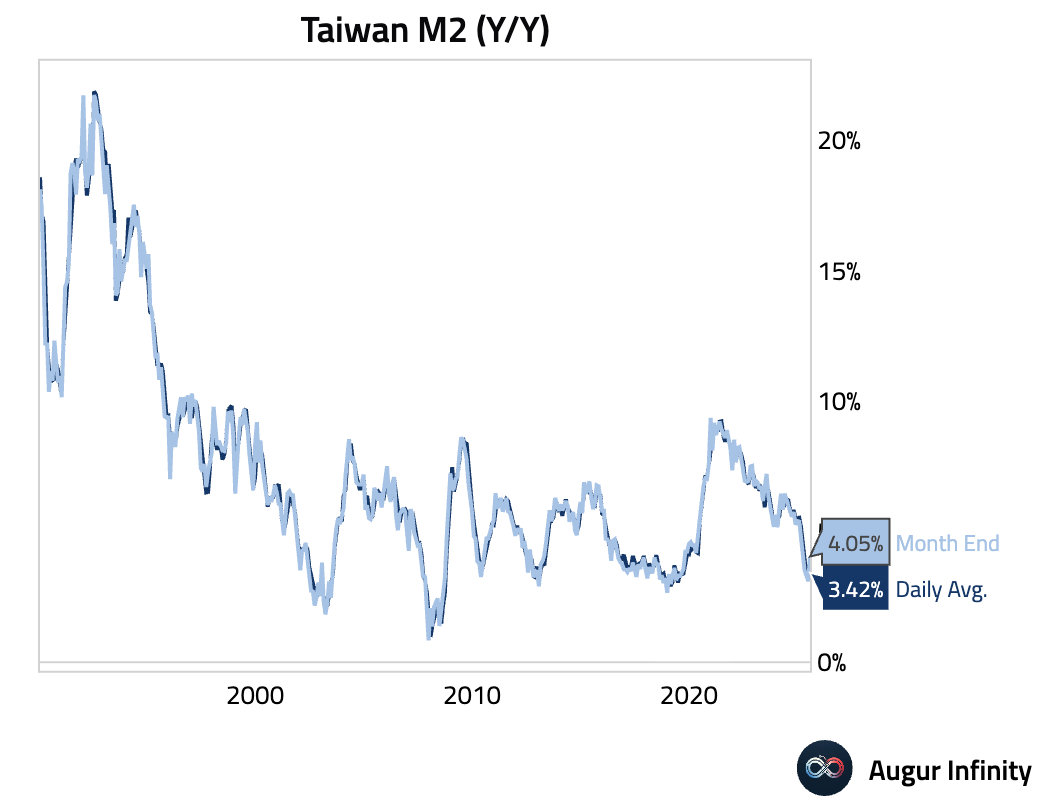
- Taiwan’s M2 money supply growth slowed to 3.42% Y/Y in July from 3.45% in June.
China
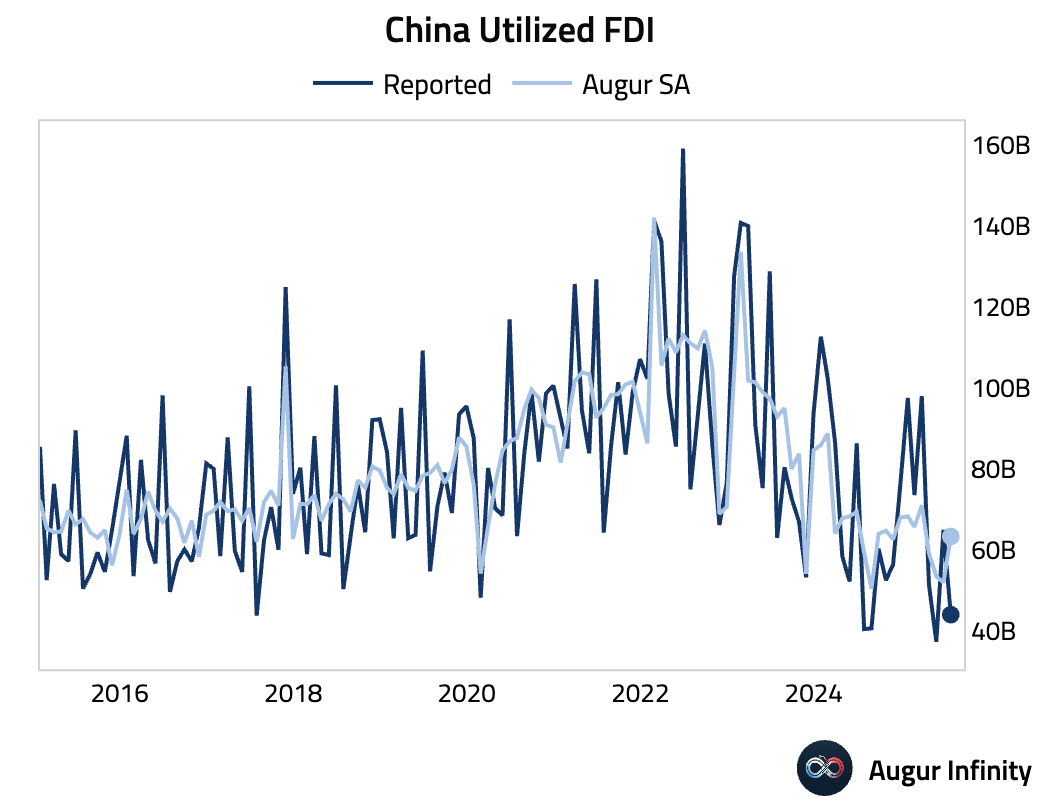
- Utilized foreign direct investment in China fell 13.4% Y/Y in July, an improvement from the 15.2% decline in June.
Emerging Markets ex China
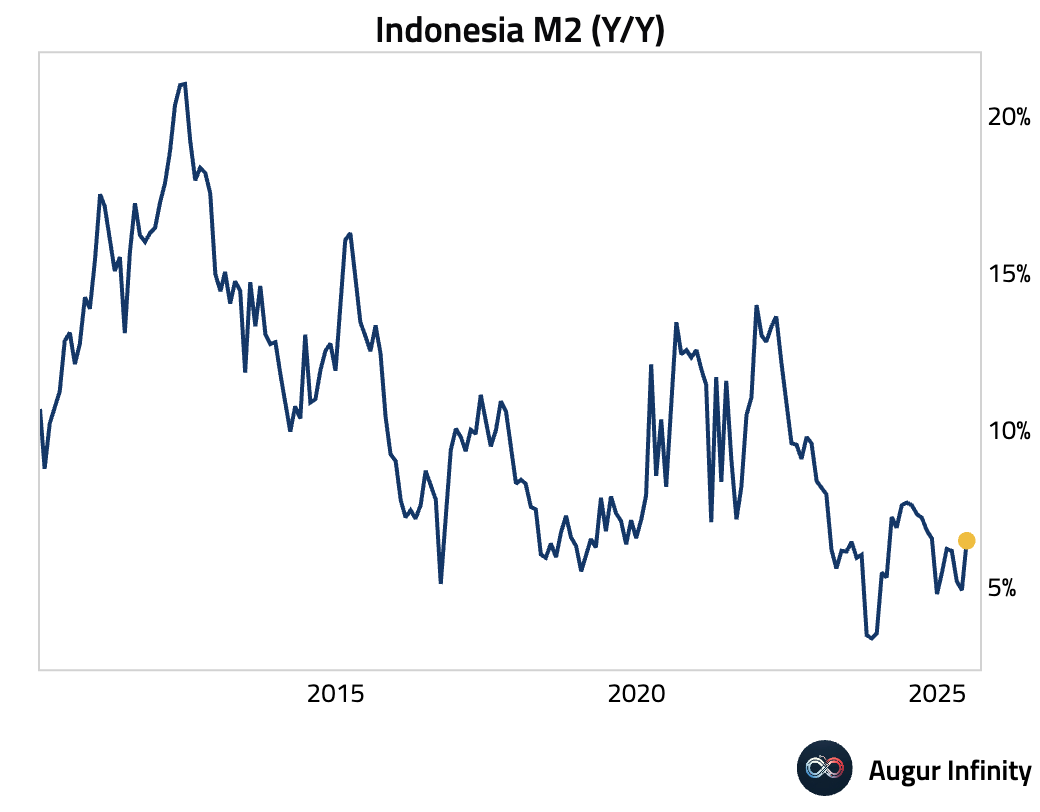
- Indonesia’s M2 money supply growth increased to 6.5% Y/Y in July from 6.4% in June.
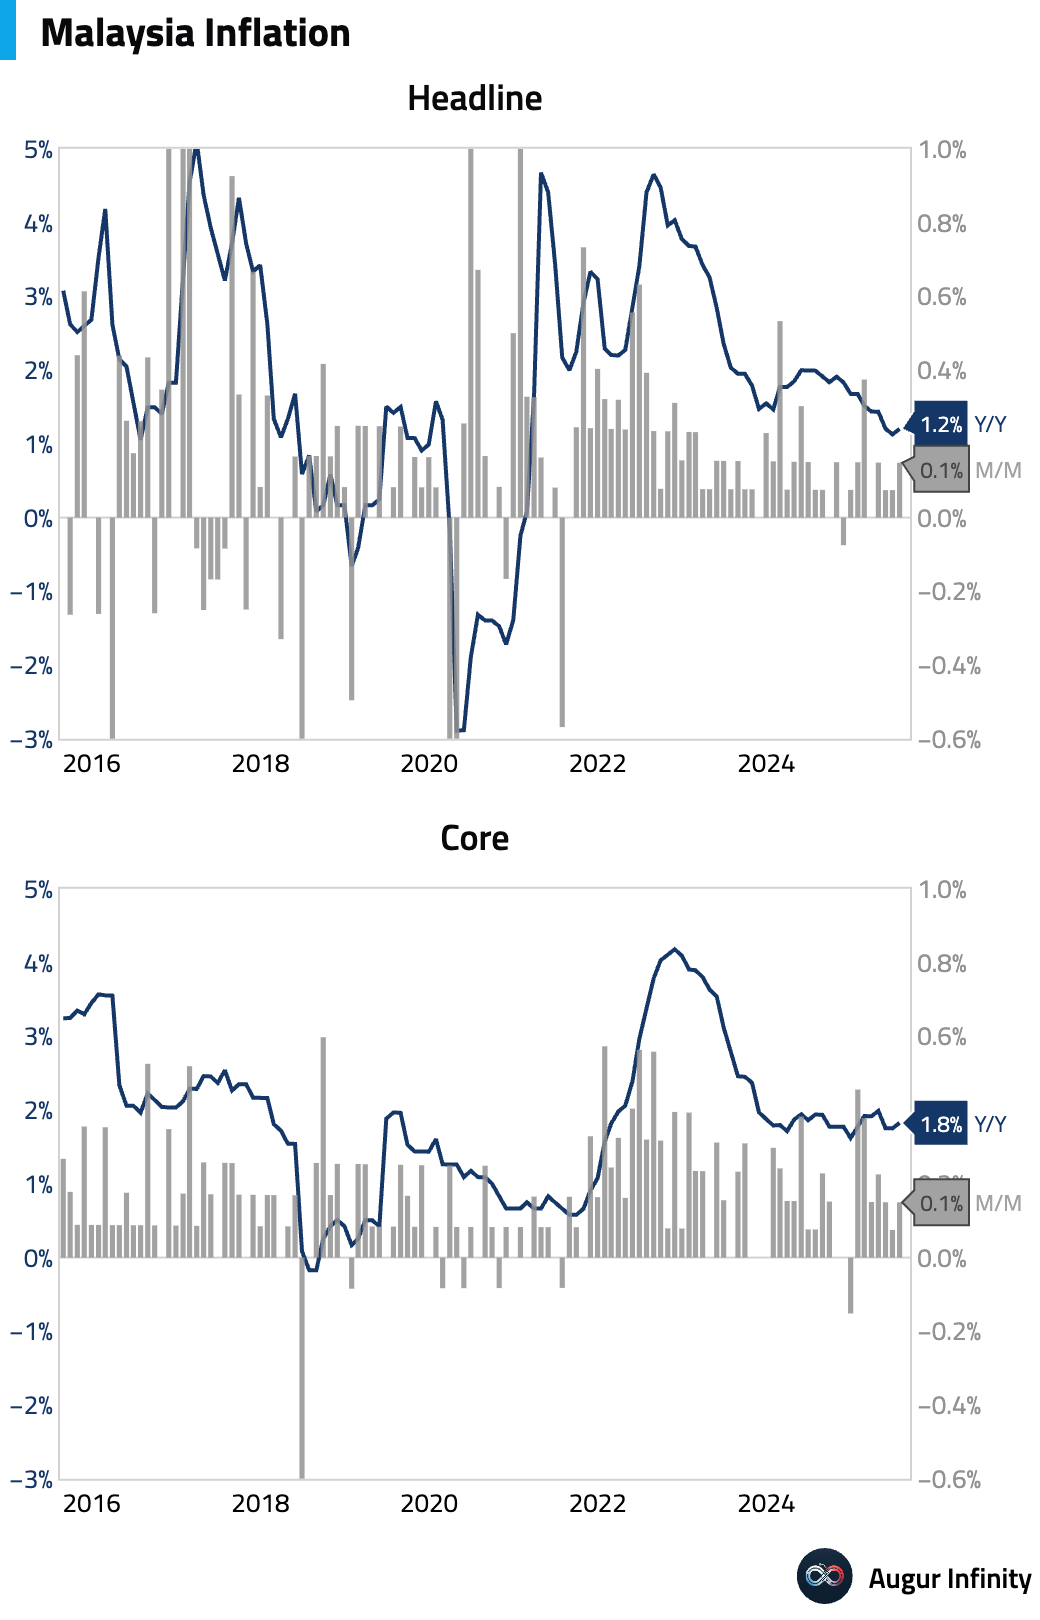
- Malaysia’s inflation rate for July rose to 1.2% Y/Y, in line with consensus and up from 1.1% in June. The monthly rate was stable at 0.1%. A 15% surge in insurance premiums drove the annual increase, while core inflation held steady at 1.8% Y/Y, suggesting the headline move was not broad-based.
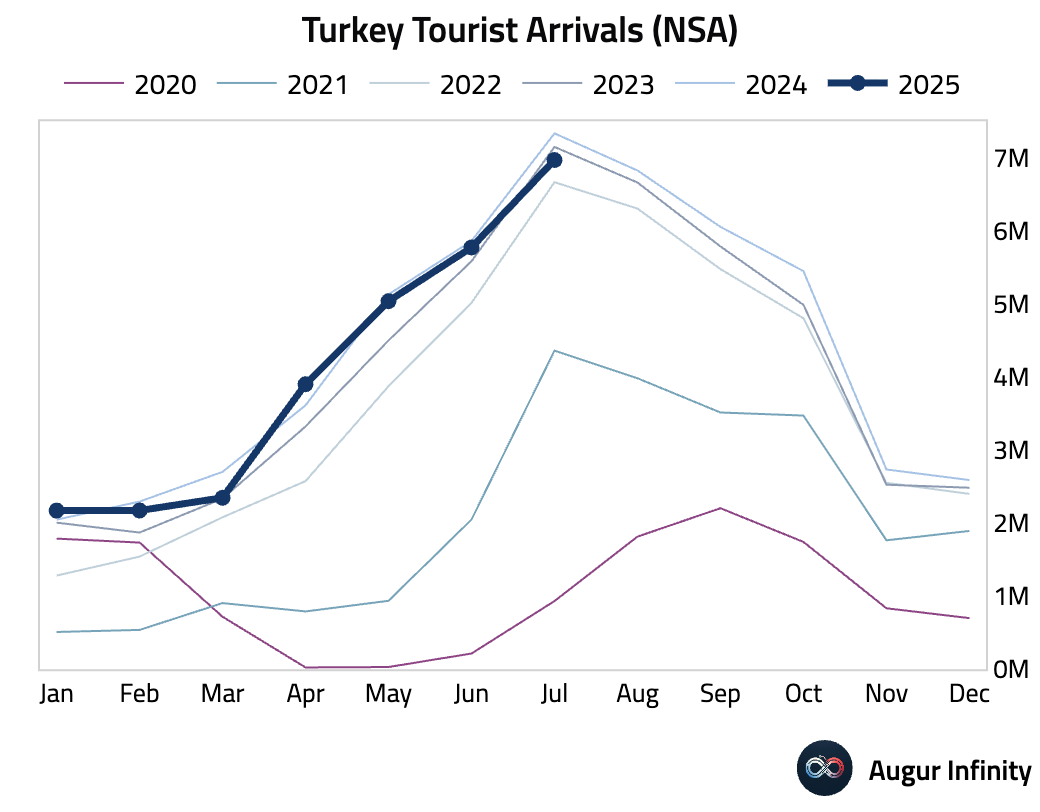
- Tourist arrivals in Turkey dropped 4.97% Y/Y in July, a steeper decline than the 1.5% fall in June.
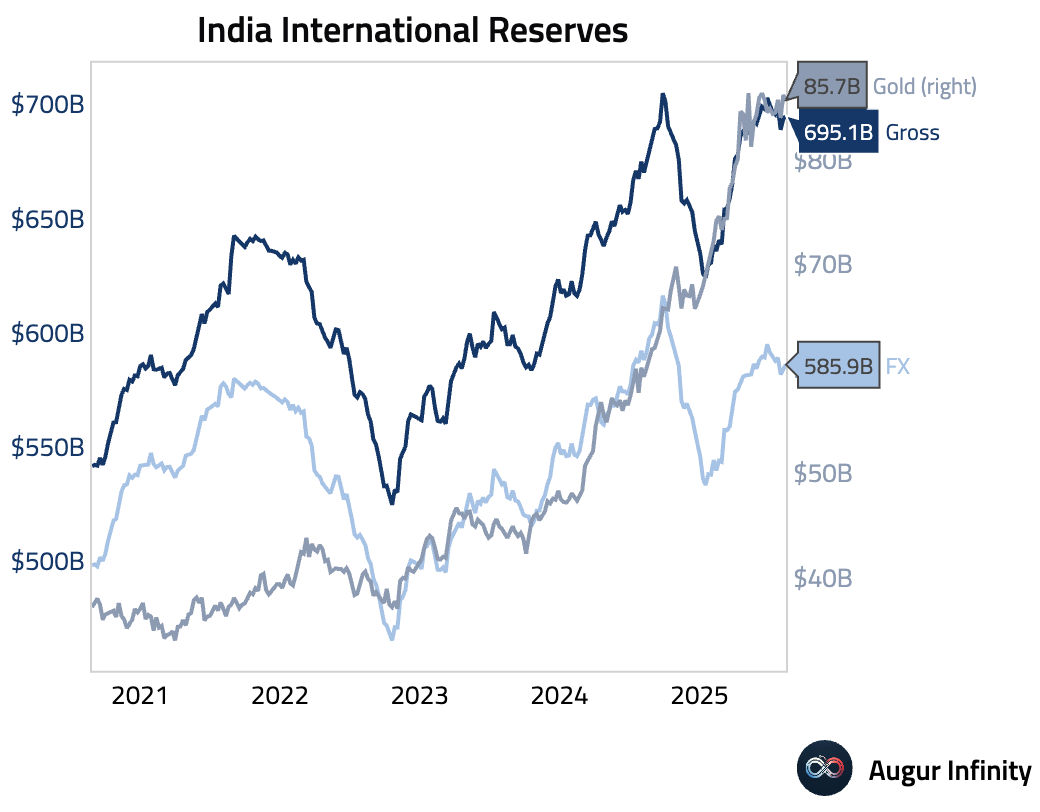
- India's official reserve assets increased to $695.11 billion from $693.62 billion in the previous week.
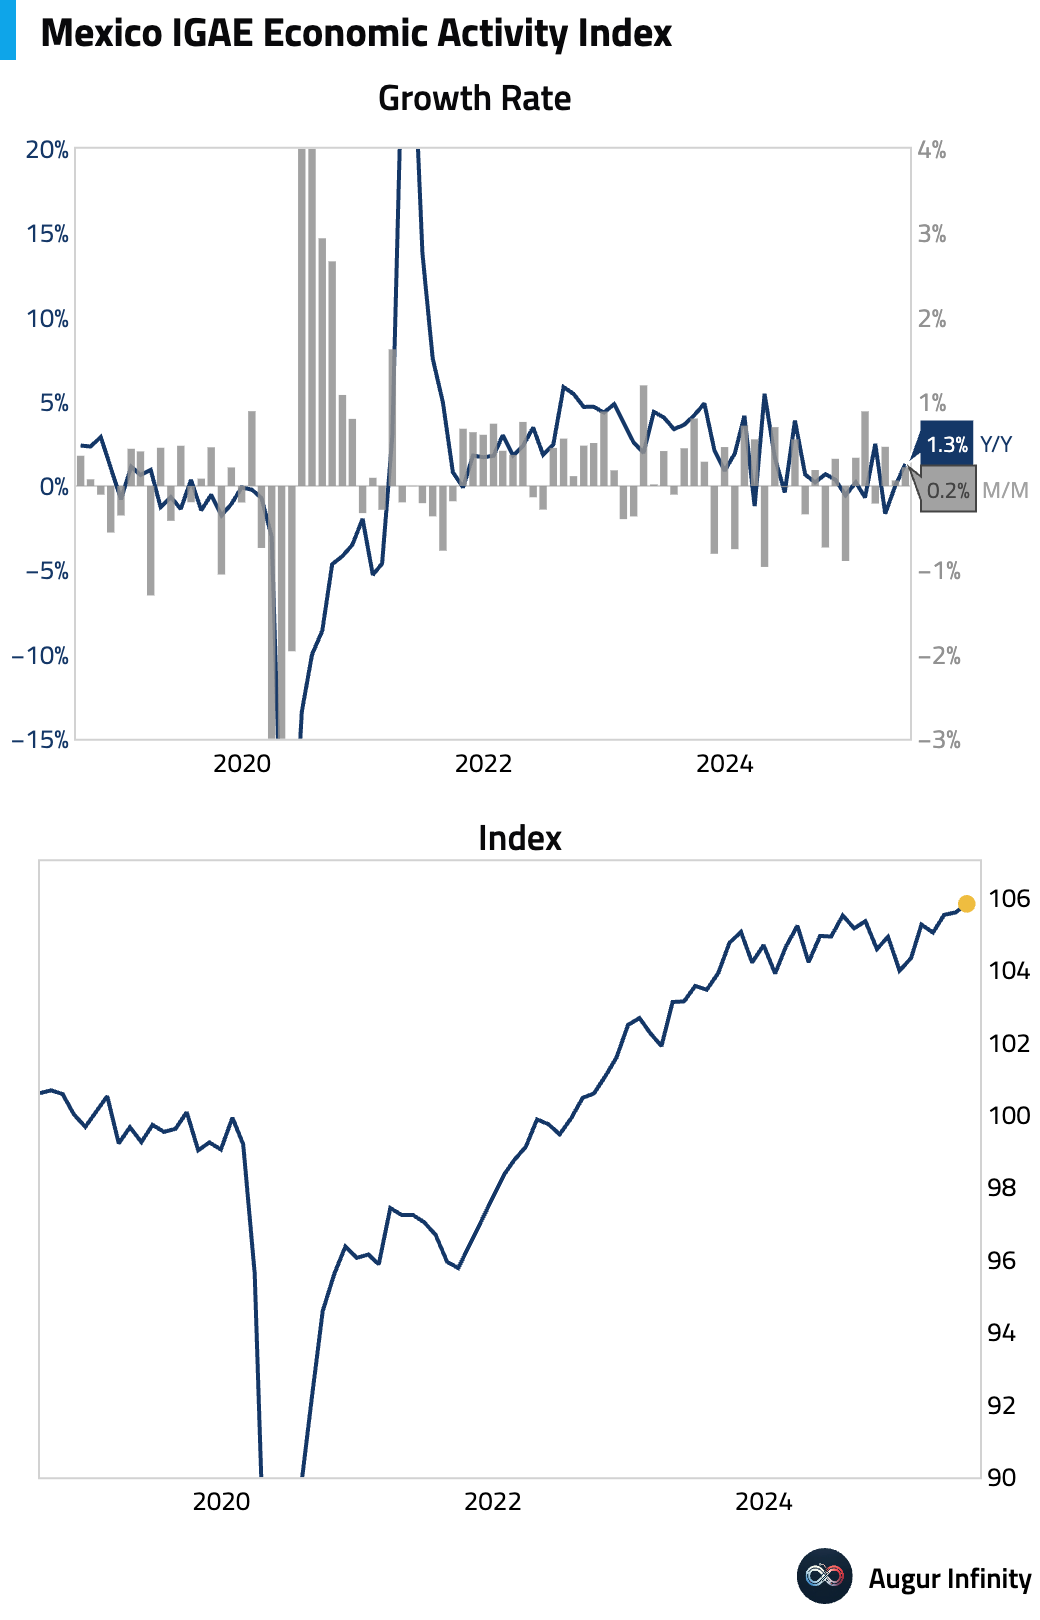
- Mexico’s IGAE economic activity indicator for June rose 0.2% M/M, slightly below the 0.3% consensus, but up from 0.1% previously. Year-over-year, activity expanded 1.3%, missing the 1.5% forecast but recovering from a flat reading in May.
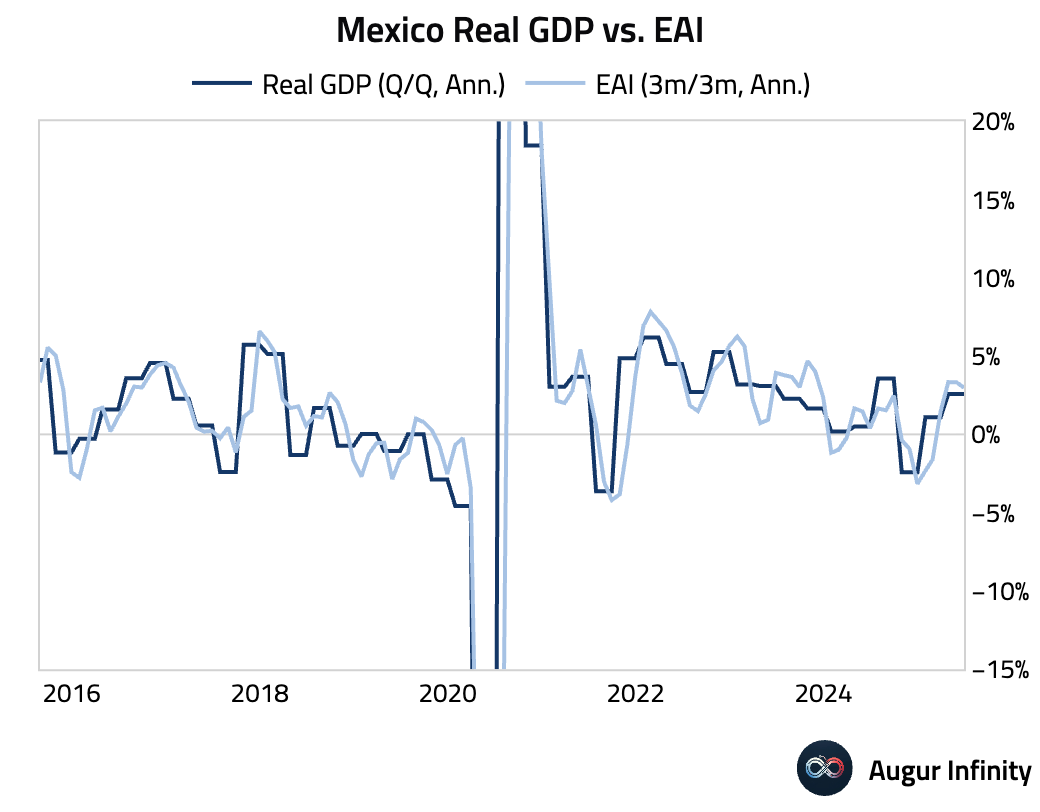
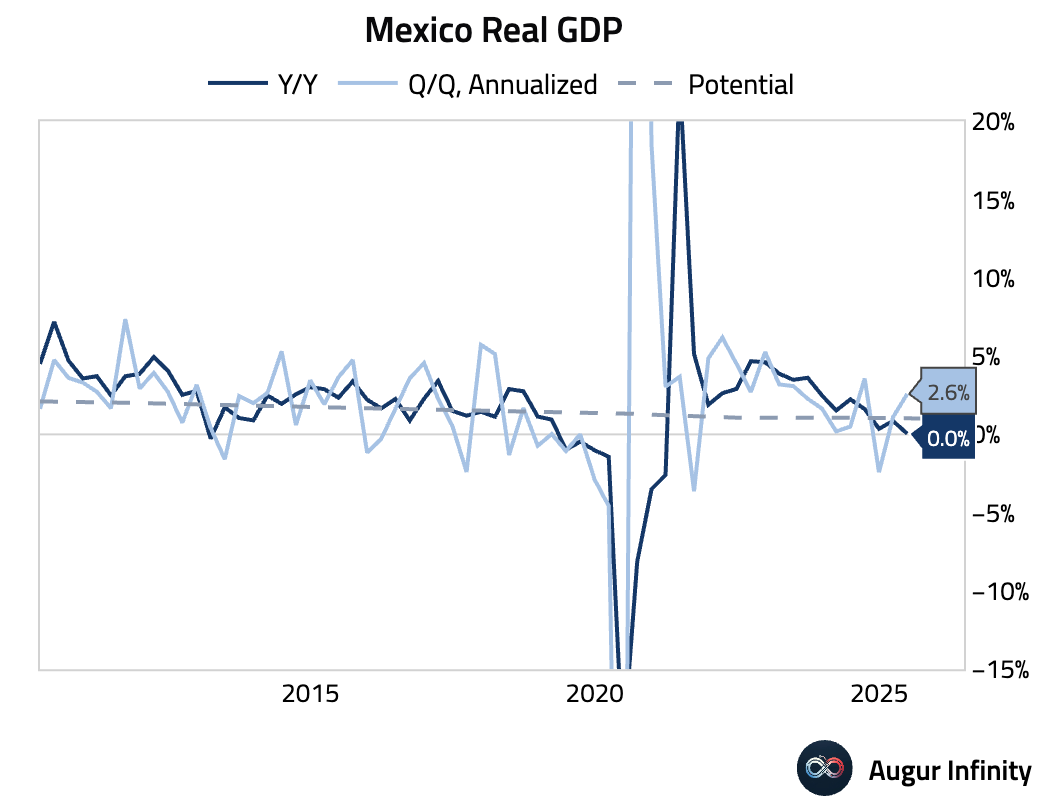
- The final estimate for Mexico’s Q2 GDP showed growth of 0.6% Q/Q, firming from 0.2% in Q1. The print was driven by strong performance in the secondary and services sectors, particularly construction. The year-over-year reading was flat at 0.0%, below the 0.1% consensus.
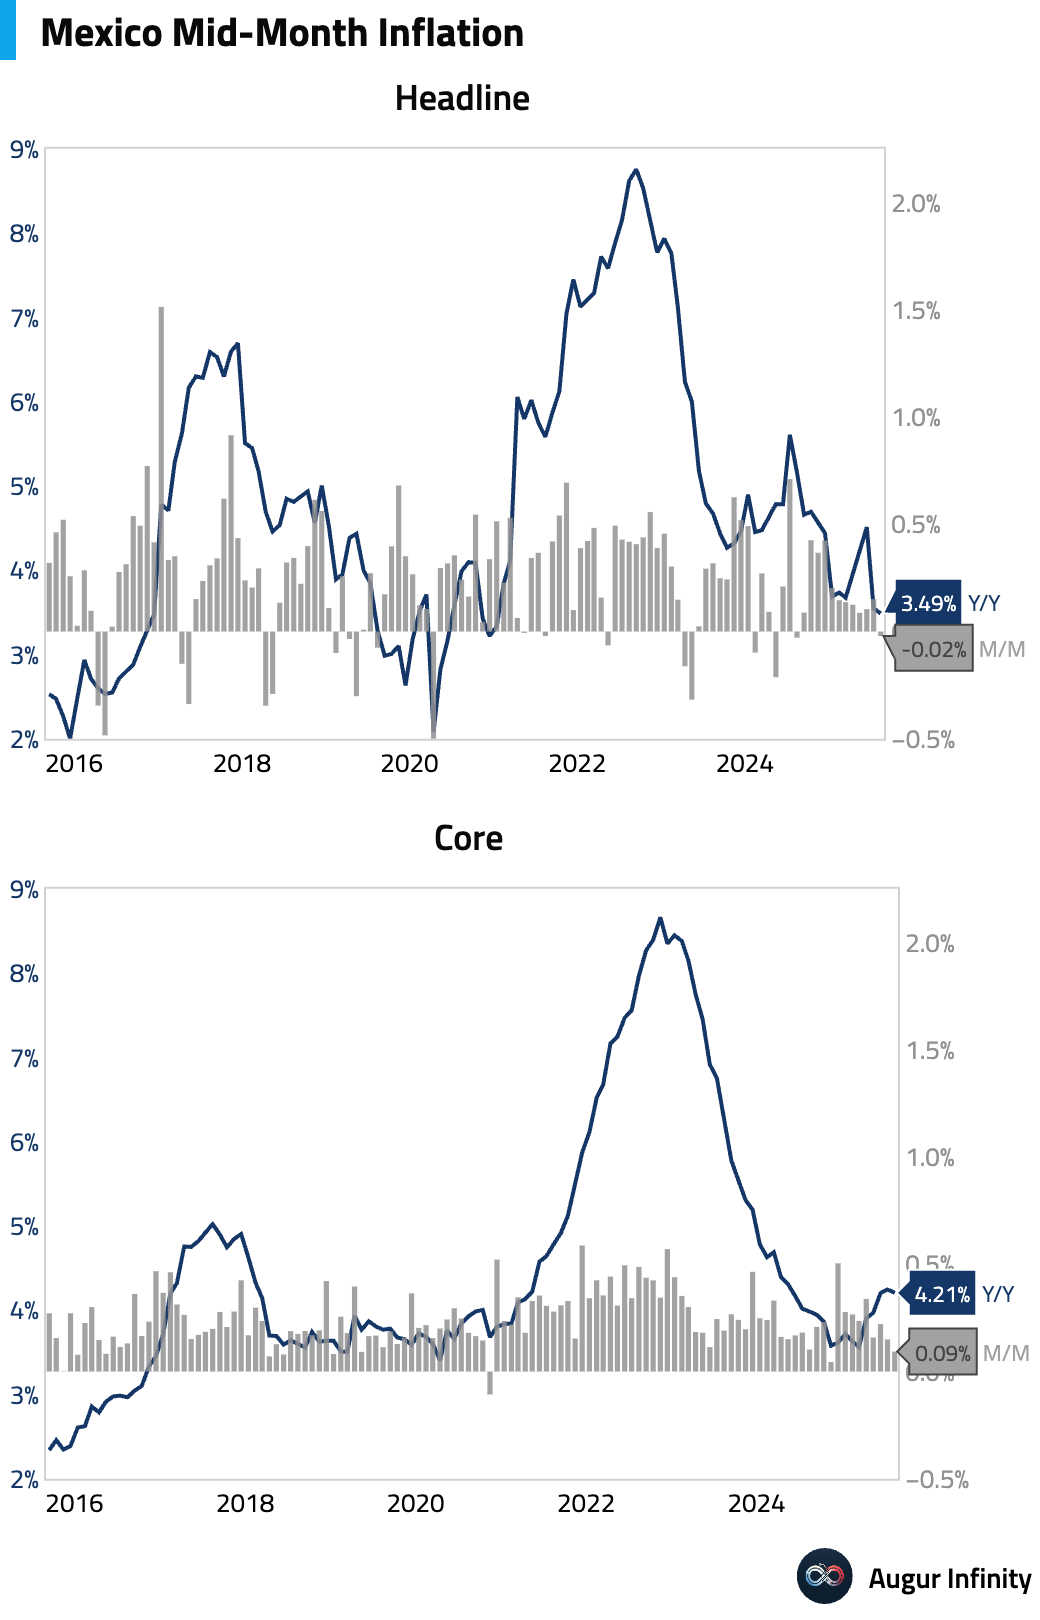
- Mexico’s mid-month inflation for August came in cooler than expected. The headline rate fell 0.02% M/M (vs. +0.12% consensus) and slowed to 3.49% Y/Y (vs. 3.66% consensus), the lowest since January 2021. Core inflation also surprised to the downside, rising 0.09% M/M (vs. +0.14% consensus) and easing to 4.21% Y/Y. The unexpected drop in headline inflation was driven by a sharp fall in non-core food prices, though services inflation remains stubbornly high.
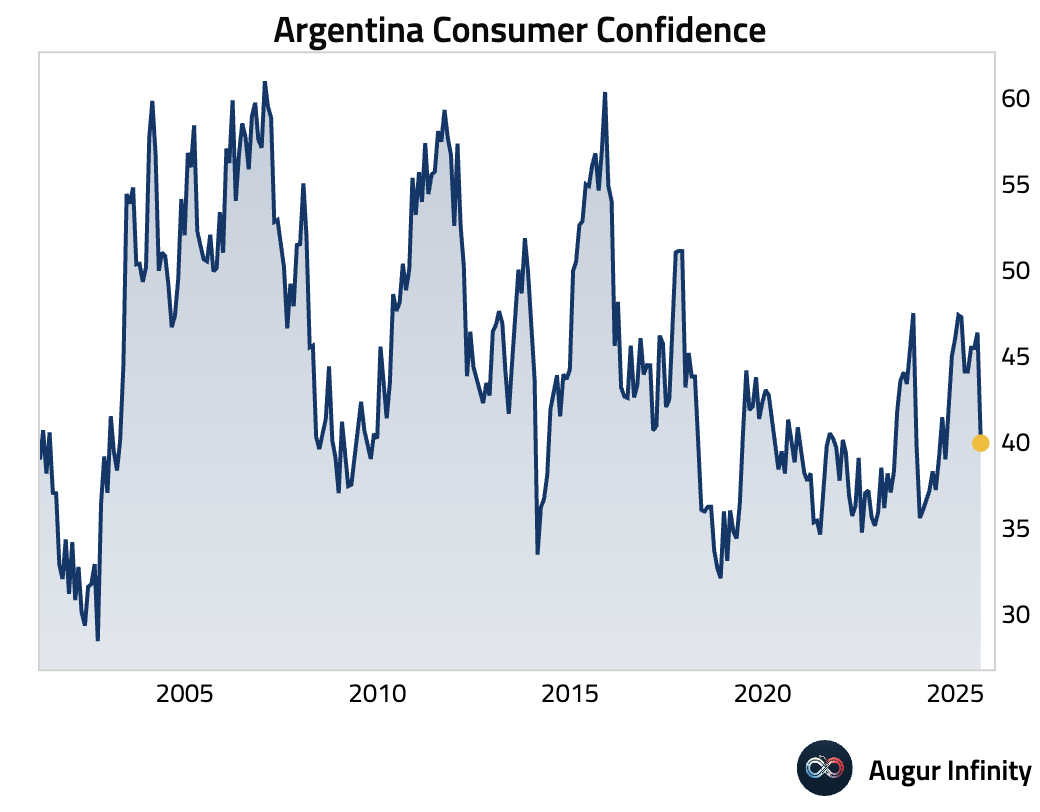
- Argentina’s consumer confidence plunged to 39.94 in August from 46.37 in July.
Global Markets
Cross Asset
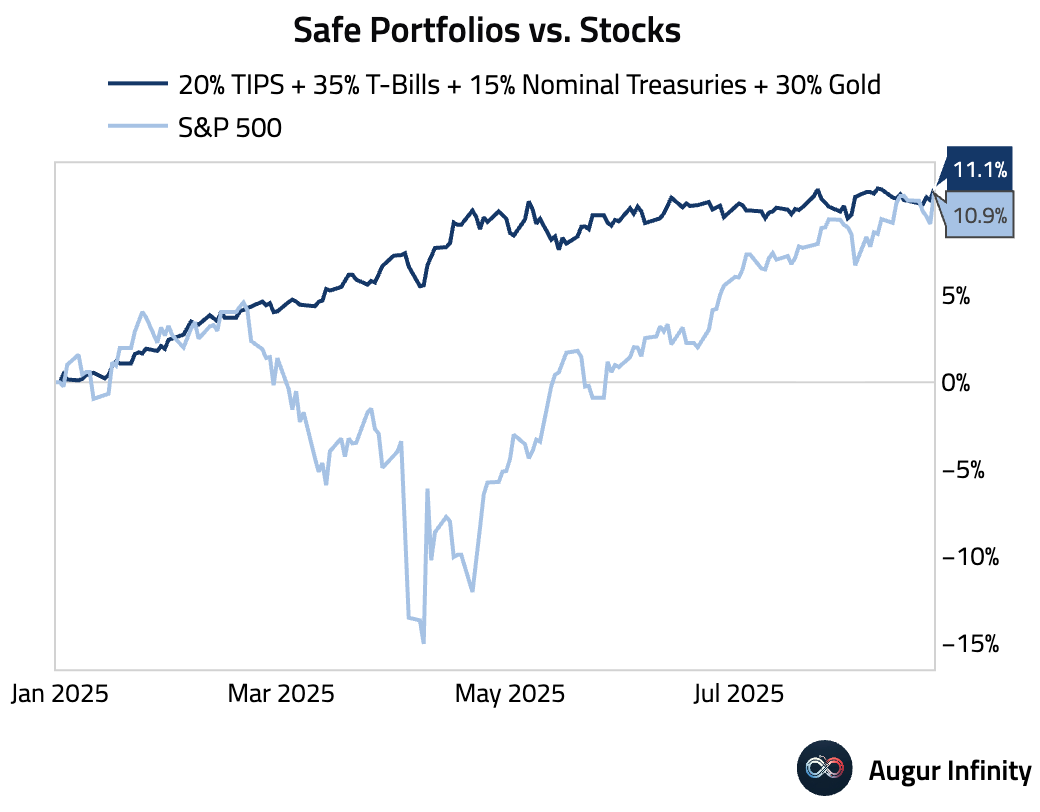
- The “safe portfolio” is once again outperforming the S&P 500.
Equities
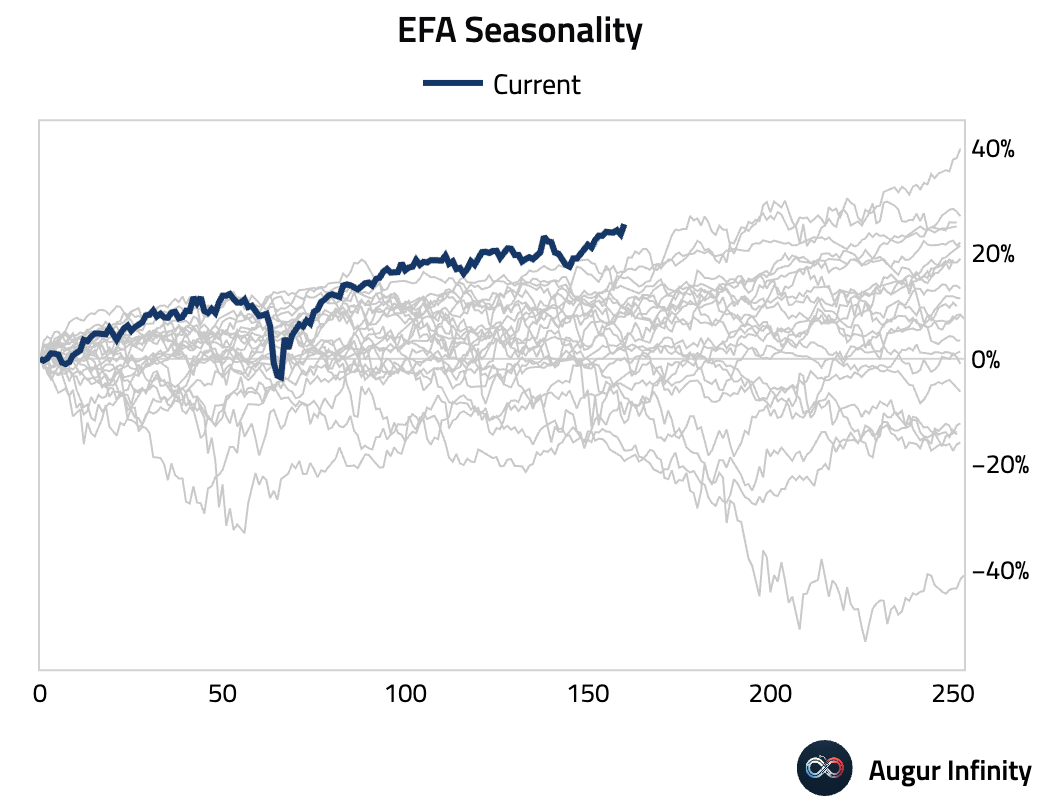
- The year-to-date performance of EFA, the ETF tracking MSCI EAFE, is the strongest since its inception.
Source: @MikeZaccardi
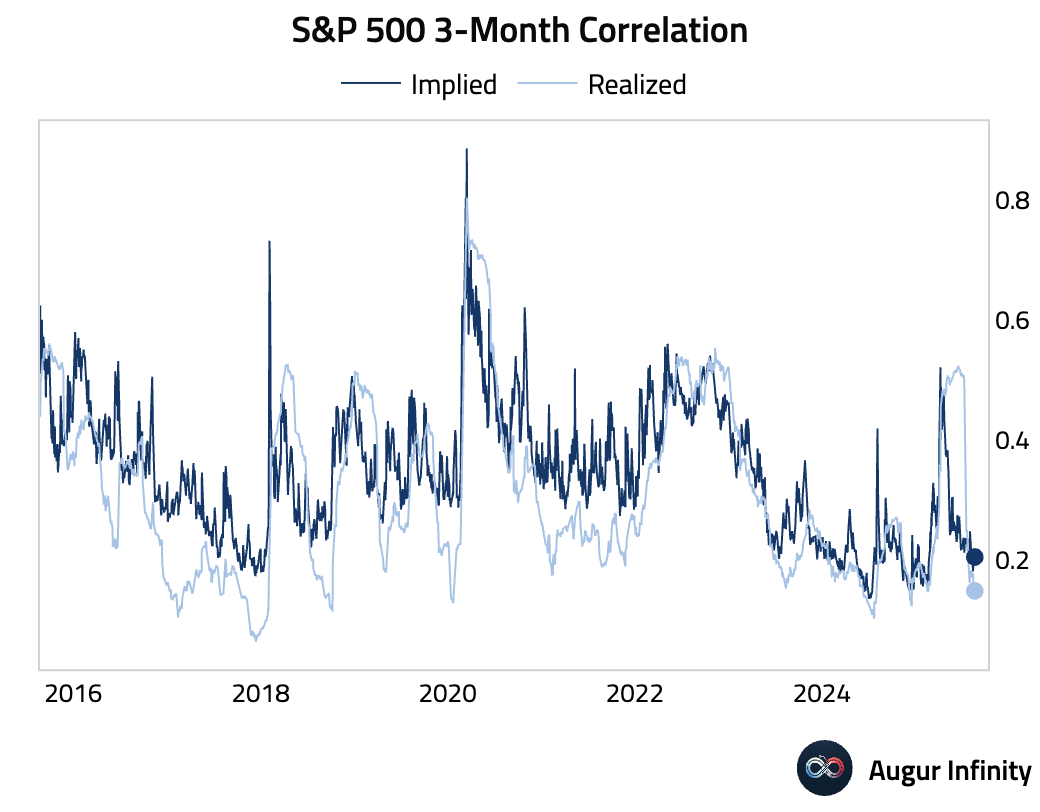
- The 3-month realized correlation among S&P 500 constituents has fallen to the lower end of its historical range.
Fixed Income
- Japan has the steepest 3m/10y yield curve amongst major economies.

Crypto
- Bitcoin’s market capitalization is currently about 10% of gold’s total market value.
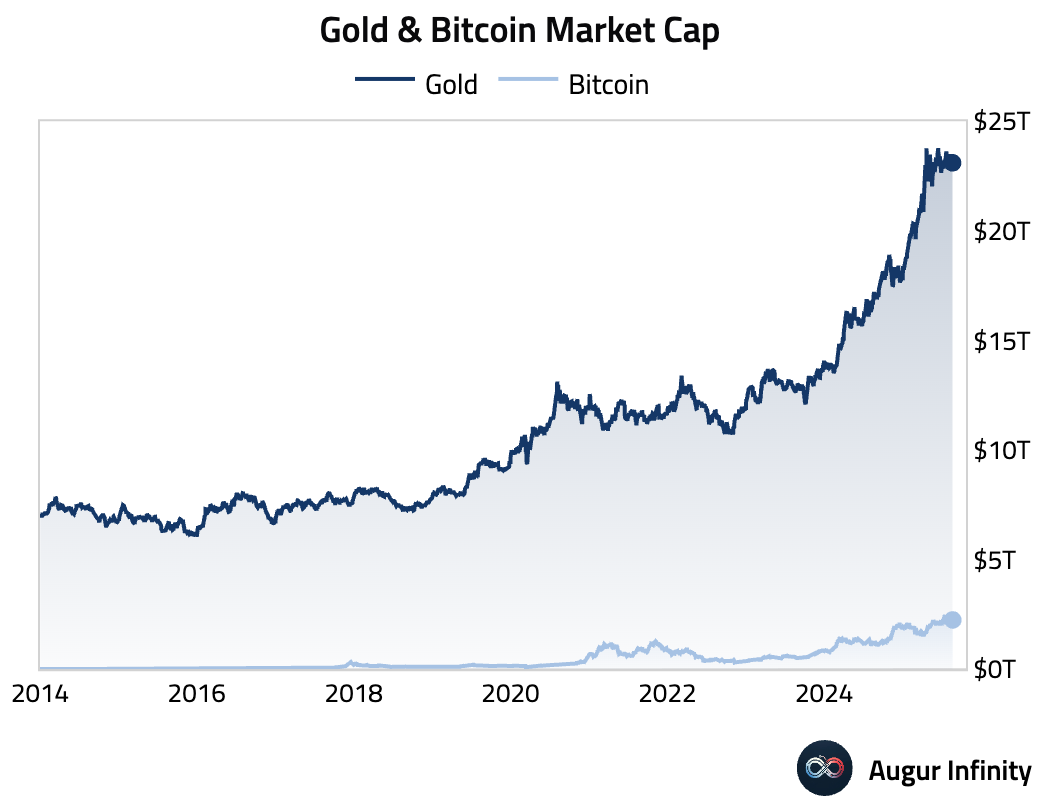
Source: Bridgewater Associates
Musings
- The World Container Index, which measures spot freight rates, declined for the 10th consecutive week. The index for the Shanghai–Los Angeles route has hit the lowest level since January 2024.
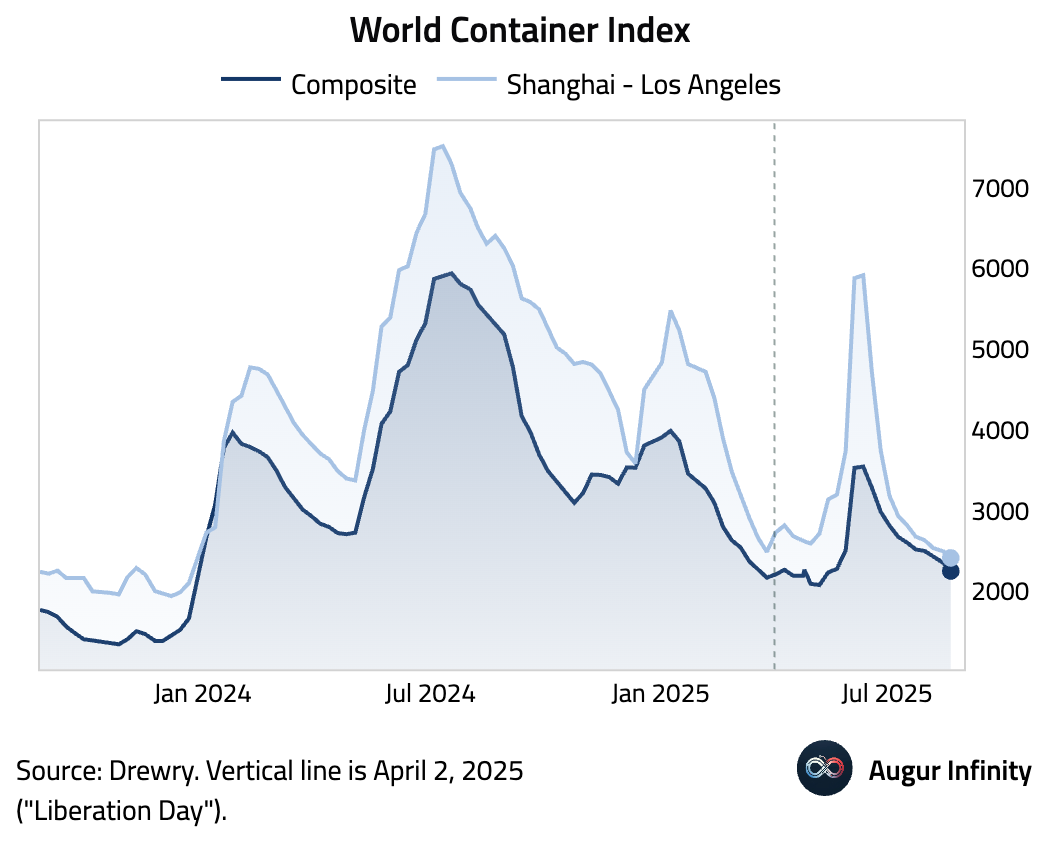
Source: Drewry World Container Index
Disclaimer
Augur Digest is an automatically generated newsletter edited by humans. It may contain inaccuracies and is not investment advice. Augur Labs LLC will not accept liability for any loss or damage as a result of your reliance on the information contained in the newsletter.

