Headlines
- A legal and political challenge has emerged following President Trump’s dismissal of Federal Reserve Governor Lisa Cook.
- The US administration announced potential new trade actions, including a 200 percent tariff on certain Chinese imports if rare-earth magnet exports are not accelerated and additional tariffs on countries with digital service taxes.
- South Korean officials confirmed that, as part of a trade deal with the United States, South Korean companies are set to invest $150 billion in the US.
- France’s finance minister warned of potential International Monetary Fund intervention if Prime Minister Bayrou’s minority government does not survive a confidence vote scheduled in two weeks.
Global Economics
United States
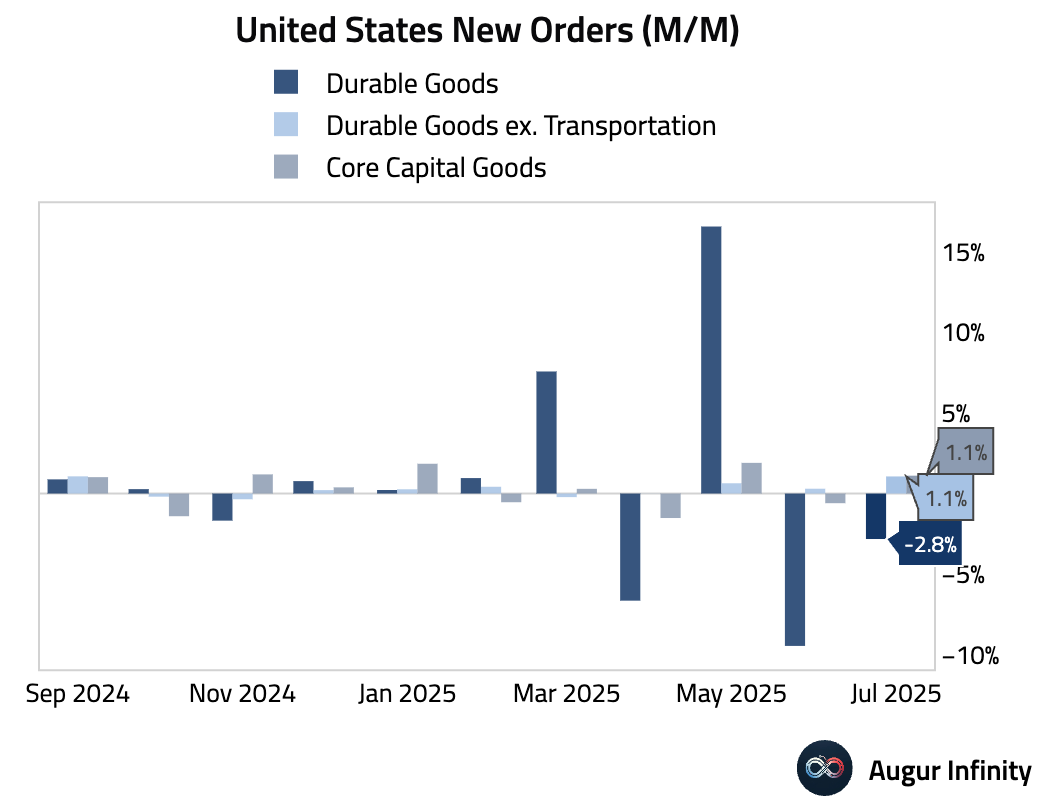
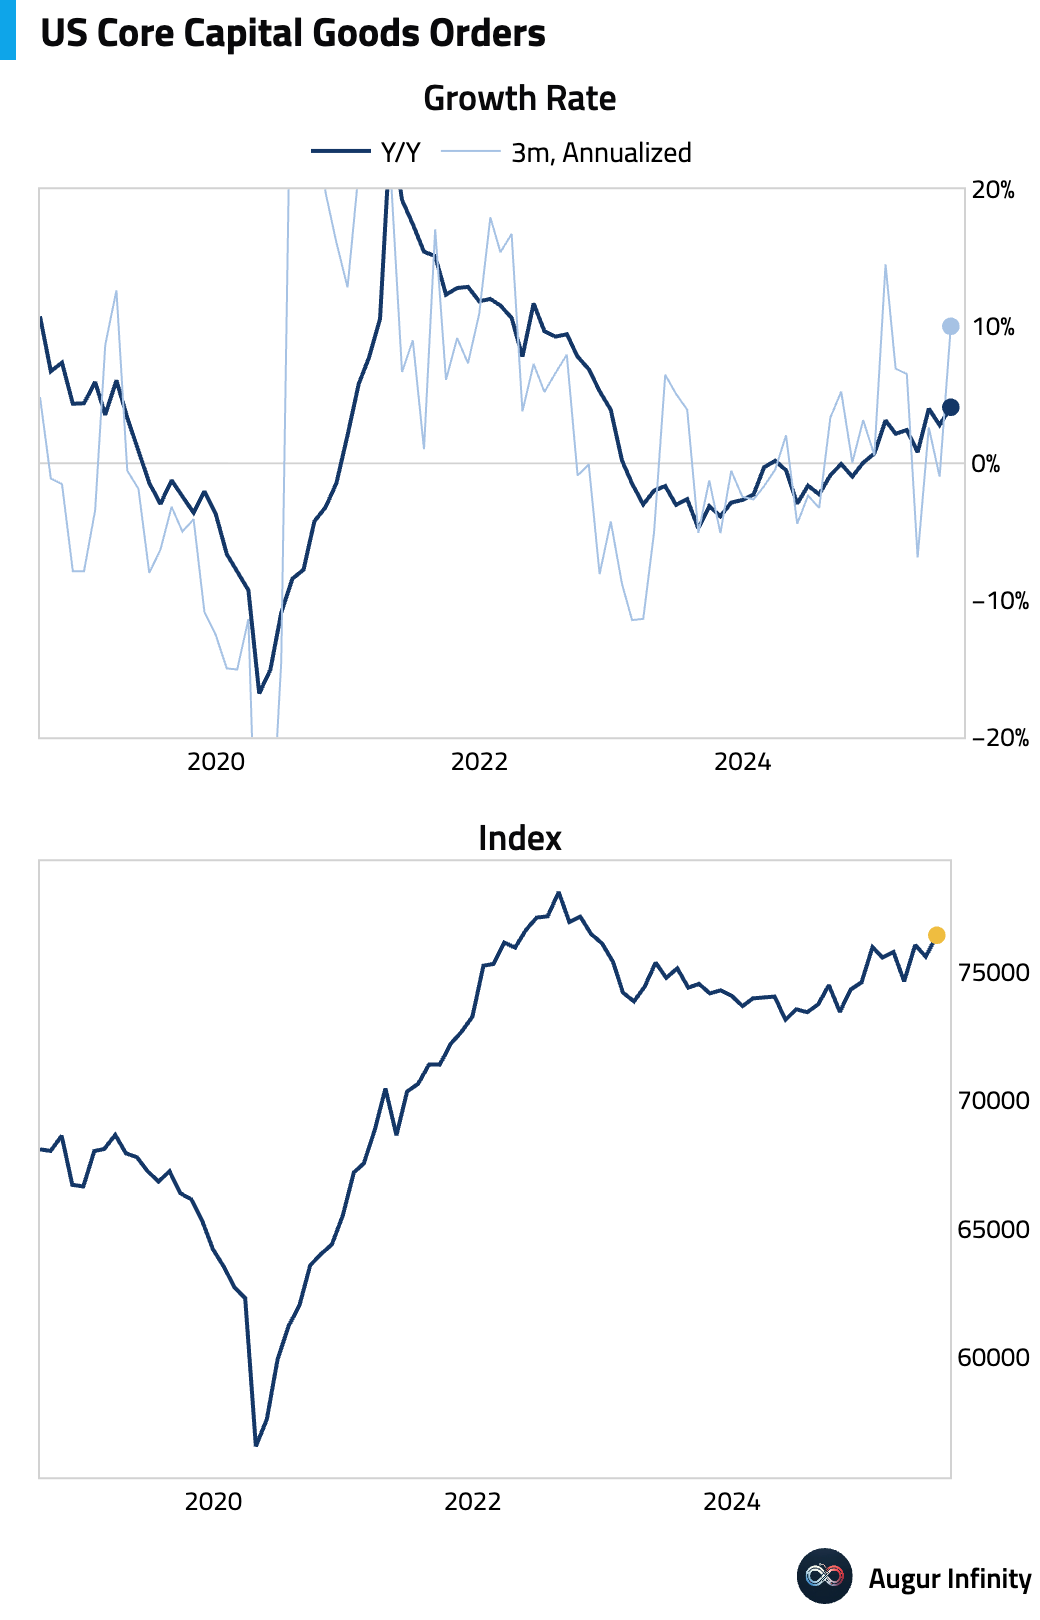
- US Durable Goods Orders fell 2.8% M/M in July, a smaller contraction than the -4.0% consensus estimate and an improvement from the prior month’s -9.4% drop. The underlying details were stronger, with orders ex-transportation rising 1.1% (vs. 0.2% consensus). Nondefense capital goods orders ex-aircraft, a proxy for business investment, also rose a robust 1.1%, well ahead of the 0.2% forecast.
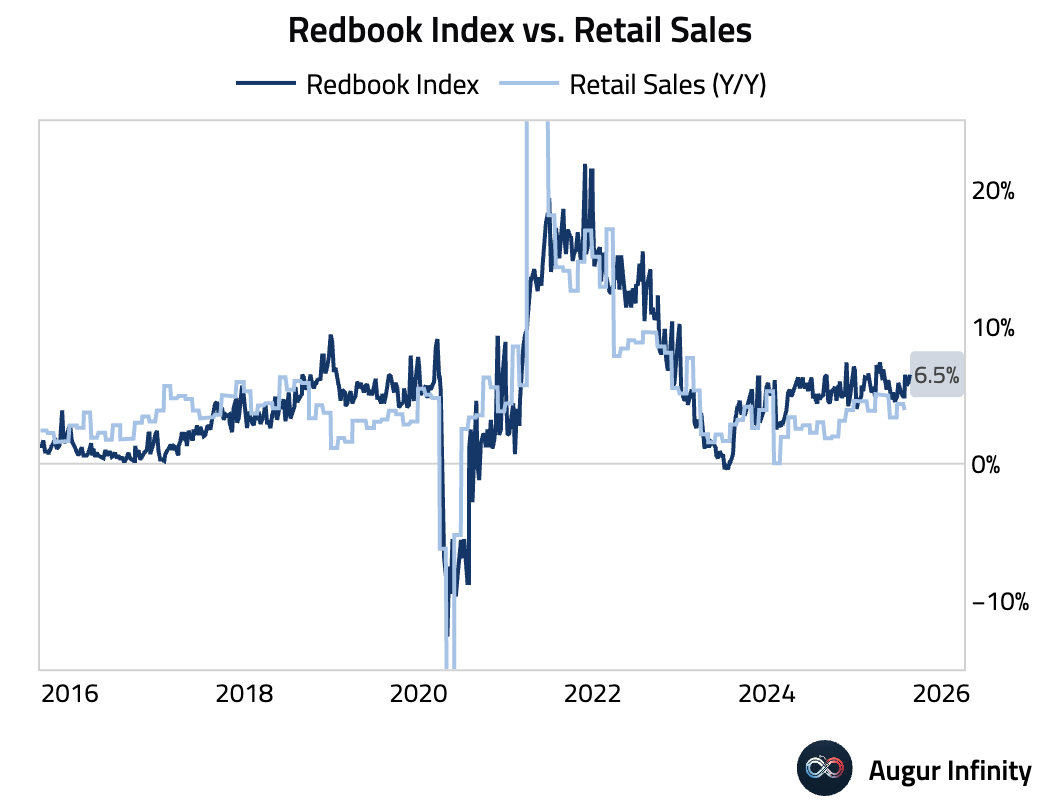
- The Johnson Redbook Index of same-store sales rose 6.5% Y/Y for the week ending August 23, accelerating from 5.9% in the prior week.
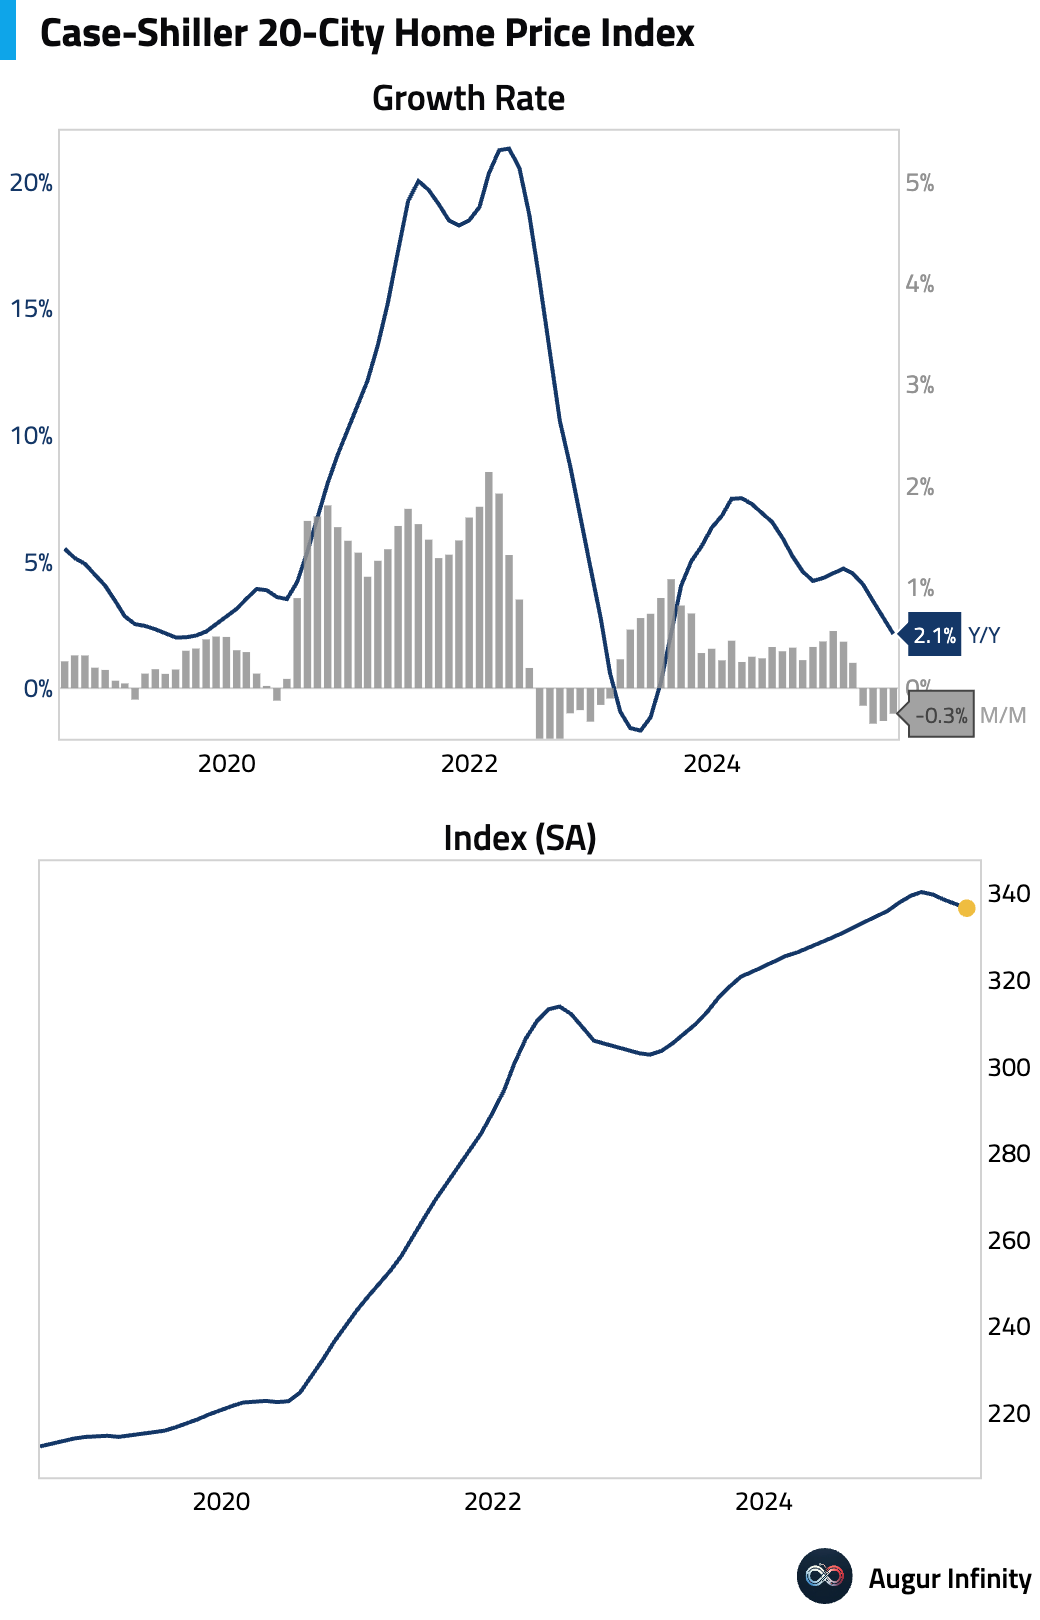
- The S&P/Case-Shiller 20-City Home Price Index for June decelerated to 2.1% Y/Y from 2.8% previously, matching consensus. On a month-over-month basis, priced declined for the fourth straight month by -0.3%.
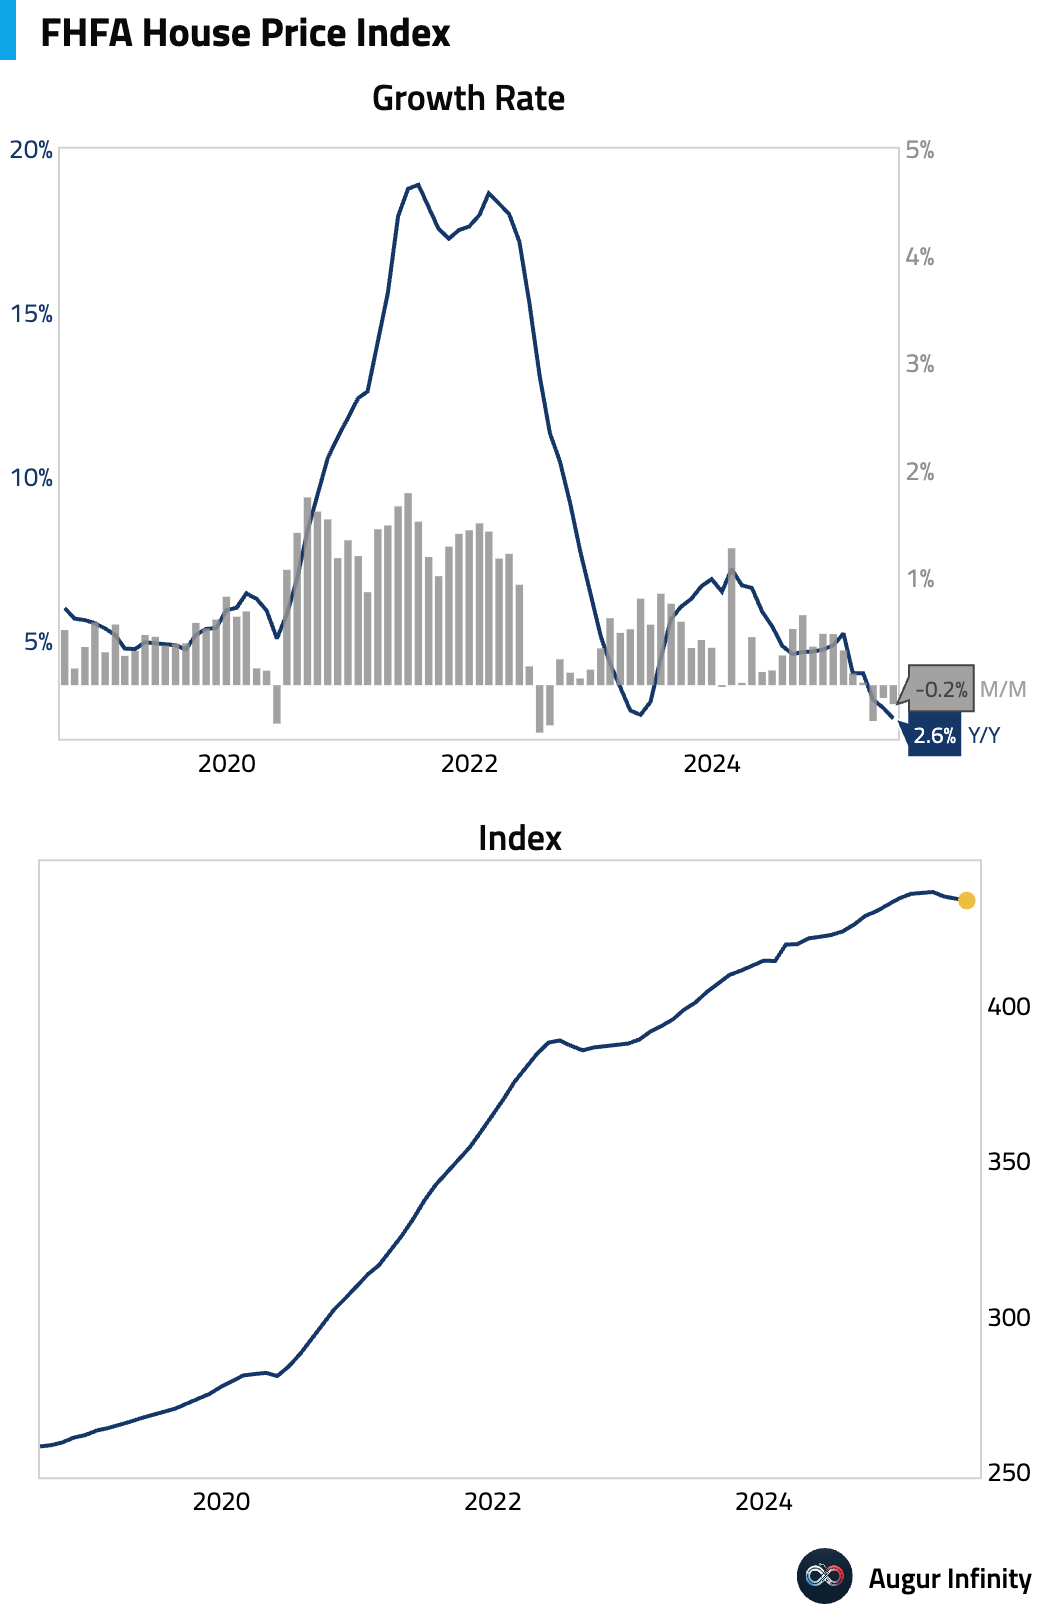
- The FHFA House Price Index for June fell 0.2% M/M, missing the flat consensus forecast. The year-over-year growth rate slowed to 2.6% from 2.9%, marking the lowest rate since April 2012.
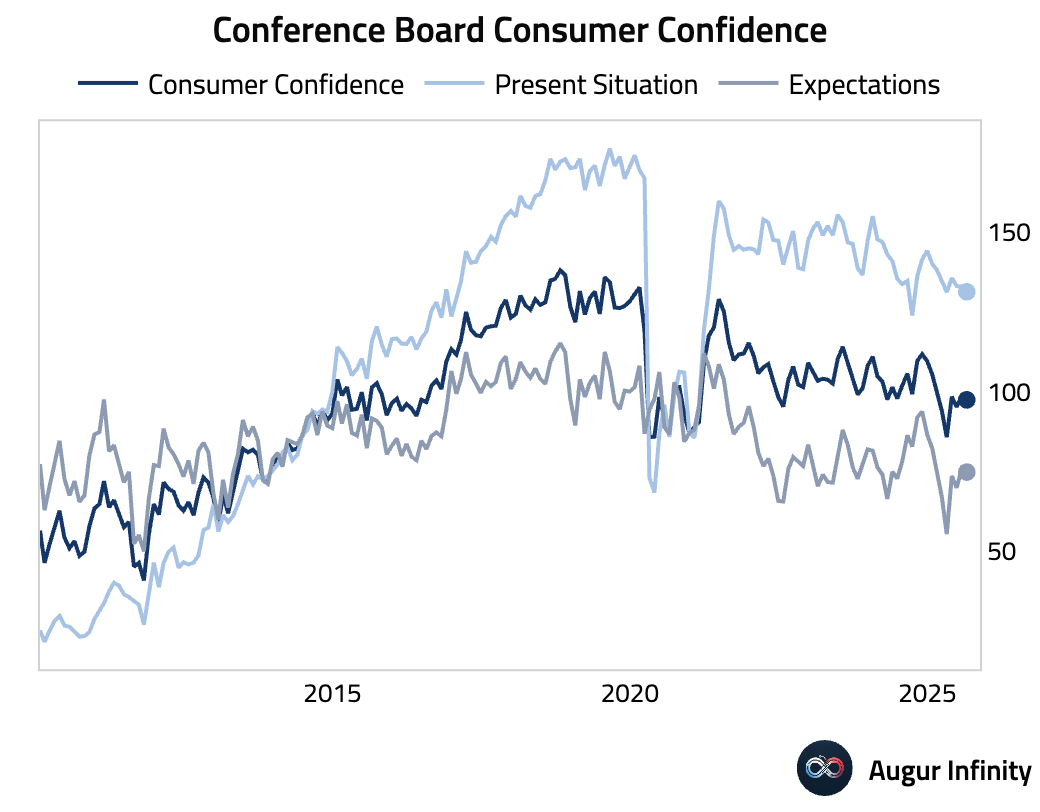
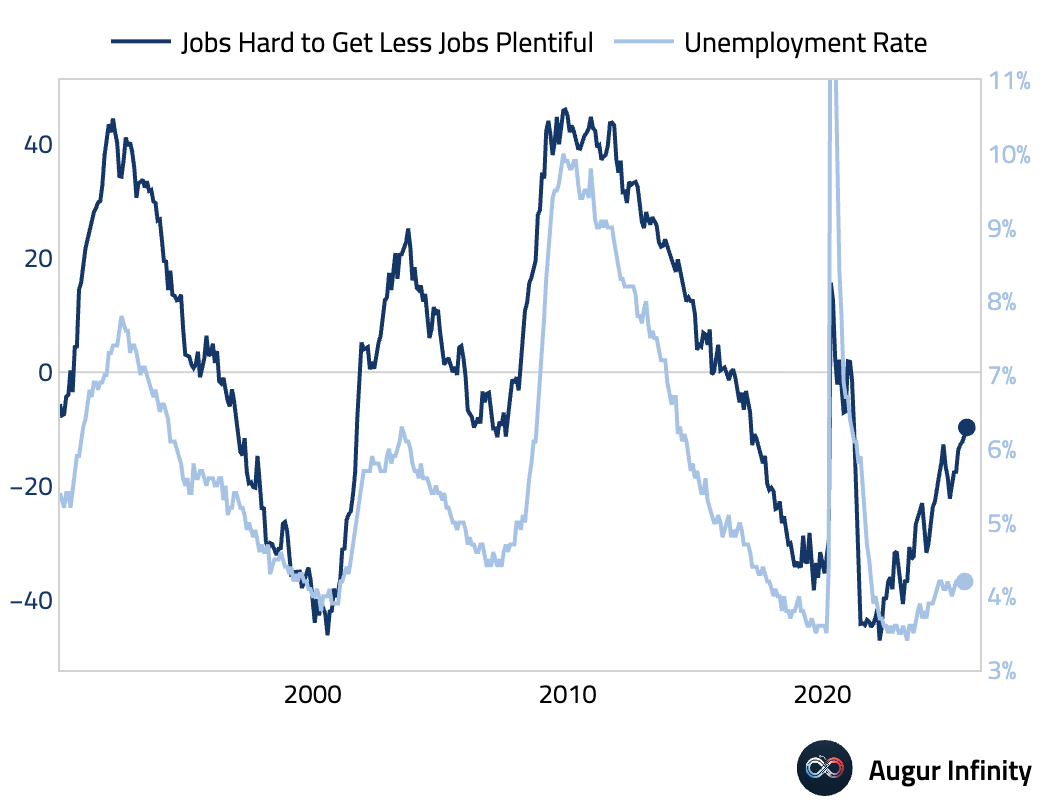
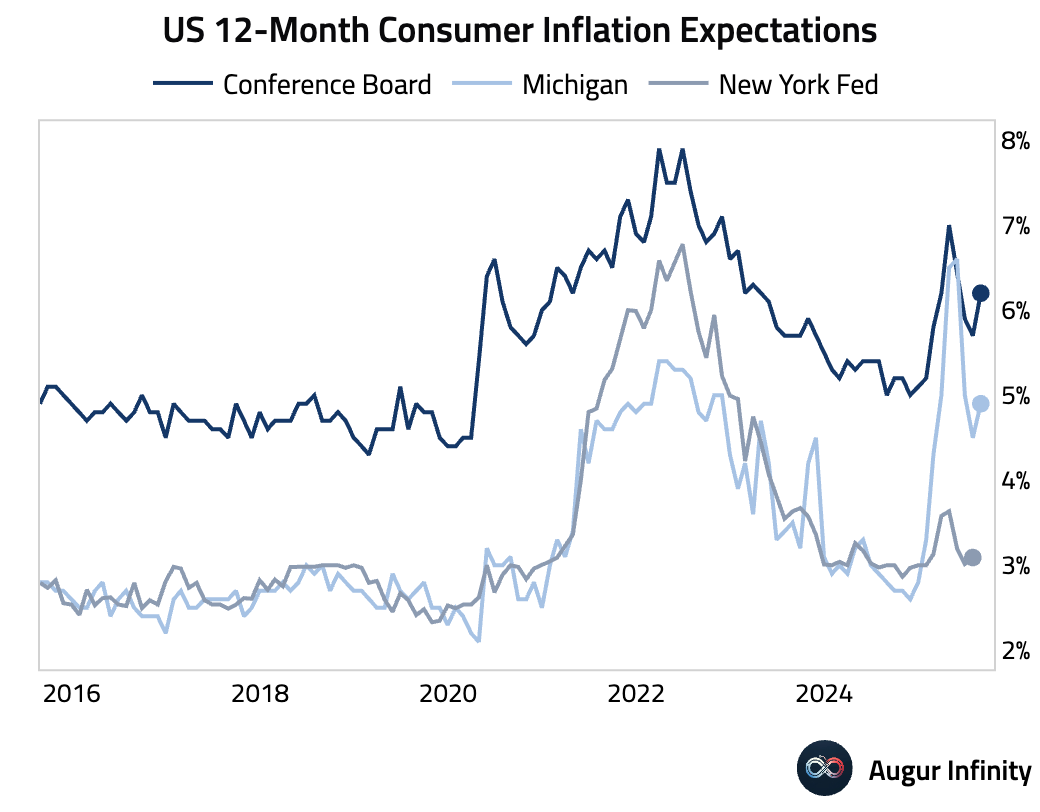
- The Conference Board’s Consumer Confidence index printed at 97.4 for August, slightly down from 98.7 but above the 96.2 estimate. The Present Situation component improved, while the Expectations index fell. The “jobs hard to get” less “jobs plentiful” spread, a key labor market indicator, rose further to the highest level since March 2021.
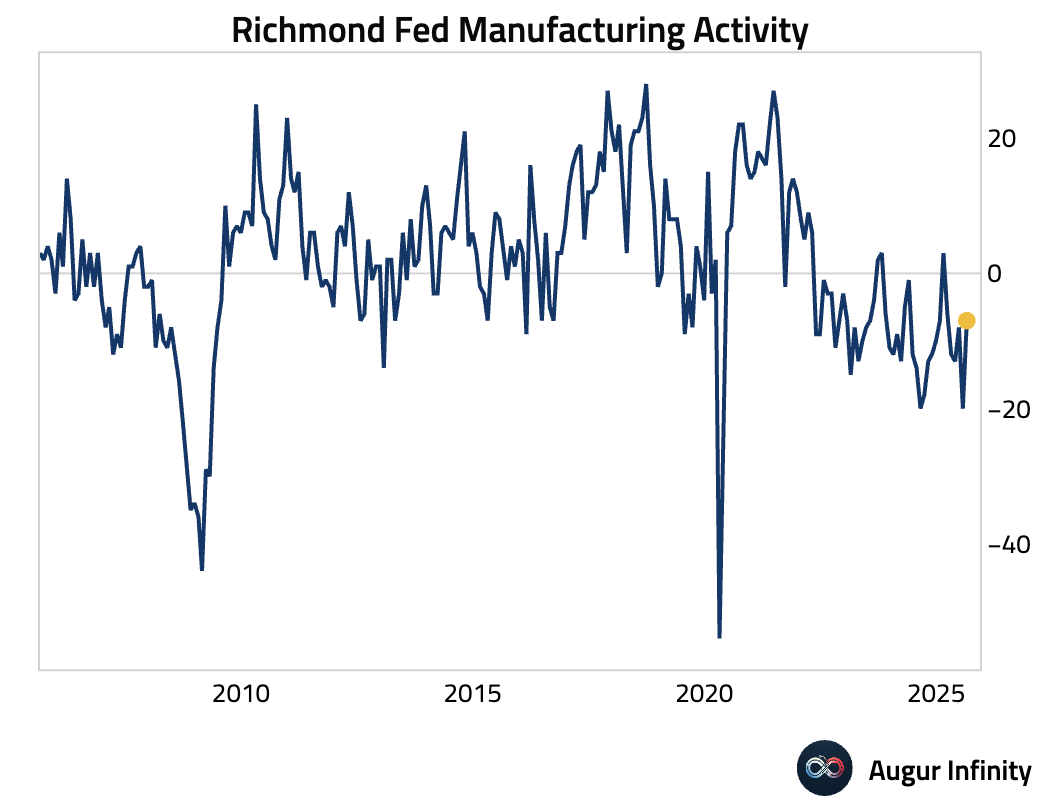
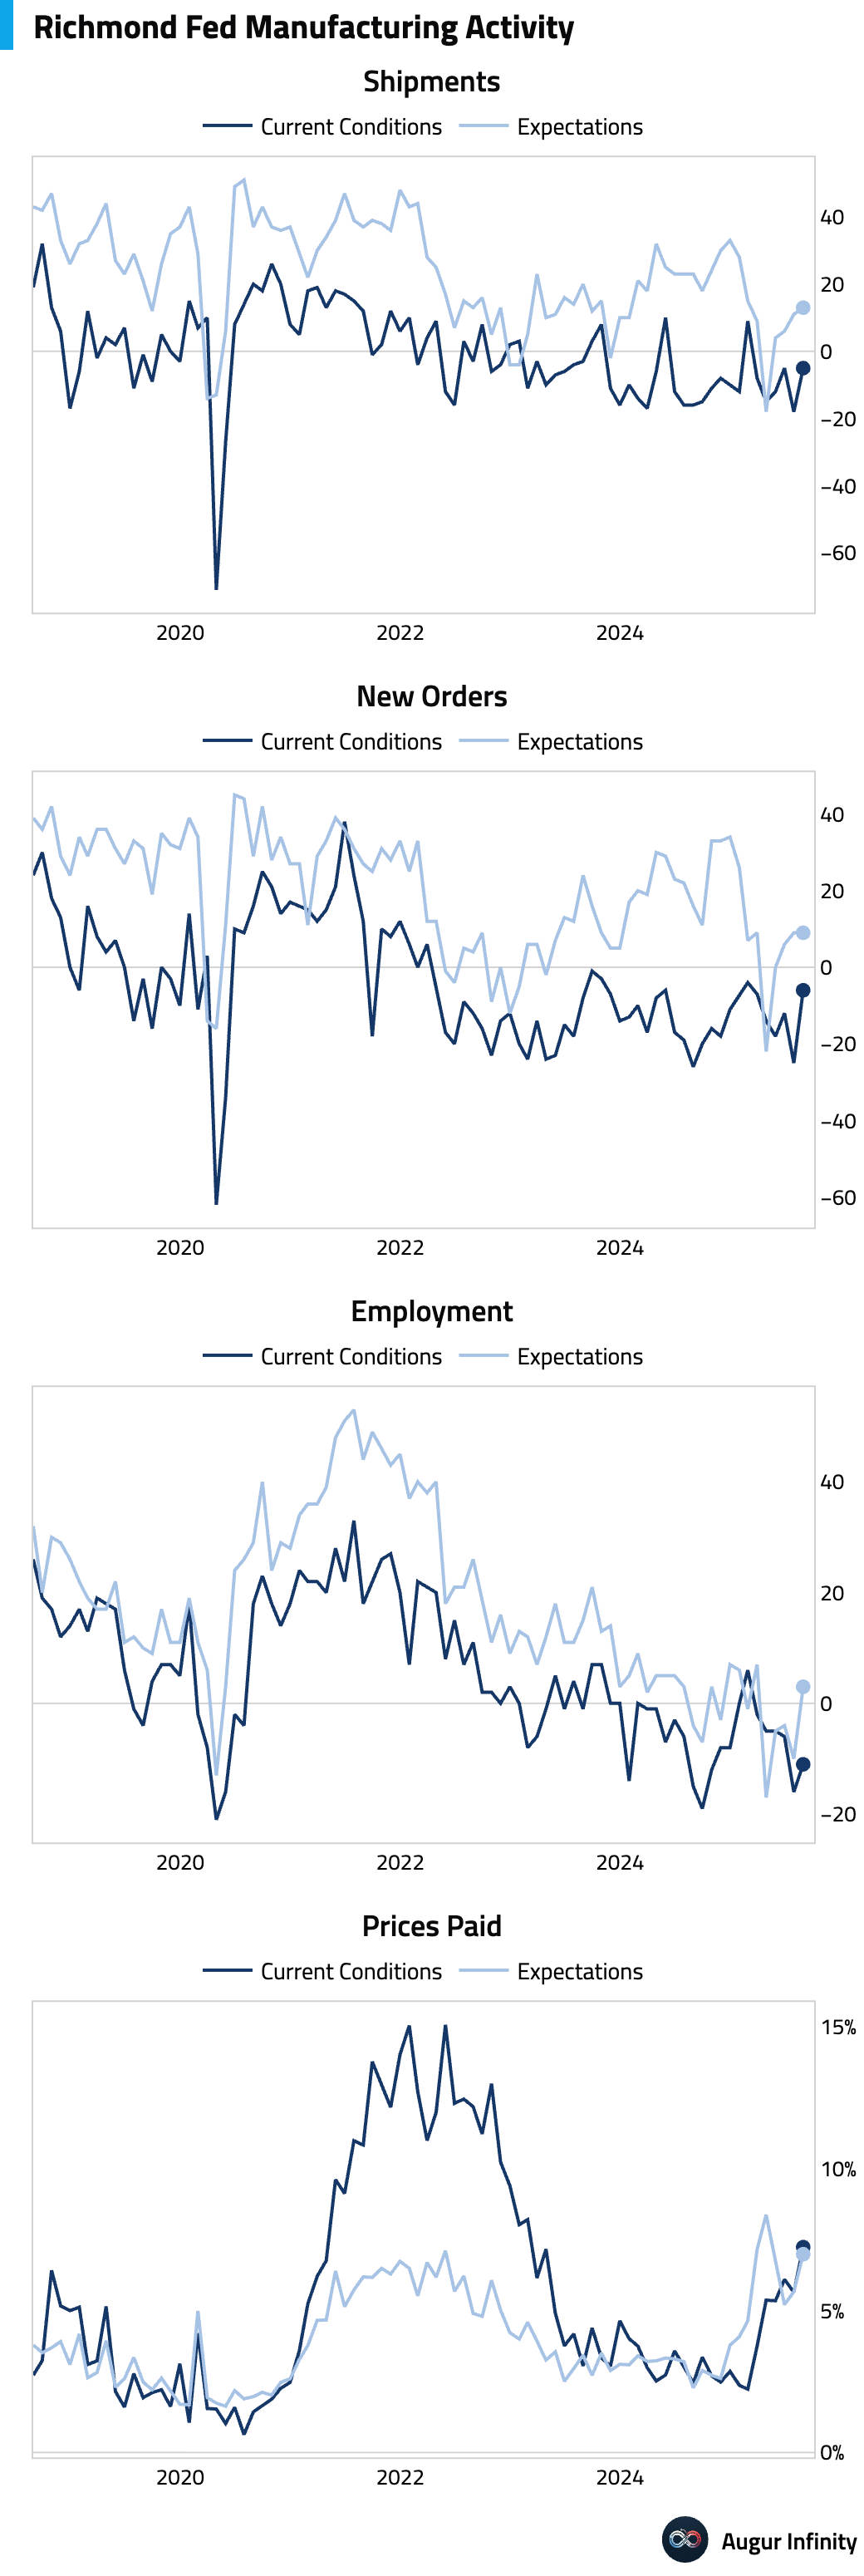
- The Richmond Fed Manufacturing Index improved to -7 in August from -20 in July, significantly better than the -17 consensus. The shipments sub-index also improved to -5 from -18.
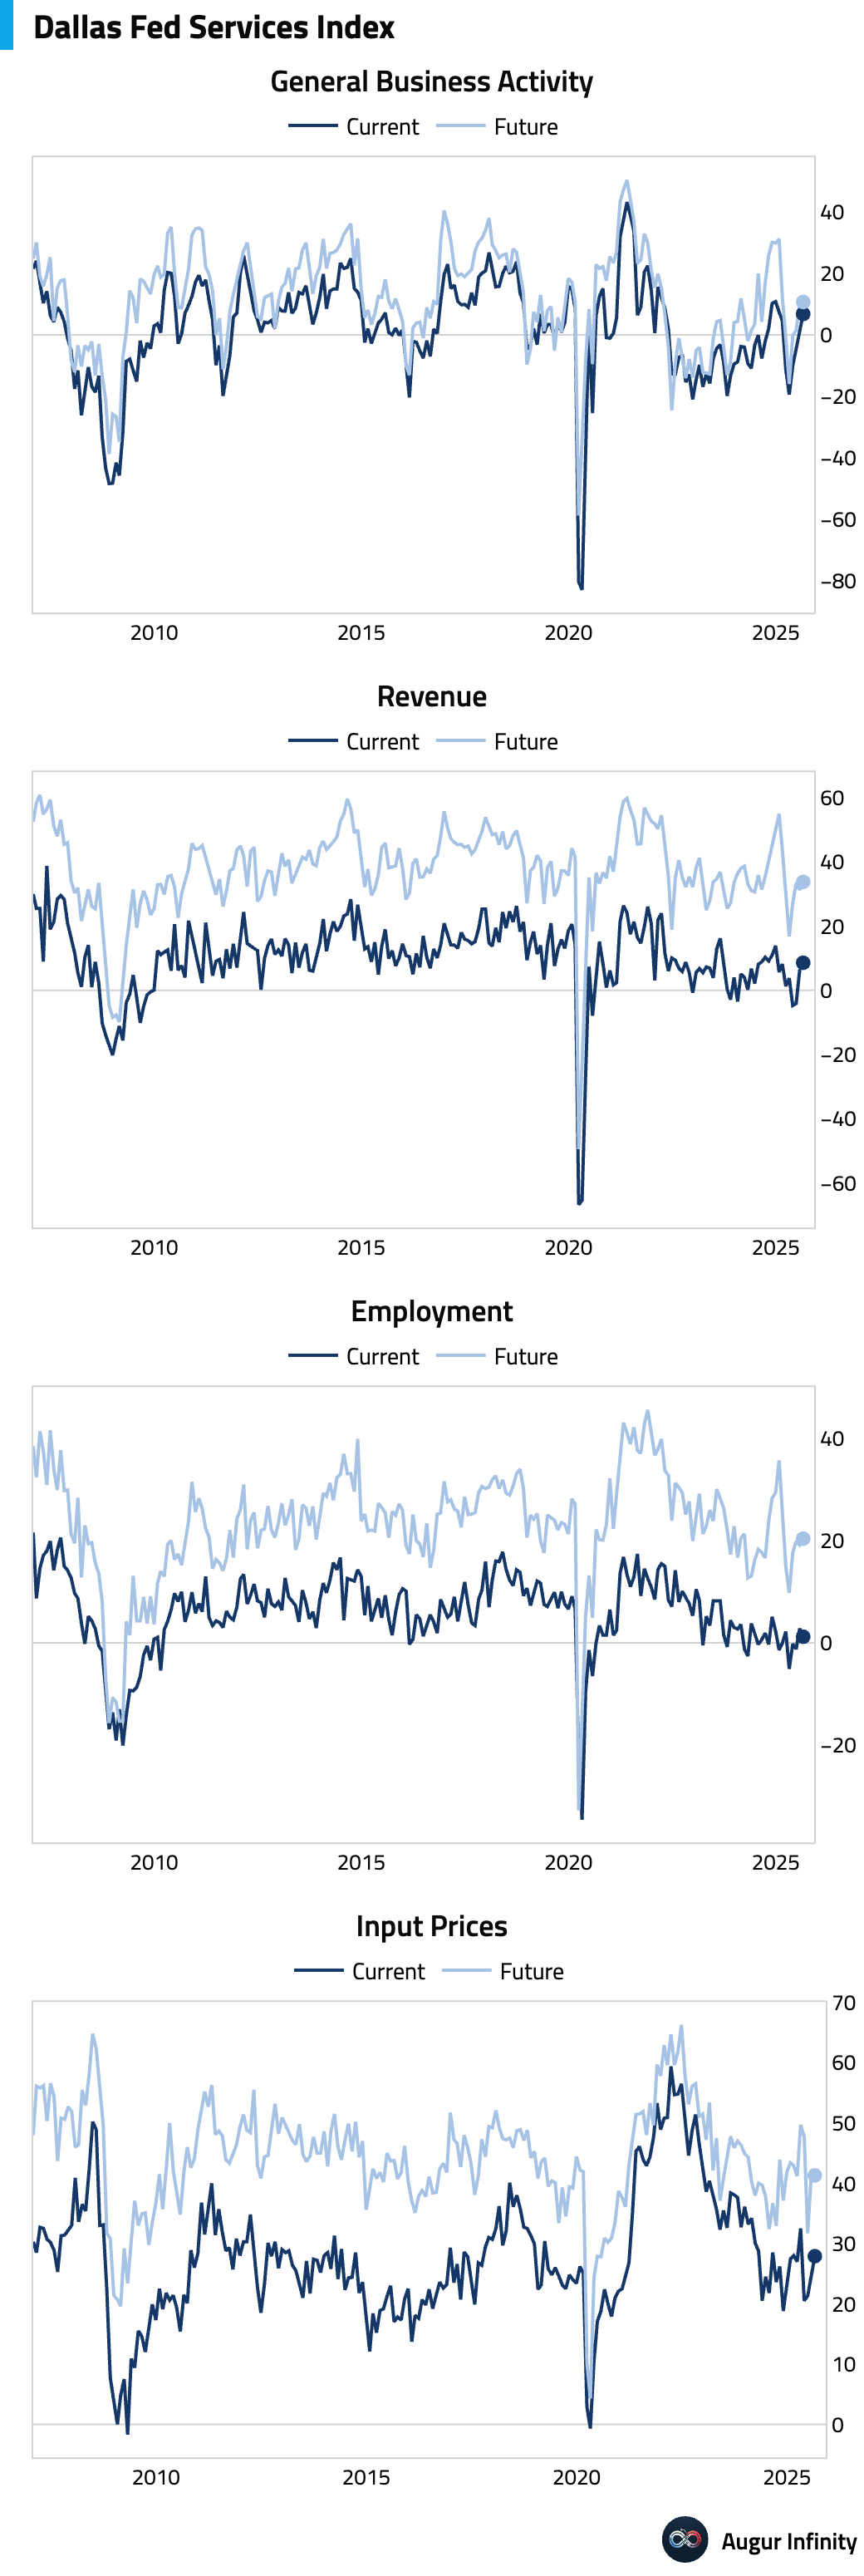
- The Dallas Fed Services Index climbed to 6.8 in August from 2.0 in July, with the revenues component rising to 8.6 from 6.3.
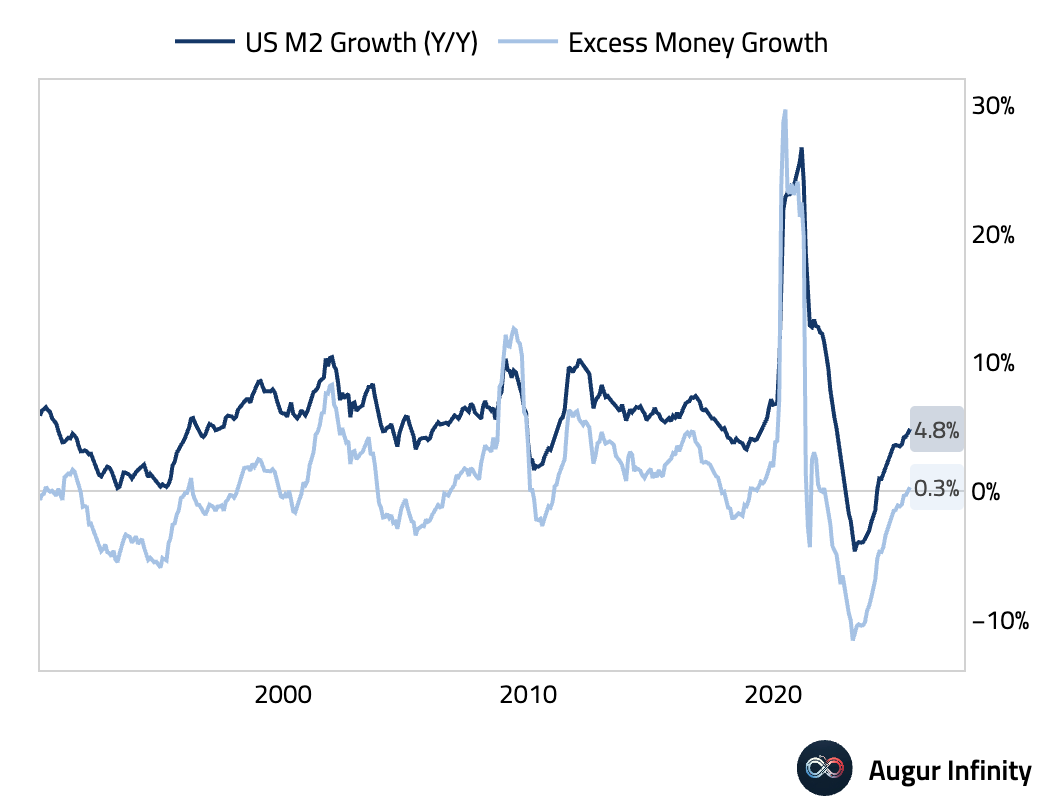
- The M2 Money Supply rose 4.8% Y/Y to $22.12 trillion.
Canada
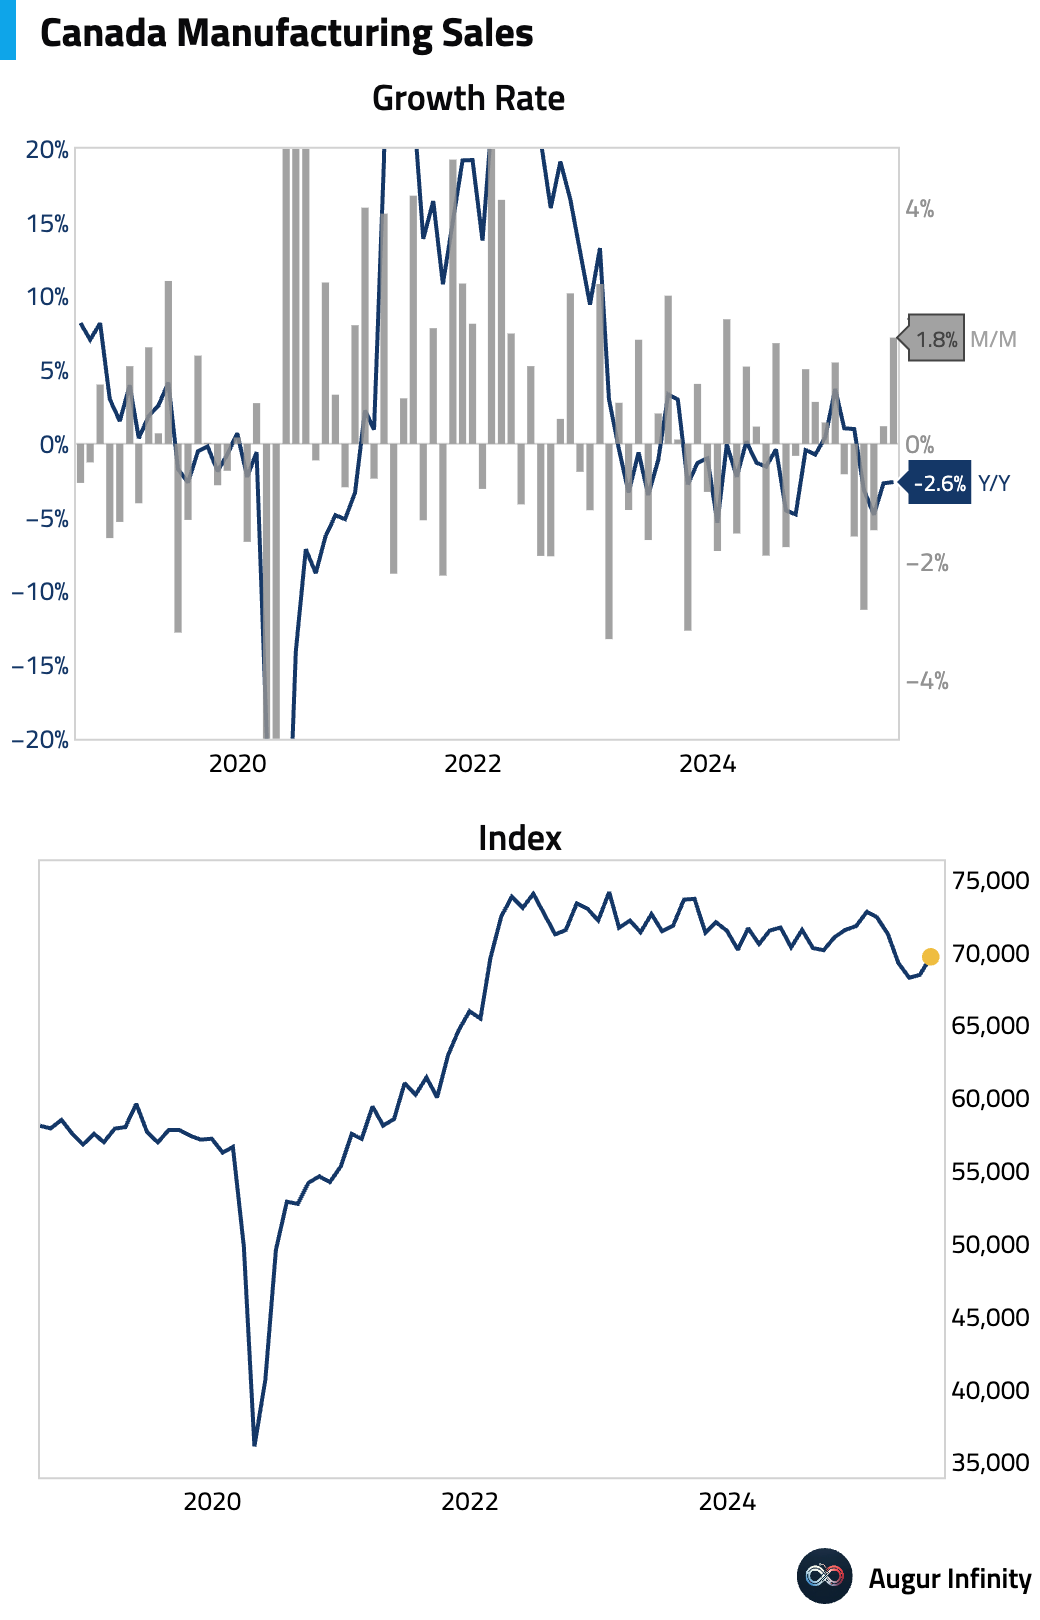
- Preliminary data for July showed Canadian manufacturing sales increasing by 1.8% M/M, a notable acceleration from the 0.3% gain in June.
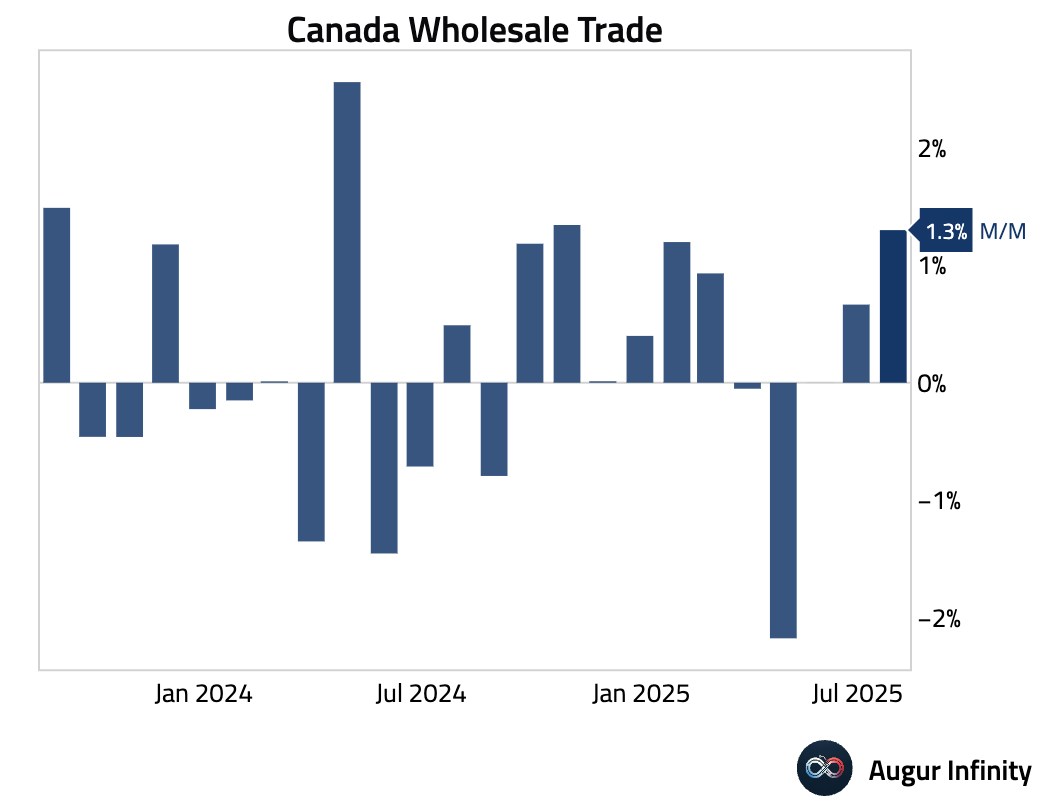
- July's preliminary wholesale sales rose 1.3% M/M, up from 0.7% in the prior month.
Europe
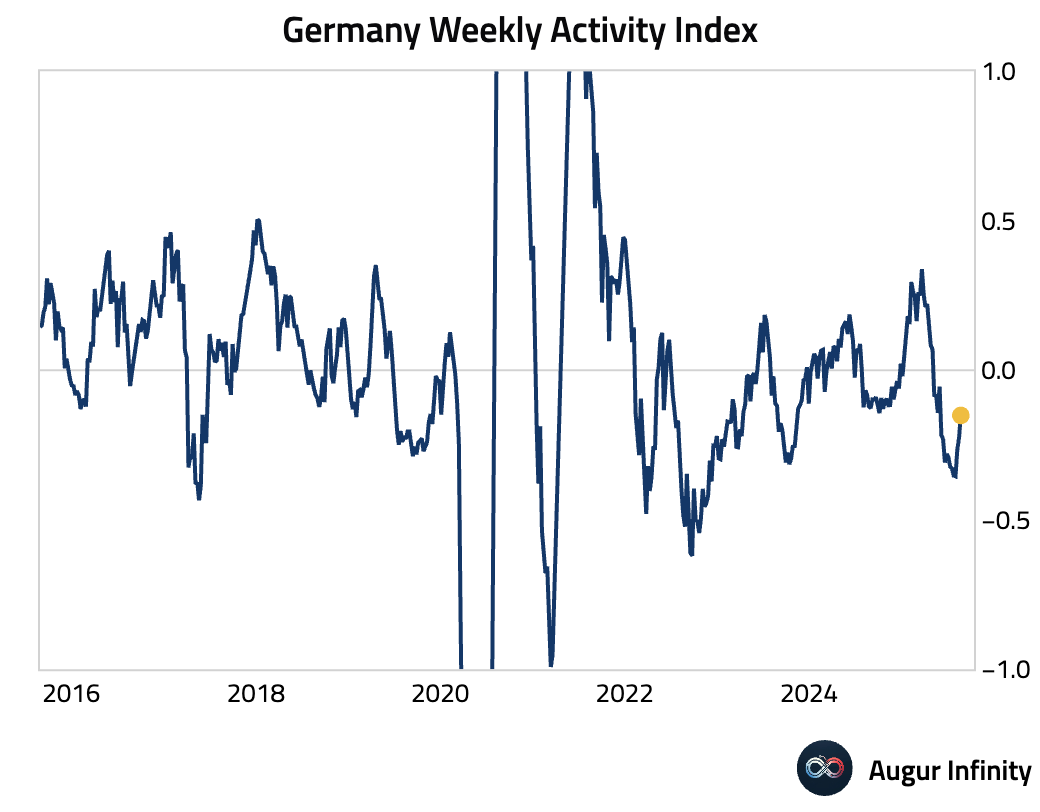
- Germany’s weekly activity index remains negative but has risen for three straight weeks.
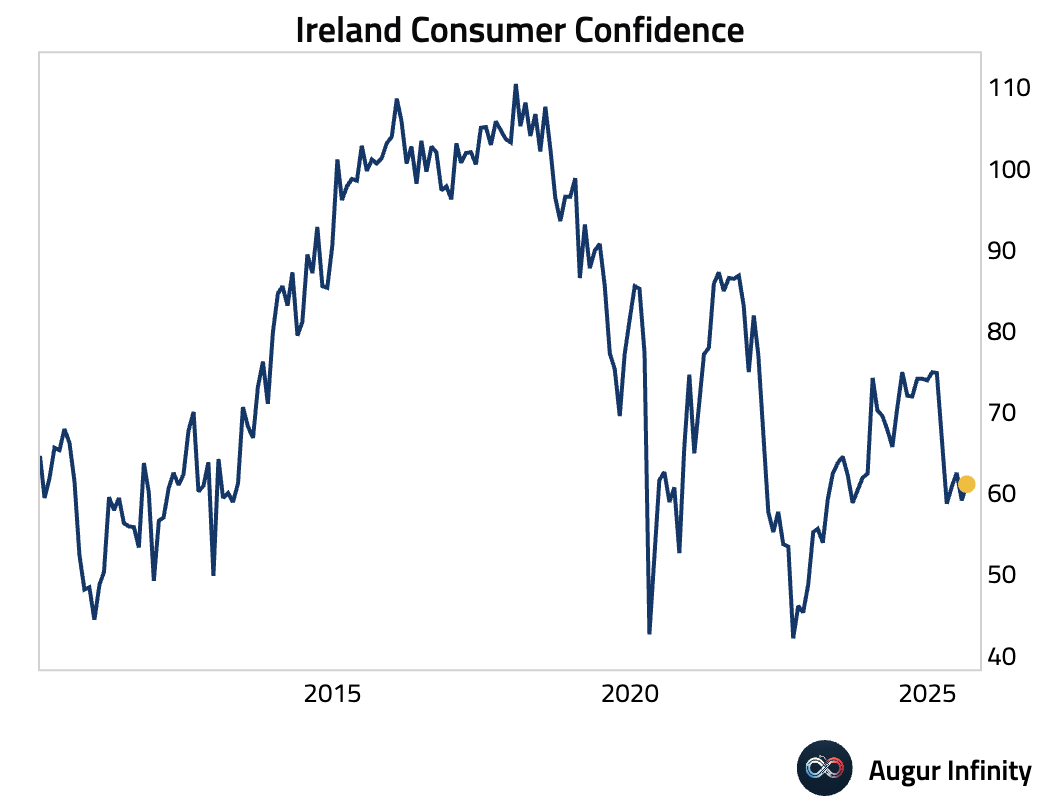
- Ireland’s consumer confidence ticked up to 61.1 in August from 59.1 in July.
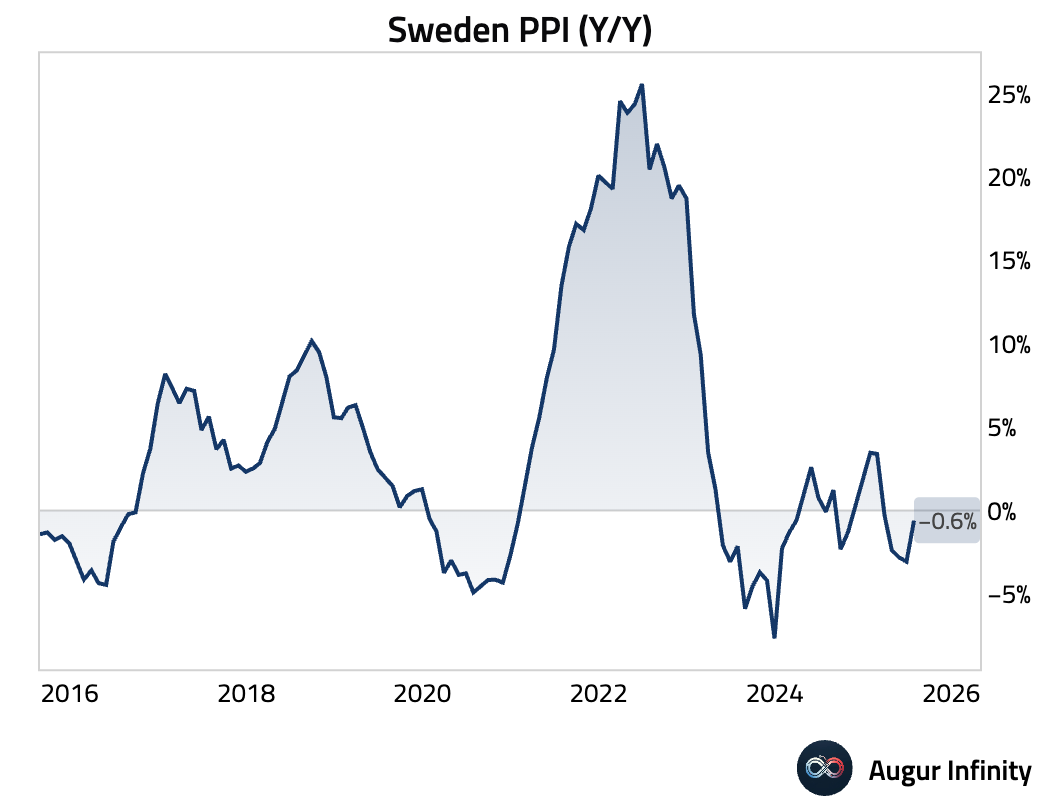
- Swedish producer prices rose 1.1% M/M in July, reversing a 0.6% decline in June. The year-over-year deflationary trend lessened, with prices falling 0.6% Y/Y compared to -3.1% previously.
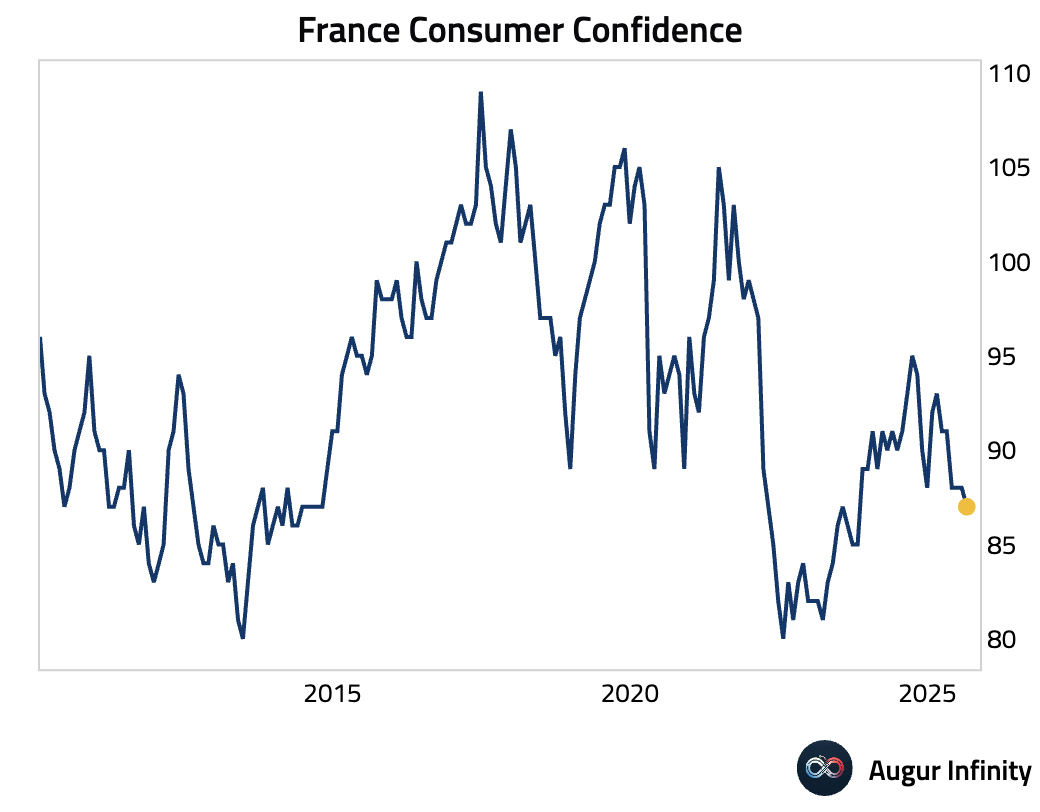
- French consumer confidence edged down to 87 in August from 88, missing expectations of 90 and hitting its lowest level since October 2023.
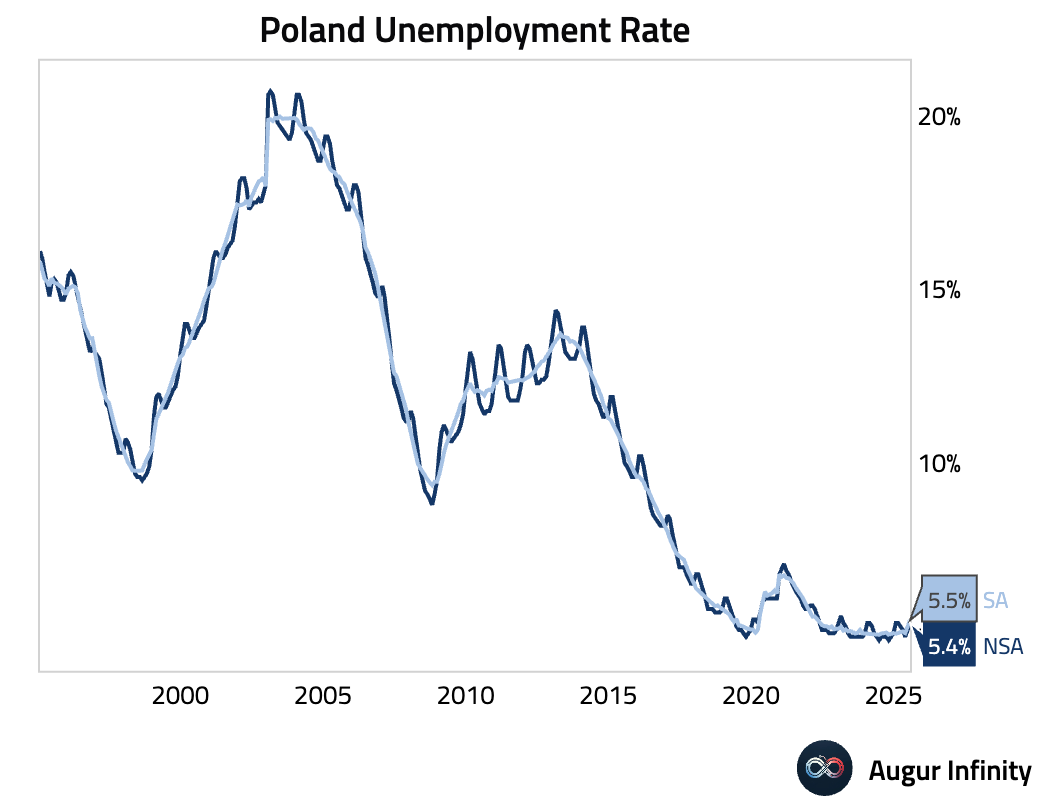
- Poland's unemployment rate rose to 5.4% in July from 5.2% in June, in line with consensus.
Asia-Pacific
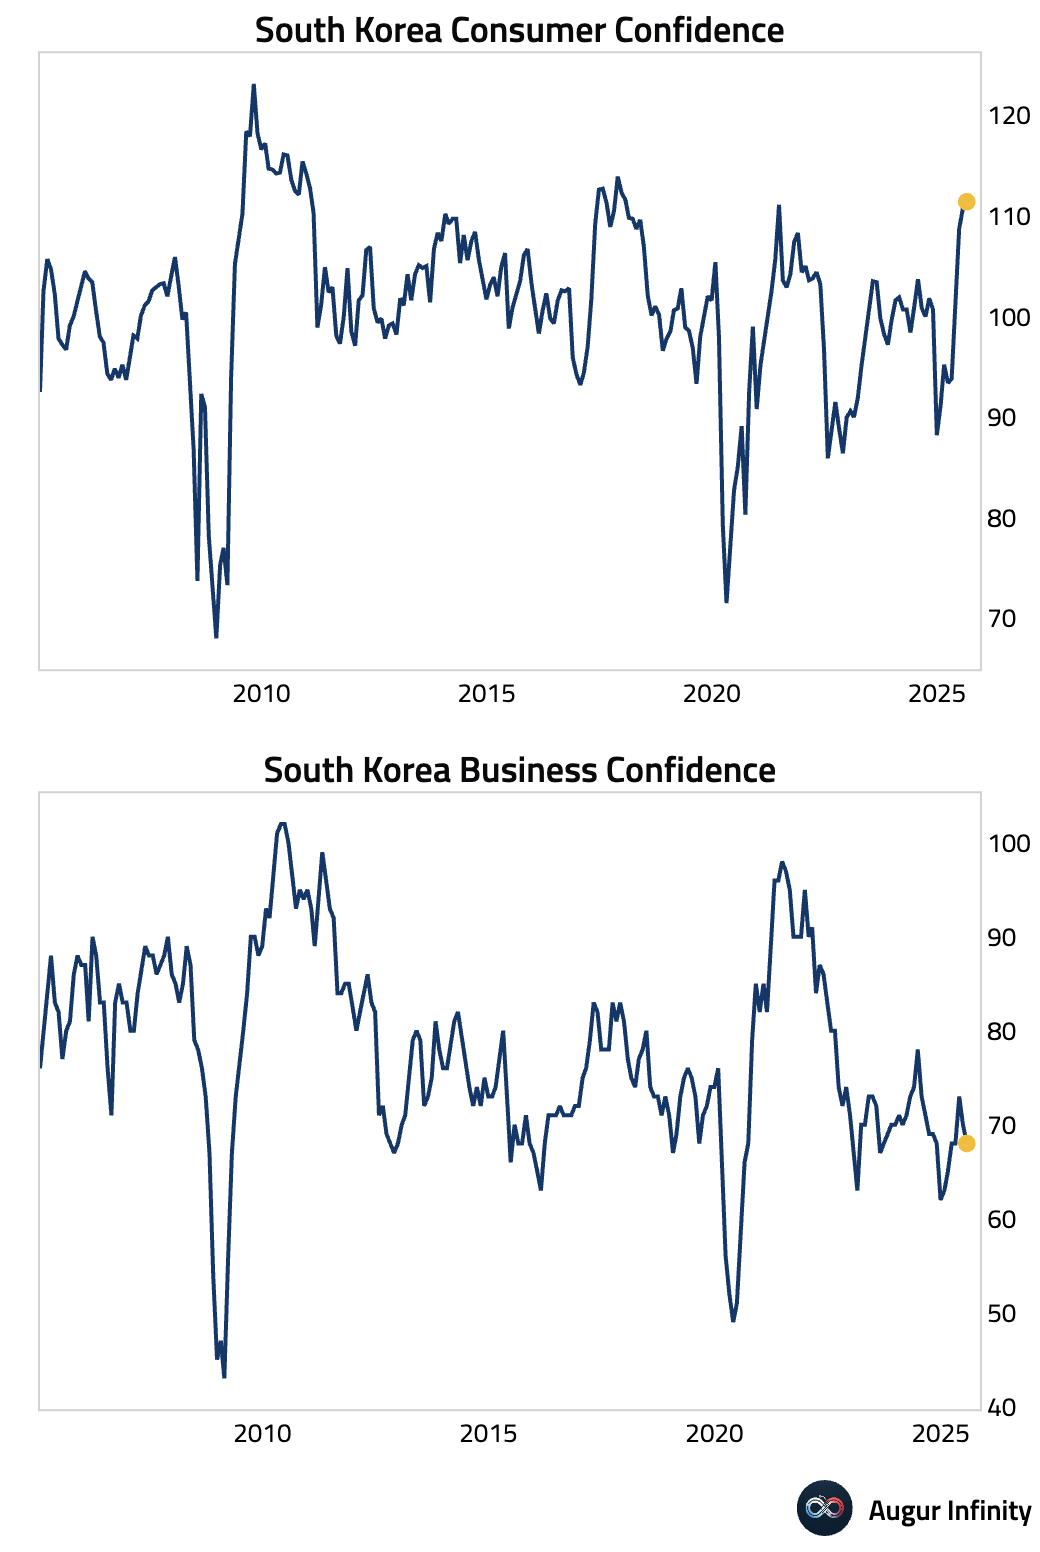
- South Korean consumer confidence dropped sharply to 111.4 in August from 143.0 in July, reaching its lowest point in a month.
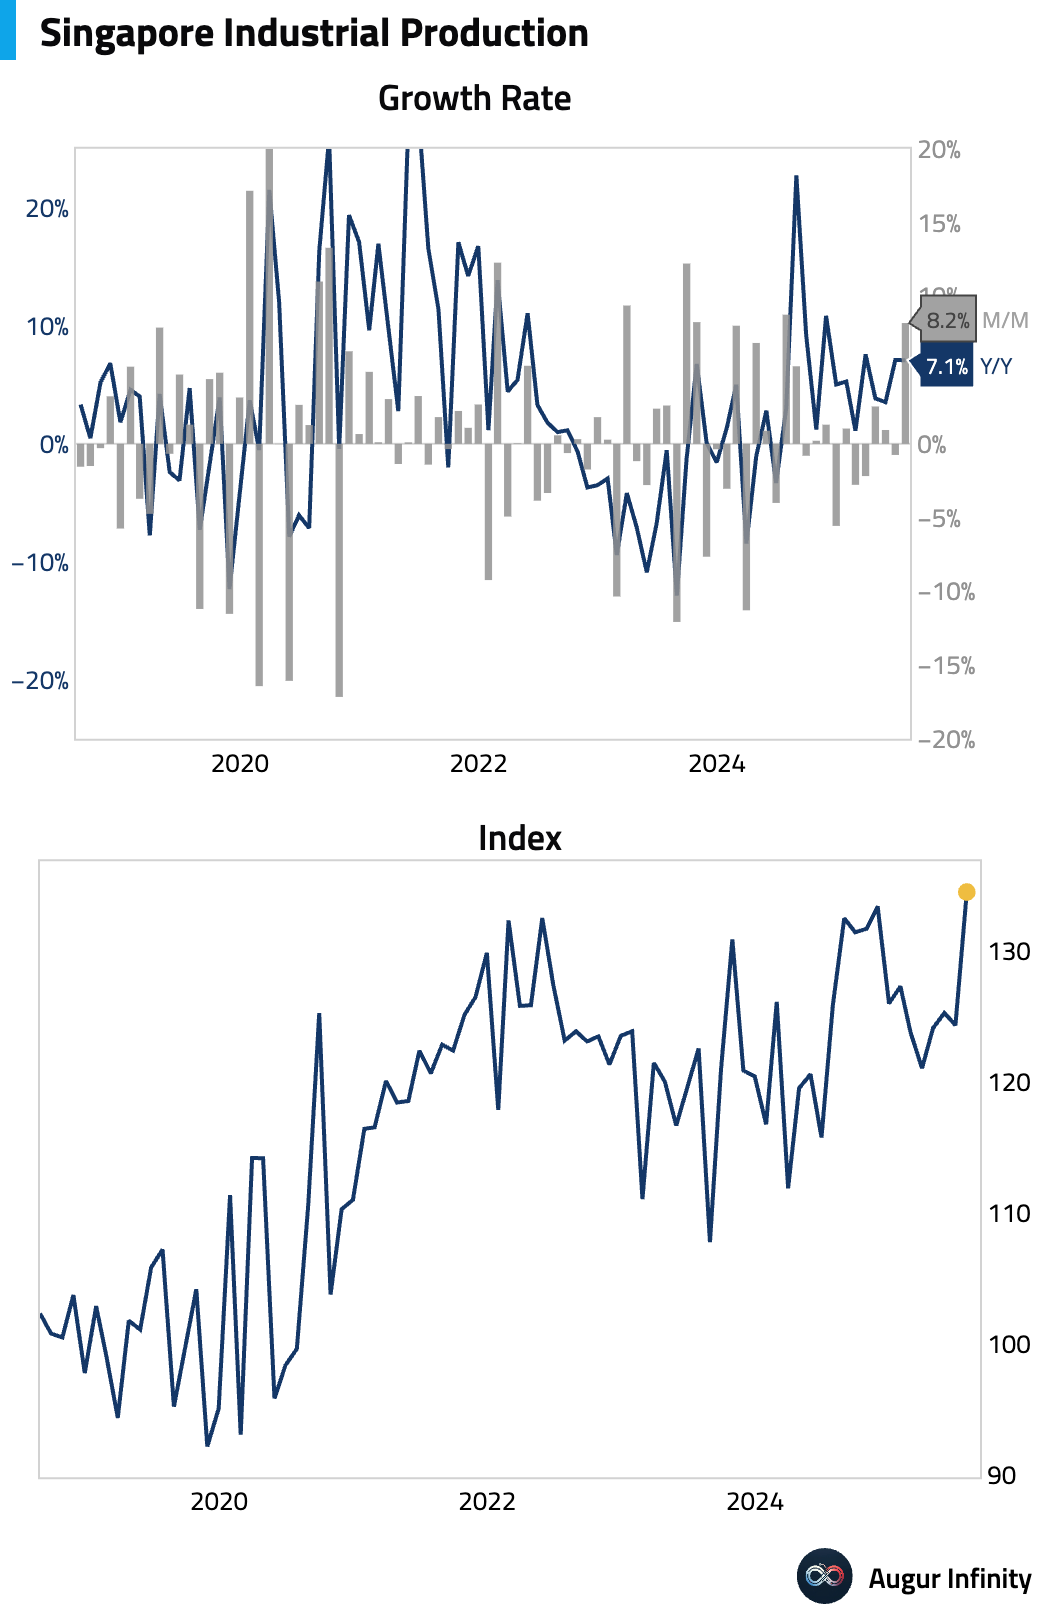
- Singapore's industrial production surged 8.2% M/M in July, smashing the 1.1% consensus estimate and rebounding strongly from a 0.8% decline. The year-over-year rate held steady at 7.1%.
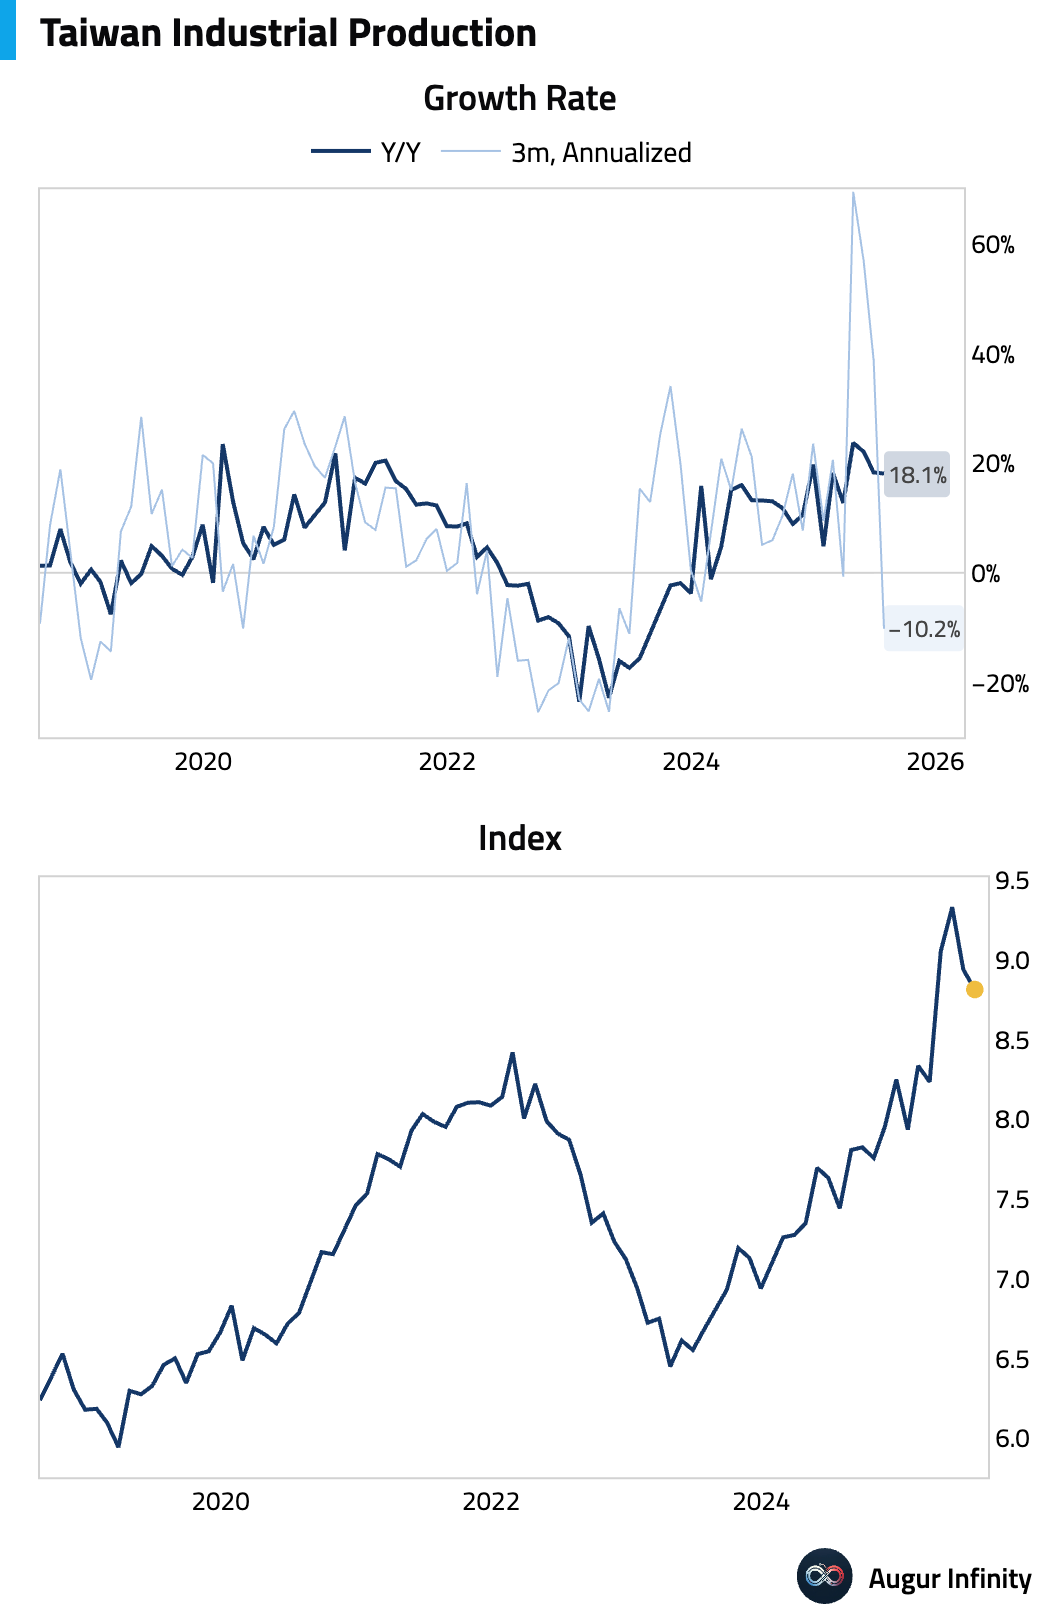
- Taiwanese industrial production grew 18.11% Y/Y in July, a slight deceleration from 18.32% but stronger than expected. The monthly decline of 1.4% was driven by a 17.6% M/M normalization in computers and optical products (including AI servers), which was partly offset by a 5.3% M/M rebound in electronic components like semiconductors.
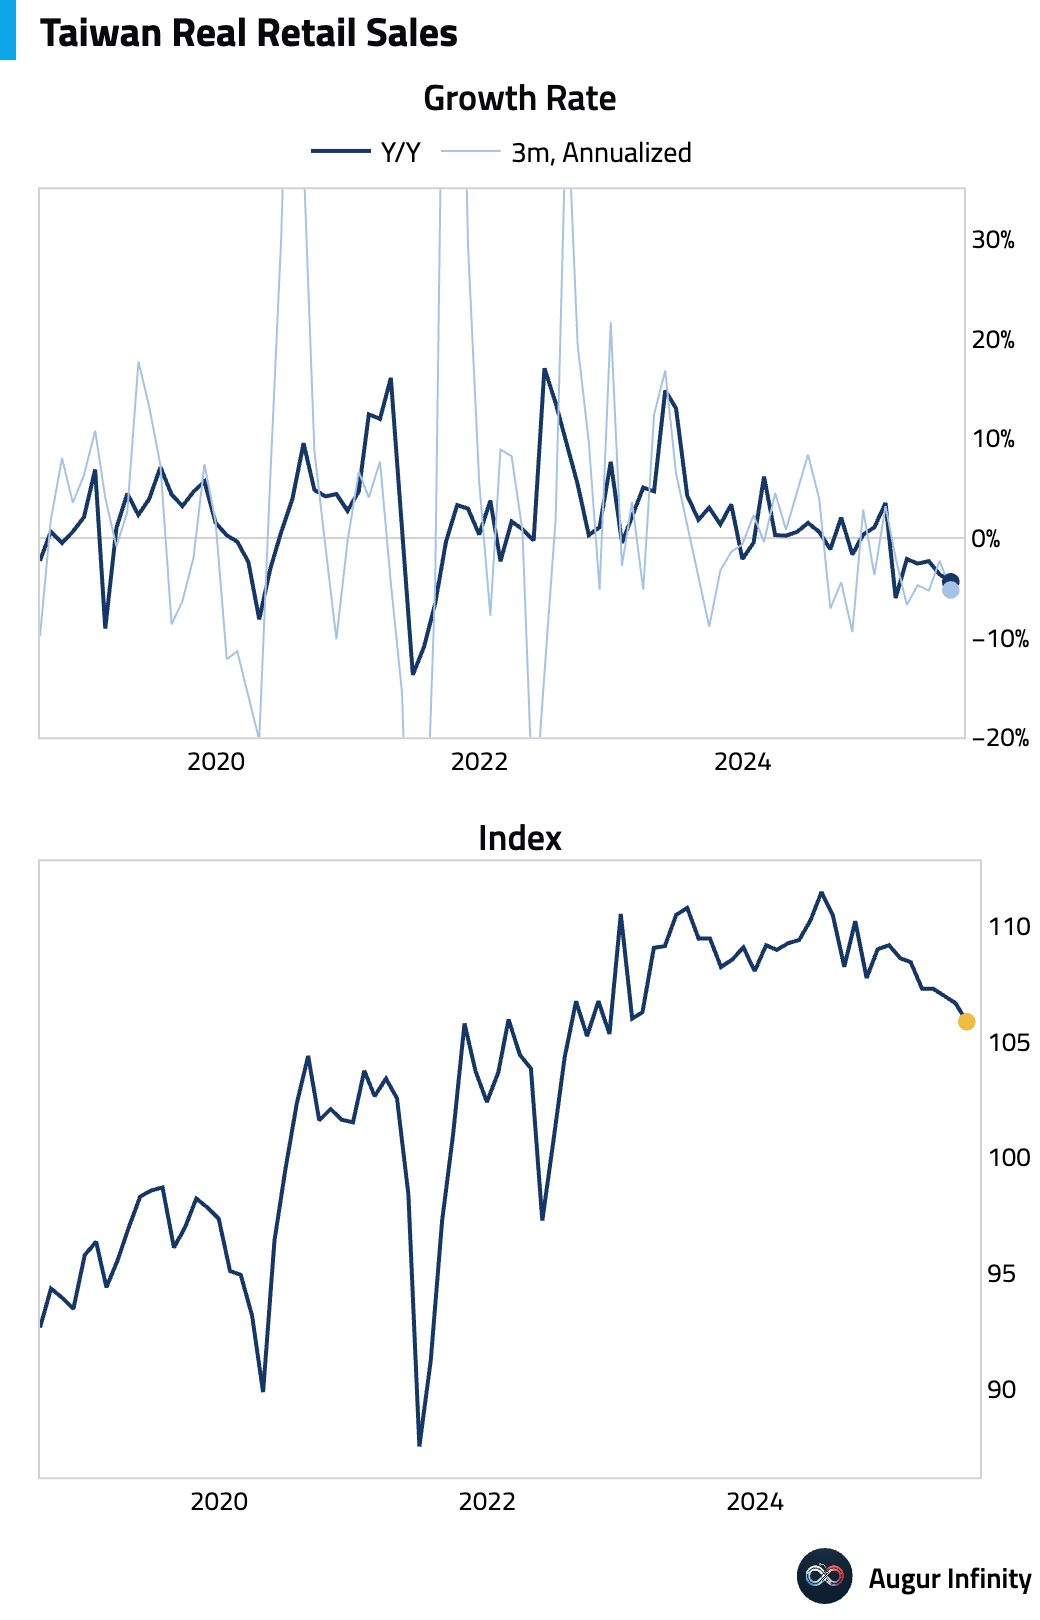
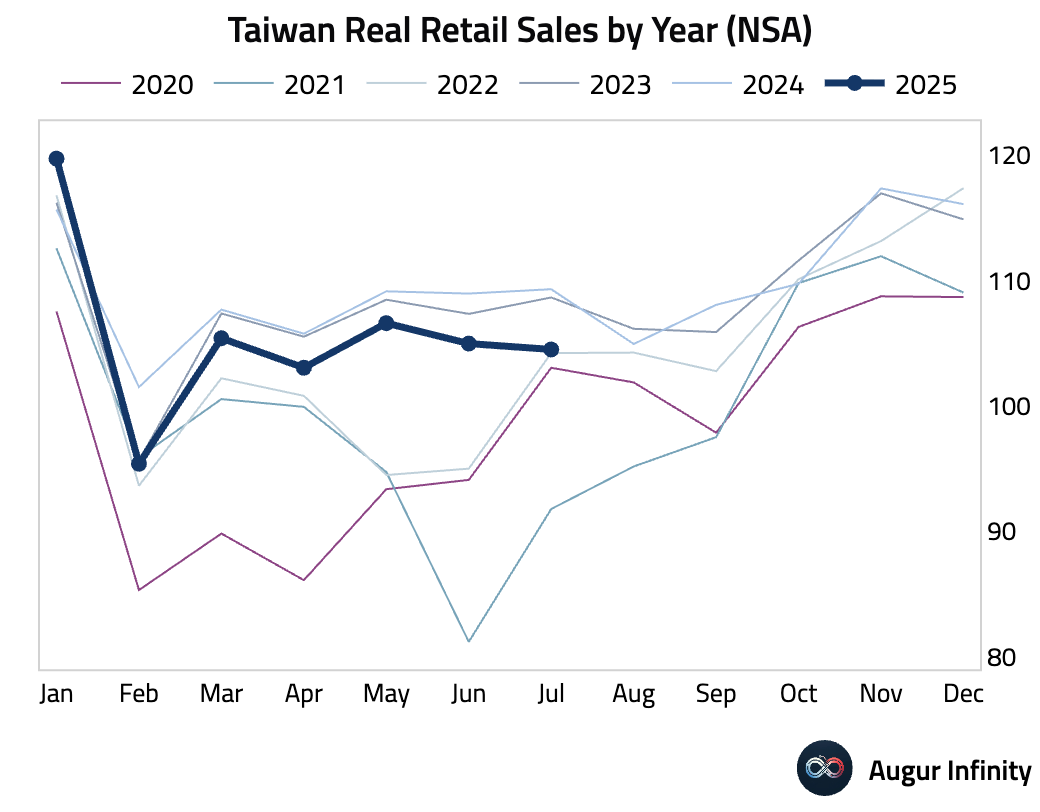
- Taiwan's retail sales contracted 3.6% Y/Y in July, worsening from a 2.9% fall in June. On a seasonally adjusted basis, sales fell 1.9% M/M, the sharpest drop since February, indicating a broader slowdown in domestic demand.
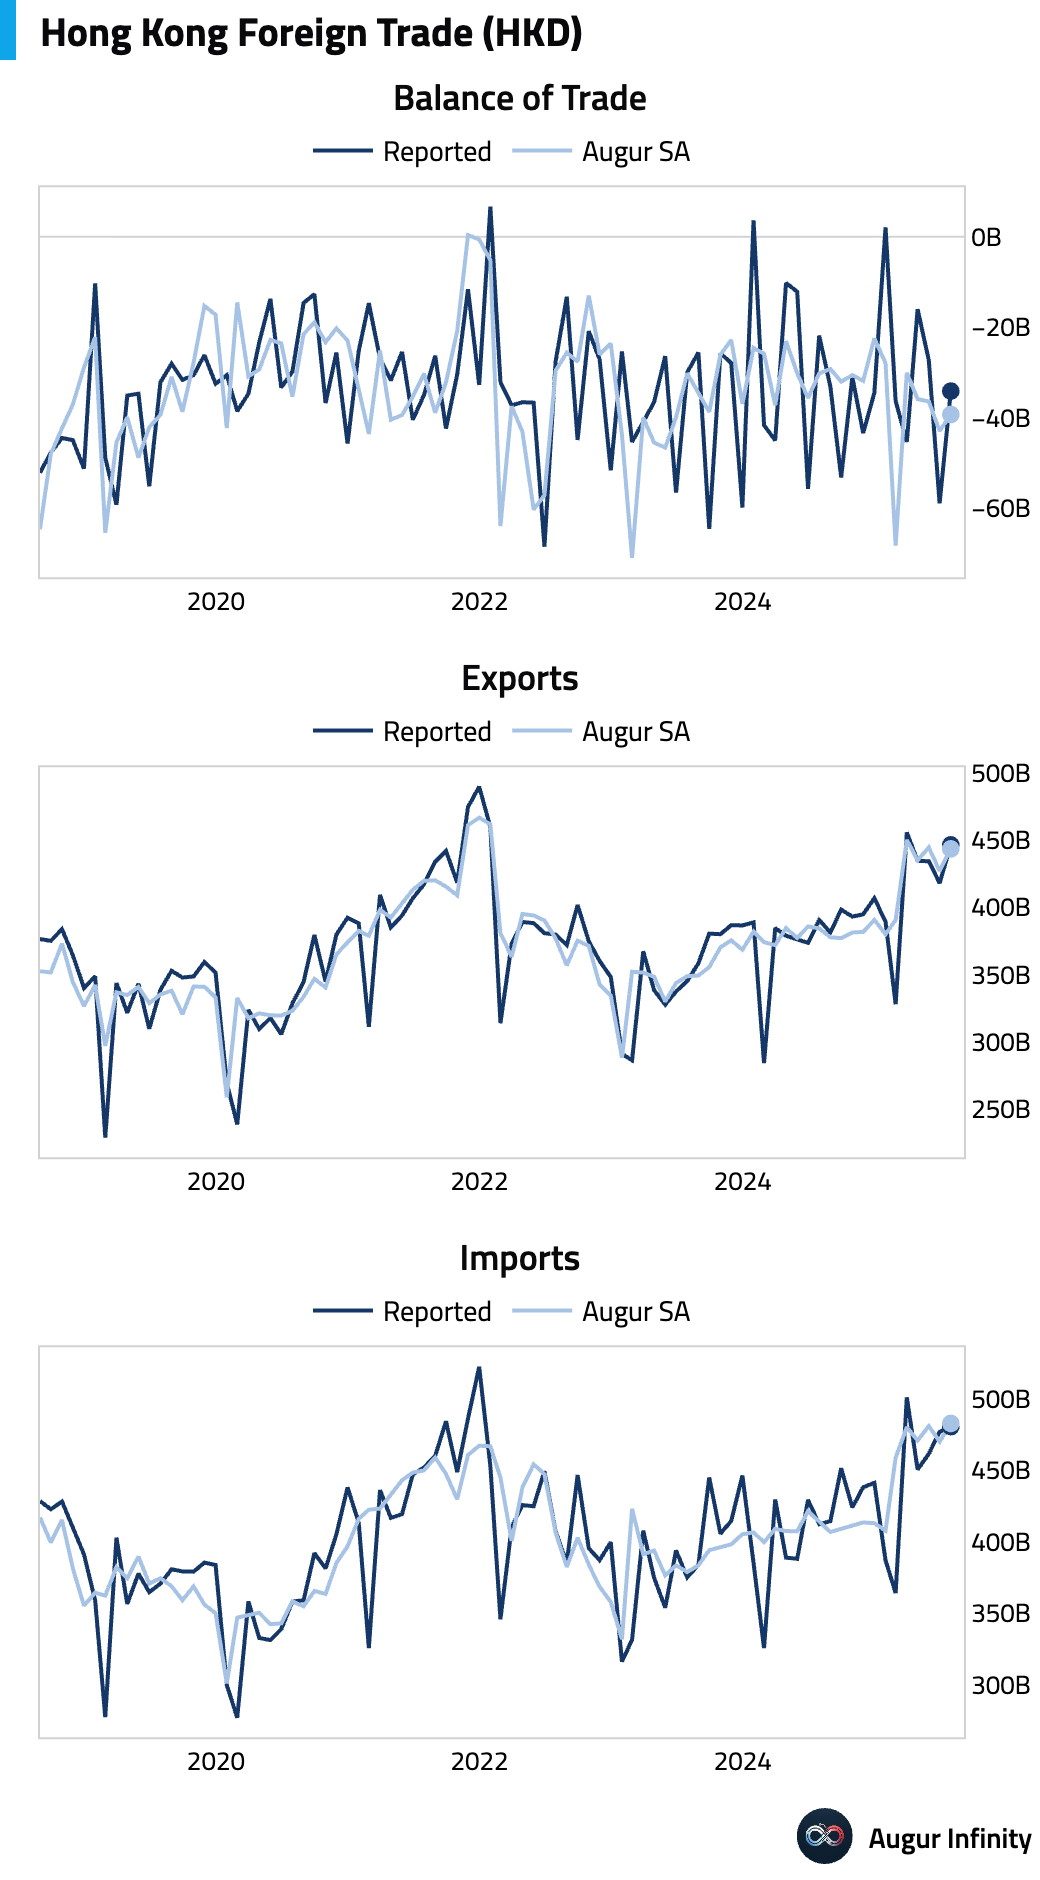
- Hong Kong’s trade deficit narrowed to HK$34.1 billion in July from HK$58.9 billion. Exports grew 14.3% Y/Y and imports increased 16.5% Y/Y, both accelerating from the prior month.
China
- China’s consumption-related indicators look weak across the board: Retail & vehicle sales fell M/M in July (SA), with real retail sales still well below pre-COVID trend; NBS Services PMI barely above 50; consumer confidence shows no sign of recovery; and finally, consumer credit growth remains weak.

Emerging Markets ex China
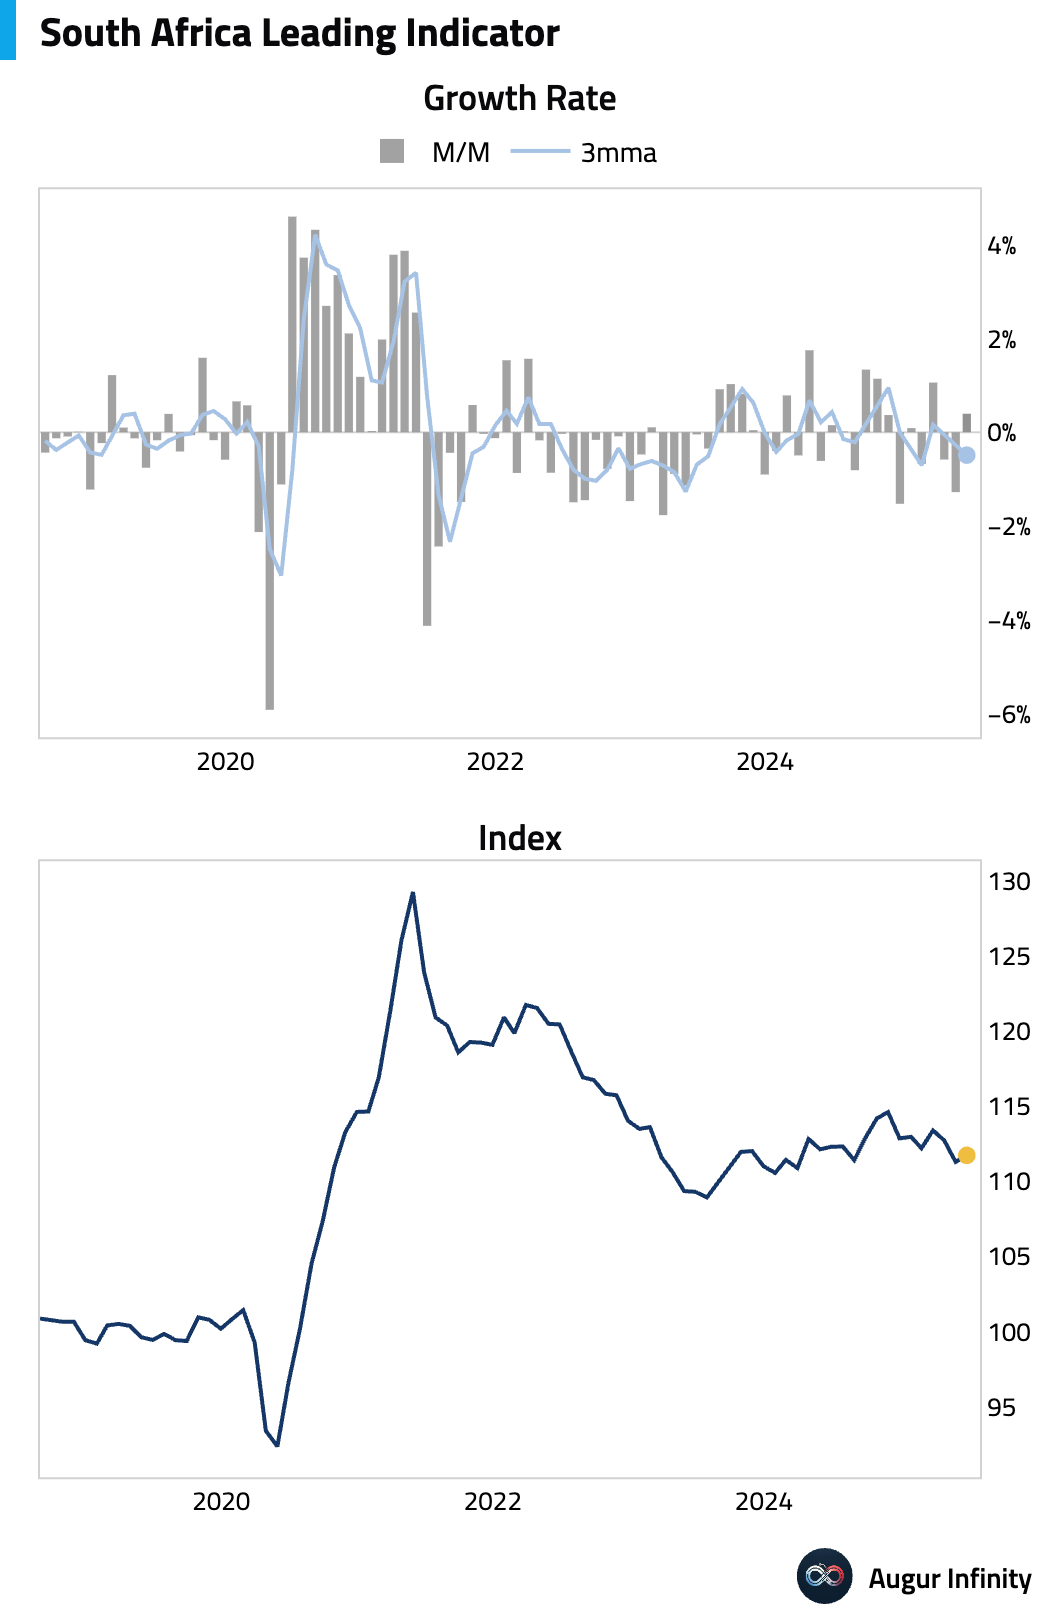
- South Africa’s leading business cycle indicator rose 0.4% M/M in June, recovering from a 1.3% decline in May.
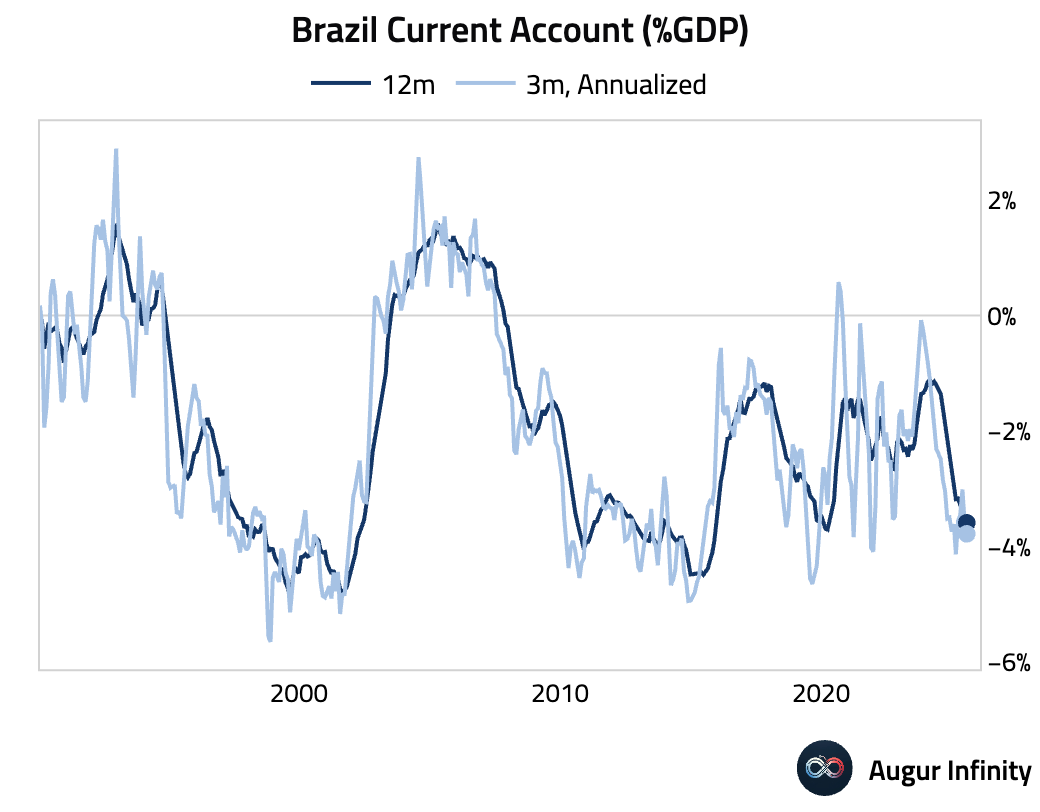
- Brazil’s current account deficit widened to US$7.1 billion in July, significantly larger than the US$5.6 billion consensus forecast. The miss was driven by a lower trade balance and higher profit remittances. On a 12-month rolling basis, the deficit deteriorated to 3.5% of GDP, signaling growing external pressure.
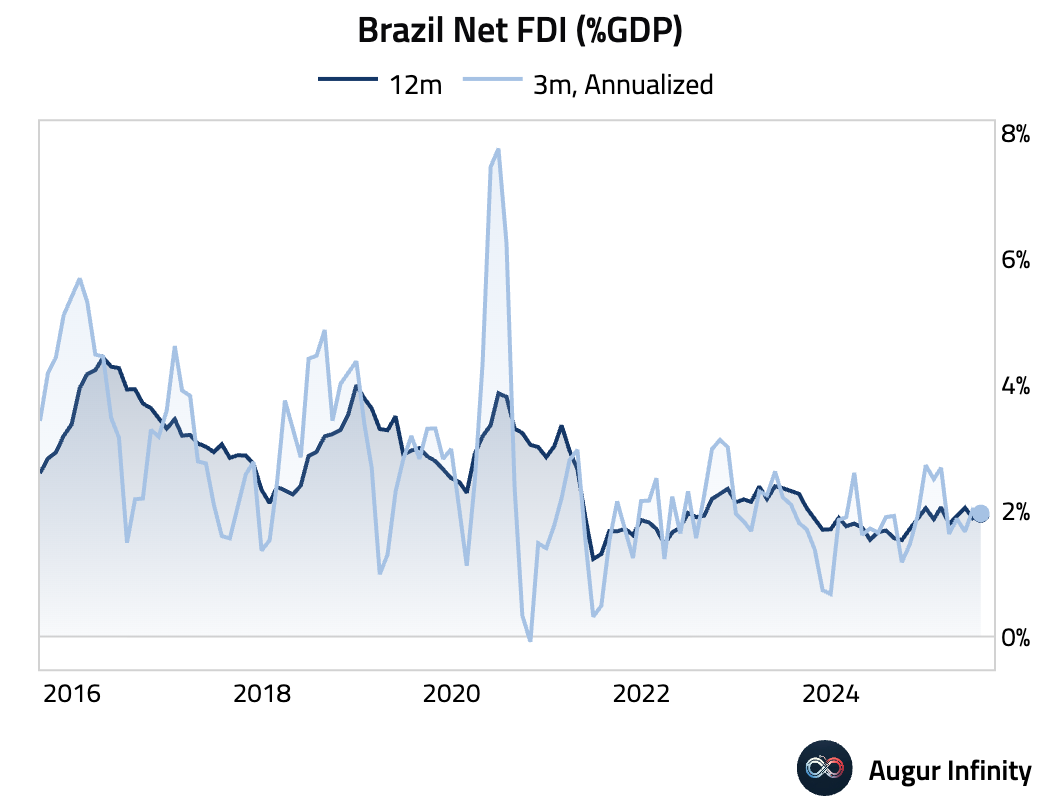
- Brazil recorded strong Foreign Direct Investment (FDI) of US$8.3 billion in July, well above the US$5.0 billion consensus. Despite the strong monthly figure, on a 12-month basis, FDI (US$68.2 billion) no longer fully covers the widening current account deficit (US$75.3 billion), a negative structural shift for Brazil’s external financing.
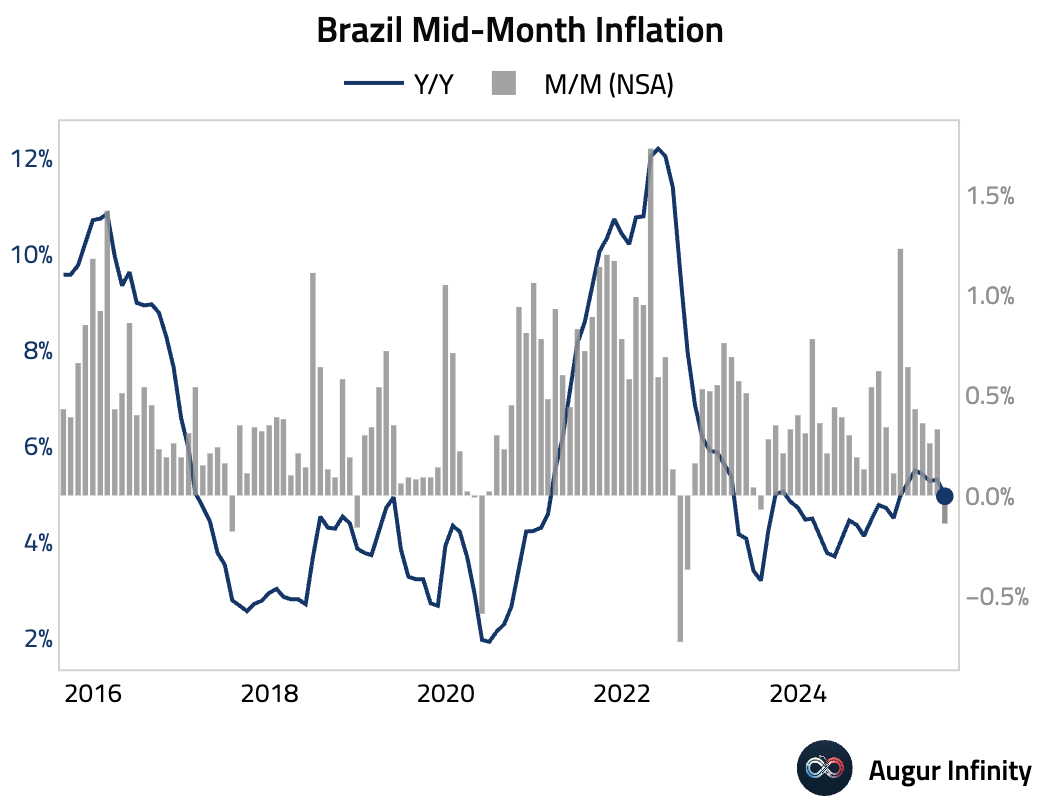
- Brazil's mid-month IPCA inflation index fell 0.14% M/M in August, compared to a 0.33% increase previously. The annual rate decelerated to 4.95% from 5.30%, though it was slightly above the 4.91% consensus.
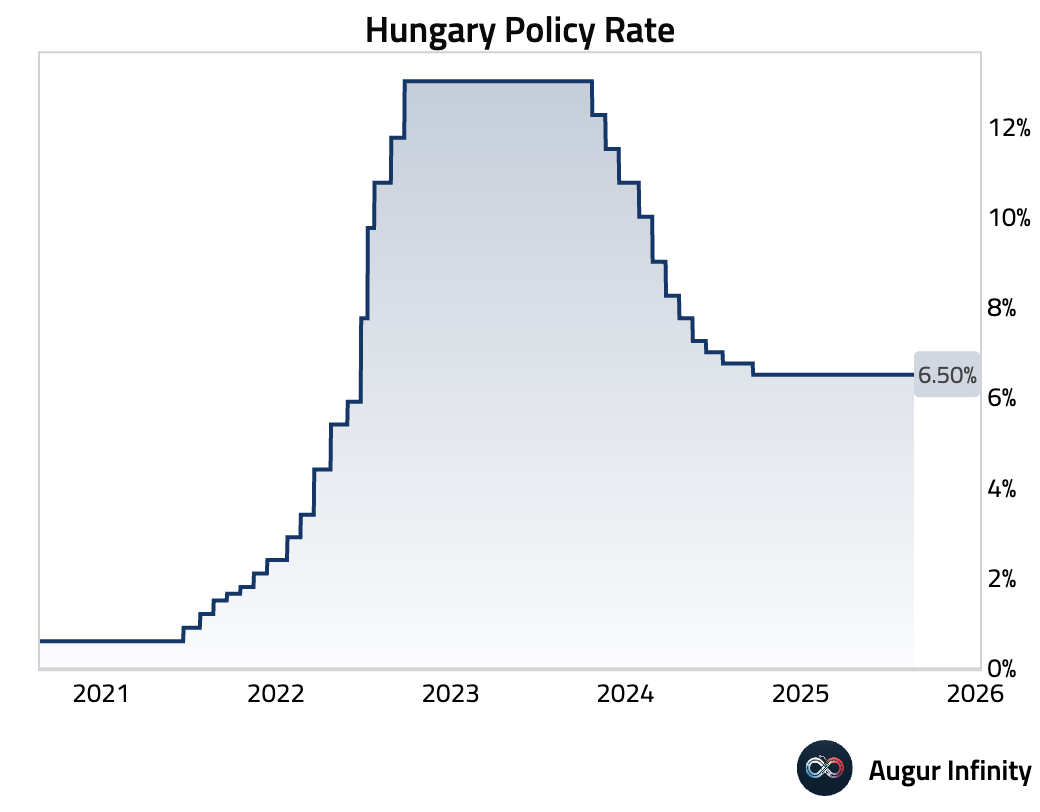
- The National Bank of Hungary held its benchmark interest rate steady at 6.5%, as expected.
Global Markets
Equities
- US equity markets edged higher on Tuesday, with both the broader market and the Nasdaq gaining 0.4%. European markets were mixed amid rising political tensions; French equities fell 0.8% while German equities rose 0.1%. In Canada, the market gained 0.8%. Emerging markets were generally weaker, with Brazil falling 0.7% and Mexico declining 0.3%.

Fixed Income
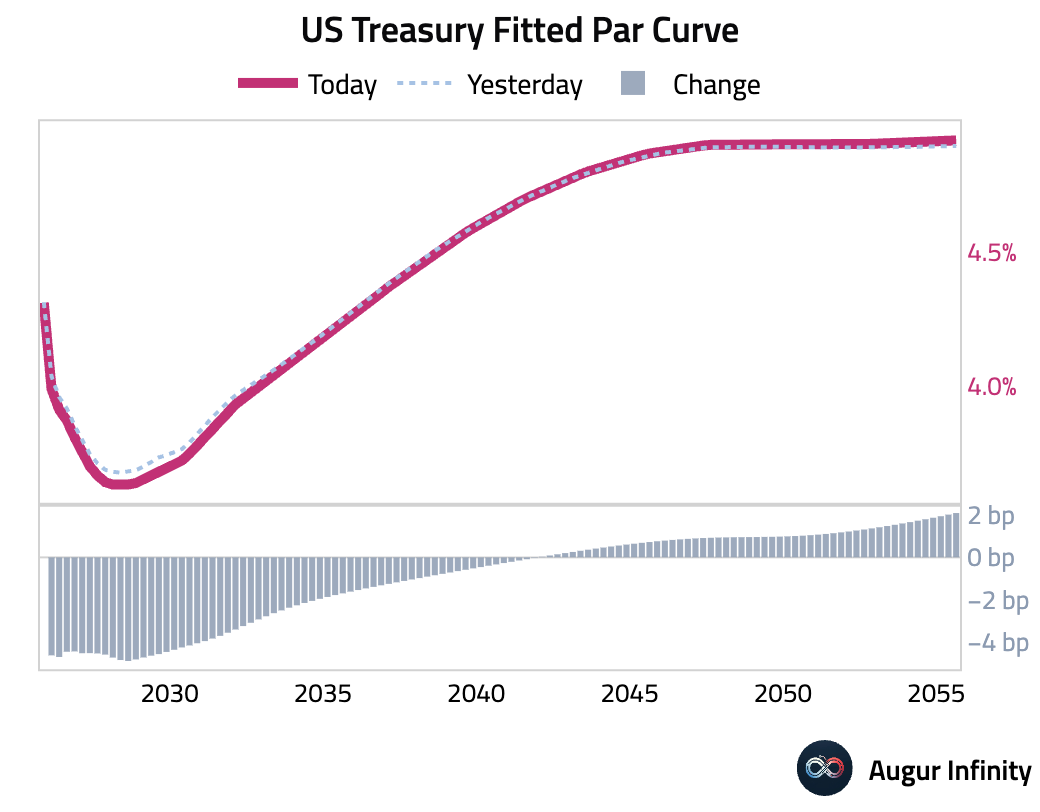
- The US Treasury curve steepened as yields fell on the short and intermediate parts of the curve while rising at the long end. The 2-year yield dropped 5.0 bps and the 10-year yield fell 2.2 bps, while the 30-year yield rose 1.4 bps. The moves came amid concerns over Federal Reserve independence. In Europe, political risk in France drove the 10-year France-Germany bond spread to its widest level since June 2024.
FX
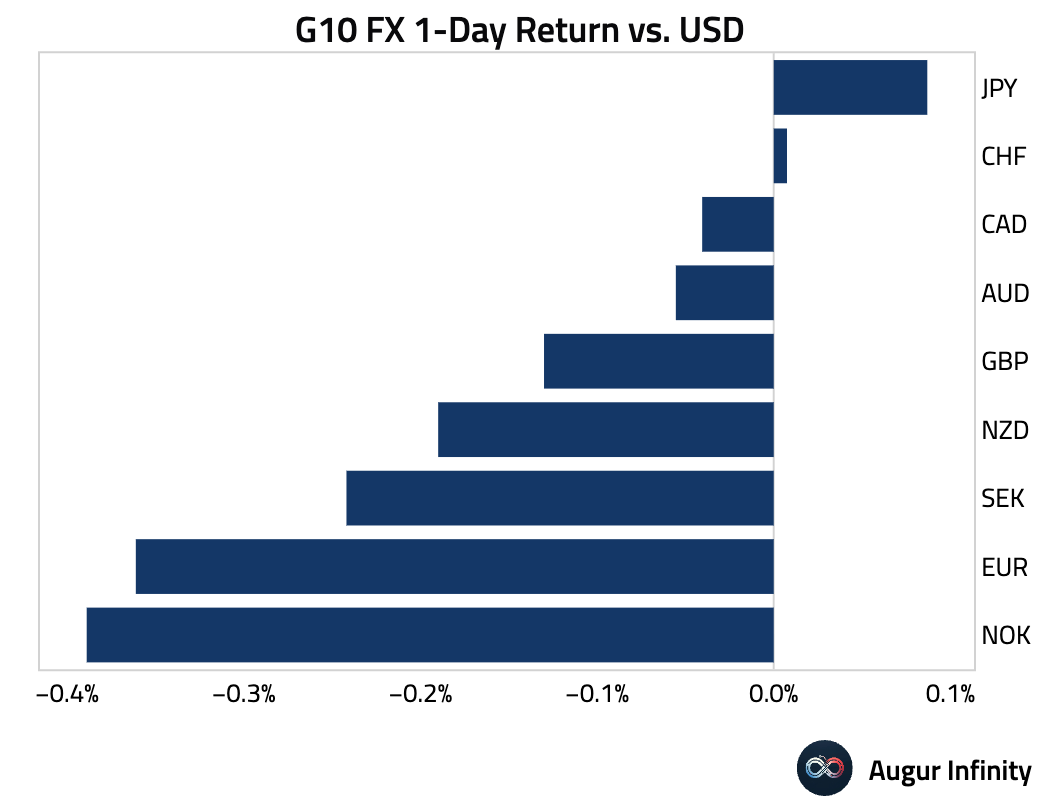
- The US dollar showed mixed performance against its G10 peers. The euro weakened by 0.4%, pressured by political uncertainty in France. The Japanese yen was a notable outperformer, gaining 0.1% against the dollar. The Australian and New Zealand dollars declined 0.1% and 0.2%, respectively.
Disclaimer
Augur Digest is an automatically generated newsletter edited by humans. It may contain inaccuracies and is not investment advice. Augur Labs LLC will not accept liability for any loss or damage as a result of your reliance on the information contained in the newsletter.

